
Agronomic Performance and Yield Stability of Elite White Guinea Yam (Dioscorea rotundata) Genotypes Grown in Multiple Environments in Nigeria

 , ,
, ,  , and
, and
Abstract
:1. Introduction
2. Materials and Methods
2.1. Plant Materials and Trial Establishment
2.2. Statistical Analysis
3. Results
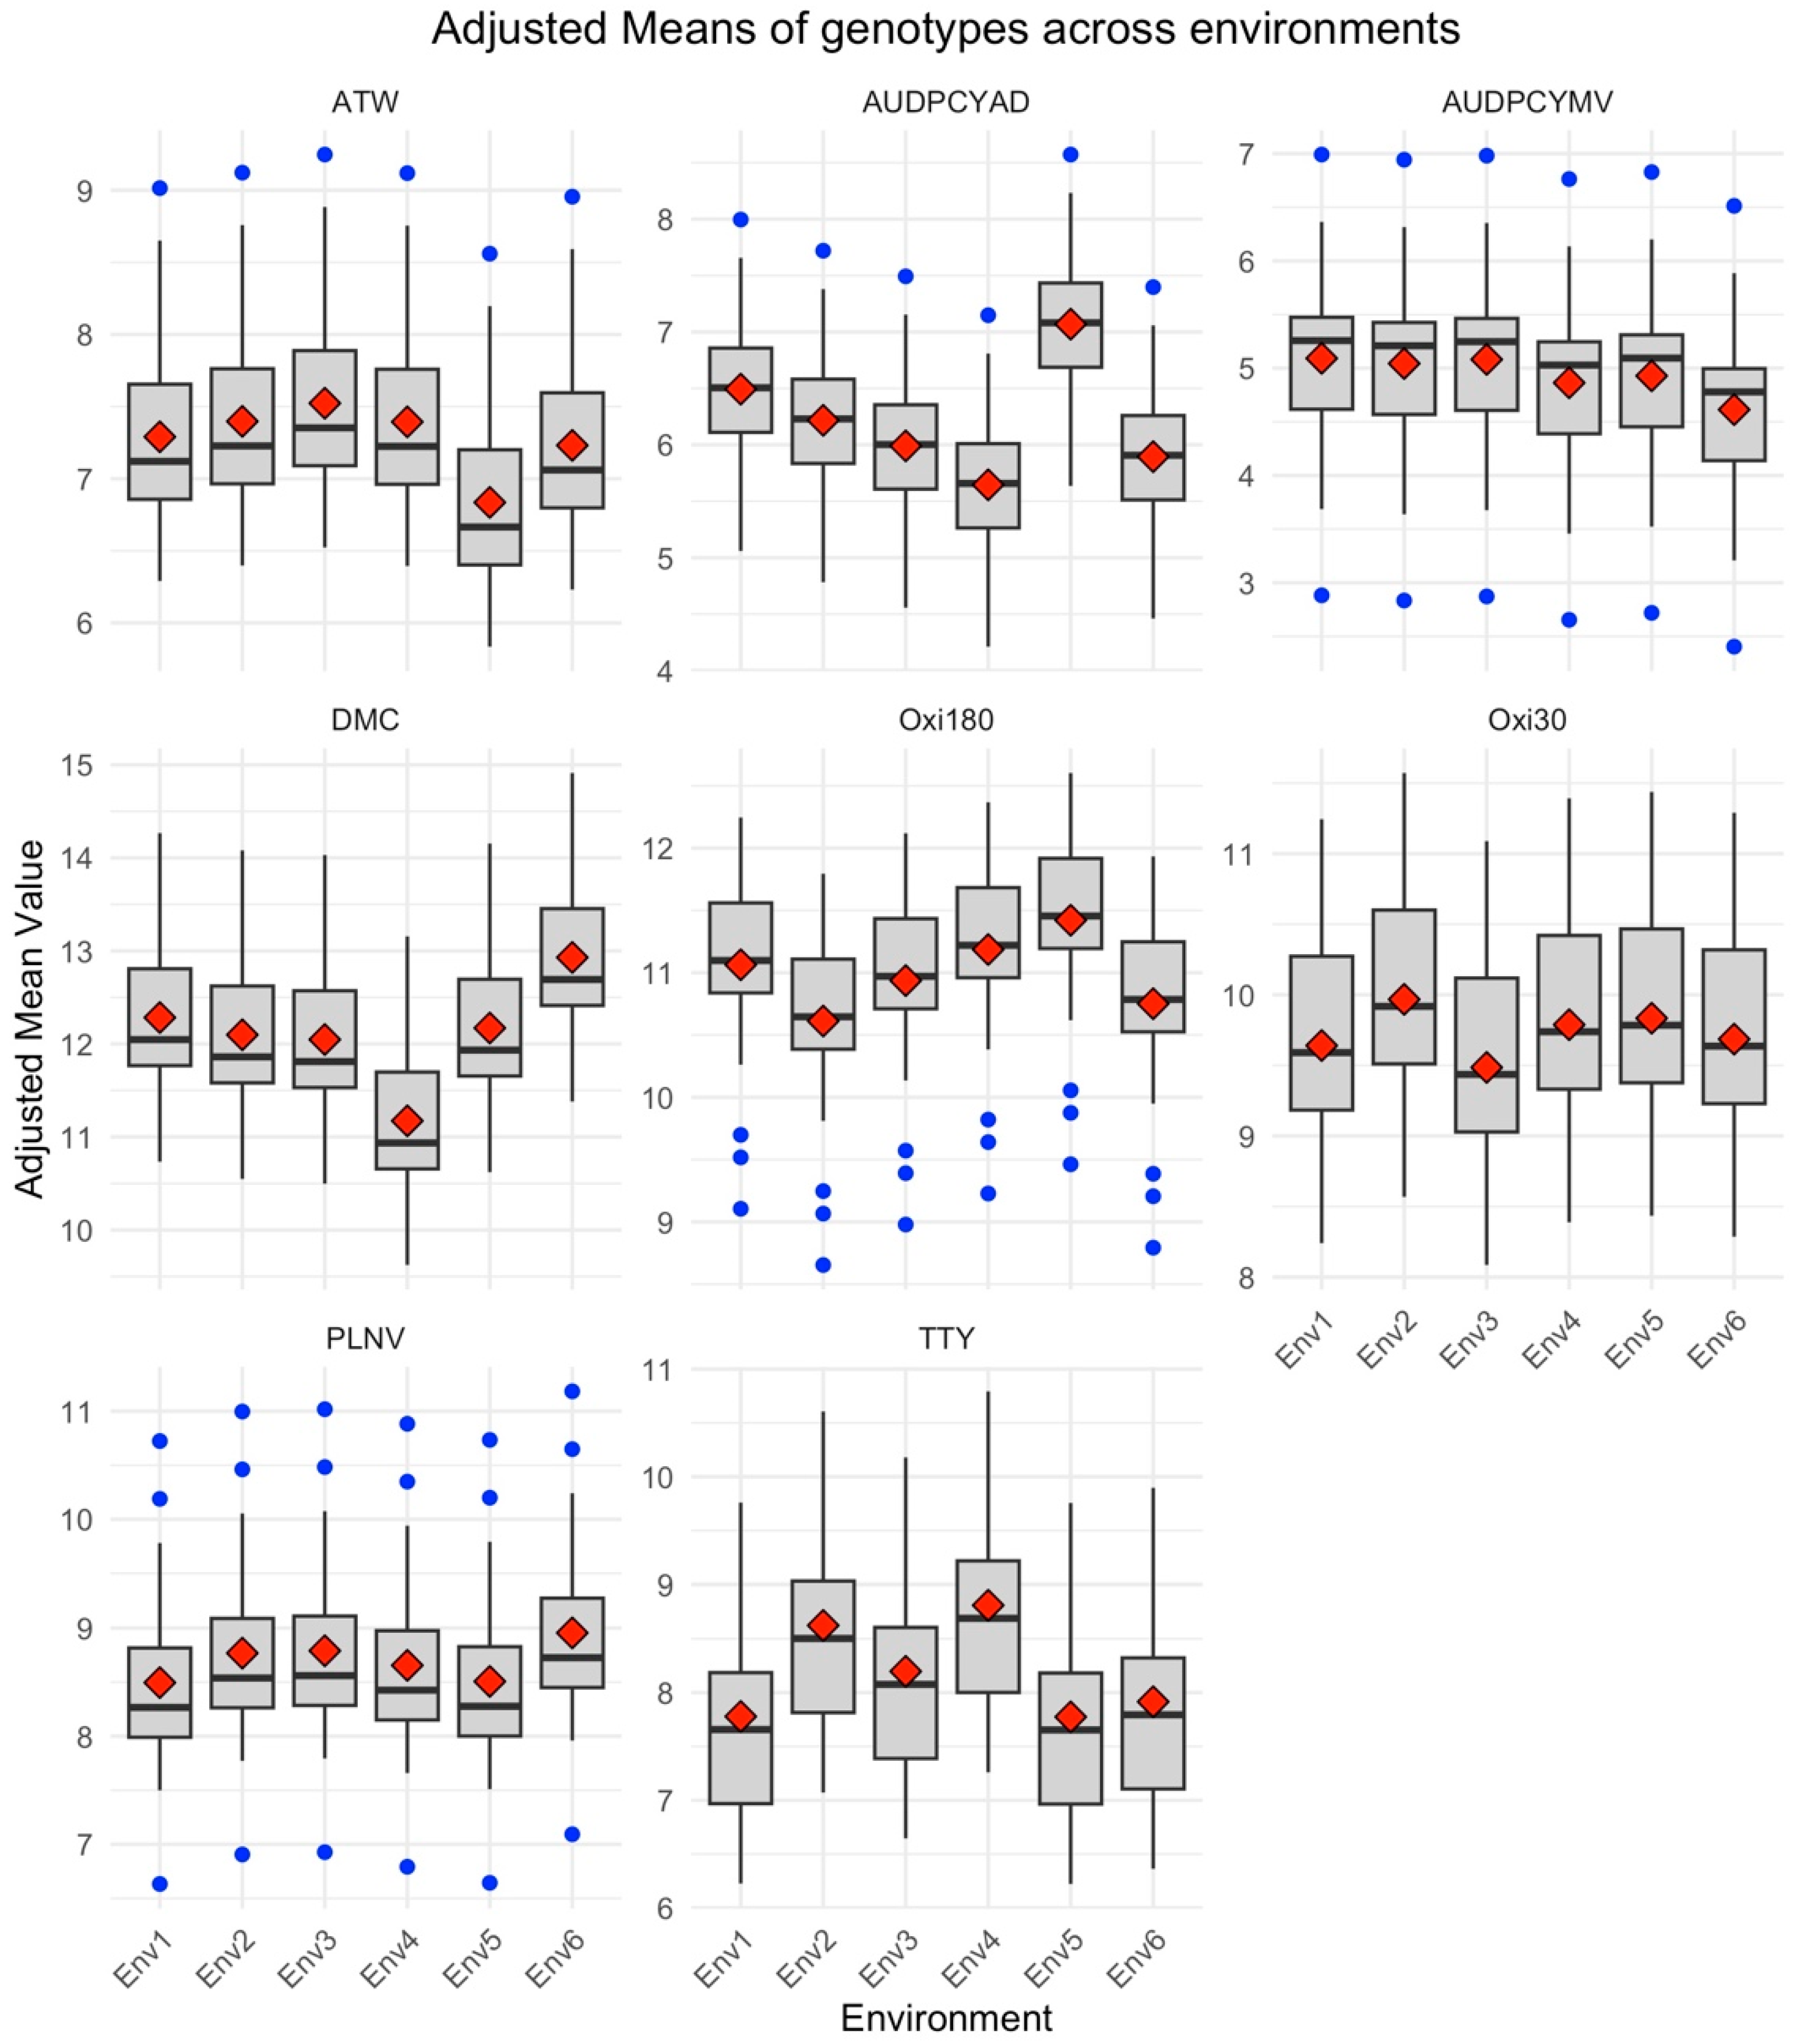
3.1. Variation in Quantitative Traits across Environments for 25 Yam Genotypes
3.2. Analysis of Variance on Quantitative Traits
3.3. Genotypic Coefficients, Phenotypic Coefficients, and Broad-Sense Heritability
3.4. Traits Importance and Contribution
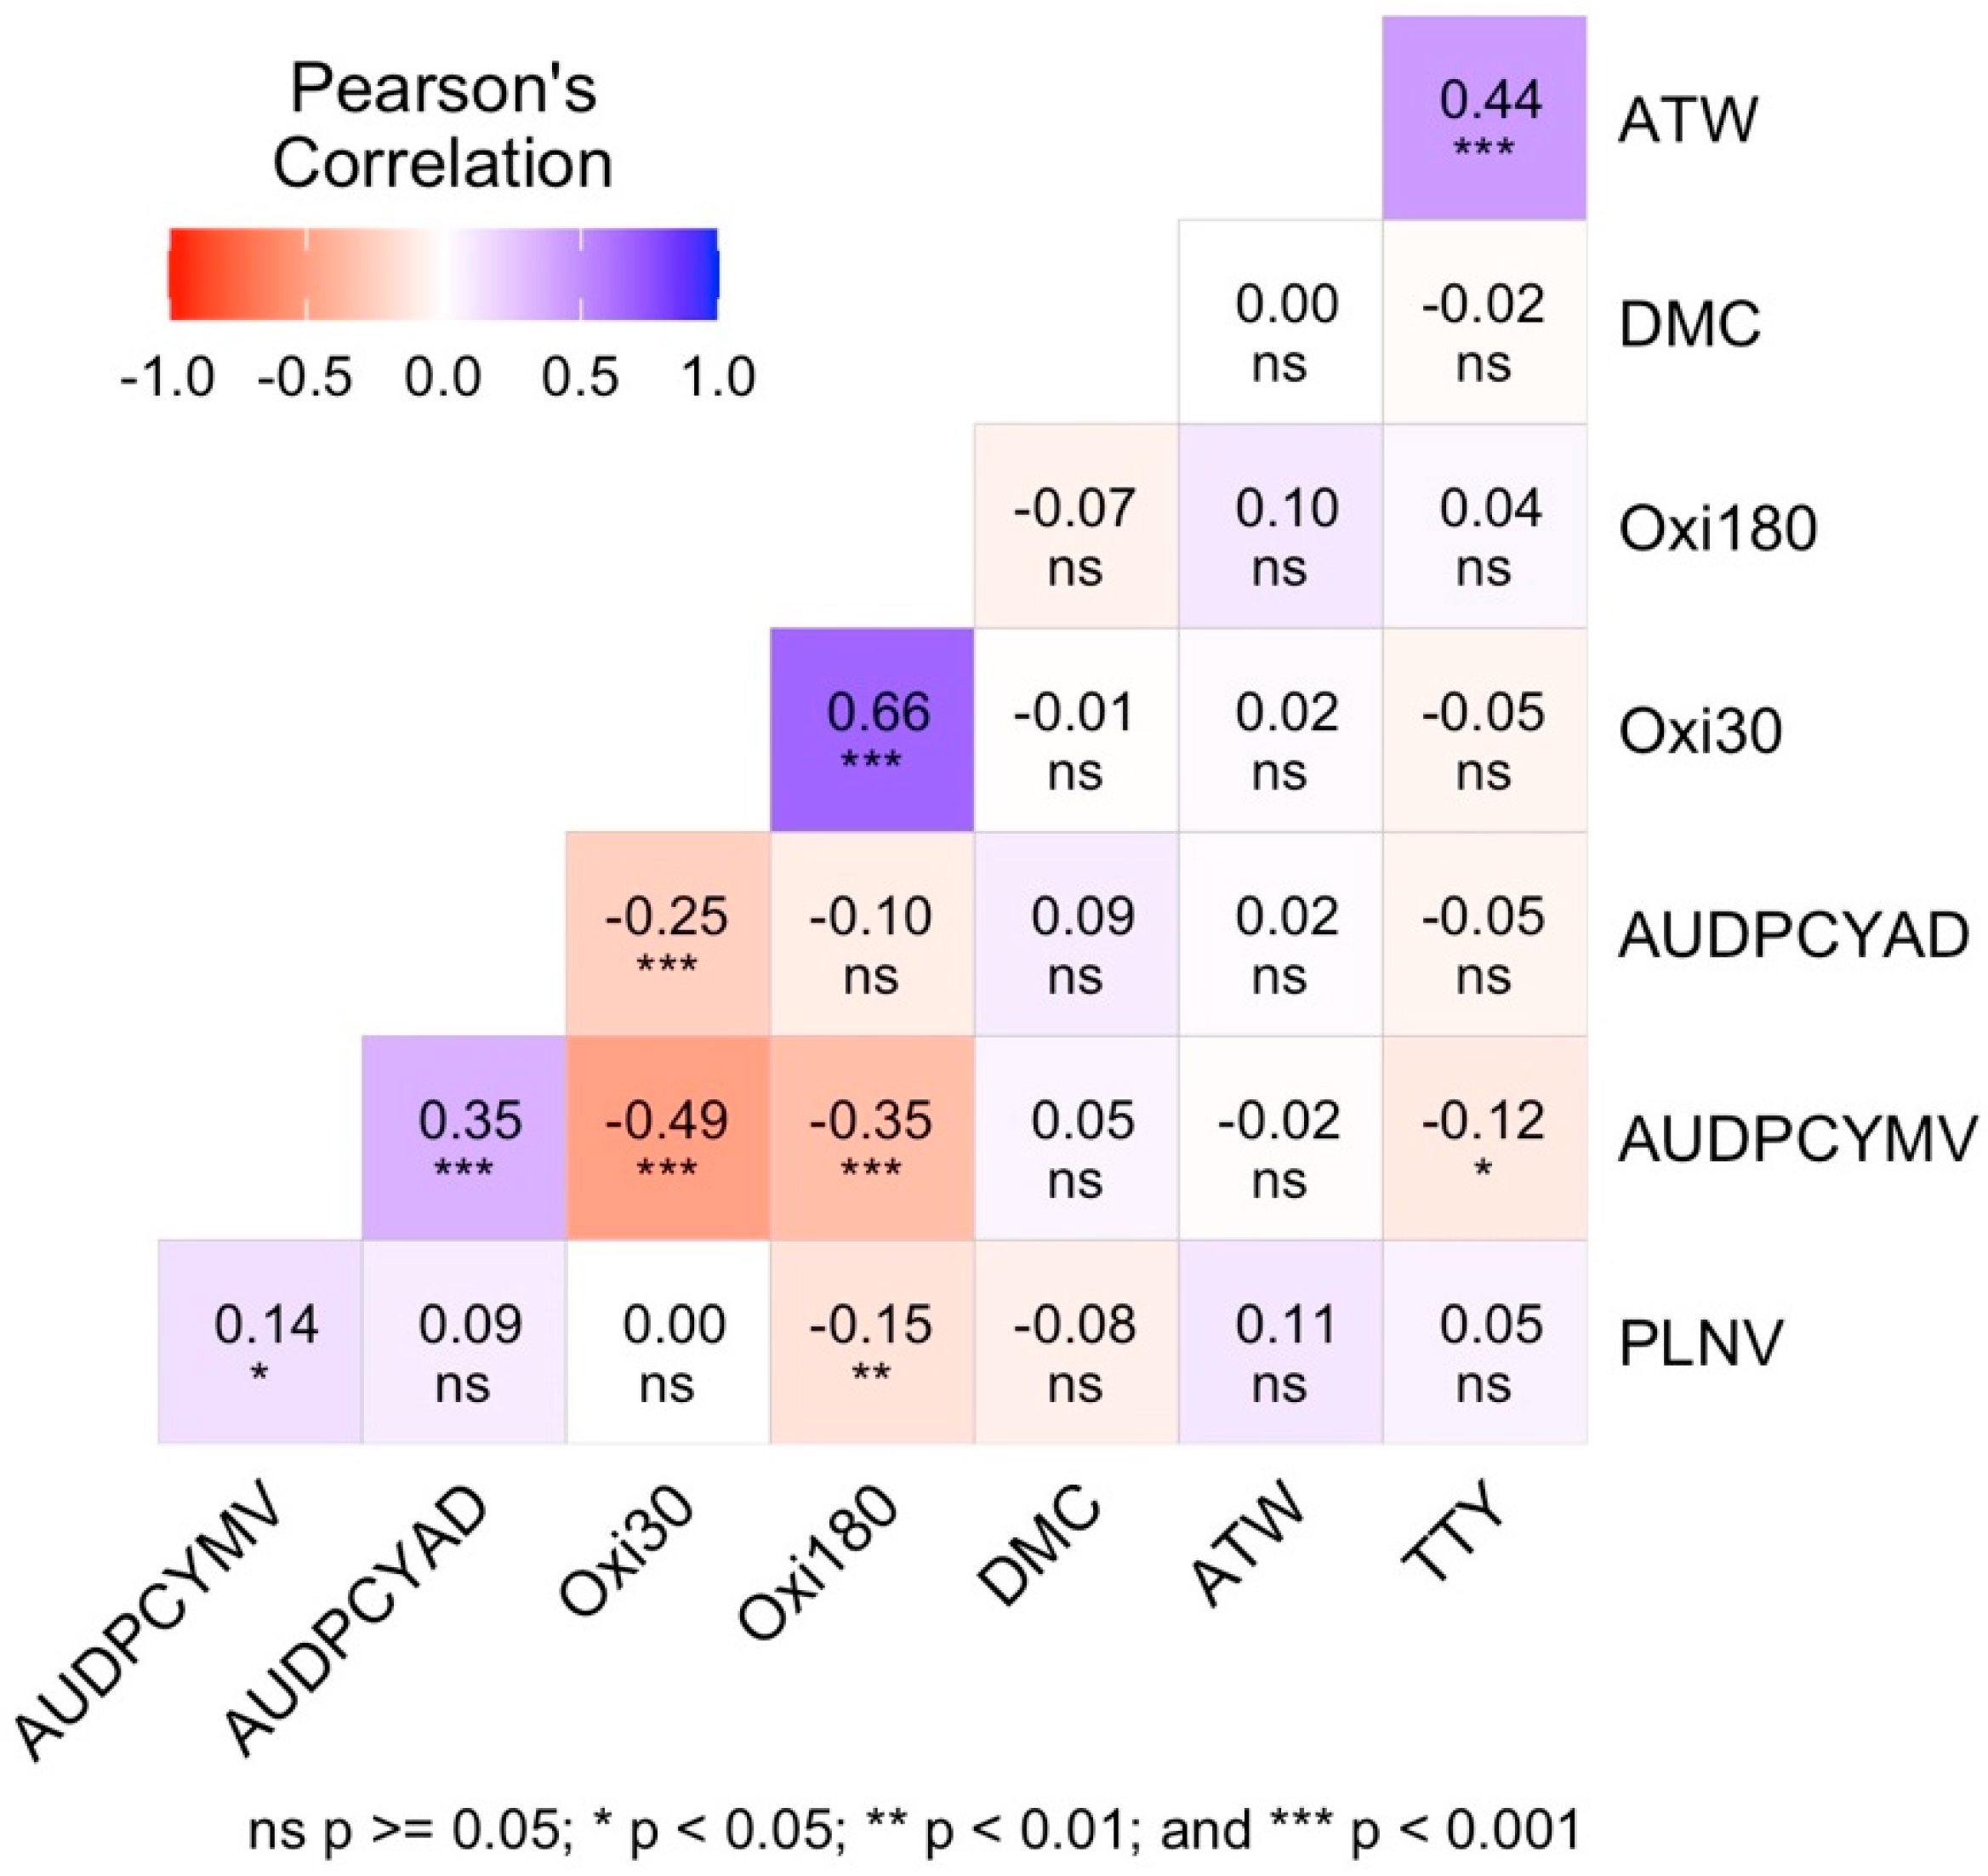
3.5. Phenotypic Correlation Coefficient between the Quantitative Traits Measured
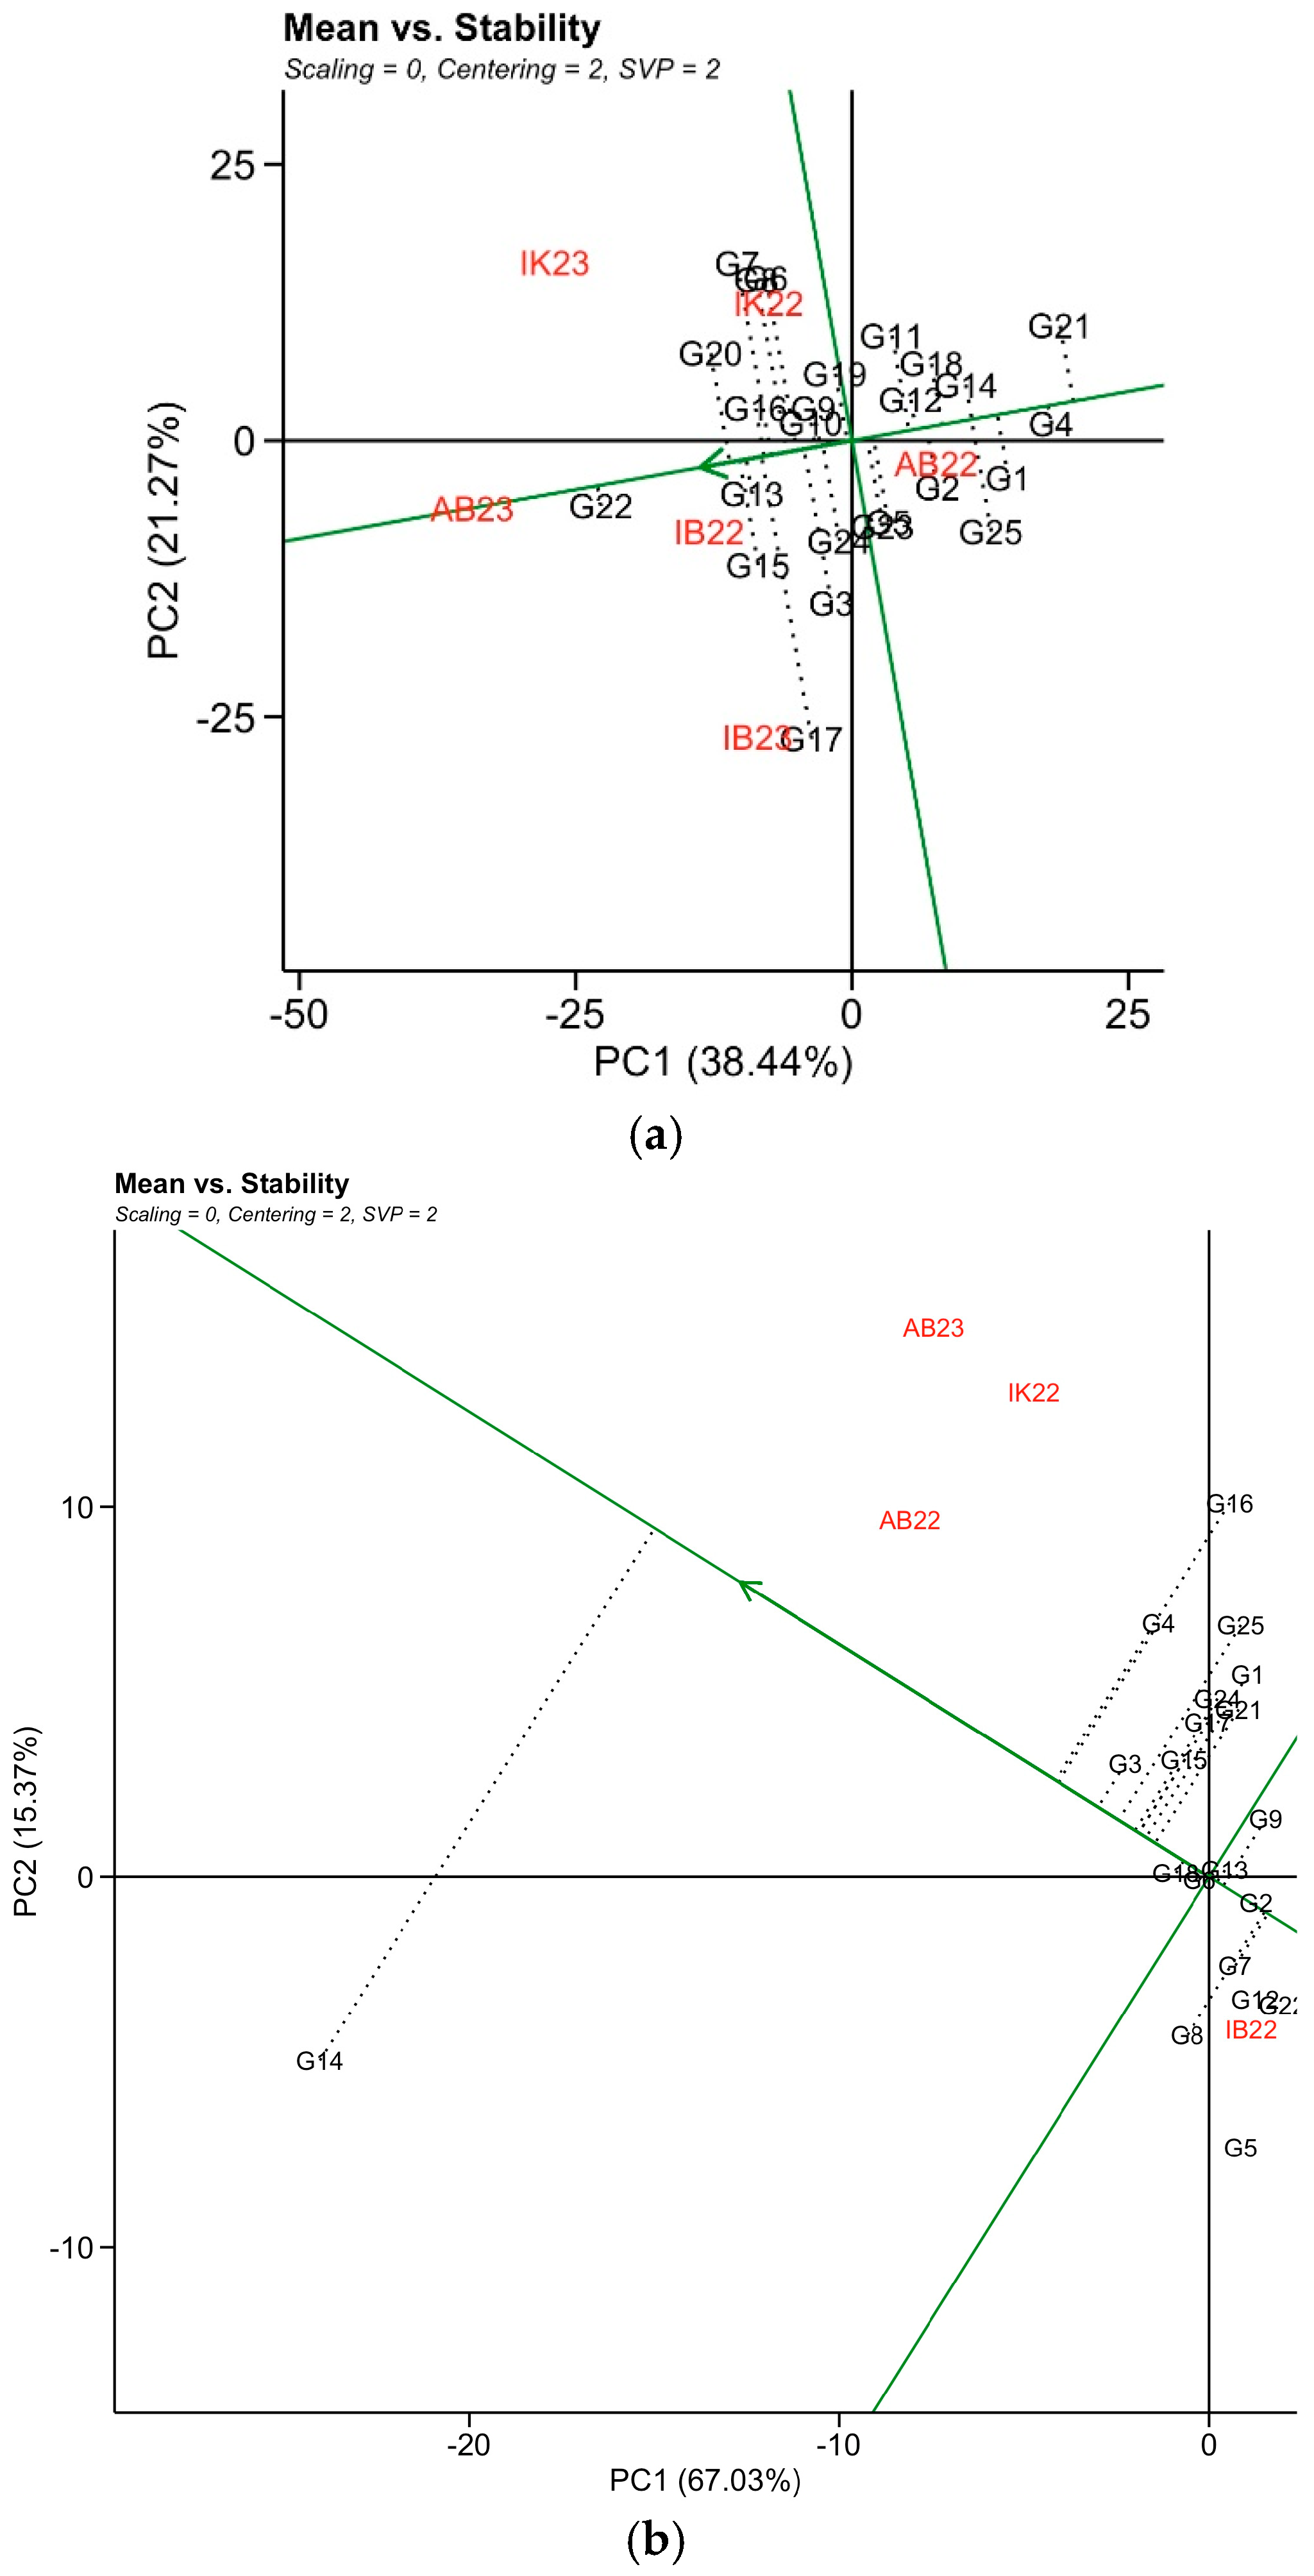
3.6. Additive Main Effect and Multiplicative Interaction of Agronomic Traits
3.7. GxE Interaction Pattern
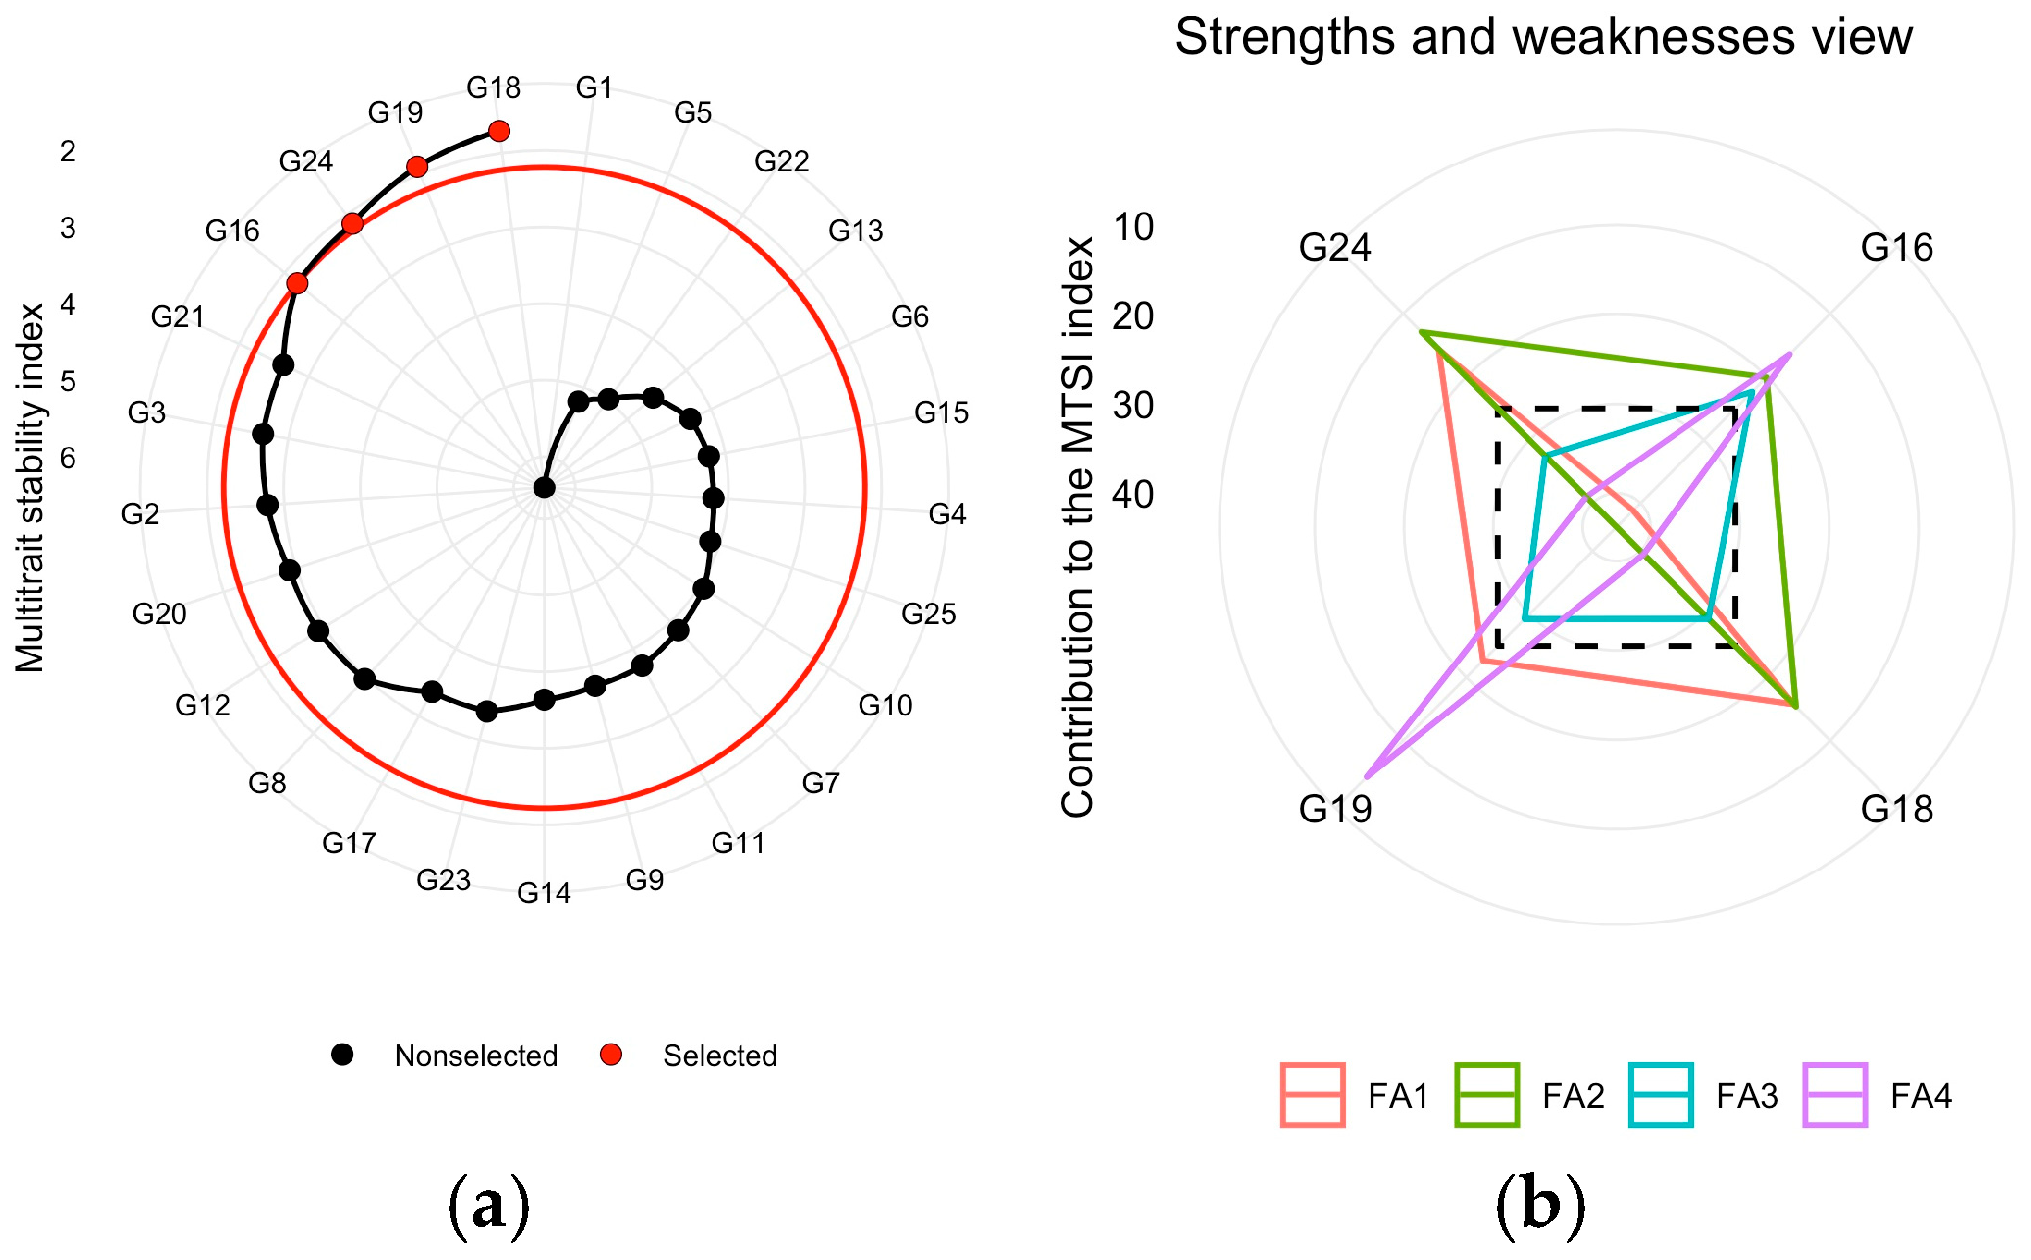
3.8. Multi-Trait Selection for Agronomic Traits
4. Discussion
5. Conclusions
Supplementary Materials
Author Contributions
Funding
Data Availability Statement
Acknowledgments
Conflicts of Interest
References
- Nayer, N.M. The Contribution of Tropical Tuber Crops Towards Food Security. J. Root Crops 2015, 40, 3–14. [Google Scholar]
- FAOSTAT Food and Agriculture Organization. Agricultural Production Statistics. 2022. Available online: https://www.fao.org/faostat/en/#data/QCL (accessed on 14 March 2024).
- Ignatius, N.A.; Hanna, R.; Pierre, N.S.; Njukeng, A.P.; Kumar, P. Yam (DIoscorea spp.) production trends in Cameroon: A review. Afr. J. Agric. Res. 2019, 14, 1097–1110. [Google Scholar] [CrossRef]
- Danquah, E.O.; Danquah, F.; Frimpong, F.; Dankwa, K.O.; Weebadde, C.; Ennin, S.; Mary, O.A.; Brempong, M.B.; Dwamena, H.; Abigail, A.; et al. Sustainable Intensification and Climate-Smart Yam Production for Improved Food Security in West Africa: A Review. Front. Agron. 2022, 4, 858114. [Google Scholar] [CrossRef]
- Darkwa, K.; Are, P.; Olasanmi, B.; Iseki, K.; Matsumoto, R.; Powell, A.; Bauchet, G.; De Koeyer, D.; Muranaka, S.; Adebola, P. Comparative assessment of genetic diversity matrices and clustering methods in white uinea yam (Dioscorea rotundata) based on morphological and molecular markers. Sci. Rep. 2020, 10, 13191. [Google Scholar] [CrossRef]
- Agre, P.; Norman, P.E.; Asiedu, R.; Asfaw, A. Identification of Quantitative Trait Nucleotides and Candidate Genes for Tuber Yield and Mosaic Virus Tolerance in an Elite Population of White Guinea Yam (Dioscorea rotundata) Using Genome-Wide Association Scan. BMC Plant Biol. 2021, 21, 552. [Google Scholar] [CrossRef]
- Adjei, E.A.; Esuma, W.; Alicai, T.; Bhattacharjee, R.; Dramadri, I.O.; Agaba, R.; Emmanuel, B.C. Phenotypic Diversity within Ugandan Yam (Dioscorea species) Germplasm Collection. Int. J Agron. 2022, 2022, 826012. [Google Scholar] [CrossRef]
- Norman, P.E.; Tongoona, P.B.; Danquah, A.; Danquah, E.Y.; Agre, P.A.; Agbona, A.; Asiedu, R.; Asfaw, A. Genetic parameter estimation and selection in advanced breeding population of white Guinea yam. J. Crop Improv. 2021, 35, 790–815. [Google Scholar] [CrossRef]
- Akinyosoye, S.T.; Adetumbi, J.A.; Amusa, O.D.; Agbeleye, A.; Anjorin, F.; Olowolafe, M.O.; Omodele, T. Bivariate analysis of the genetic variability among some accessions of African Yam Bean (Sphenostylis stenocarpa (Hochst ex A. Rich) Harms). Acta Agric. Slov. 2017, 109, 493–507. [Google Scholar] [CrossRef]
- Egesi, C.; Onyeka, T.; Asiedu, R. Environmental stability of resistance to anthracnose and virus disease of water yam (Dioscorea alata). Afr. J. Agric. Res. 2009, 4, 113–118. [Google Scholar]
- Asfaw, A.; Aderonmu, D.S.; Darkwa, K.; De Koeyer, D.; Agre, P.; Abe, A.; Olasanmi, B.; Adebola, P.; Asiedu, R. Genetic parameters, prediction, and selection in a white Guinea yam early-generation breeding population using pedigree information. Crop Sci. 2021, 61, 1038–1051. [Google Scholar] [CrossRef]
- Norman, P.; Tongoona, P.; Danquah, A.; Danquah, E.; Agre, P.; Agbona, A.; Asiedu, R.; Asfaw, A. Genetic Analysis of Agronomic and Quality Traits from Multi-Location white Yam Trials using Mixed Model with Genomic Relationship Matrix. Glob. J. Bot. Sci. 2022, 10, 8–22. [Google Scholar] [CrossRef]
- Asfaw, A. Standard Operating Protocol for Yam Variety Performance Evaluation Trial; IITA: Ibadan, Nigeria, 2016. [Google Scholar]
- Campbell, C.I.; Madden, L.V. Introduction to Plant Disease Epidemiology; John Wiley and Sons: New York, NY, USA, 1990. [Google Scholar]
- R Core Team. An Introduction to R: A Programming Environment for Data Analysis and Graphics Version 3.6.1; R Foundation for Statistical Computing: Vienna, Austria, 2022. [Google Scholar]
- Olivoto, T.; Lúcio, A.D. metan: An R package for multi-environment trial analysis. Methods Ecol. Evol. 2020, 11, 783–789. [Google Scholar] [CrossRef]
- Lenth, R. emmeans: Estimated Marginal Means, Aka Least-Squares Means, R package version 1.10.4.900001; 2024. Available online: https://rvlenth.github.io/emmeans/ (accessed on 9 September 2024).
- Patterson, H.D.; Williams, E.R. A new class of resolvable incomplete block design. Biometrica 1976, 63, 83–92. [Google Scholar] [CrossRef]
- Resende, M.D.V. Genética Biométrica e Estatística no Melhoramento de Plantas Perenes; Embrapa: Brasília, Brazil, 2002. [Google Scholar]
- Robinson, H.F.; Comstock, R.E.; Harvey, P.H. Estimates of heritability and the degree of dominance in corn. Agron. J. 1955, 41, 353–359. [Google Scholar] [CrossRef]
- Gauch, H.G. Statistical Analysis of Regional Yield Trials: AMMI Analysis of Factorial Designs; Elsevier: Amsterdam, The Netherlands, 1992. [Google Scholar]
- Hagos, H.G.; Abay, F. Ammi and gge biplot analysis of bread wheat genotypes in the northern part of Ethiopia. J. Plant Breed. Genet. 2013, 1, 12–18. [Google Scholar]
- Yan, W.; Hunt, L.A. Interpretation of genotype × environment interaction for winter wheat yield in Ontario. Crop Sci. J. 2001, 41, 19–25. [Google Scholar] [CrossRef]
- Olivoto, T.; Lúcio, A.D.; da Silva, J.A.; Marchioro, V.S.; de Souza, V.Q.; Jost, E. Mean performance and stability in multi-environment trials II: Selection based on multiple traits. Agron. J. 2019, 111, 2961–2969. [Google Scholar] [CrossRef]
- Sellami, M.H.; Pulvento, C.; Lavini, A. Selection of suitable genotypes of lentil (Lens culinaris medik.) under rainfed conditions in south Italy using multi-trait stability index (MTSI). Agron. J. 2021, 11, 1807. [Google Scholar] [CrossRef]
- Frashadfar, E.; Safari, H.; Jamshidi, B. GGE biplot analysis of adaptation in wheat substitution lines. Int. J. Agric. Crop Sci. 2012, 4, 877–881. [Google Scholar]
- Chukwu, V.A.; Osuafor, O.O.; Ukwuaba, I.; Enyigwe, J.; Chinenye, C.P. Farmers’ Adaptation Strategies to the Effect of Climate Variation on Yam Production in Ebonyi State, Nigeria. J. Agric. Crop 2023, 9, 240–249. [Google Scholar]
- Oumarou, S.; Massaoudou, H.; Mahamadou, S.; Baboucarr, M.; Eric, D.; Kwadwo, O. Environmental Impact on Early Generations Selection and Its Implications on Breeding Strategies in Rice. Int. J. Adv. Res. Bot. 2017, 3, 1–7. [Google Scholar] [CrossRef]
- Mitchell, R.M.; Wright, J.; Gregory, M.A. Intraspecific variability improves environmental matching, but does not increase ecological breadth along a wet to dry ecotone. Oikos 2016, 126, 988–995. [Google Scholar] [CrossRef]
- Cynthia, I.A.; Siraj, I.K.; Bussie, M.; Saviour, J.E.; Isaac, A.; Samuel, K.O.; Ismail, Y.R. Exploring genetic variability, heritability, and trait correlations in gari and eba quality from diverse cassava varieties in Nigeria. J. Sci. Food Agric. 2023, 104, 4860–4871. [Google Scholar] [CrossRef]
- Adewumi, A.S.; Agree, P.A.; Asare, P.A.; Adu, M.O.; Taah, J.J.; Mondo, J.M.; Akaba, S. Exploring the bush yam (Dioscorea praehensilis Benth) as a source of agronomic and qualitytrait genes in white guinea yam (Dioscores rotundata. Poir) breeding. Agron. J. 2021, 12, 55. [Google Scholar] [CrossRef]
- Nduwumuremyi, A.; Melis, R.; Shanahan, P.; Peodore, A. Interaction of genotype and environment effects on important traits of cassava (Manihot esculenta Crantz). J. Crop Sci. 2017, 5, 373–386. [Google Scholar] [CrossRef]
- Emmanuel, A.A.; Williams, E.; Titus, A.; Emmanuel, B.C.; Richard, E.; Isaac, O.D.; Thomas, L.O. Genotype-by-Environment Interaction of Yam (Dioscorea species) for Yam Mosaic Virus Resistance, Dry Matter Content and Yield in Uganda. J. Agron. 2022, 12, 1984. [Google Scholar] [CrossRef]
- Bandana, P.; Arup, K.M.; Sangram, K.M.; Sangram, K.L.; Debabrata, P. Genetic variability and inter species relationship between wild and cultivated yams (Dioscorea spp.) from Koraput, India based on molecular and morphological markers. Physiol. Mol. Biol. Plants 2019, 25, 1225–1233. [Google Scholar]
- Yan, W.; Frégeau-Reid, J. Breeding Line Selection Based on Multiple Traits. Crop Sci. 2008, 48, 417–423. [Google Scholar] [CrossRef]
- Norman, P.E.; Tongoona, P.; Shanahan, P.E. Diversity of the morphological traits of yam (Dioscorea spp.) genotypes from Sierra Leone. J. Appl. Biosci. 2011, 45, 3045–3058. [Google Scholar]
- Anokye, M.; Tetteh, J.P.; Otoo, E. Morphological characterization of some water yam (Dioscorea alata L.) germplasm in Ghana. J. Agric. Sci. Tech. 2014, 4, 518–532. [Google Scholar]
- Agre, P.; Asibe, F.; Darkwa, K.; Darkwa, K.; Edemodu, A.; Bauchet, G.; Asiedu, R.; Adebola, P.; Asfaw, A. Phenotypic and molecular assessment of genetic structure and diversity in a panel of winged yam (Dioscorea alata) clones and cultivars. Sci. Rep. Nat. Res. 2019, 9, 18221. [Google Scholar] [CrossRef] [PubMed]
- Aurelio, S.; Giovanni, M.; Anita, L. Dissecting the genotype x environment interaction for potato tuber yield and components. J. Agron. 2023, 13, 101. [Google Scholar] [CrossRef]
- Kılıç, H. Additive main effects and multiplicative interactions (AMMI) analysis of grain yield in barley genotypes across environments. J. Agric. Sci. 2014, 20, 337–344. [Google Scholar] [CrossRef]
- Vincent, I.E.; Grace, O.O.; Timothy, O.O.; Idowu, A.O. AMMI and GGE biplot analyses of Bambara groundnut [Vigna subterranea (L.) Verdc.] for agronomic performances under three environmental conditions. Front. Plant Sci. 2023, 13, 997429. [Google Scholar]
- Natasa, L.; Vera, P.; Marko, K.; Milos, P.; Masa, B.; Kosta, G.; Milan, D.; Milica, B.; Vladimir, C. Multivariate interaction analysis of Zea mays L. Genotypes Growth productivity in Different Environmental Conditions. J. Agron. 2023, 12, 2165. [Google Scholar] [CrossRef]
- Otoo, E.; Osei, K.; Adomako, J.; Agyeman, A.; Amele, A.; DeKoeyer, D.; Adebola, P.; Asiedu, R. GGE biplot analysis of 12 Dioscorea rotundata genotypes in Ghana. J. Agric. Sci. 2018, 10, 249–263. [Google Scholar] [CrossRef]
- Joseph, A.; Kwabena, A.; Emmanuel, B.C.; Freda, A.A.; Alhassan, S. Assessment of tuber yield stability and adaptability of some elite yam genotypes in the guinea savannah ecology of northern ghana. Int. J. Agron. 2021, 2021, 6615636. [Google Scholar] [CrossRef]
- Sharifi, P.; Abbasian, A.; Mohaddesi, A. Evaluation the mean performance and stability of rice genotypes by combining features of AMMI and BLUP techniques and selection based on multiple traits. Plant Genet. Res. 2021, 7, 163–180. [Google Scholar] [CrossRef]
- Rajabi, A.; Ahmadi, M.; Bazrafshan, M.; Hassani, M.; Saremirad, A. Evaluation of resistance and determination of stability of different sugar beet (Beta vulgaris L.) genotypes in rhizomania-infected conditions. Food Sci. J. Nutr. 2022, 11, 1403–1414. [Google Scholar] [CrossRef]
- Mahdi, H.; Seyed, B.M.; Ali, S.; Dariush, T. Genotype by environment and genotype by yield*trait interactions in sugar beet: Analyzing yield stability and determining key traits association. Sci. Rep. 2024, 13, 23111. [Google Scholar]
- Adewumi, A.S.; Asare, P.A.; Adejumobi, I.I.; Adu, M.O.; Taah, K.J.; Adewale, S.; Mondo, J.M.; Agre, P.A. Multi-trait selection index for superior agronomic and tuber quality traits in bush yam (Dioscorea praehensilis Benth). J. Agron. 2023, 13, 682. [Google Scholar] [CrossRef]
- Leon, R.; Rosero, A.; Garcia, J.; Morelo, J.; Orozco, A.; Silva, G.; Victor, D.; Correa, E.; Ceballos, H. Muti-trait selction indices for identifying new cassava varieties adapted to the carribbean Region of Colombia. J. Agron. 2021, 11, 1694. [Google Scholar] [CrossRef]


| S/N | Traits | Full Names | Description | Time Recorded |
|---|---|---|---|---|
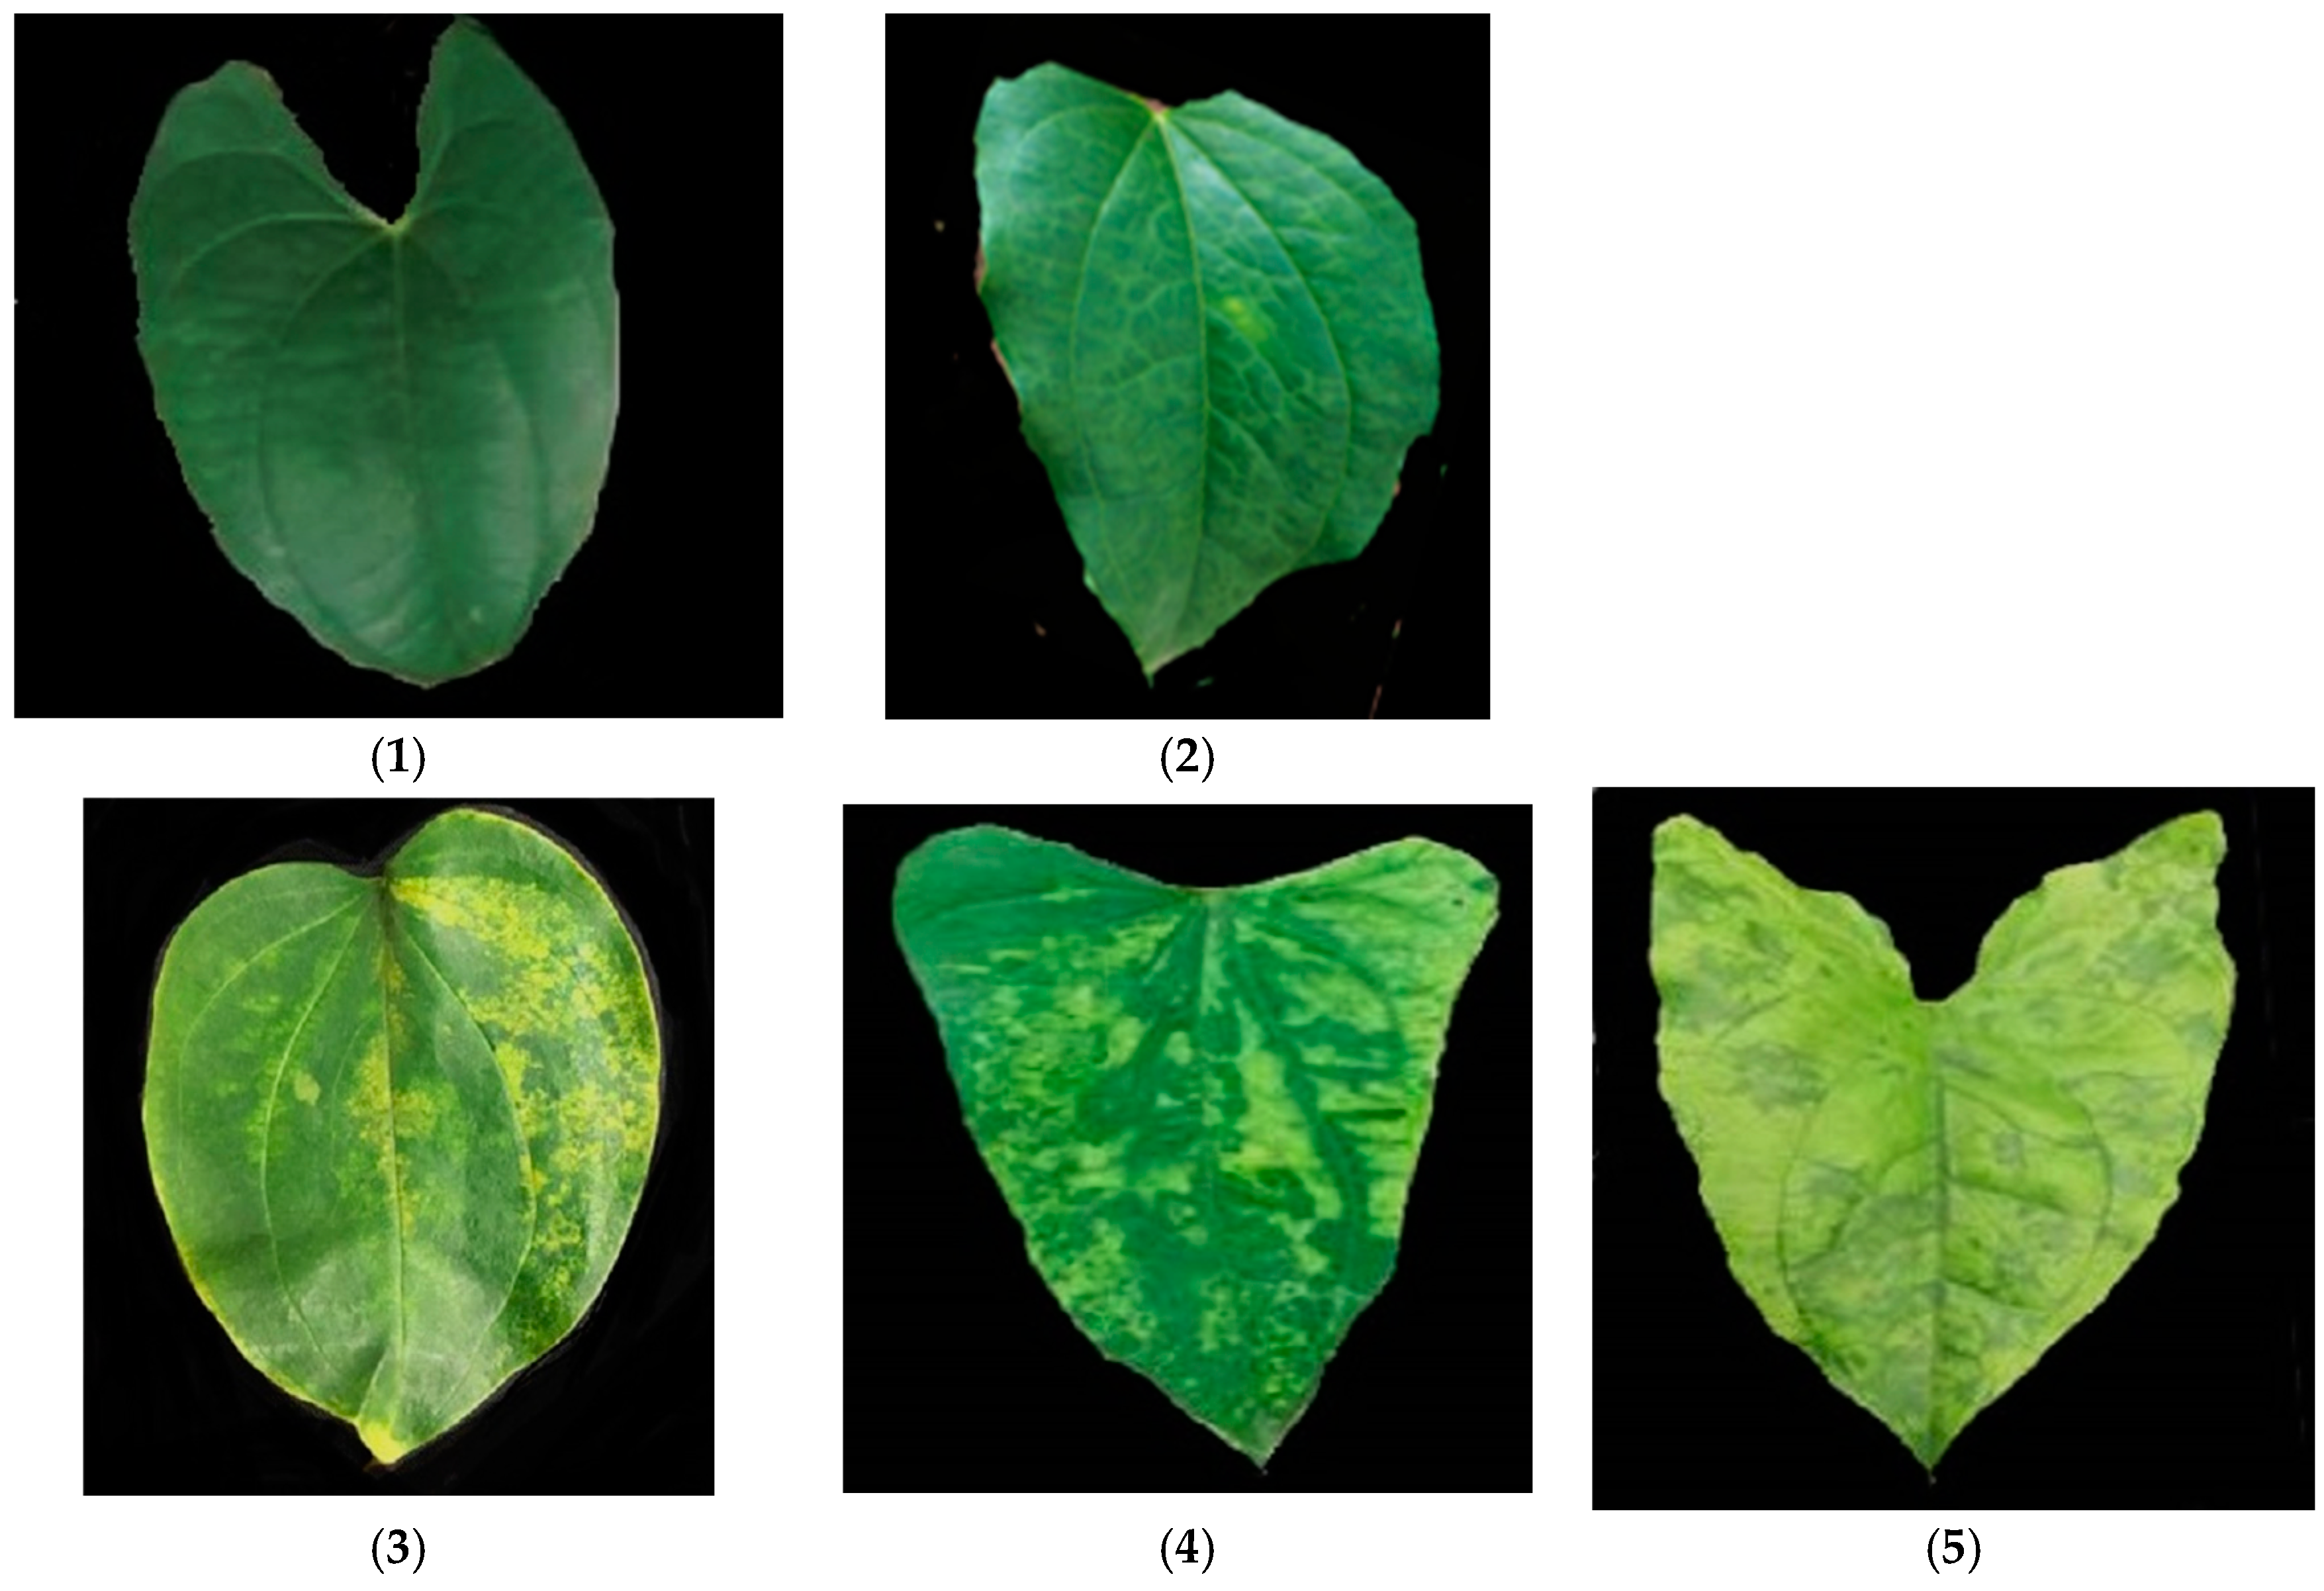
| 1 | AUDPCYAD | Area under disease progression curve yam anthracnose disease | The rating of symptoms caused by anthracnose over a period of 2-5MAP and converted to area under disease progression curve | Over the period of 2-5MAP |
| 2 | AUDPCYMV | Area under disease progression curve yam mosaic virus | The rating of symptoms caused by virus over a period of 2-5MAP and converted to area under disease progression curve | Over the period of 2-5MAP |
| 3 | PLNV | Plant Vigor | How vigorous the plants appear at 3MAP | 3 MAP |
| 4 | INTOX30 | Intensity of tuber oxidation 30 min | Visual tuber oxidation was accessed at harvest | At harvest |
| 5 | INTOX180 | Intensity of tuber oxidation 180 min | Visual tuber oxidation was accessed at harvest | At harvest |
| 6 | TTY | Fresh tuber yield | Yield was estimated per plot using the formula total tuber weight divided by the effective plot multiplied by ten | At harvest |
| 7 | DM | Dry matter content | Percentage of dry matter content of tuber | At harvest |
| 8 | ATW | Average tuber weight | Average weight of tuber per plot was accessed at harvest | At harvest |
| Source | df | AUDPCYMV | AUDPCYAD | PLNV | ATW | TTY | Oxi30 | Oxi180 | DMC |
|---|---|---|---|---|---|---|---|---|---|
| Env | 5 | 77,615 *** | 55,359 *** | 2.691 *** | 2.533 *** | 601.1 *** | 99.30 *** | 83.65 *** | 109.8 |
| Rep (Env) | 6 | 474 | 903 | 0.563 | 0.605 | 43.9 | 3.09 | 7.16 | 38.1 |
| Genotypes | 24 | 2096 *** | 3418 *** | 0.251 | 1.268 *** | 123.9 *** | 6.83 *** | 10.20 *** | 114.2 * |
| Geno × Env | 120 | 1610 *** | 2046 *** | 0.262 | 0.767 *** | 73.7 *** | 3.84 * | 6.26 ** | 68 |
| residual | 144 | 907 | 1054 | 0.195 | 0.426 | 37.3 | 2.78 | 4.07 | 61.5 |
| Genetic Parameters | AUDPCYMV | AUDPCYAD | ATW | TTY | PLNV | Oxi30 | Oxi180 | DMC |
|---|---|---|---|---|---|---|---|---|
| GV | 2.18 | 4.9 | 4.93 | 5.07 | 0.00 | 3.33 | 2.94 | 5.21 |
| PV | 52.20 | 55.10 | 48.80 | 54.70 | 56.30 | 62.70 | 62.40 | 18.00 |
| H2 | 23.00 | 40.00 | 39.00 | 41.00 | 0.00 | 44.00 | 39.00 | 41.00 |
| CVg | 0.88 | 0.95 | 153.13 | 14.47 | 0.00 | 81.10 | 47.37 | 6.67 |
| CVp | 4.28 | 3.19 | 481.82 | 47.53 | 295.33 | 351.95 | 218.23 | 12.38 |
| Mean | 168.65 | 232.86 | 1.45 | 15.56 | 2.54 | 2.25 | 3.62 | 34.24 |
| Variables | PC1 | PC2 | PC3 | PC4 |
|---|---|---|---|---|
| AUDPCYMV | −0.29 | 0.42 | −0.08 | −0.20 |
| AUDPCYAD | −0.17 | 0.28 | −0.01 | −0.63 |
| ATW | 0.38 | 0.19 | −0.10 | −0.28 |
| TTY | 0.56 | 0.30 | 0.09 | 0.07 |
| PLNV | 0.01 | 0.18 | −0.71 | −0.22 |
| Oxi30 | 0.23 | −0.54 | −0.14 | −0.28 |
| Oxi180 | 0.25 | −0.46 | −0.06 | −0.39 |
| DMC (%) | −0.06 | 0.05 | 0.66 | −0.44 |
| eigenvalue | 2.35 | 2.14 | 1.08 | 1.05 |
| variance (%) | 26.08 | 23.76 | 12.02 | 11.69 |
| cumulative (%) | 26.08 | 49.84 | 61.87 | 73.55 |
| Variable | Factor | FA1 | FA2 | FA3 | FA4 | Xo | Xs | SD | SD% | Communality |
|---|---|---|---|---|---|---|---|---|---|---|
| Oxi30 | FA 3 | −0.35 | 0.21 | −0.69 | −0.14 | 0.22 | 0.14 | −0.09 | −39.00 | 0.67 |
| Oxi180 | FA 3 | 0.21 | −0.20 | −0.76 | 0.14 | 0.30 | 0.22 | −0.08 | −26.40 | 0.68 |
| PLNV | FA 4 | 0.10 | 0.06 | −0.41 | −0.76 | 0.12 | 0.09 | −0.03 | −26.20 | 0.76 |
| ATW | FA 4 | −0.17 | −0.20 | 0.28 | −0.75 | 0.22 | 0.16 | −0.05 | −24.30 | 0.72 |
| AUDPCYMV | FA 2 | −0.17 | −0.89 | −0.19 | −0.03 | 1.29 | 1.04 | −0.25 | −19.30 | 0.85 |
| TTY | FA 1 | −0.99 | −0.02 | 0.03 | 0.01 | 0.66 | 0.53 | −0.13 | −19.20 | 0.97 |
| AUDPCYAD | FA 2 | −0.04 | −0.92 | 0.07 | −0.05 | 1.48 | 1.35 | −0.14 | −9.08 | 0.86 |
| DMC | FA 2 | −0.10 | 0.31 | −0.13 | 0.25 | 0.21 | 0.21 | 0.00 | −1.09 | 0.18 |
| Average | 0.7368696 |
Disclaimer/Publisher’s Note: The statements, opinions and data contained in all publications are solely those of the individual author(s) and contributor(s) and not of MDPI and/or the editor(s). MDPI and/or the editor(s) disclaim responsibility for any injury to people or property resulting from any ideas, methods, instructions or products referred to in the content. |
© 2024 by the authors. Licensee MDPI, Basel, Switzerland. This article is an open access article distributed under the terms and conditions of the Creative Commons Attribution (CC BY) license (https://creativecommons.org/licenses/by/4.0/).
Share and Cite
Olatunji, A.A.; Gana, A.S.; Tolorunse, K.D.; Agre, P.A.; Adebola, P.; Asfaw, A. Agronomic Performance and Yield Stability of Elite White Guinea Yam (Dioscorea rotundata) Genotypes Grown in Multiple Environments in Nigeria. Agronomy 2024, 14, 2093. https://doi.org/10.3390/agronomy14092093
Olatunji AA, Gana AS, Tolorunse KD, Agre PA, Adebola P, Asfaw A. Agronomic Performance and Yield Stability of Elite White Guinea Yam (Dioscorea rotundata) Genotypes Grown in Multiple Environments in Nigeria. Agronomy. 2024; 14(9):2093. https://doi.org/10.3390/agronomy14092093
Chicago/Turabian StyleOlatunji, Alice Adenike, Andrew Saba Gana, Kehinde D. Tolorunse, Paterne A. Agre, Patrick Adebola, and Asrat Asfaw. 2024. "Agronomic Performance and Yield Stability of Elite White Guinea Yam (Dioscorea rotundata) Genotypes Grown in Multiple Environments in Nigeria" Agronomy 14, no. 9: 2093. https://doi.org/10.3390/agronomy14092093