Article

The Spatiotemporal Evolution of Extreme Climate Indices in the Songnen Plain and Its Impact on Maize Yield

School of Hydraulic and Electric Power, Heilongjiang University, Harbin 150080, China
*
Author to whom correspondence should be addressed.
Agronomy 2024, 14(9), 2128; https://doi.org/10.3390/agronomy14092128
Submission received: 30 August 2024 / Revised: 15 September 2024 / Accepted: 18 September 2024 / Published: 19 September 2024

Abstract

:
Global climate change is intensifying and extreme weather events are occurring frequently, with far-reaching impacts on agricultural production. The Songnen Plain, as an important maize production region in China, faces challenges posed by climate change. This study aims to explore the effects of climate extremes on maize yield and provide a scientific basis for the adaptation of agriculture to climate change in this region. The study focuses on the spatial and temporal evolution characteristics of climate extremes during the maize reproductive period from 1988 to 2020 in the Songnen Plain and their impacts on maize yield. Daily temperature and precipitation data from 11 meteorological stations were selected and combined with maize yield information to assess the spatial and temporal trends of extreme climate indices using statistical methods such as the moving average and Mann–Kendall (M-K) mutation test. Pearson correlation analysis and a random forest algorithm were also used to quantify the degree of influence of extreme climate on maize yield. The results showed that (1) the extreme heat and humidity indices (TN90p, TX90p, CWD, R95p, R10, and SDII) tended to increase, while the cold indices (TN10p, TX10p) and the drought indices (CDD) showed a decreasing trend, suggesting that the climate of the Songnen Plain region tends to be warmer and more humid. (2) The cold indices in the extreme temperature indices showed a spatial pattern of being higher in the north and lower in the south and lower in the west and higher in the east, while the warm indices were the opposite, and the extreme precipitation indices showed a spatial pattern of being higher in the east and lower in the west. (3). Both maize yield and trend yield showed a significant upward trend. Maize meteorological yield showed a fluctuating downward trend within the range of −1.64~0.79 t/hm2. During the 33 years, there were three climatic abundance years, two climatic failure years, and the rest of the years were normal years. (4) The cold index TN10p and warm indices TN90p and CWD were significantly correlated with maize yield, in which TN90p had the highest degree of positive correlation with yield, and in the comprehensive analysis, the importance of extreme climatic events on maize yield was in the order of TN90p, TN10p, and CWD. This study demonstrates the impact of extreme climate indices on maize yield in the Songnen Plain, providing a scientific basis for local agricultural management and decision-making, helping to formulate response strategies to mitigate the negative effects of extreme climate, ensure food security, and promote sustainable agricultural development.

1. Introduction

Extreme weather phenomena, such as heat waves, cold waves, droughts, and floods, have far-reaching impacts on the human living environment and natural ecosystems due to their suddenness and destructive power [1]. In recent years, global climate change has intensified and extreme weather events have occurred frequently, posing unprecedented challenges to agricultural production and water resource management [2]. The Sixth Assessment Report of the Intergovernmental Panel on Climate Change (IPCC) [3] states that the impact of climate change on agriculture is straightforward, as it not only changes the growth cycle of crops but also affects crop yield and quality [4]. In the face of this grim situation, the No. 1 central document in 2023 proposed to carry out a new round of agricultural climate resource census and agricultural climate zoning, aiming to accurately grasp the characteristics of agricultural climate distribution and effectively deal with the adverse impact of extreme weather on agricultural production [5].
In agriculture, as one of the sectors most affected by climate extremes, the frequent occurrence of meteorological disasters caused by climate extremes has led to crop yield reductions and even crop failure [6], posing a great threat to global food security [7,8]. To gain a deeper understanding of the impact of climate change on agriculture, scholars at home and abroad have conducted a large number of studies, mainly focusing on food production and climate disasters [9], climate production potential, and the impact of climate change on crop cultivation [4,10]. Most of these studies used multiple linear regression [11], meteorological yield decomposition [12], and gray correlation [10] to explore the association between meteorological factors such as temperature, precipitation, and light and crop yield, which provided a scientific basis for the adaptive and sustainable development of agriculture. In addition, crop models [13,14], drought risk indices [15], and the Mann–Kendall trend test [10,16] have also been widely used to analyze the impact of extreme weather events such as drought, flood, and low temperatures on food production, which has made an important contribution to guaranteeing stable agricultural production.
Maize is one of the most productive cereals in the world, and its high yield is crucial for securing the global food supply. As the world’s second largest consumer and producer of maize, China accounts for 23% of global maize production [17], especially in Northeast China, where maize production accounts for 30% of the national total. The Songnen Plain region of Heilongjiang Province, an important commercial grain production base in China, is located in the region known as the “Golden Maize Belt”, and its vast area of black soil accounts for 59% of the total area of black soil in Northeast China [18], which is strategically important for guaranteeing China’s food security. However, maize production in this region is mainly concentrated in the area of the “Golden Maize Belt”. However, maize production in the region is largely dependent on natural precipitation and is therefore highly sensitive to climate change [19], and it has been predicted that maize yield losses due to drought could reach 36–39% in the future [20] and that this loss rate is likely to increase over time [21]. In recent years, observational data have shown that the Northeast is facing a serious challenge of a significant increase in the frequency of heat waves [22,23]. At the same time, the compound stress phenomenon of drought and high temperature has become increasingly frequent, and this compound stress has caused unprecedented damage to the water and heat balance of maize during its reproductive period, resulting in a much larger decline in maize yield than that of a single climatic event [24]. Therefore, exploring the spatial and temporal evolution patterns of extreme climate events during the maize reproductive period in the Songnen Plain of Heilongjiang Province and analyzing their impacts on crop yields are the prerequisites for guaranteeing food security and the basis for coping with extreme climate events [25,26].
In summary, this paper focuses on the Songnen Plain region of Heilongjiang Province, utilizing meteorological data and maize yield data from 1988 to 2020 to analyze in depth the spatial and temporal characteristics of extreme weather and its impact on maize yields, to provide scientific support for adaptive management and decision-making in agriculture in the region, to mitigate the negative impacts of extreme weather on agricultural production, and to guarantee food security and sustainable development of agriculture. The main objectives of the research in this paper are as follows:
(1) To analyze the spatial and temporal characteristics of extreme temperature and precipitation indices during the reproductive period of maize in the Songnen Plain, Heilongjiang Province.
(2) To analyze the variation characteristics of maize yield in the Songnen Plain, Heilongjiang Province.
(3) Explore the correlation between the effects of each extreme climate index on maize yield and the random forest weights.

2. Materials and Methods

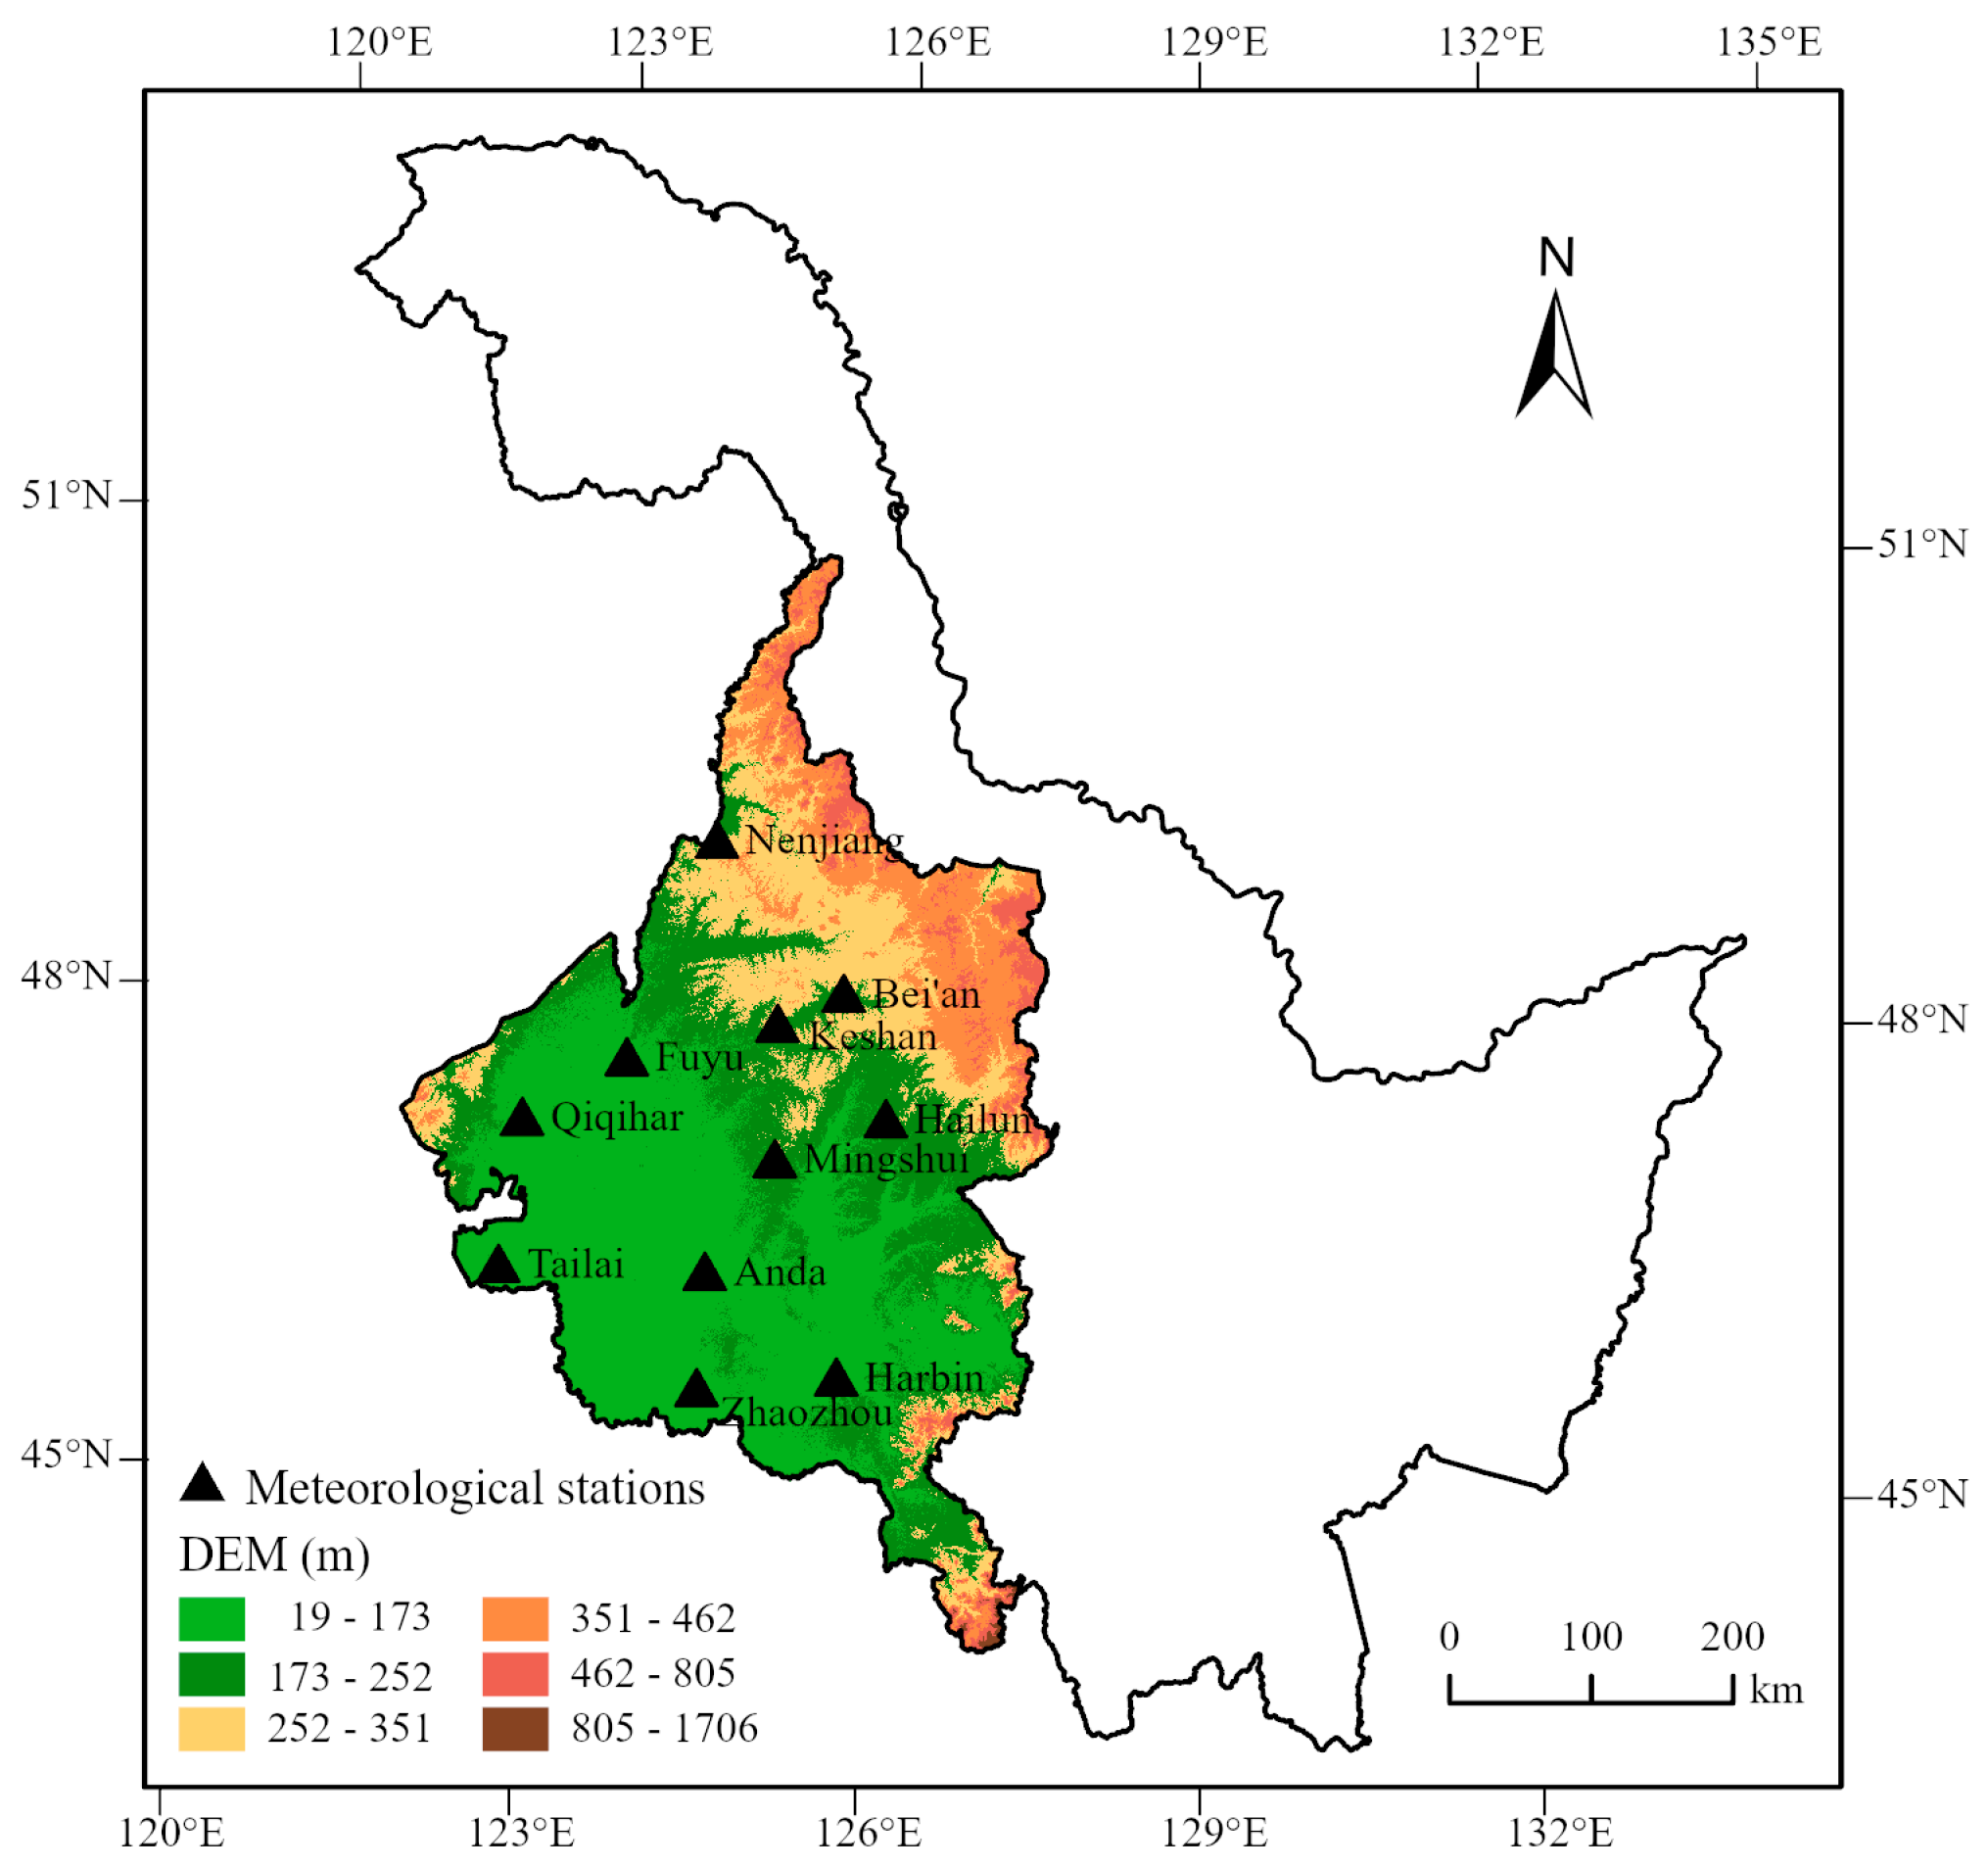
2.1. Overview of the Study Area and Data Sources

The Songnen Plain, located at 122°38′78″~128°55′29″ E, 44°06′31″~51°00′02″ N, is the largest of the three major plains in northeastern China, spanning the three administrative regions of the Inner Mongolia Autonomous Region, Heilongjiang Province, and Jilin Province. In this paper, the part of the Songnen Plain in Heilongjiang Province is selected as the study area (hereinafter referred to as the Songnen Plain), as shown in Figure 1. The Songnen Plain belongs to the Songhua River system, where the two major water systems, the Songhua River and the Nenjiang River, converge [27]. The temperature difference is large throughout the year; the lowest temperature in winter can be below −30 °C, the highest temperature in summer can be more than 35 °C, the average temperature is 2~6 °C, the frost-free period is between 100 and 160 d, and the average precipitation is between 370 and 450 mm. The Songnen Plain region’s precipitation is mainly concentrated in June–September [28], which coincides with the reproductive period of maize, and the rain and heat of the same period of climatic conditions for the growth of maize provide an ideal growth environment. However, due to the influence of the semi-arid monsoon climate and temperate continental monsoon climate, the precipitation is relatively low, especially in the western semi-arid area, where the annual precipitation is less than 300 mm in recent years.
The meteorological data used in the study were obtained from the China Meteorological Science Data Sharing Service Network (https://data.cma.cn/, accessed on 18 January 2021), which covered a total of 33 years of daily meteorological data from 1988 to 2020. Yield data were obtained from the 1988–2020 maize yield data in Heilongjiang Province released by the Heilongjiang Provincial Bureau of Statistics. Considering the fertility stage of maize in Heilongjiang Province, the whole life span of maize was determined from 1 May to 30 September [29].

2.2. Definition of Extreme Climate Indices

This paper combines the characteristics of maize affected by meteorological disasters in the northeast region of China, and is based on the extreme climate indices recommended by the Joint Expert Group on Climate Change Monitoring and Indicators (ETCCDI) and the actual situation of maize growth in the northeast region [30]. TN10p, TN90p, TX10p, TX90p, CDD, CWD, R95p, R10, and SDII were identified as the research indices of this paper. The extreme climate indices are shown in Table 1.

2.3. Method

2.3.1. Mann–Kendall Test

To investigate the trend of extreme climate indices changes, the Mann–Kendall (M-K) test method was used. The advantage of this method is that it does not rely on the normal distribution characteristics of the data, and even with a small number of outliers, it will not significantly affect the effectiveness and reliability of the analysis. More importantly, the M-K mutation test is a non-parametric statistical method, which means it does not require prior assumptions that the data follow any specific distribution form, thereby improving the applicability and flexibility of the analysis [31]. Currently widely used in fields such as meteorology, the basic principle of this method is as follows:
S = i = 1 n 1   j = i + 1 n   s g n x j x i
V a r S = n n 1 2 n + 5 18
s g n x j x i = 1 ,   x j x i > 0 0 , x j x i = 0 1 , x j x i < 0
where S is the detection statistic; xi and xj are the data values corresponding to the time series i and j; n is the total sample size, and i, jn, j = i + 1; and sgn() is the sign function.
When S follows a normal distribution, the mean E(S) = 0, and its variance (var) is expressed as follows:
v a r S k = n n 1 2 n + 5 72
The expression for the standardized normal distribution system detection statistic Z is:
Z = S 1 v a r S   S > 0 0 S = 0 S + 1 v a r S   S < 0
The M-K method can test the trend of the data by the size of Z value; when Z > 0, it means that the data have an upward trend, and when Z < 0, the data have a downward trend. When ∣Z∣ ≥ 1.645, 1.96, and 2.576, it means that it passed the significance test with 90%, 95%, and 99% confidence levels, respectively.

2.3.2. Inverse Distance Weight

The Inverse Distance Weighting (IDW) method is a commonly used geospatial interpolation method for estimating the attribute values of unknown points, based on the attribute values of the known points around them. Specifically, this method uses the distance between the interpolation point and its surrounding known data points to determine the degree of influence of each known point on the interpolation result. The closer the sample points are to the interpolation point, the greater the weight assigned, and vice versa. Ultimately, the attribute values of the interpolation points are obtained by weighted averaging the attribute values of all known points and their corresponding weights [32], whose expression is given by Equation (7):
Z X 0 = i = 1 m Z X i ( d i 0 ) p i = 1 m 1 ( d i 0 ) p
where Z(X0) is the estimated value of the point to be interpolated; m is the number of participating prediction stations around the prediction point; Z(Xi) is the known point sample value; di0 is the distance from the predicted point to the sample point; p is a power of distance, usually p = 2.

2.3.3. Crop Yield Decomposition

The yield is influenced by a combination of natural and socio-economic factors. The grain yield caused by technological progress, economic and social development, and other factors is usually defined as trend yield, while the grain yield affected by climate factors is defined as meteorological yield. The yield is decomposed into three parts [33]:
Y = Y t + Y m + Y f
where Y is the actual grain yield, kg/hm2, expressed in terms of the actual yield per unit area in the statistical yearbook; Yt is the trend yield, kg/hm2, obtained by the moving average method; Ym is the meteorological yield, kg/hm2; Yf is the random fluctuation yield, kg/hm2, which is negligible because of its relatively small impact.
At the same time, to quantitatively analyze the impact of extreme temperature indices on grain yield, the meteorological yield is separated by Formula (9) to obtain:
Y m = Y Y t
To more intuitively characterize the impact of extreme climate change on food production, the concept of relative yield is introduced, and the formula is as follows:
Y r = Y m Y t
where Yr is the relative yield, %. It is defined that when Yr > 10%, it indicates that the extreme climate indices of the current year are favorable for crop growth, which is a climate rich year. When Yr < −10%, it indicates that the extreme climate factors of that year are not conducive for crop growth, which is a climate failure year. Others are normal years [34].

2.3.4. Pearson Correlation Analysis

Using the Pearson correlation analysis method, we calculate the correlation coefficient (R) between extreme climate indices and maize yield. The specific calculation formula is as follows [35]:
R = i = 1 n x i x ¯ y i y ¯ i = 1 n x i x ¯ 2 i = 1 n y i y ¯ 2
where xi is the extreme climate indices for the i-th year; yi is the maize yield in the i-th year; x ¯ is the annual average value of extreme climate indices; y ¯ is the annual average yield of maize. Simultaneously perform polynomial curve fitting for extreme climate indices and maize yield, as well as identify the critical values of each extreme climate indices and their impact on yield [32]. The polynomial function fitting formula is as follows:
y = a 0 + a 1 x + + a n x n
where y is the yield of maize; x is the extreme climate indices; n is the order of a polynomial; ai is the coefficient of each extreme climate indices.

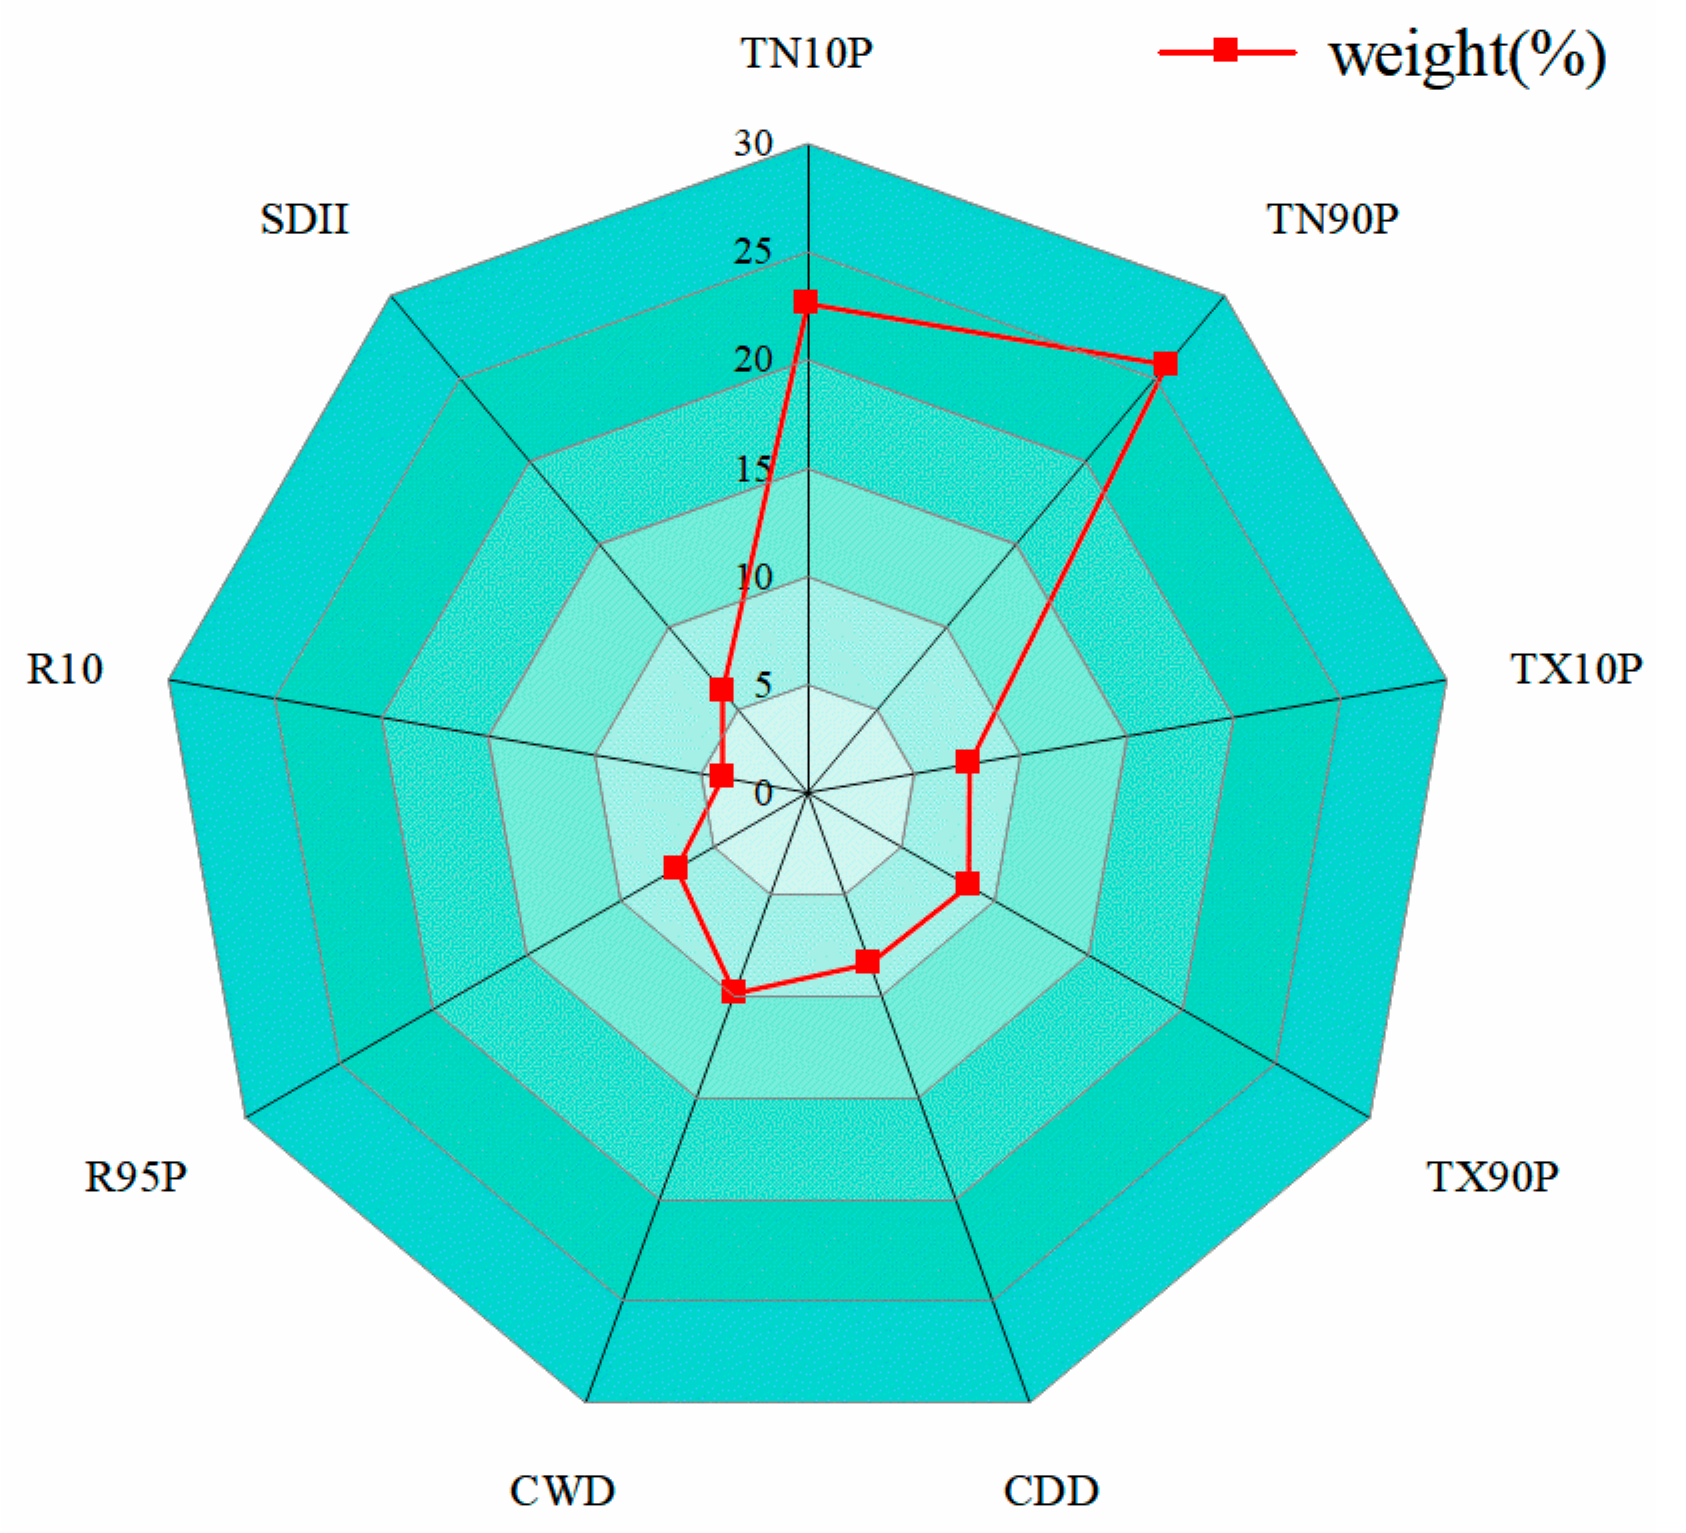
2.3.5. Random Forest

Random forest (RF) is a powerful integrated learning method that constructs multiple decision trees and votes or averages their results to obtain a final prediction. The main advantage of this method is that by integrating multiple models, it can effectively improve the accuracy of prediction and the generalization ability of the model while effectively reducing the risk of overfitting [36]. The core idea lies in constructing multiple decision trees and then synthesizing the prediction results of these trees to reach a conclusion [37].
Random forests have been widely used in many fields due to their powerful data processing capabilities and good generalization performance. In terms of ecological environment protection, random forests can be applied to species distribution prediction, climate change impact analysis, etc. [38]. In the field of healthcare, random forests are used for disease prediction and diagnosis, drug response prediction, etc. [39]. Random forests are also widely used in manufacturing, especially in quality control and equipment maintenance [40]. From the above examples, we can see that random forests can be a valuable tool for solving complex problems in fields such as ecological environment protection, healthcare, and manufacturing, providing effective solutions.

3. Analysis and Results

3.1. Analysis of Spatiotemporal Characteristics of Extreme Climate Indices

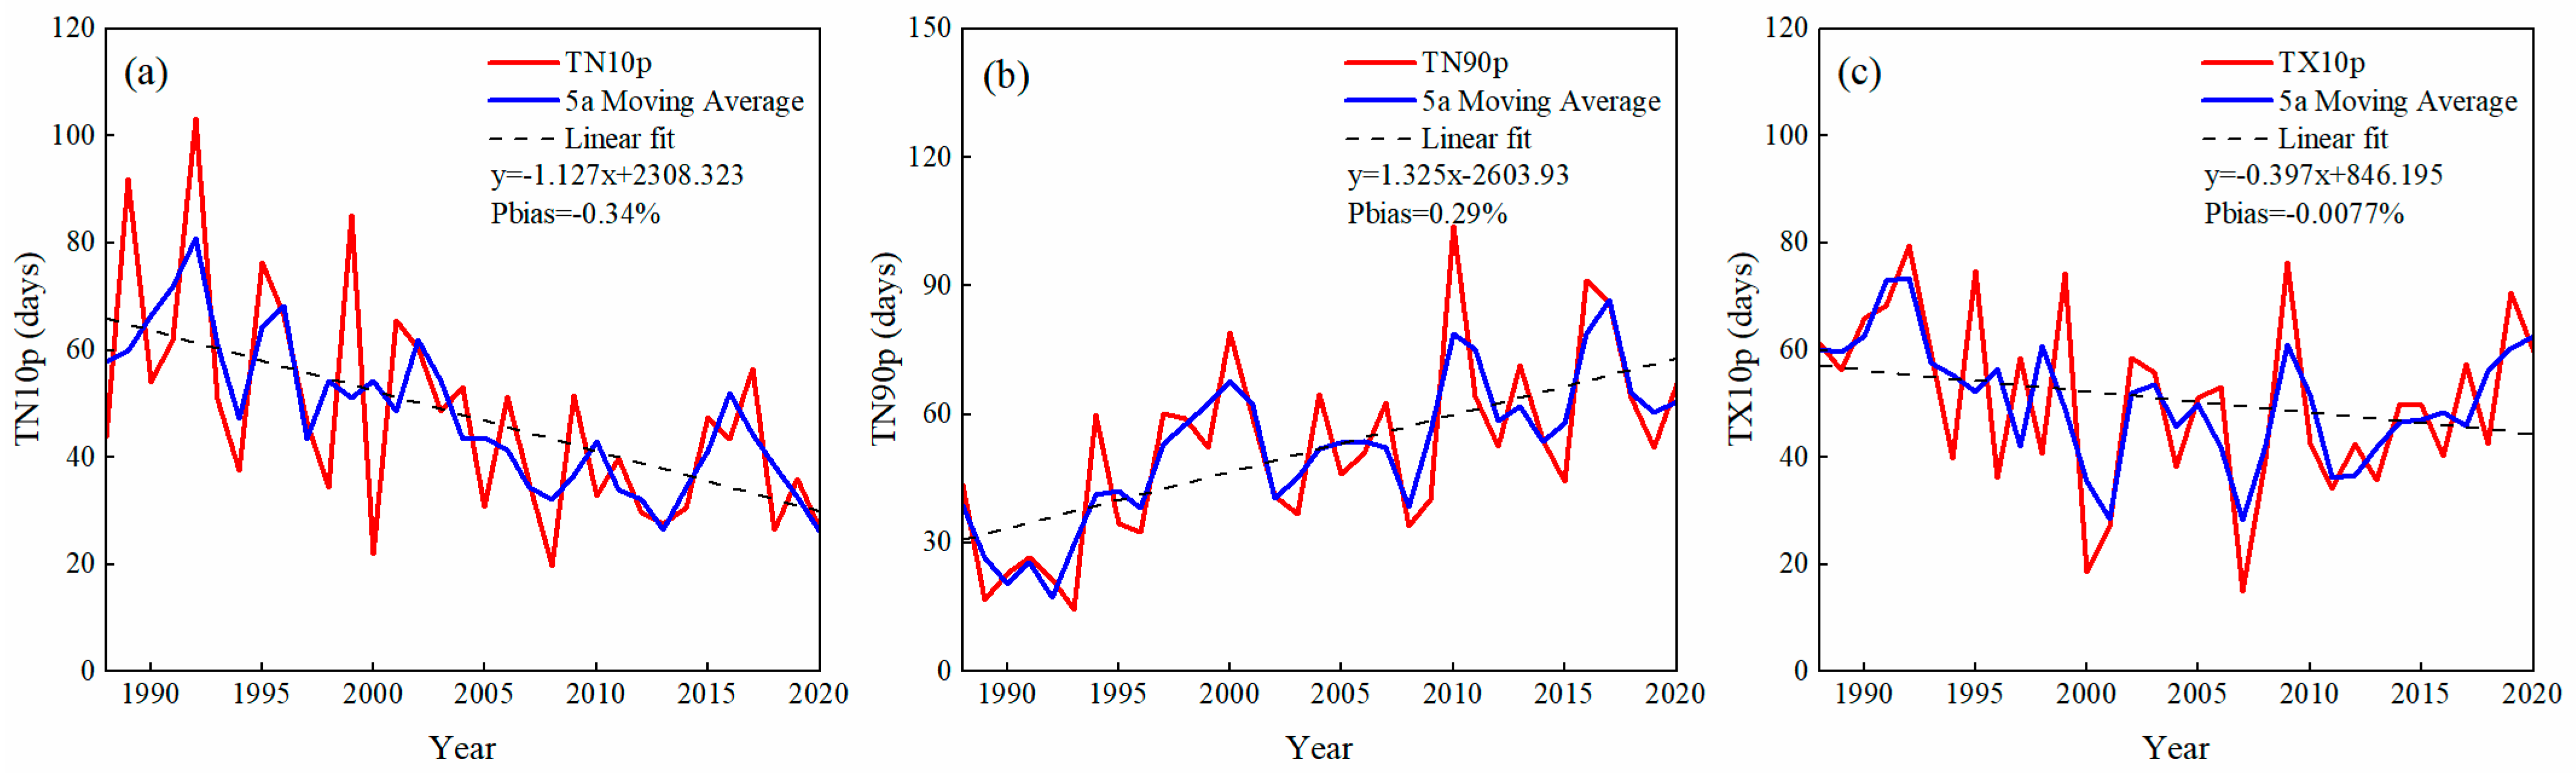
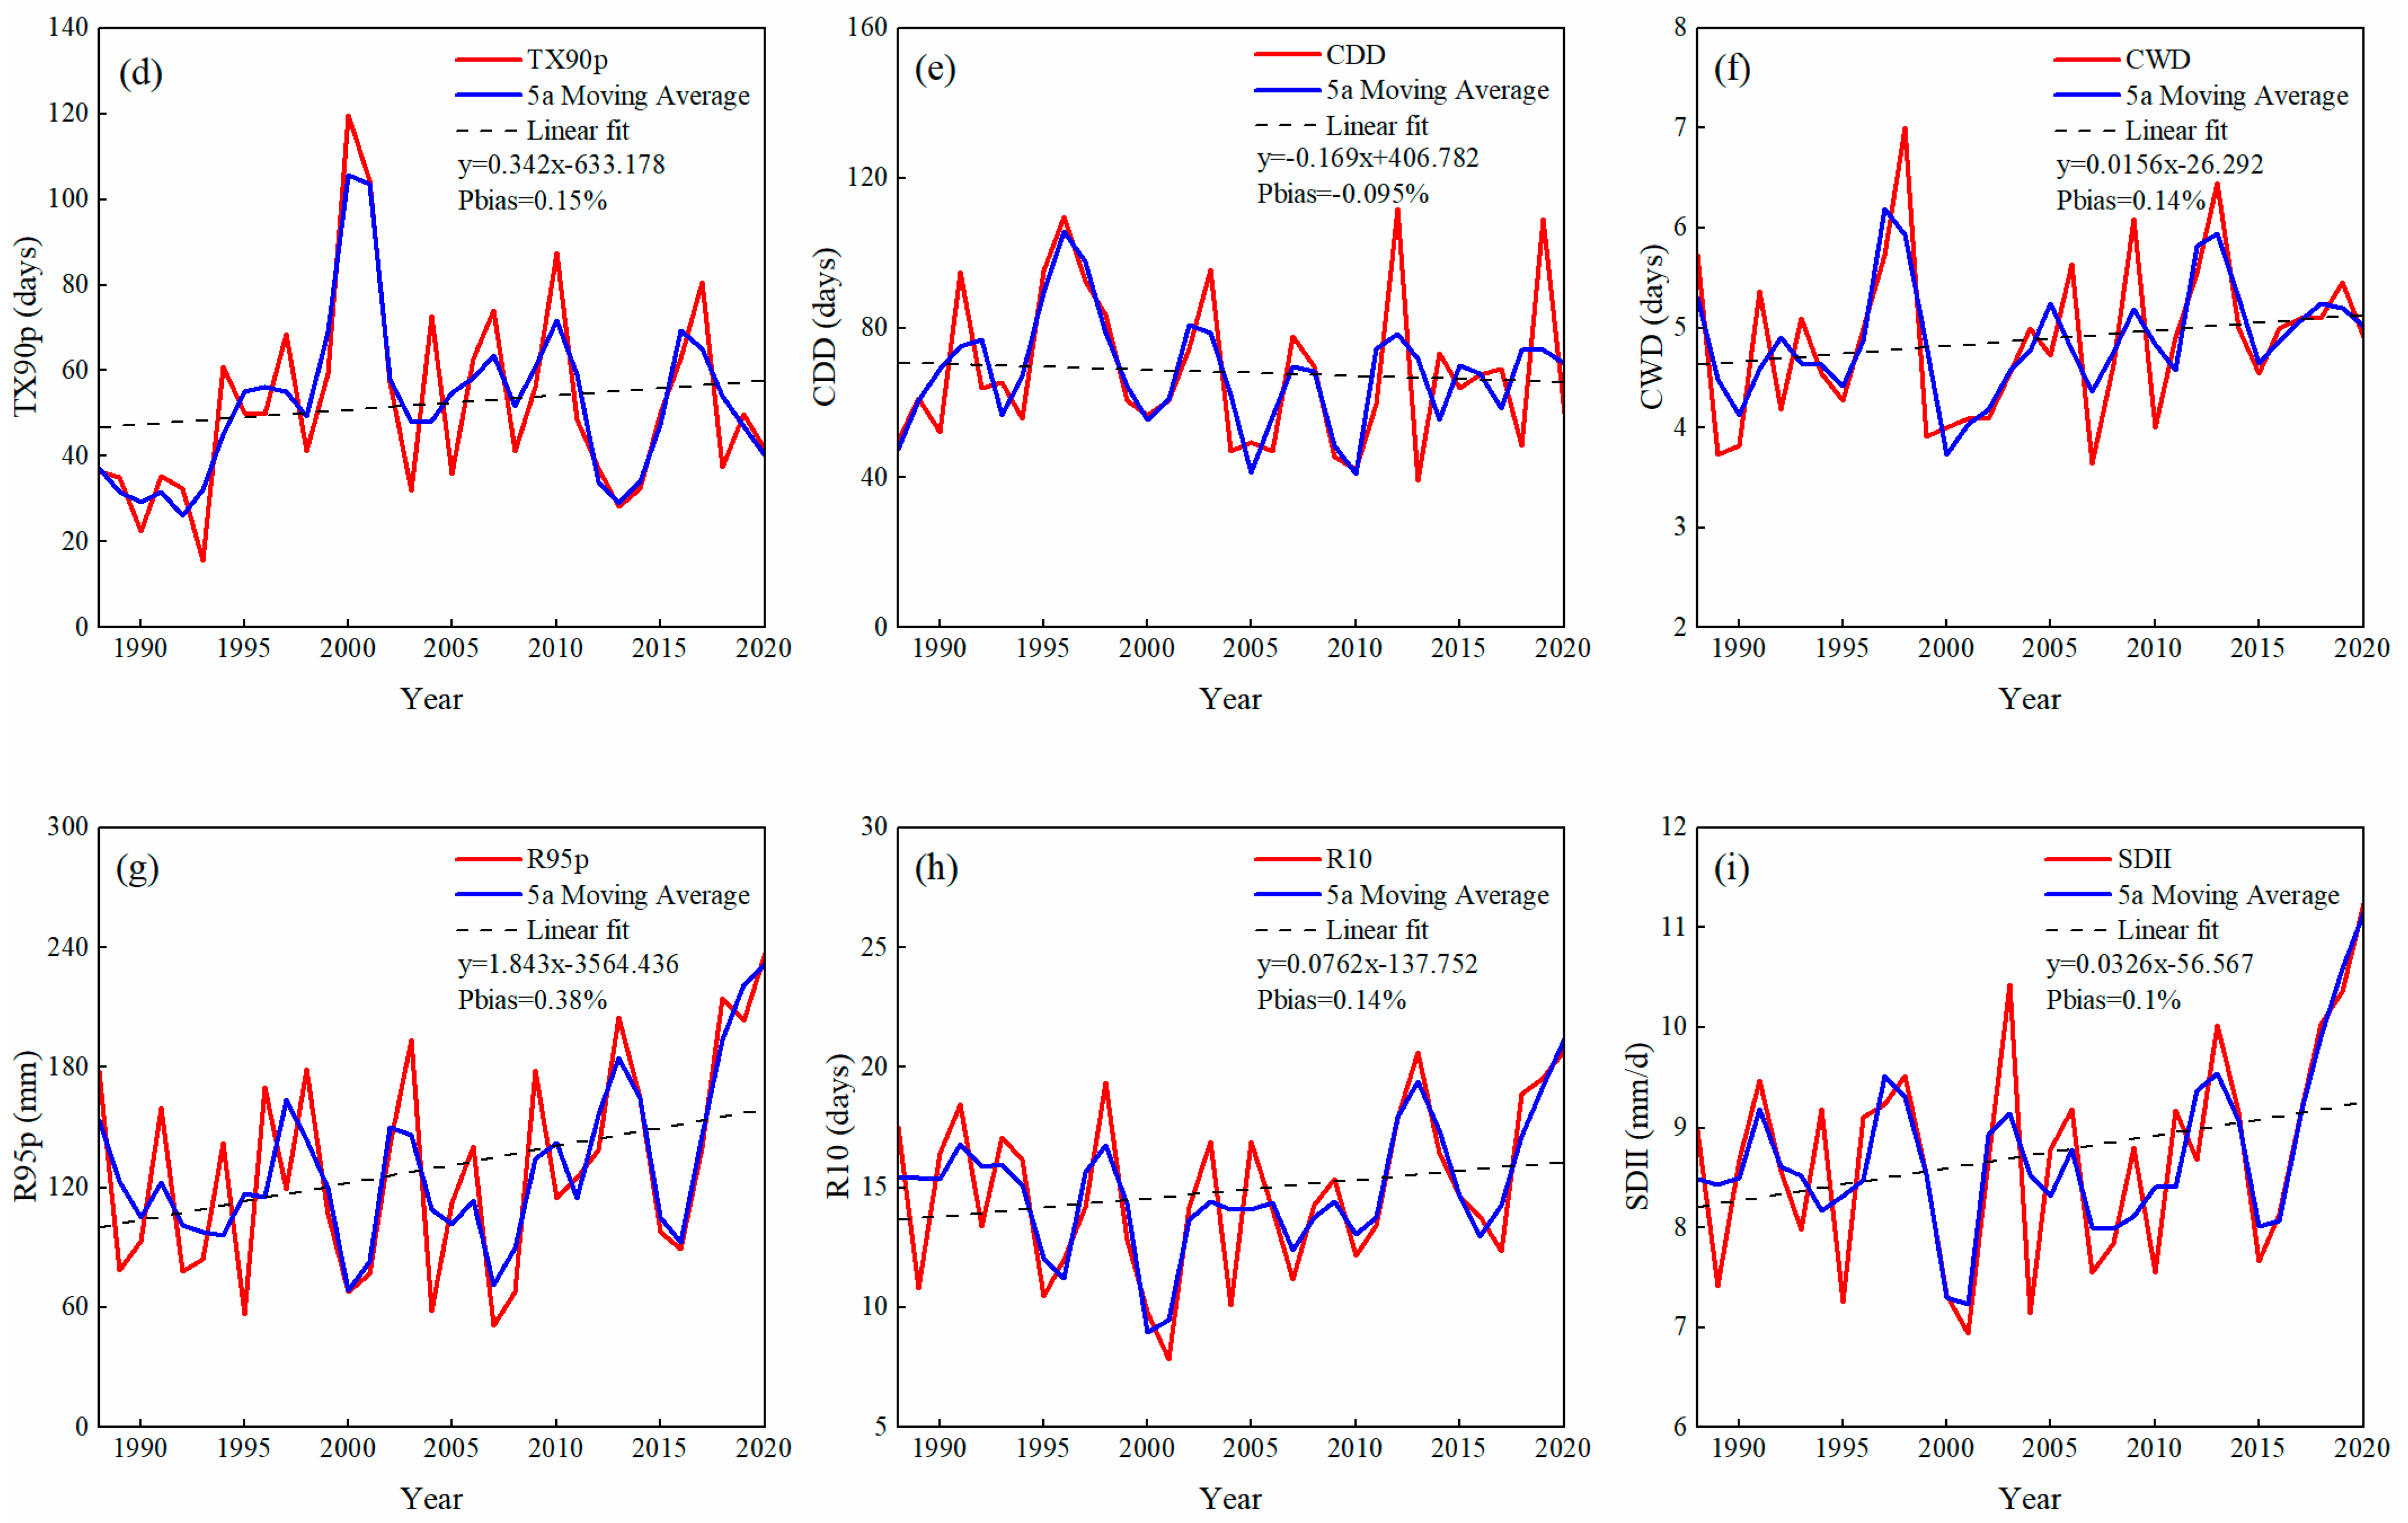
3.1.1. Characterization of Temporal Variations in Extreme Climate Indices during Maize Reproductive Period

To investigate the effect of extreme climate indices on maize yield, their spatial and temporal characteristics must first be assessed. In this study, nine extreme climate indices were calculated using RClimDex in the R programming environment [41], and the moving average method was used to remove outliers in the data to avoid interfering with the results of the study, and the processed data were subjected to linear fitting to determine the trend and magnitude of the changes, as well as to significance tests.
The temporal trends of extreme climate indices during the maize reproductive period from 1988 to 2020 in the Songnen Plain are shown in Figure 2. Specifically, the climate of the region is undergoing a pronounced warming and humidification process, as evidenced by an increase in the warm–humid indices and a decrease in the cold–arid indices. Both TN90p (13.3 d/10a) and TX90p (3.42 d/10a) of the extreme temperature indices showed a significant upward trend and passed the significance test. Meanwhile, TN10p (−10.3 d/10a) and TX10p (−3.97 d/10a) showed a decreasing trend in which TN10p passed the significance test. The extreme precipitation indices of CWD (0.156 d/10a), R95p (18.43 mm/10a), R10 (0.732 d/10a), and SDII (0.326 mm·d−1·10a−1) all showed an increasing trend. In contrast, CDD (−1.69 d/10a) showed a decreasing trend.
As shown in Figure 2a, TN10p fluctuated greatly between 1988 and 2000, with a range of 22 to 103 days. It reached its peak in 1992 and hit the bottom in 2000, and then showed a downward trend, with values concentrated between 20 and 65 days. According to Figure 2b, the fluctuation range of TN90p is 14 to 104 days. It experienced its first significant increase in 1994 and reached its highest value in 2010 and its lowest value in 1993. According to Figure 2c, TX10p showed relatively small fluctuations between 1988 and 1992 and 2010 and 2020 but experienced significant fluctuations between 1992 and 2009, with an overall range of 14 to 80 days, reaching its highest and lowest values in 1992 and 2007, respectively. From Figure 2d, it can be observed that the TX90p values were relatively concentrated between 1988 and 1993. The average value in 1993 was the lowest in nearly 33 years (15 d), and then the fluctuation amplitude increased. The average value in 2000 was the highest in nearly 33 years (119 d), more than twice that of the previous year.
According to Figure 2e, CDD has fluctuated significantly in the past 33 years, with a range of 39 to 112 days, reaching its highest and lowest values in 2012 and 2013, respectively. According to Figure 2f, the CWD distribution is relatively concentrated, with a fluctuation range of 3.7 to 6.2 days. The mean values of each year mainly fluctuate around 5 days, reaching their highest and lowest values in 1997 and 2000, respectively. From Figure 2g, it can be seen that the R95p value fluctuates greatly, with a range of 51.2 to 237 mm, reaching its highest and lowest values in 2020 and 2007. As shown in Figure 2h, the average volatility of R10 in each year is relatively small, with a fluctuation range of 8 to 21 days, reaching its highest and lowest values in 2020 and 2001, respectively. From Figure 2i, it can be seen that the trend of SDII over time is consistent with R95p, with a relatively concentrated distribution and a fluctuation range of 7.2 to 11.1 mm/d. It reached its highest and lowest values in 2020 and 2001.

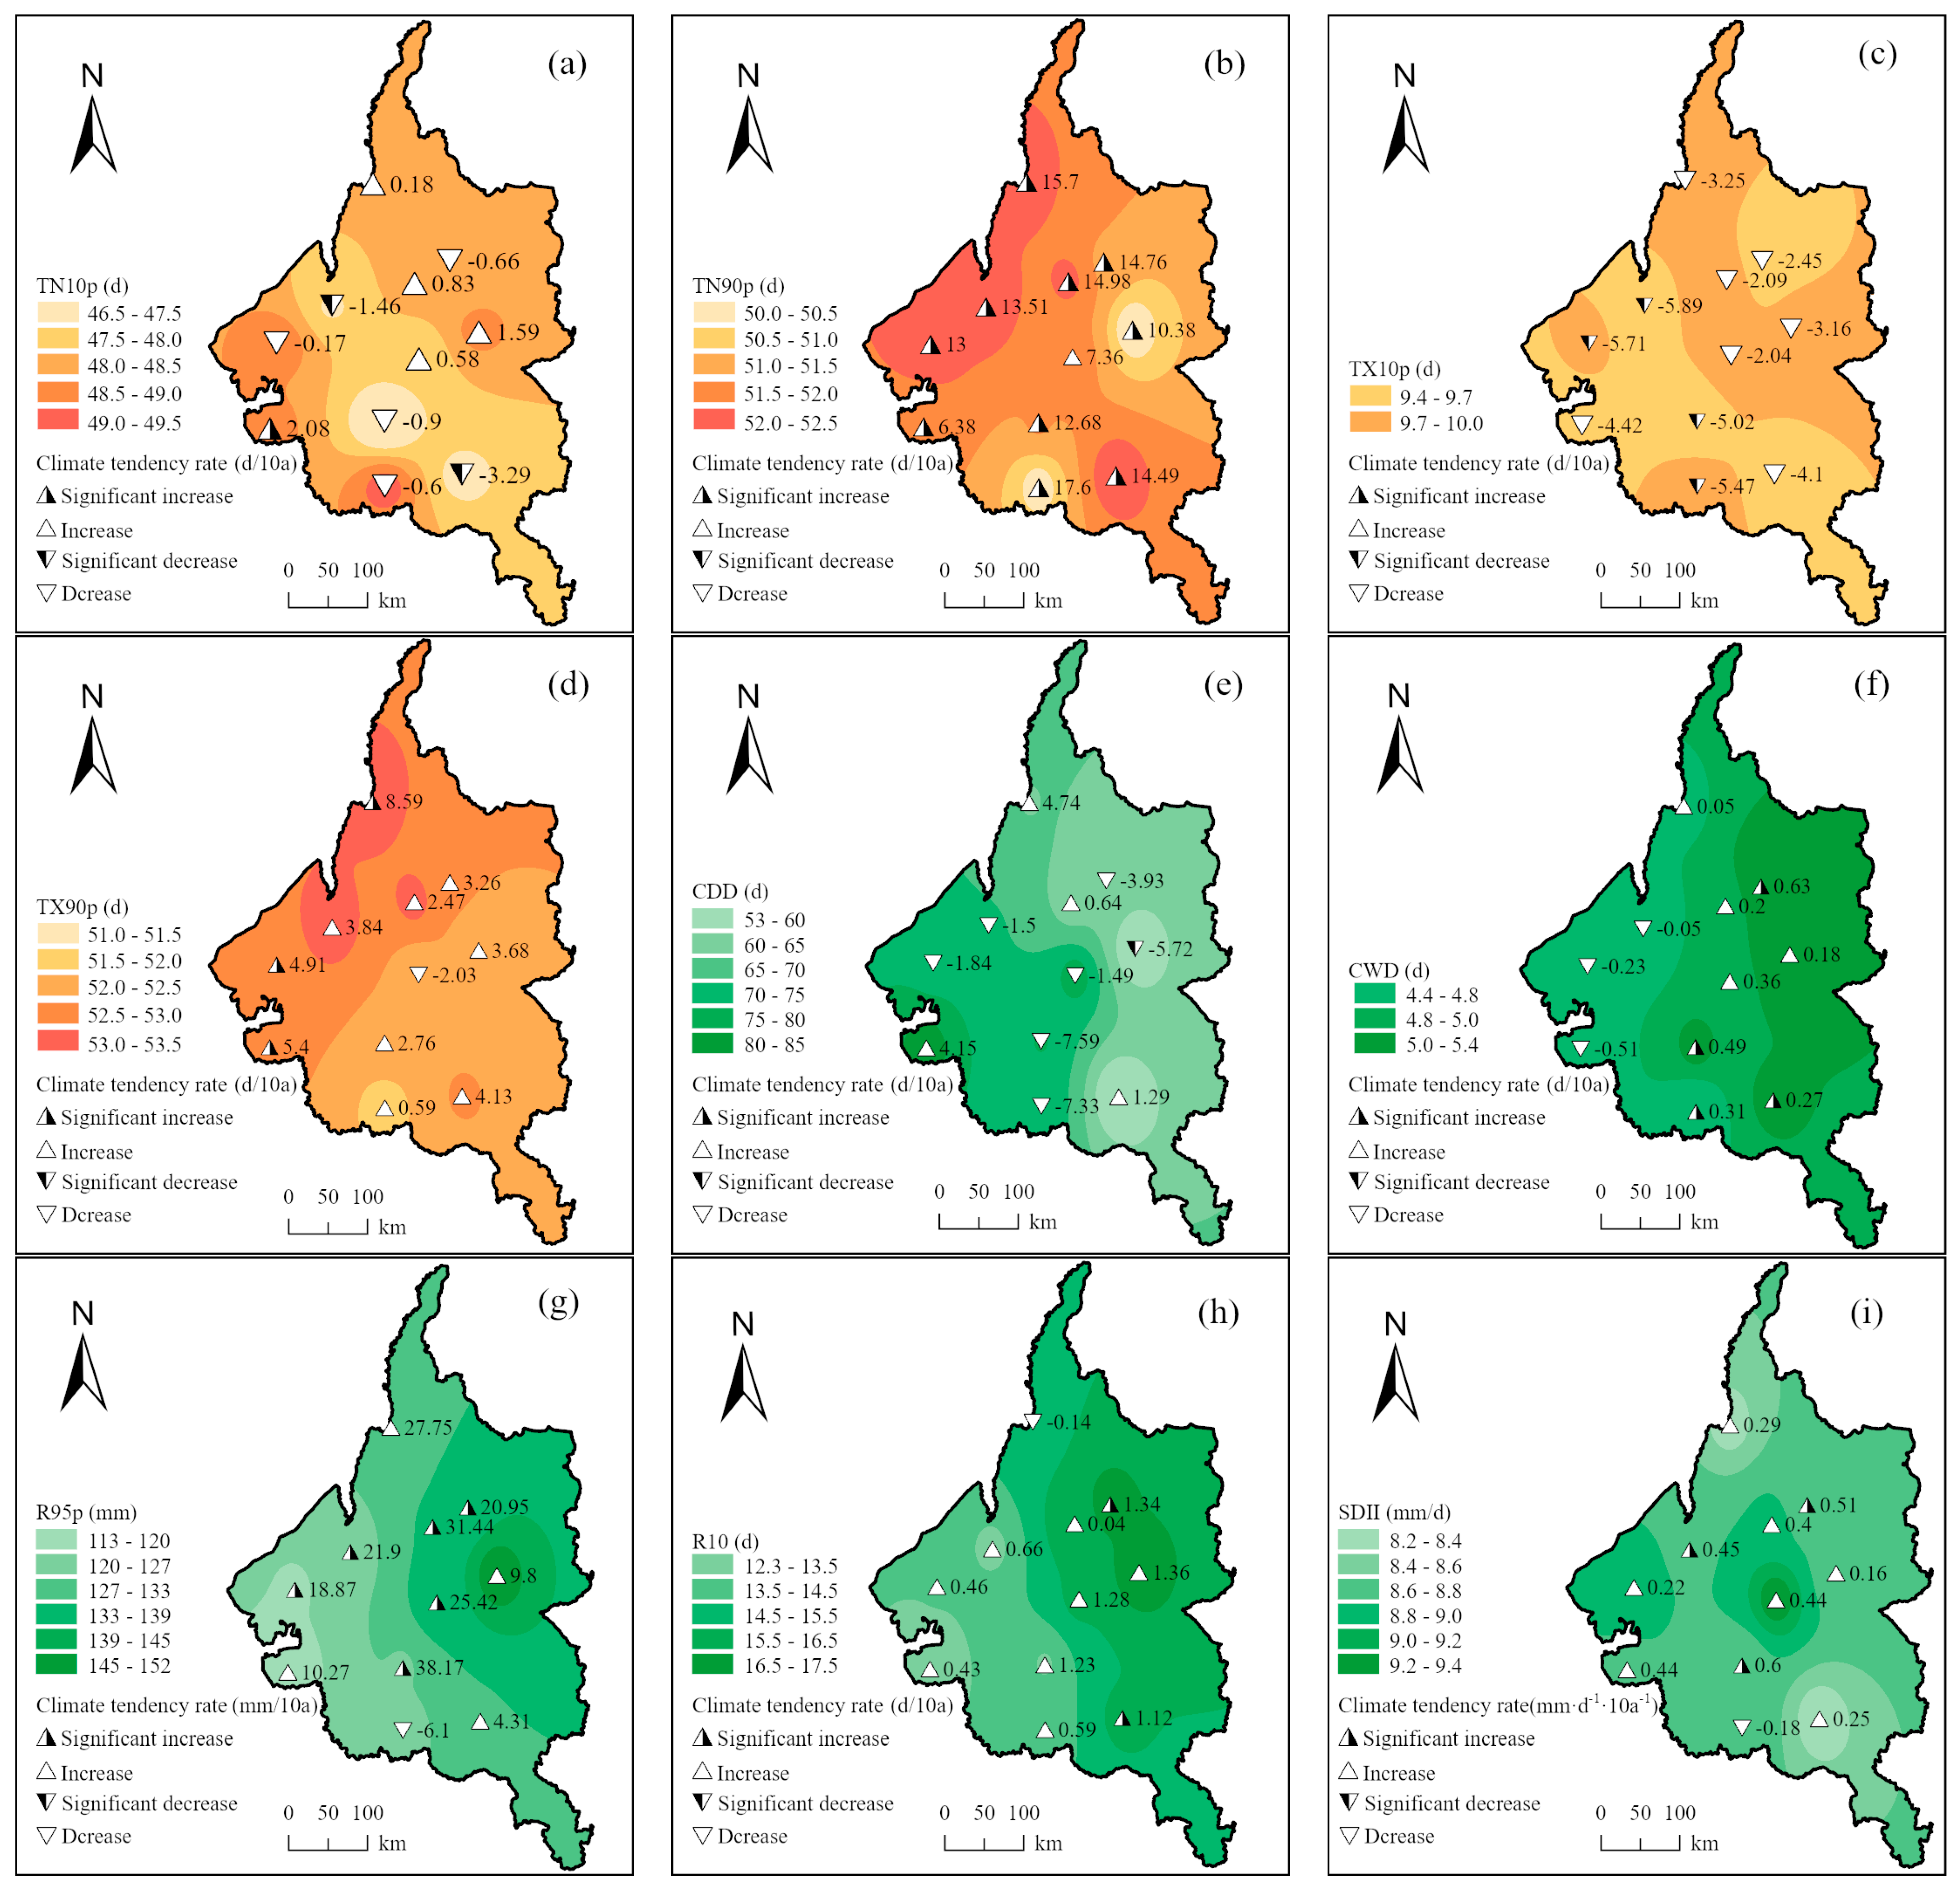
3.1.2. Characterization of Spatial Variations in Extreme Climate Indices during Maize Reproductive Period

The spatial variation trend of extreme climate indices during the maize growth period from 1988 to 2020 in the Songnen Plain is shown in Figure 3. The interannual trend rate of TN10p ranges from −3.29 to 2.08 d/10a, with most cities showing a downward trend. Among them, Fuyu and Harbin passed the significance test and showed a significant downward trend, spatially showing an increasing trend from the central to the northeast and southwest. The interannual trend rate of TN90p ranges from 6.38 to 17.6 d/10a, showing an upward trend, with 90% of the sites passing the significance test and showing a significant upward trend. High values are distributed in the northwest and southeast parts of the Songnen Plain. The interannual trend of TX10p is from −5.71 to −2.04 d/10a, showing a downward trend. The stations that passed the significance test are distributed in the southwest, and the overall spatial distribution difference is very small. The interannual trend of TX90p ranges from −2.03 to 8.59 d/10a, with 90% of the stations showing an upward trend. The spatial distribution is similar to that of TN90p, with high-value areas concentrated in the northwest.
The interannual trend of DD ranges from −5.72 to 4.73 d/10a, with a decreasing trend in most cities and a spatial distribution pattern of increasing from east to west. The interannual trend of CWD ranges from −0.51 to 0.63 d/10a, showing a decreasing trend. The spatial distribution is symmetrical to CDD, exhibiting an increasing distribution pattern from west to east. The interannual trend rate of R95p ranges from −6.1 to 38.17 mm/10a, with 90% of the stations showing an upward trend, spatially exhibiting an increasing distribution pattern from west to east, with high-value areas concentrated in Hailun. The interannual trend of R10 ranges from −0.14 to 1.36 d/10a, with 90% of the stations showing an upward trend, similar in spatial distribution to R95p, showing an increasing distribution pattern from west to east. The high-value areas are concentrated near Hailun and Beian. The interannual trend of SDII ranges from −0.18 to 0.51 (mm·d−1·10 a−1), with 90% of the stations showing an upward trend, spatially exhibiting an increasing distribution pattern towards the center, with high-value areas concentrated near Mingshui.
Overall, the extreme climate changes during the growth period of maize in the Songnen Plain have regular characteristics, mainly manifested as an increase in the warm and humid indices and a decrease in the cold and dry indices. The climate in the Songnen Plain region tends to be warm and humid. The frequency and amount of heavy precipitation have increased in most regions, which presents opportunities for some land areas with perennial drought and limited rainfall, as well as agricultural water shortages. At the same time, abnormal changes in heavy precipitation may cause instability in food production [42].

3.2. Characteristics of Maize Yield Changes in the Songnen Plain

The trend of maize yield changes in the Songnen Plain from 1988 to 2020 is shown in Figure 4. The maize yield (Figure 4a) and trend yield (Figure 4b) fluctuated between 3.05 and 9.29 t/hm2 and 3.97 and 8.91 t/hm2, respectively, with an increase of 200.6% and 124.4%. This indicates that technological progress and socio-economic development have greatly improved maize production capacity, leading to an increase in yield [43]. In 1989, there was a significant decrease in maize production, mainly due to a severe drought event during the maize growth period, which led to a significant reduction in yield [44]. The meteorological yield showed fluctuating changes (Figure 4c), ranging from −1.64 to 0.79 t/hm2, with significant variations, further indicating that climate factors have a significant impact on maize yield. The relative yield change is consistent with the trend of meteorological yield change, with a significant amplitude of change (Figure 4d). The abundance or scarcity of maize production is closely related to meteorological conditions. In the past 33 years, there have been 3 climate rich years (1988, 1990, 2002), 2 climate failure years (1989, 2013), and the rest have been normal years in the Songnen Plain.

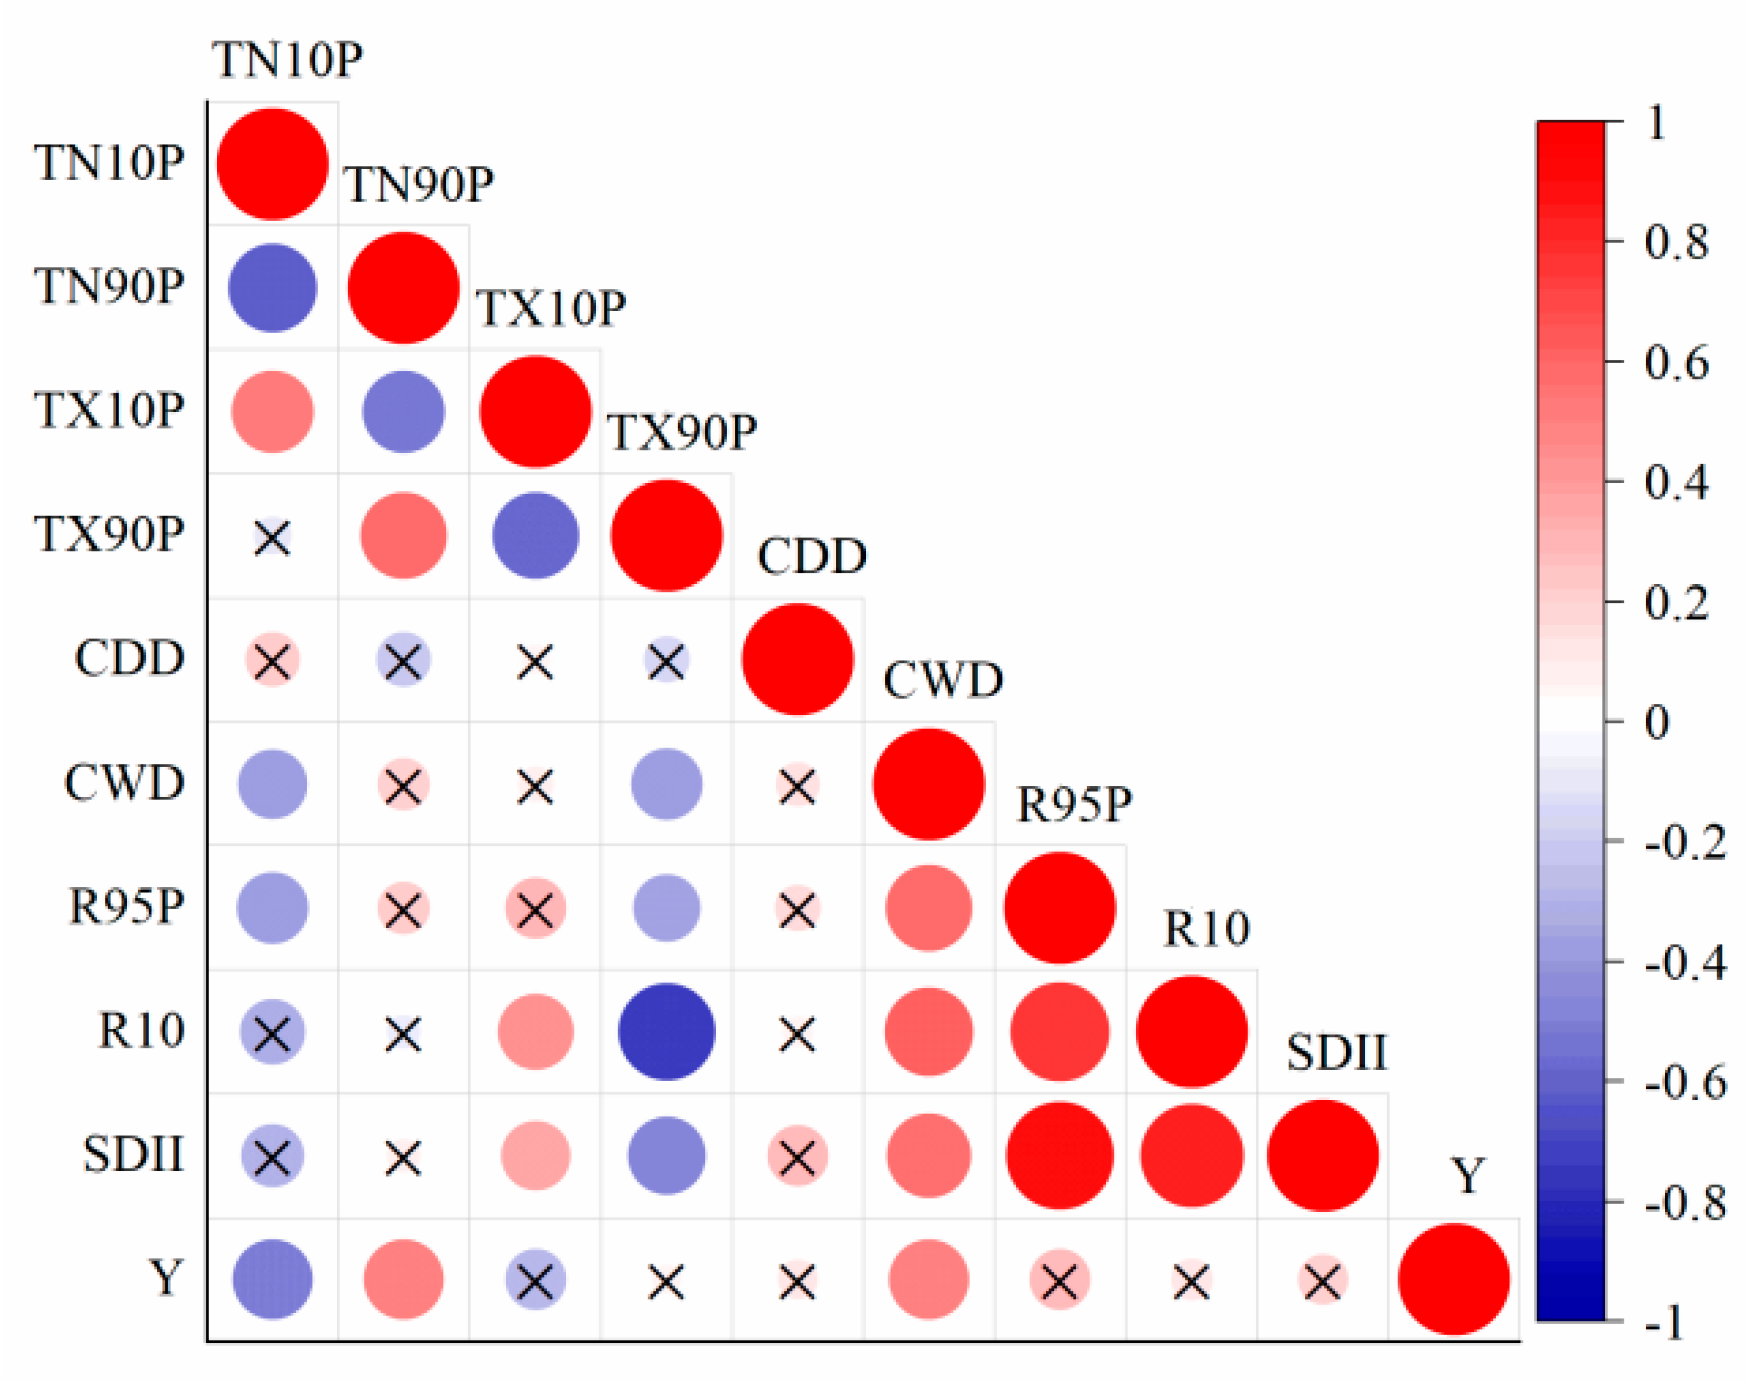
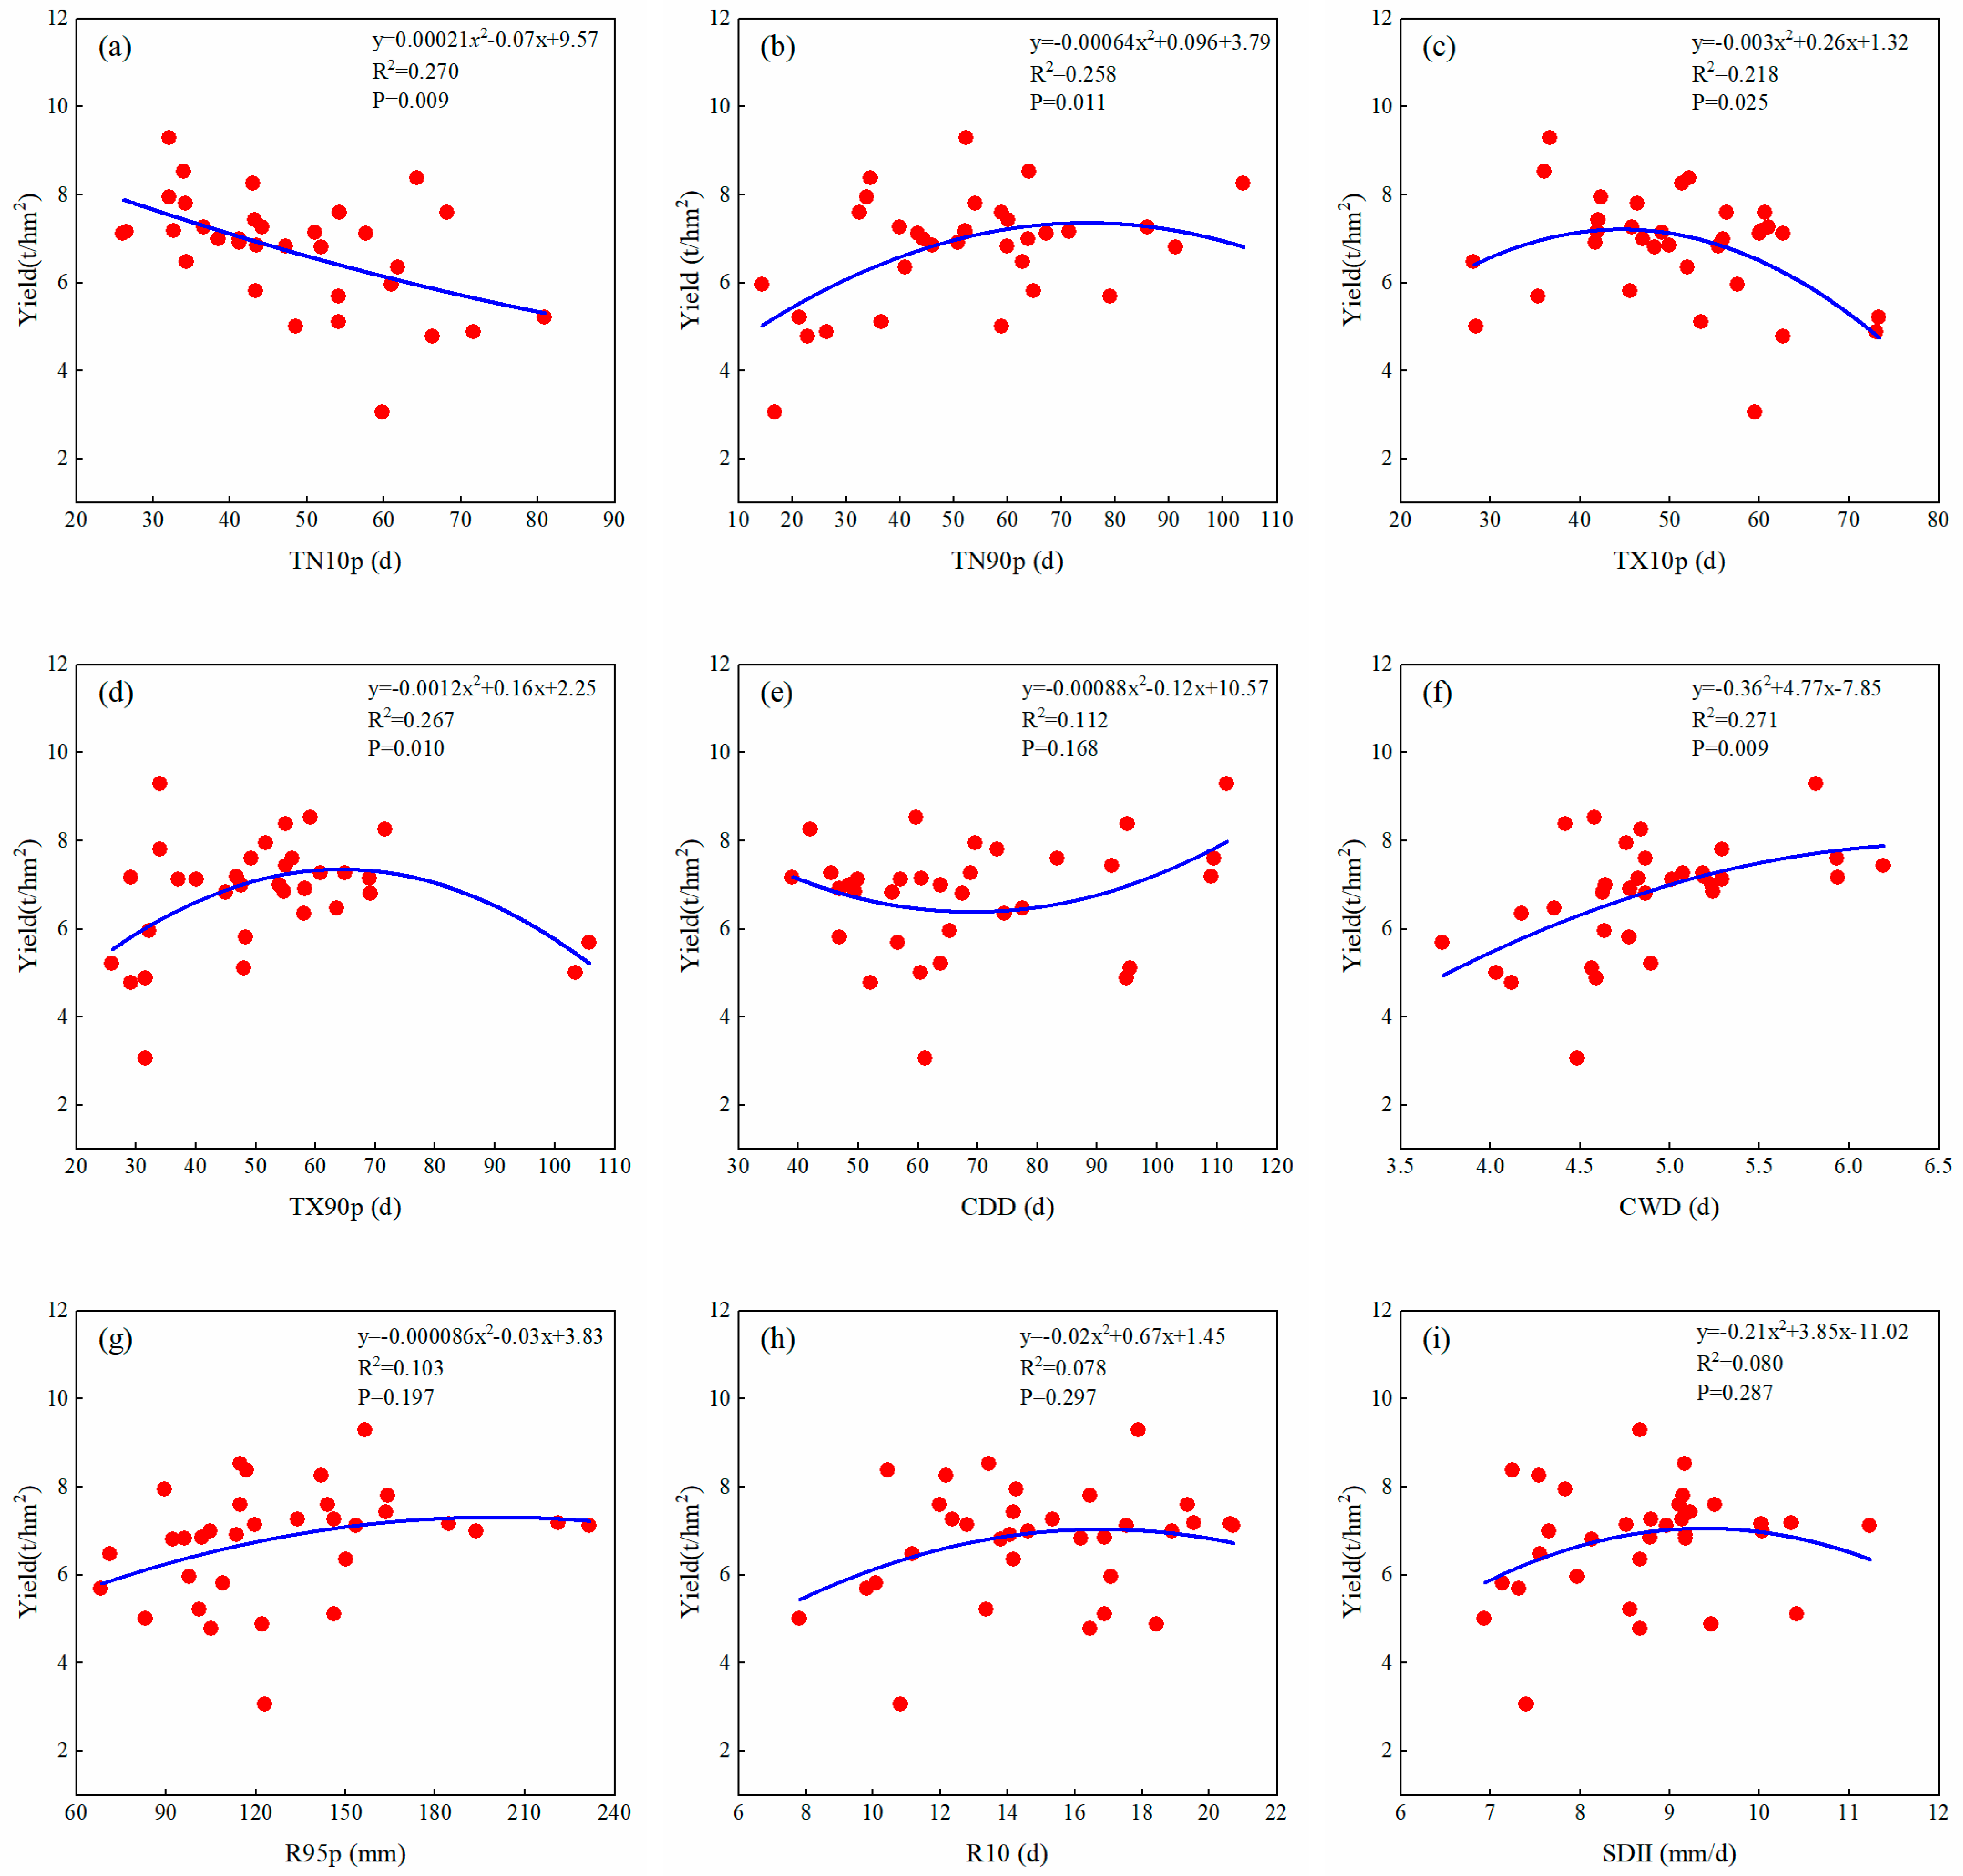
3.3. Maize Yield Response to Extreme Climate Indices

Using SPSS 27 software, TN10p, TN90p, TX10p, TX90p, CDD, CWD, R95p, R10, SDII, and maize yield were analyzed as variables for Pearson correlation analysis (Figure 5), and from the results, it can be seen that the extreme climate indices during the reproductive period, TN10p (−0.52) and TX10p (−0.29), and the maize yield were negatively correlated, and TN90p (0.51), TX90p (0.071), CDD (0.13), CWD (0.51), R95p (0.29), R10 (0.13), and SDII (0.20) were positively correlated with maize yield, with TN10p, TN90p, and CWD passing the significance test. This was combined with the polynomial fit curve between extreme precipitation indices and maize climate yield (Figure 6) to analyze the magnitude of the response of maize climate yield to the extreme climate indices.
From Figure 6, it can be seen that maize yield shows a significant downward trend with the increase in TN10p and has passed the significance test at the 0.05 level. With the increase in TN90p, TX10p, and TX90p, maize yield showed a trend of first increasing and then decreasing, and all three indices passed the significance test at the 0.05 level. When TN90p, TX10p, and TX90p exceed 73, 43, and 56 days, respectively, maize yield begins to show a downward trend. This indicates that the early stage of climate warming has a certain positive effect on agricultural production in the Songnen Plain; that is, the increase in temperature helps promote the increase in grain yield. However, once the temperature exceeds a certain threshold, it hurts maize yield. According to existing research, the ideal temperature range for maize growth is usually between 20 °C and 30 °C [45]. When the temperature continues to exceed 30 °C, higher temperatures can lead to a decrease in the number of grains per maize ear and a decrease in yield [46]. The maize yield shows a trend of first decreasing and then increasing with the increase in CDD, indicating that CDD does have an impact on maize yield. However, due to the corresponding differences in drought during different growth stages, such as during the tasseling stage, drought affects flowering and pollen dispersal, reduces the number of grains per ear, and leads to a decrease in yield. Moderate drought during the grain-filling stage not only does not affect yield but can also increase lysine content in ears and grains, improving the nutritional quality of maize [47,48]. Therefore, this complex relationship did not pass the significance test at the 0.05 level. The maize yield shows an upward trend with the increase in CWD, which passed the significance test at the 0.05 level. This indicates that in the Songnen Plain region, the impact of CWD on maize yield is favorable. The maize yield showed a trend of first increasing and then decreasing with the increase in R95p, R10, and SDII, but did not pass the significance test at the 0.05 level. When R95p, R10, and SDII exceeded 175 mm, 17 d, and 10.2 mm/d, respectively, maize yield showed a decreasing trend, indicating that after reaching a certain threshold, excessive precipitation caused damage to maize growth and led to a reduction in maize production [49].
The random forest algorithm was used to simulate the extreme climate indices to assess the importance of each extreme climate indices on maize yield, and the results are shown in Figure 7, which shows that TN90p accounted for 25.78%, which is the most important and plays a key role. TN10p accounted for 22.57%, which is the second most important and plays an important role, and CWD accounted for 9.93%. The weight of TX90p is 8.58%, and the weight of CDD is 8.42%. The total weight of the above five climate indices accounts for 75.28%, while the weights of the remaining four indices, TX10p, R95p, SDII, and R10, are 7.64%, 6.97%, 6.09%, and 4.03%, respectively. The weights of extreme temperature indices TN90p and TN10p were significantly higher than those of other extreme climate indices, which indicated that maize yields in the Songnen Plain region showed higher sensitivity to extreme temperature events. The seven extreme climate indices, CWD, TX90p, CDD, TX10p, R95p, SDII, and R10, have similar proportions of importance in the random forest algorithm, which suggests that these indices have a comparable degree of influence on maize yield. Although these extreme climate indices have similar importance, their combined effects on maize yield still need to be considered in practical applications. In addition, despite their similar importance, TN90p and TN10p are weighted more heavily, which means that special attention needs to be paid to the impacts of extremely high- and low-temperature events when developing coping strategies.

4. Discussion

4.1. Spatiotemporal Variations in Extreme Climate Indices

The world is experiencing changes characterized by climate warming. Through the study of extreme climate in the Songnen Plain from 1988 to 2020, this article found that the extreme temperature indices TN10p and TX10p showed a downward trend over time, while TN90p and TX90p showed an upward trend with significant correlation. At the same time, there is a certain symmetry between TN10p and TN90p, TX10p, and TX90p over time, indicating that the Songnen Plain is undergoing an extreme warming process, which is similar to regions such as Liaoning [10] and the Loess Plateau [50] and consistent with the research results of Zhang [51]. This trend is also observed nationwide and even globally [52]. In terms of spatial variation, the cold indices (TX10p, TN10p) generally show a trend of being higher in the north and lower in the south and lower in the west and higher in the east, while the warm indices (TX90p, TN90p) are the opposite. This is consistent with the research results of Hou [53] and also indicates that the frequency of extreme cold events increases with latitude [54]. The decreasing and increasing trends of the extreme precipitation indices CDD and CWD are not significant, which is different from the research of Liang et al. [55]. R95p, R10, and SDII all show an overall growth trend and reach a peak in 2020. The reason for this phenomenon is that three typhoons successively went north to the Longjiang River in late summer and early autumn of 2020, resulting in rainstorms, floods, local strong convection, tornados, and other disasters [56]. The areas with higher CDD in the Songnen Plain are concentrated in the southwest, showing an increasing trend from east to west in space, while the spatial distribution of CWD is symmetrical to CDD, showing an increasing trend from west to east. The spatial distribution of R95p and R10 is relatively close, showing an increasing pattern from west to east. R95p and R10 are significantly higher in the Helen and Bei’an regions than in other areas. SDII has little fluctuation and shows a spatially increasing distribution pattern towards the middle, with high-value areas concentrated near Mingshui. Overall, the Songnen Plain is severely affected by extreme heat events, and the extreme precipitation indices in the region show a spatial pattern of being higher in the east and lower in the west, which is consistent with the research results of Li [57] and Du [58].

4.2. Analysis of the Correlation between Maize Yield and Extreme Climate Indices

Maize production is closely related to temperature, precipitation, and other meteorological factors, and global warming has altered the water–heat cycle in the Songnen Plain region, with significant impacts on maize production. Through the study of maize yield, it was found that the extreme climate in the Songnen Plain tended to be “warmer and wetter” from 1988 to 2020, which mainly had a positive impact on maize production, with higher temperatures, fewer cold events, and increased rainfall being favorable for high maize yields and quality in the northeast region [59]. Weather yields are highly volatile, and extreme weather further increases the uncertainty of maize production. Through correlation analysis, it was found that TN10p and TX10p were negatively correlated with maize yield during the reproductive period, and TN90p, TX90p, CDD, CWD, R95p, R10, and SDII were positively correlated with maize yield, with TN10p, TN90p, and CWD passing the significance test. From the combined weights, maize yield was mainly affected by TN90p and TN10p, indicating that extreme temperature events had a greater effect on maize yield in the Songnen Plain than extreme precipitation [60], a finding that supports the findings of Wang [61] and Bi [62].

4.3. Impact of Extreme Climate on Food Security

Globally, extreme climate indices have had a significant impact on food security. For example, research conducted in the highlands of northern Ethiopia in Africa has shown that extreme temperature has negatively impacted maize yields, and insufficient precipitation has exacerbated this negative impact, making maize yields more volatile and directly threatening local food security [16]. Similarly, in sub-Saharan regions, there has been a clear negative correlation between frequent floods and droughts in recent years and maize yields. This means that as the frequency of extreme climate increases, the production of maize is severely affected [63]. In North America, according to Vogel et al.’s research, extreme climate, especially extreme temperature events, have a significant impact on maize yield. After excluding the indicators of extreme climate, the explanatory variance in maize yield decreased by nearly 40%, further demonstrating the importance of extreme climate for agricultural production [64]. The situation in Europe is equally severe, as extreme climates have a significant impact on spring wheat production, especially when extreme temperatures have a more significant impact on crop yield [9].
These research findings not only emphasize the impact of extreme climate on maize production but also indicate that global food security faces common challenges in the context of climate change. Therefore, adaptation strategies need to be developed to enhance the resilience of agricultural systems and ensure food security.

5. Conclusions

This article investigates the spatiotemporal variations in extreme climate indices during the maize growing season in the Songnen Plain from 1988 to 2020 and their impact on maize yield. This study used various statistical methods, including the moving average method, M-K test, and IDW, to analyze nine extreme climate indices. Pearson correlation analysis and a random forest model were used to explore the relationship between these indices and maize yield. Through the above series of studies, this article draws the following main conclusions:
(1) Extreme climate change during the reproductive period of maize in the Songnen Plain region during the 33 years from 1988 to 2020 was consistent, which was mainly manifested in the increase in the warm indices and wet indices and the decrease in the cold indices and drought indices.
(2) From a spatial perspective, the cold indices show a spatial pattern of being higher in the north and lower in the south and lower in the west and higher in the east, while the warm indices are the opposite. The extreme precipitation indices show a spatial pattern of being higher in the east and lower in the west.
(3) The maize yield and trend yield in the Songnen Plain showed a significant upward trend over time, while the meteorological yield and relative yield of maize showed a consistent trend over time, with a relatively large range of changes. There are three climate rich years (1988, 1990, 2002), two climate failure years (1989, 2013), and the rest are normal years in the 33-year period in the Songnen Plain.
(4) The correlation between extreme climate indices and maize yield is mainly manifested with extreme climate indices TN10p and TX10p being negatively correlated with maize yield, while TN90p, TX90p, CDD, CWD, R95p, R10, and SDII are positively correlated with maize yield, with TN10p, TN90p, and CWD passing the significance test. The importance of extreme climate indices on maize yield, in descending order, is as follows: TN90p > TN10p > CWD > TX90p > CDD > TX10P > R95P > SDII > R10, indicating that maize yield in the Songnen Plain is relatively sensitive to extreme temperature events.
This study reveals the spatiotemporal variation characteristics of extreme climate events in the Songnen Plain area and their impact on maize yield, providing scientific support for agricultural adaptive management and decision-making in the region. To provide a basis for reducing the adverse effects of extreme climate change on maize production and developing strategies to address climate risks. However, this study has not fully considered the changing characteristics of extreme climate events during different growth stages of maize and their correlation with maize yield. Therefore, future research needs to continue to improve the impact of extreme climate events on maize yield during different growth stages.

Author Contributions

Conceptualization, F.M., B.T., F.D. and H.Z.; data curation, F.M., B.T. and F.D.; formal analysis, F.M., B.T., F.D. and H.Z.; funding acquisition, F.M.; investigation, B.T. and B.M.; resources, F.M., B.T. and B.M.; software, B.T. and H.Z.; visualization, B.T., F.D. and B.M.; writing—original draft preparation, B.T.; writing—review and editing, F.M., B.T. and B.M. All authors have read and agreed to the published version of the manuscript.

Funding

This research has been supported by the Basic Scientific Research Fund of Heilongjiang Provincial Universities: (2022-KYYWF-1044), the National Nature Science Foundation of China Youth Fund (Grant No. 52109055), and Science Fund for Distinguished Young Scholars of Heilongjiang University (Natural Science) (JCL202105).

Data Availability Statement

The data presented in this study were derived from the following resources available in the public domain: China Meteorological Data Network (http://data.cma.cn/) and Heilongjiang Statistical Yearbook (https://tjj.hlj.gov.cn/).

Conflicts of Interest

The authors declare no conflicts of interest.

References

  1. Zhang, J.; Guan, Q.; Zhang, Z.; Shao, W.; Zhang, E.; Kang, T.; Xiao, X.; Liu, H.; Luo, H. Characteristics of spatial and temporal dynamics of vegetation and its response to climate extremes in ecologically fragile and climate change sensitive areas—A case study of Hexi region. Catena 2024, 239, 107910. [Google Scholar] [CrossRef]
  2. Yang, Y.; Zhao, N.; Yue, T. Spatio-temporal variations of extreme high temperature event in China from 1980 to 2018. Sci. Geogr. Sin. 2022, 42, 536–547. [Google Scholar] [CrossRef]
  3. IPCC. Climate Change 2013: Managing the Risks of Extreme Events and Disaster to Advance Climate Change Adaptation; Cambridge University Press: Cambridge, UK, 2013. [Google Scholar]
  4. Bai, H.; Xiao, D.; Tang, J.; Liu, D.L. Evaluation of wheat yield in North China Plain under extreme climate by coupling crop model with machine learning. Comput. Electron. Agric. 2024, 217, 108651. [Google Scholar] [CrossRef]
  5. Yang, Y.; Chang, W.; Zhang, X. Spatiotemporal Variation of Extreme Climate and Its Correlation with Cotton Production in Xinjiang. Chin. J. Agric. Resour. Reg. Plan. 2024, 1–18. Available online: https://link.cnki.net/urlid/11.3513.S.20240229.1413.014 (accessed on 17 September 2024).
  6. Sun, H.; He, M.; Hu, M. Impact of global climatic warming on agricultural production in China. Chin. J. Agric. Resour. Reg. Plan. 2015, 36, 51–57. [Google Scholar] [CrossRef]
  7. Stott, P.A. How climate change affects extreme weather events. Science 2016, 352, 1517–1518. [Google Scholar] [CrossRef]
  8. Sisco, M.R.; Bosetti, V.; Weber, E.U. When do extreme weather events generate attention to climate change? Clim. Chang. 2017, 143, 227–241. [Google Scholar] [CrossRef]
  9. Schmidt, M.; Felsche, E. The effect of climate change on crop yield anomaly in Europe. Clim. Resil. Sustain. 2024, 3, e61. [Google Scholar] [CrossRef]
  10. Gao, Y.; Chen, W. Spatial and Temporal Variation of Extreme Temperature and Grain Yield Response in Liaoning Province from 1984 to 2020. Sci. Geogr. Sin. 2021, 41, 2052–2062. [Google Scholar] [CrossRef]
  11. Sun, Y.; Fan, W.; Shi, P.; Wang, Z.; Sun, S. The regional difference of the influence of climate change and management factors on cotton yield in Hubei province. Geogr. Res. 2021, 40, 1064–1077. [Google Scholar] [CrossRef]
  12. Han, D.; Zhao, J.; Hu, Q.; Pan, X.; Wang, P.; Yi, G.; Guo, Y.; Wang, H.; He, H.; Chen, L. Analysis of crop yield variation characteristics in Northeast China and the response to meteorological drought. J. China Agric. Univ. 2021, 26, 188–200. [Google Scholar] [CrossRef]
  13. Xu, Y.; Li, X.; Ge, Q.; Hao, Z. Effect of meteorological drought on cotton yield in Central Asia. Acta Geogr. Sin. 2022, 77, 2338–2352. [Google Scholar]
  14. Dhillon, R.; Takoo, G.; Sharma, V.; Nagle, M. Utilizing Machine Learning Framework to Evaluate the Effect of Climate Change on Maize and Soybean Yield. Comput. Electron. Agric. 2024, 221, 108982. [Google Scholar] [CrossRef]
  15. Gao, J.; Liu, L.; Guo, L.; Sun, D.; Liu, W.; Hou, W.; Wu, S. Synergic effects of climate change and phenological variation on agricultural production and its risk pattern in black soil region of Northeast China. Acta Geogr. Sin. 2022, 77, 1681–1700. [Google Scholar]
  16. Misganaw, A.; Addisu, S.; Alemayhu, G.; Kesete, N.; Khan, H. Crop production in northwestern Ethiopian highlands under changing climate. Int. J. Climatol. 2023, 43, 5797–5812. [Google Scholar] [CrossRef]
  17. Luo, N.; Meng, Q.; Feng, P.; Qu, Z.; Yu, Y.; Liu, D.L.; Müller, C.; Wang, P. China can be self-sufficient in maize production by 2030 with optimal crop management. Nat. Commun. 2023, 14, 2637. [Google Scholar] [CrossRef]
  18. Zhang, L.; Huang, Q.; Zhao, H.; Wu, Y. Temporal and Spatial Characteristics of Land Ecological Vulnerability in Songnen Plain, Heilongjiang Province. Chin. J. Soil Sci. 2023, 54, 505–515. [Google Scholar] [CrossRef]
  19. Li, P.; Huang, Q.; Huang, S.; Leng, G.; Peng, J.; Wang, H.; Zheng, X.; Li, Y.; Fang, W. Various maize yield losses and their dynamics triggered by drought thresholds based on Copula-Bayesian conditional probabilities. Agric. Water Manag. 2022, 261, 107391. [Google Scholar] [CrossRef]
  20. Xu, K.; Zhu, X.; Liu, Y.; Guo, R.; Chen, L. Effects of drought on maize yield under climate change in China. Trans. Chin. Soc. Agric. Eng. (Trans. CSAE) 2020, 36, 149–158. [Google Scholar] [CrossRef]
  21. Fu, Q.; Zhou, Z.; Li, T.; Liu, D.; Hou, R.; Cui, S.; Yan, P. Spatiotemporal characteristics of droughts and floods in northeastern China and their impacts on agriculture. Stoch. Environ. Res. Risk Assess. 2018, 32, 2913–2931. [Google Scholar] [CrossRef]
  22. Ren, L.; Zhou, T.; Zhang, W. Attribution of the record-breaking heat event over Northeast Asia in summer 2018: The role of circulation. Environ. Res. Lett. 2020, 15, 054018. [Google Scholar] [CrossRef]
  23. Tao, P.; Zhang, Y. Large-scale circulation features associated with the heat wave over Northeast China in summer 2018. Atmos. Ocean. Sci. Lett. 2019, 12, 254–260. [Google Scholar] [CrossRef]
  24. Li, E.; Zhao, J.; Pullens, J.W.M.; Yang, X. The compound effects of drought and high temperature stresses will be the main constraints on maize yield in Northeast China. Sci. Total Environ. 2022, 812, 152461. [Google Scholar] [CrossRef] [PubMed]
  25. Pei, Z.; Wu, B. Spatial-Temporal Characteristics of Spring Maize Drought in Songnen Plain, Northeast China. Water 2023, 15, 1618. [Google Scholar] [CrossRef]
  26. Guo, S.; Guo, E.; Zhang, Z.; Dong, M.; Wang, X.; Fu, Z.; Guan, K.; Zhang, W.; Zhang, W.; Zhao, J.; et al. Impacts of mean climate and extreme climate indices on soybean yield and yield components in Northeast China. Sci Total Environ. 2022, 838, 156284. [Google Scholar] [CrossRef]
  27. Wang, Y.; Shen, X.; Jiang, M.; Lu, X. Vegetation Change and Its Response to Climate Change between 2000 and 2016 in Marshes of the Songnen Plain, Northeast China. Sustainability 2020, 12, 3569. [Google Scholar] [CrossRef]
  28. Meng, F.; Li, T.; Fu, Q.; Liu, D.; Yang, L. Study on the calculation model of regional rainwater resource potential and its temporal and spatial distribution. J. Hydraul. Eng. 2020, 51, 556–568. [Google Scholar] [CrossRef]
  29. Du, C.; Wang, T.; Nie, T.; Dai, C.; Li, T. Water Surplus Deficit and Irrigation Schedule of Maize Based on CROPWAT Model. Water Sav. Irrig. 2020, 8, 91–97. [Google Scholar]
  30. Zhang, S.; Zhang, Y.; Sun, L.; Ji, R.; Cai, F.; Wu, J.; Li, G. Analysis of Distributional Characteristics and Primary Causes of Maize Drought in Northeast China. Chin. J. Agrometeorol. 2013, 34, 350–357. [Google Scholar] [CrossRef]
  31. Zhang, Z.; Zhang, L.; Liu, Y.; Jin, M. Responses of annual streamflow variability to annual precipitation, extreme climate events and large-scale climate phenomena in the Qinghai-Tibet Plateau. J. Hydrol. 2024, 632, 130969. [Google Scholar] [CrossRef]
  32. Gao, X.; Tao, Z.; Dai, J. Significant influences of extreme climate on autumn phenology in Central Asia grassland. Ecol. Indic. 2023, 155, 111056. [Google Scholar] [CrossRef]
  33. Zhao, Y.; Zheng, R.; Zheng, F.; Zhong, K.; Fu, J.; Zhang, J.; Flanagan, D.C.; Xu, X.; Li, Z. Spatiotemporal distribution of agrometeorological disasters in China and its impact on grain yield under climate change. Int. J. Disaster Risk Reduct. 2023, 95, 103823. [Google Scholar] [CrossRef]
  34. Che, X.; Li, H.; Zhang, C.; Guo, D.; Shen, H. Impacts of Climate Change on Corn Yield in Jilin Province Since 1980s. Res. Soil Water Conserv. 2021, 28, 230–234+241. [Google Scholar] [CrossRef]
  35. Liu, L.; Gou, X.; Wang, X.; Yang, M.; Qie, L.; Pang, G.; Wei, S.; Zhang, F.; Li, Y.; Wang, Q.; et al. Relationship between extreme climate and vegetation in arid and semi-arid mountains in China: A case study of the Qilian Mountains. Agric. For. Meteorol. 2024, 348, 109938. [Google Scholar] [CrossRef]
  36. Xu, L.; Cui, X.; Bian, J.; Wang, Y.; Wu, J. Dynamic change and driving response of shallow groundwater level based on random forest in southwest Songnen Plain. J. Hydrol. Reg. Stud. 2024, 53, 101800. [Google Scholar] [CrossRef]
  37. Sun, Z.; Wang, G.; Li, P.; Wang, H.; Zhang, M.; Liang, X. An improved random forest based on the classification accuracy and correlation measurement of decision trees. Expert Syst. Appl. 2024, 237, 121549. [Google Scholar] [CrossRef]
  38. Elith, J.; Leathwick, J.R.; Hastie, T. A working guide to boosted regression trees. J. Anim. Ecol. 2008, 77, 802–813. [Google Scholar] [CrossRef]
  39. Li, X.; Xu, R. High-Dimensional Data Analysis in Cancer Research; Springer: Berlin/Heidelberg, Germany, 2009. [Google Scholar] [CrossRef]
  40. Han, T.; Yang, B.-S.; Lee, S.-J. Application of Random Forest Algorithm in Machine Fault Diagnosis. In Proceedings of the 1st World Congress on Engineering Asset Management, WCEAM 2006, Gold Coast, Australia, 11–14 July 2006. [Google Scholar] [CrossRef]
  41. Ren, Z.; Zhao, H.; Mu, X.; Xu, Q.; Shi, K.; Yang, G. Spatiotemporal variations of extreme weather events and climate drivers in the Three Gorges Reservoir Area and its surrounding regions from 1960 to 2020. Atmos. Res. 2024, 304, 107379. [Google Scholar] [CrossRef]
  42. Jiang, S.; Han, T.; Zhou, B.; Zhang, Q.; Hao, X.; Li, H. Characteristics of clustered heavy precipitation events at Northeast China and associated atmospheric circulations. Clim. Dyn. 2023, 61, 5935. [Google Scholar] [CrossRef]
  43. Wang, C.; Zhang, W.; Wang, J. The path analysis of spatial-temporal changes and productivity improvement of grain supply in china. Chin. J. Agric. Resour. Reg. Plan. 2023, 1–15. Available online: https://link.cnki.net/urlid/11.3513.S.20231117.1641.004 (accessed on 17 September 2024).
  44. Wang, Y.; Zhang, S.; Xu, Y.; Que, L.; Li, X.; Huang, Y.; Chen, X.; Wang, l. Meteorological drought and atmospheric circulation anomalies characteristics in Heilongjiang Province from May to September in recent 50 years. J. Arid Meteorol. 2023, 41, 540–549. [Google Scholar] [CrossRef]
  45. Lobell, D.B.; Field, C.B. Global scale climate–crop yield relationships and the impacts of recent warming. Environ. Res. Lett. 2007, 2, 014002. [Google Scholar] [CrossRef]
  46. Liu, D.; Zhang, J.; Zhao, L.; Zhao, S.; Cui, G. The positive impact of extreme heat on vegetation growth in Northeast Asia. Agric. For. Meteorol. 2024, 347, 109918. [Google Scholar] [CrossRef]
  47. Liu, X.; Fu, B. Drought impacts on crop yield: Progress, challenges and prospect. Acta Geogr. Sin. 2021, 76, 2632–2646. [Google Scholar]
  48. Liu, X.; Chang, X.; Wang, Y.; Wang, D.; Wang, X.; Meng, Q.; Wang, P. Adaptation to priming drought at six-leaf stage relieves maize yield loss to individual and combined drought and heat stressors around flowering. Environ. Exp. Bot. 2024, 224, 105799. [Google Scholar] [CrossRef]
  49. Liu, H.; Tang, X.; Yang, L. Approach for Evaluating Summer Maize Yield Losses under Extreme Rainfall Events:A Case Study in “7·20” Heavy Rain Event in Henan Province. J. Irrig. Drain. 2023, 42, 1–6. [Google Scholar] [CrossRef]
  50. Yan, G.; Qi, F.; Wei, L.; Aigang, L.; Yu, W.; Jing, Y.; Aifang, C.; Yamin, W.; Yubo, S.; Li, L.; et al. Changes of daily climate extremes in Loess Plateau during 1960–2013. Quat. Int. 2015, 371, 5–21. [Google Scholar] [CrossRef]
  51. Zhang, D.; Zheng, J.; Fan, J.; Fang, Z.; Ji, Q.; Yuan, Y.; Liu, W. Spatiotemporal Variations of Extreme Temperature Indices in Different Climatic Zones of China over the Past 60 Years. Chin. J. Agrometeorol. 2019, 40, 422–434. [Google Scholar] [CrossRef]
  52. Lang, X.; Sui, Y. Changes in mean and extreme climates over China with a 2 °C global warming. Chin. Sci. Bull. 2013, 58, 1453–1461. [Google Scholar] [CrossRef]
  53. Hou, W. The Method to Detect as Well as Assess the Extreme Climate Events and the Spatial and Temporal Characteristies of Changes of Temperature and Precipitation Extremes over China during the Second Half of the 20th Century. Ph.D. Thesis, Lanzhou University, Lanzhou, China, 2009. [Google Scholar]
  54. Li, S.; Lian, Y.; Chen, S.; Sun, Q.; Yao, Y. Distribution of Extreme Cool Events over Northeast China in Early Summer and the Related Dynamical Processes. Sci. Geogr. Sin. 2012, 32, 752–758. [Google Scholar] [CrossRef]
  55. Liang, F.; Liu, D.; Wang, W.; Zhang, F.; Yu, F. Temporal and spatial variability of summer extreme precipitation events in Northeast China during 1961-2013. Arid Land Geogr. 2016, 39, 565–572. [Google Scholar] [CrossRef]
  56. Zhou, G.; Dong, L.; Wang, H.; Liu, D. Overview of typhoon activities over western North Pacific and the South China Sea in 2020. J. Mar. Meteorol. 2021, 41, 1–10. [Google Scholar] [CrossRef]
  57. Li, H.; Luan, C.; Xia, X.; Chen, C.; Sun, R.; Wang, H.; Li, B. Prediction of future extreme precipitation scenarios in China based on CMIP6 climate model. Water Resour. Hydropower Eng. 2023, 54, 16–29. [Google Scholar] [CrossRef]
  58. Du, H. Research on the Extreme Climate Events over Northeast China under Global Climate Change. Ph.D. Thesis, Northeast Normal University, Changchun, China, 2015. [Google Scholar]
  59. Zhao, J.; Yang, X.; Liu, Z. Influence of climate warming on serious low temperature and cold damage and cultivation pattern of spring maize in Northeast China. Acta Ecol. Sin. 2009, 29, 6544–6551. [Google Scholar]
  60. Yin, X.; Wang, M.; Kong, Q.; Wang, Z.; Zhang, H.; Chu, Q.; Wen, X.; Chen, F. Impacts of high temperature on maize production and adaptation measures in Northeast China. Chin. J. Appl. Ecol. 2015, 26, 186–198. [Google Scholar] [CrossRef]
  61. Wang, T.; Li, N.; Li, Y.; Lin, H.; Yao, N.; Chen, X.; Li Liu, D.; Yu, Q.; Feng, H. Impact of climate variability on grain yields of spring and summer maize. Comput. Electron. Agric. 2022, 199, 107101. [Google Scholar] [CrossRef]
  62. Bi, X.; Liu, X.; Ma, D.; Liu, J. Lag response of vegetation NDVI to climate factors in Liaoning Province. Chin. J. Agric. Resour. Reg. Plan. 2021, 42, 233–244. [Google Scholar]
  63. Akpa, A.F. The effects of climate extreme events on selected food crop yields in Sub-Saharan Africa. Heliyon 2024, 10, e30796. [Google Scholar] [CrossRef]
  64. Vogel, E.; Donat, M.G.; Alexander, L.V.; Meinshausen, M.; Ray, D.K.; Karoly, D.; Meinshausen, N.; Frieler, K. The effects of climate extremes on global agricultural yields. Environ. Res. Lett. 2019, 14, 054010. [Google Scholar] [CrossRef]
Figure 1. Study area and distribution of stations.
Agronomy 14 02128 g001
Figure 2. Time variation trend for extreme climate indices during the maize growth period. (a) TN10p; (b) TN90p; (c) TX10p; (d) TX90p; (e) CDD; (f) CWD; (g) R95p; (h) R10; (i) SDII.
Agronomy 14 02128 g002aAgronomy 14 02128 g002b
Figure 3. Trend and mean spatial distribution of extreme climate indices changes during maize growth period from 1988 to 2020. (a) TN10p; (b) TN90p; (c) TX10p; (d) TX90p; (e) CDD; (f) CWD; (g) R95p; (h) R10; (i) SDII.
Agronomy 14 02128 g003
Figure 4. Changes in maize production in the Songnen Plain from 1988 to 2020. (a) yield; (b) trend yield; (c) meteorological yield; (d) relative yield.
Agronomy 14 02128 g004
Figure 5. Correlation coefficients of extreme climate indices during maize growth period in Songnen Plain.
Agronomy 14 02128 g005
Figure 6. Polynomial fitting curve of extreme climate indices and maize yield in Songnen Plain from 1988 to 2020. (a) TN10p; (b) TN90p; (c) TX10p; (d) TX90p; (e) CDD; (f) CWD; (g) R95p; (h) R10; (i) SDII.
Agronomy 14 02128 g006
Figure 7. Results of random forest algorithm weight assessment of extreme climate indices during maize fertility in Songnen Plain.
Agronomy 14 02128 g007
Table 1. Definition of extreme temperature indicators.
NameAbbreviationDefineUnit
Number of Cold NightsTN10pThe number of days with the lowest temperature below the 10th percentiled
Number of Warm Night DaysTN90pThe number of days with the lowest temperature >90th percentiled
Number of Cold DaysTX10pThe number of days with the highest temperature below the 10th percentiled
Number of Warm DaysTX90pThe number of days with the highest temperature >90th percentiled
Continuous Drought DaysCDDThe longest consecutive days with precipitation less than 1 mmd
Continuous Wet DaysCWDThe longest consecutive days with precipitation ≥1 mmd
Heavy PrecipitationR95pTotal precipitation >95th percentilemm
Number of Days with Heavy RainfallR10The number of days with daily precipitation ≥10 mmd
Daily Precipitation IntensitySDIIThe ratio of total precipitation to days with a precipitation of ≥1 mmmm/d
Disclaimer/Publisher’s Note: The statements, opinions and data contained in all publications are solely those of the individual author(s) and contributor(s) and not of MDPI and/or the editor(s). MDPI and/or the editor(s) disclaim responsibility for any injury to people or property resulting from any ideas, methods, instructions or products referred to in the content.

