Abstract
Assessing salt tolerance in plants under field conditions is a challenging task. The objective of this research was to assess the effectiveness of different methods (leaf disc assay and pot experiment) for evaluating salt tolerance in rice. Using two varieties with different salt tolerance, Changmaogu (CM) and 9311, under three NaCl levels (0, 0.3%, and 1.0%), we evaluated the photosynthetic performance in terms of chlorophyll content in leaf disc assays, as well as the photosynthetic rate (Pn), chlorophyll content, linear electron flow (LEF), and non-photochemical quenching (NPQ), in a semi-controlled pot experiment. In the leaf disc assay, CM showed a smaller decrease in chlorophyll content compared to 9311, especially under 1.0% salinity. Simultaneously, in the pot experiment, the CM variety employed flexible photosynthetic strategies, actively decreasing LEF and Pn after 5 days of salt stress (day 5) and then increasing photosynthetic capacity (chlorophyll content, LEF, and Pn) on day 10. Notably, the total chlorophyll content for the CM variety under 1.0% salinity was significantly higher than in the control, showing a 25.0% increase. Additionally, CM demonstrated NPQt sensitivity under 0.3% salinity, requiring an LEF of 150 to achieve an NPQt value of 3.0, compared to an LEF of 180 in the control. These results suggest that a simple leaf disc assay may not fully capture the adaptive mechanisms of rice plants under salinity stress. Therefore, we advocate for the use of more comprehensive methods, such as outdoor pot or field experiments, to gain a deeper understanding and more accurate evaluation of salt tolerance in rice.
1. Introduction
Crop yield potential is determined by the light conversion efficiency (εc); however, only one-fifth of the maximum efficiency in C3 crops (e.g., wheat and rice) was achieved [1,2]. Environmental stressors, such as salinity, cause the actual yield to deviate further from the set point of the maximum theoretical crop yield. Understanding the effects of these stressors is essential for developing strategies to enhance crop resilience and improve yield under suboptimal conditions.
Salinity has a direct impact on plant growth. It consists of two main elements: osmotic component and ionic component [3]. Osmotic stress lowers the water potential, making it more difficult for plants to extract water, mimicking drought conditions. On the other hand, ionic stress disrupts the absorption of essential nutrients such as K+ and Ca2+, leading to ion imbalance and toxicity from ions like Na+ and Cl− [4]. These compounded stresses take a heavy toll on photosynthetic capacity [5], which is closely linked to several critical factors [6,7]: reduced chlorophyll biosynthesis [8], increased stomatal closure [9], restricted electron flow to photosystem I (PSI) [10], altered enzymatic activities [11] and enhanced non-photochemical quenching (NPQ) for photoprotection [12]. Osmotic stress primarily causes rapid stomatal closure, limiting CO2 intake [13], while ionic stress hinders the efficient use of captured energy in electron transport, resulting in the downregulation of electron transfer processes [14].
Experimental assessments of salt tolerance have been conducted using methods such as leaf disc arrays [15,16] and pot experiments [17,18]. The advantage of the leaf disc assay is that it requires less sample preparation time and allows for rapid replication [19]. While many breeding studies utilize leaf disc assays alone or in combination with other methods to study the response to salt stress [20,21,22,23,24,25], most research focuses on the outcomes of salt tolerance rather than directly comparing assessment methodologies.
Rice (Oryza sativa L.), a staple food crop for more than half the world’s population, is economically vital but highly sensitive to salt stress [26]. However, comparative studies between leaf disc assays and pot experiments in rice are rare. To address whether different assessment methods yield consistent conclusions about salt tolerance, we selected two rice varieties with different salt sensitivities. The 9311 variety, one of the parent lines for superhybrid rice, showed sensitivity to salt stress [27]. In contrast, Changmaogu (CM), a seawater-adapted rice landrace, exhibits far superior salt tolerance compared to even the popular salt-tolerant rice cultivar Pokkali [28]. Salt tolerance in plants involves two primary mechanisms: (1) buffering against stress-induced damage and (2) repairing damage to restore normal function [7,29,30]. We expected that the two methods for assessing salt tolerance in rice would yield consistent results.
2. Materials and Methods
2.1. Plant Materials and Growing Conditions
The experiment was conducted in Guangdong Ocean University, China (21.27° N, 110.32° E). Two rice (Oryza Sativa L.) varieties were used for the experiment: 9311 and CM. The 9311 variety is a widely cultivated indica rice variety, while CM is a salt-tolerant landrace. When the 4th true leaf appeared, rice seedlings were transplanted into outdoor plastic pots (19 cm in diameter) with 3 kg of clay soil, with two plants per pot. The soil properties were as follows: soil organic carbon, 32.4 g/kg; available phosphorus, 4.0 mg/kg; available potassium, 48.4 mg/kg; alkali-hydrolyzable nitrogen, 37.1 mg/kg; and soil pH, 7.23. Before the experiment began, all plants were well grown (9 pots/cultivar).
2.2. Leaf Disc Assays
During the tillering stage, 0.6 cm diameter leaf discs were punched out and floated in different NaCl levels (0, 0.3%, and 1.0%) in 96-well plates [15]. These leaf discs were initially transferred to a chamber with LED plant growth lamps (temperature, 25 °C; light intensity, ~25,000 lux; treated time, 8 h) and then transferred to an artificial greenhouse with Nano plant growth lamps (RT JM-150W, Rongtai Electric Lighting Co., Ltd., Jiyuan City, China) under the following growth conditions: temperature, 25 °C; light intensity, ~2300 lux; with 12 h light/12 h dark for 3 days. The effect of various salt treatments on leaf discs was observed by monitoring chlorophyll content following the procedure in [31]. Leaf samples were homogenized in 80% (v/v) acetone, and the absorbance was measured at 663 and 645 nm using a spectrophotometer (GENESYS 180 UV–Vis, Thermo Fisher Scientific, Waltham, MA, USA).
2.3. Outdoor Pot Experiment
Three salinity levels (0, 0.3%, and 1%) based on the volume of pot water were established. The plants were irrigated twice a day using the weighing method, maintaining the weight of the pot at 4.2 kg with 1–2 cm of water level. Soil salinity was measured using a hand-held SKD1688-TR-6 EC meter (Shunkeda Technology Co., Ltd., Beijing, China), with the soil EC in CK, 0.3%, and 1.0% treatments found to be 200, 1700, and 4600 µS/cm, respectively.
2.3.1. Photosynthetic Measurements
During the measurement period (5th and 10th day), the youngest fully expanded leaf in the main culm was measured to evaluate the physiological response to salt stress using a portable gas exchange system (LI-6800, LI-COR Biosciences, Lincoln, NE, USA) equipped with a Multiphase FlashTM fluorometer circular chamber (6800-01A, LI-COR Biosciences, Lincoln, NE, USA). Within the cuvette, the light was set as 1500 μmol photons m−2 s−1 (90% red/10% blue), Txchg 30 °C, flow rate 500 µmol s−1, CO2 was maintained at 400 µmol mol−1, and water vapor pressure deficit (VPD) was set at 1.5 kPa (60–75% relative humidity). Each recorded value (light-adapted chlorophyll fluorescence [F] and gas exchange parameters) required a light acclimation time of at least 5 min to achieve a relatively steady state (dF/dt approaching 0). The dark-adapted chlorophyll fluorescence parameter Fv/Fm (maximum quantum efficiency of photosystem II [PSII]) was measured at predawn. Healthy, unstressed plants had a conservative value for the maximum photosynthetic efficiency (Fv/Fm~0.83) in C3 plants [32]. In addition, the “potential activity” of PSII (Fv/Fo) was also calculated [33].
The physiological parameters, including net photosynthetic rate (Pn) and linear electron flow (LEF), were measured at midday. Fluorescence parameters were calculated using the following formulas [34]:
where Fm′ is the maximum chlorophyll fluorescence yield in light-adapted leaves; Fs is the steady state fluorescence yield in light; and α, β, and PAR correspond to leaf absorbance (0.84), the fraction of photons partitioned to PSII versus PSI (0.5), and the incident photosynthetically active radiation (PAR), respectively [35].
LEF = ΦPSII × α× β× PAR
To characterize plant flexibility, the LEF response pattern (LEFrp) was directly evaluated under light-adapted conditions. Its calculation can be expressed as follows:
where LEFTRE is the recorded ETR value at 0.3% or 1.0% salinity levels, and LEFAVE-CK is the average LEF value in the control plant (CK). Within the CK group, each data point was calibrated with its average value, and comparisons were made among the three groups to calculate the response ratio.
2.3.2. MultispeQ Measurement
MultispeQ v2.0 (Photosynthesis RIDES 2.0 protocol) [36] was used to study rice photoprotection capacity by determining NPQ. In addition, we also focused on NPQ sensitivity under ambient conditions during the day, defined as the responsiveness of NPQ to LEF [37]. The instrument combines a fluorometer, a chlorophyll meter, and a spectrometer [38], but in our study, only the function for determining PSII fluorescence parameters was utilized. Instead of NPQ, the instrument presented the NPQt parameter.
2.3.3. Pigment Analysis in Pot Experiment
Leaf discs with a diameter of 0.6 cm were punched out and subjected to measurements, as previously described. Specifically, the leaf samples were homogenized in 80% (v/v) acetone, and absorbance was measured at 663 nm and 645 nm using a spectrophotometer (Epoch, BioTek, Winooski, VT, USA).
2.3.4. Biomass Determination
Plants were harvested at the end of the experiment to obtain growth indicators. The dry mass of the roots and shoots was measured using a weighing scale. Then, the root-to-shoot (R/S) ratio was calculated, providing insights into the plant’s resource allocation strategy.
2.4. Statistical Analysis
Data were subjected to statistical analysis of variance (ANOVA) using SPSS 23.0 (SPSS Corp., Chicago, IL, USA). Differences between means were evaluated by Duncan’s test at p < 0.05 or p < 0.1 significance level.
3. Results
3.1. Pigment Analysis for Leaf Disc Arrays
Following the salt gradient, a noticeable “yellowing” gradient was observed in both varieties (Figure 1). The chlorophyll contents were measured to quantify such changes (Figure 2). The results showed that chlorophyll contents exhibited a significant downward trend, decreasing by 26.7% and 49.3% in 9311 and 32.3% and 43.0% in CM at salinity levels of 0.3% and 1.0%, respectively.
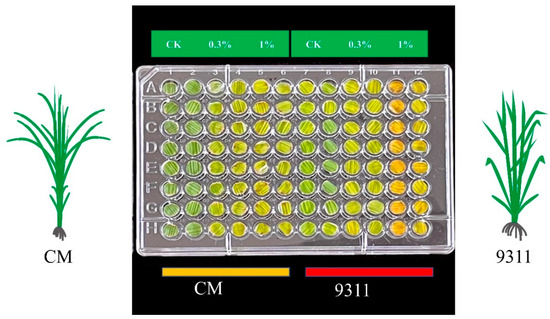
Figure 1.
Phenotype in leaf disc arrays. Each treatment includes 16 leaf discs arranged in a 96-well plate.
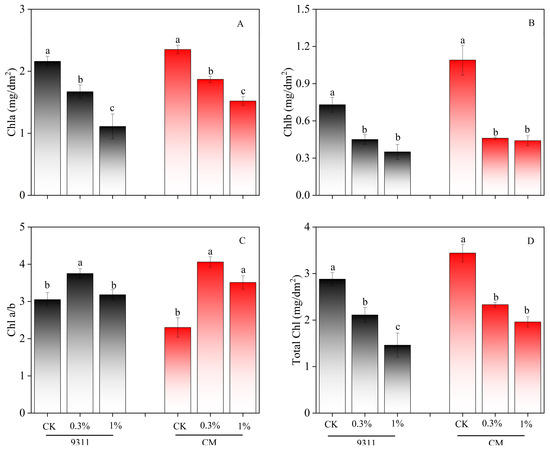
Figure 2.
Effect of salt stress on chlorophyll content in leaf disc experiment. (A) The chl a content, (B) The chl b content, (C) The chl a/b ratio, and (D) The total chl content. Mean ± SE of six replicates. Different letters indicate significant differences (p < 0.05).
3.2. Photosynthetic Performance during Salt Stress
By the 5th day, Pn decreased by 42.9% in CM (p < 0.05), whereas 9311 also showed a declining trend under 1.0% salinity stress, but the difference was not statistically significant (Figure 3A). By the 10th day, no significant differences in Pn were observed among the salt treatments for either variety (Figure 3B). Additionally, no statistically significant differences in Fv/Fo and Fv/Fm were found on the 5th day across different salt levels in both varieties (Figure 3C–F). By the 10th day, Fv/Fo in 9311 decreased by 8.8% under 1.0% salinity stress compared to CK (p < 0.05). Nevertheless, Fv/Fm values remained above 0.8 for both varieties, despite differences observed in 9311 (p < 0.05), indicating no photoinhibition throughout the experiment (Figure 3E,F).
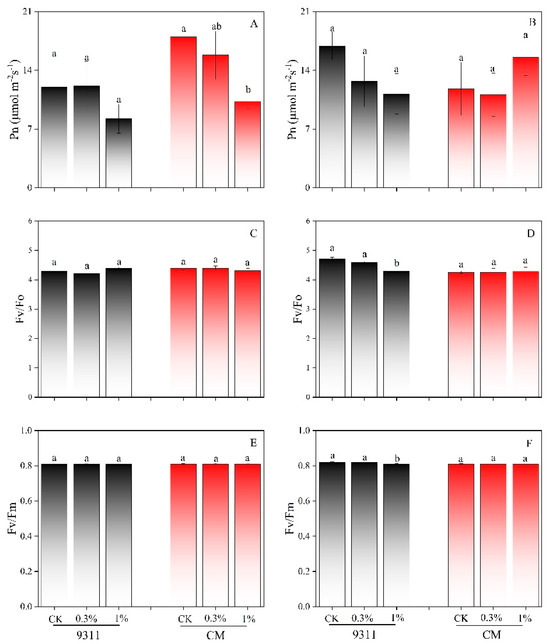
Figure 3.
Effect of salt stress on photosynthetic rate (Pn) (A,B), Fv/Fo (C,D), and Fv/Fm (E,F) in the 5th and 10th day in the outdoor pot experiment (n = 3). Different letters indicate significant differences (p < 0.05).
Similar to Pn, the LEF for the CM variety under 1.0% salinity on day 5 was significantly different from CK, with a LEF response ratio of −0.26 (p < 0.1) (Figure 4A). On day 10, the LEF for the 9311 variety under 1.0% salinity was significantly reduced compared to CK, showing a 21.7% decrease (Figure 4B). Interestingly, CM exhibited a ‘recovery effect’ in LEF under 1.0% salinity on day 10, with a 52.3% increase compared to CK (p < 0.1).
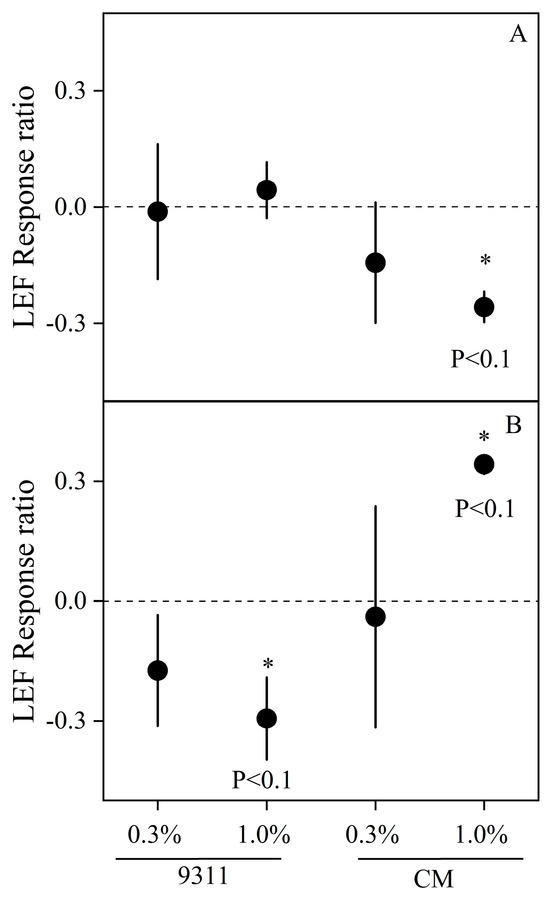
Figure 4.
Effect of salt stress on LEF response ratio during the pot experiment on days 4 (A) and 10 (B) of the outdoor experiment. Mean ± SE of three replicates. * indicate significant differences (p < 0.1).
On day 10, the contents of chlorophyll a, chlorophyll b, and total chlorophyll for the CM variety under 1.0% salinity were significantly higher than those in CK, showing increases of 23.7%, 31.0%, and 25.0%, respectively (Table 1). However, no difference was found in the chlorophyll content of the 9311 variety.

Table 1.
The effect of salt treatment by variety interaction on chlorophyll a, b, a/b and total chlorophyll contents on the 10th day.
3.3. Photoprotection
MultispeQ measurements were conducted in the morning (9:30–11:30 a.m.) on the 5th day for rice populations subjected to different salinity levels. The results indicated that CM showed NPQt sensitivity under 0.3% salinity (Figure 5B). To achieve an NPQt value of 3.0, the required LEF values were 180 for CK, 150 for 0.3% salinity, and 170 for 1.0% salinity (Figure 5B). In contrast, the 9311 variety did not demonstrate similar flexibility.
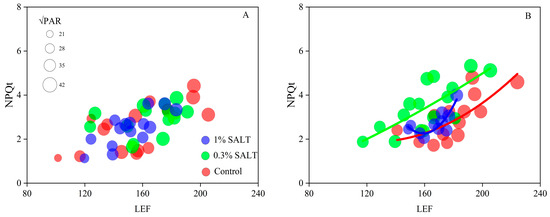
Figure 5.
The relationship between LEF and NPQt. Natural photosynthesis in the rice population was measured at day 5 by MultispeQ 2.0 in 9311 (A) and CM (B).
3.4. Effect of Salt Stress on Rice Biomass
The phenotypic results showed that salt stress slightly promoted rice growth, especially under low salt levels (Figure 6). Low salt resulted in a 1.2% increase in the biomass of 9311, while the biomass of CM increased by 12.6% compared to CK. Rice seedlings did not show a functional partitioning response (R/S) among salt treatments. However, when comparing cultivars, R/S in 9311 was higher than that in CM in all treatments.
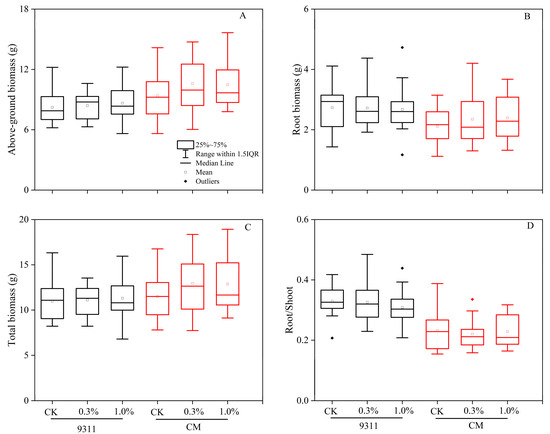
Figure 6.
Effect of salt on rice growth in the pot experiment. Measurements of above-ground biomass (A), root biomass (B), total biomass (C), and root/shoot ratio (D).
4. Discussion
4.1. Comparison between Two Assessment Methods
Can leaf disc assays predict the photosynthetic performance observed in pot experiments? Our findings suggest that leaf disc assays have limited applicability to outdoor pot experiments. This limitation is highlighted by the inability of the leaf disc assay to demonstrate the increase in the total chlorophyll content observed in the CM variety during the pot experiment on day 10 (Table 1). Compared to outdoor pot experiments, leaf disc assays may have three main disadvantages:
(1) Controlled environment limitations: leaf disc assays often take place in controlled chamber settings, which might not accurately mimic the natural environmental conditions. This method primarily focuses on isolated leaf tissues rather than the whole plant system.
(2) Consistency of salinity levels: In outdoor pot or field experiments, the level of salinity can exhibit spatial and temporal variation [18], while in leaf disc assays, the solution maintains a constant salinity level.
(3) Short-term vs. long-term responses: leaf disc assays typically evaluate short-term responses to salt stress, whereas pot experiments can reflect long-term effects and adaptations.
Therefore, we suggest that leaf disc assays are not as efficient for screening genotypes for salt tolerance compared to outdoor pot experiments.
4.2. Photosynthesis Adaptation
Photosynthetic declines induced by salt stress have been frequently observed [39,40]. Interestingly, the CM variety exhibited dynamic regulation in response to high salt stress, with a decrease in electron transport capacity and photosynthetic rate on day 5, followed by an increase on day 10 (Table 1; Figure 3 and Figure 4). This response differs from the salt-tolerant Pokkali cultivar, which shows increased photosynthesis under salt stress [41]. However, this does not preclude the possibility of a similar response, as the latter study only measured photosynthesis once. Furthermore, such changeable responses are plausible. For example, Chutimanukul et al. [42] reported that the CSSL16 rice cultivar initially displayed the highest NPQ after 6 days of salt stress and then exhibited higher LEF and ΦPSII and lower NPQ after 18 days of exposure. In fact, this dynamic response is not unexpected. Recent perspectives suggest that photosynthetic acclimation requires several days to be fully established, ultimately leading to a new steady state of photosynthetic activity [43].
Moreover, the observed changes in Fv/Fm and Fv/Fo provide further evidence of PSII’s photoacclimation to salt stress. Although the Fv/Fm value under 1% salinity in 9311 was lower than the control (p < 0.05), it remained close to that of CK and above the critical threshold of 0.80, indicating that photoinhibition did not occur at this salinity level (Figure 3F). Additionally, Fv/Fo, a parameter known to be more sensitive to stress than Fv/Fm [44], exhibited a significant decrease under 1% salinity on day 10 in 9311, while it remained stable in CM (Figure 3C,D and Figure 7). This suggests that PSII potential activity was more compromised in 9311 under high salinity, whereas CM, a salt-tolerant variety, experienced less damage. Therefore, it is reasonable to conclude that CM’s superior tolerance to salt stress likely mitigates damage to its photosynthetic machinery, particularly PSII. This finding aligns with previous research [28], which revealed that higher salinity tolerance in CM during the seedling stage was related to the action of the OsPP2C8 gene, a key regulator of stress-responsive signaling pathways. Such genetic factors may contribute to the enhanced protection of PSII in CM under salt stress, helping to sustain electron transport and maintain higher photosynthetic performance under challenging conditions.
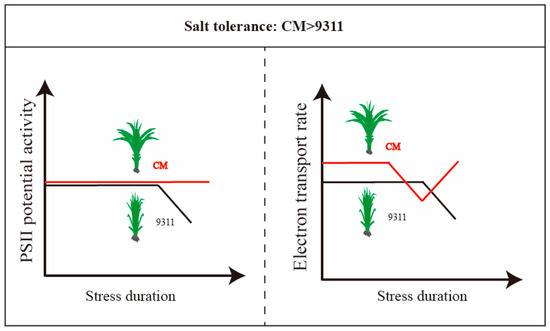
Figure 7.
PSII potential activity and electron transport rate demonstrate higher salt tolerance in CM.
4.3. Photoprotection Flexibility in Variety CM
Salt-stressed plants would reduce the size of the photosynthetic CO2 assimilation pool and make the plant susceptible to absorbing excess light [45]. Consequently, the excessive accumulation of reactive oxygen species (ROS) inhibits PSII repair [46]. Under this scenario, a higher protective capacity confers a net benefit to salt tolerance and plant growth.
NPQ is a common photoprotective molecular mechanism in plants [47]. Interestingly, we found that the CM variety showed NPQt sensitivity, requiring a smaller LEF to achieve a higher NPQt (Figure 5B). In previous reports, NPQ sensitivity was mainly explained by ATP synthase and the variable partitioning of proton motive force (pmf) [48]. Lowering the turnover rate of ATP synthase, i.e., decreasing the conductivity to proton efflux, would increase the pmf value for a given proton flux. pmf contains the electric field component (Δψ) and pH gradient component (ΔpH), while ΔpH is necessary for NPQ initiation [49]. Consequently, variations in the partitioning of the ΔpH component within pmf (ΔpH/pmf) can modulate the sensitivity of photoprotection. In this study, the observed NPQ sensitivity could be attributed to one or both of these factors.
4.4. Correlation between Fv/Fm and Chlorophyll a/b Ratio
Common adjustments to oxidative damage include a reduction in the total chlorophyll per unit leaf area and an increase in the chlorophyll a/b ratio. This photoprotection mechanism helps to reduce light absorbance [50]. Fritschi et al. [51] indicated that chlorophyll a/b is positively correlated with the ratio of PSII cores to the light-harvesting chlorophyll protein complex. Fv/Fm is relatively conservative in plant species (0.80~0.83), even under mild and moderate stress conditions [52,53]. In our study, we observed no instances of Fv/Fm dropping below 0.80 in either variety during salt stress. However, we did detect a significant decrease in the chlorophyll a/b ratio in salt-stressed CM rice on the 10th day (Table 1). Although a previous study reported a close positive correlation between Fv/Fm and the chlorophyll a/b ratio in rice [54], our findings did not support this relationship. It is noteworthy that fluorescence parameters are sensitive to changes in the chlorophyll a/b ratio [55]. On day 10, the increased synthesis of chlorophyll b relative to chlorophyll a might be a contributing factor to these inconsistencies [39].
5. Conclusions
In this study, CM was identified as the salt-tolerant variety (Figure 7). Although progress has been made in the evaluation of plant salt tolerance, there is still no universally accepted or standardized criterion for assessing this complex trait. Our findings underscore the limitations of leaf disc assays, which fail to capture the dynamic physiological and adaptive responses of rice plants to salinity stress. To more accurately assess salt tolerance, we recommend conducting outdoor pot or field experiments at the whole-plant level. Such approaches provide a more holistic view of a plant’s ability to adjust and thrive under saline conditions, offering critical insights for the selection and breeding of salt-tolerant rice varieties.
Author Contributions
Conceptualization, G.Z., N.F. and D.Z.; methodology, G.Z. and R.Z.; investigation, G.Z. and R.Z.; writing—original draft preparation, G.Z.; writing—review and editing, G.Z., R.Z., N.F. and D.Z.; supervision, D.Z. and N.F.; project administration, D.Z. and N.F.; funding acquisition, D.Z. and N.F. All authors have read and agreed to the published version of the manuscript.
Funding
This study was supported by the Special projects in key areas of ordinary colleges of the Educational Commission of Guangdong Province (2021ZDZX4027); the Innovation Team Project of ordinary colleges of the Educational Commission of Guangdong Province (2021KCXTD011); the Research start-up project of the Guangdong Ocean University (R20046); and the Research start-up project of the Guangdong Ocean University (060302052012).
Data Availability Statement
The datasets presented in this study are included in the main text; further inquiries can be directed to the corresponding author.
Acknowledgments
We thank all our colleagues in Zheng’s laboratory for their support and assistance.
Conflicts of Interest
The authors declare no conflicts of interest.
References
- Long, S.P.; Marshall-Colon, A.; Zhu, X.G. Meeting the global food demand of the future by engineering crop photosynthesis and yield potential. Cell 2015, 161, 56–66. [Google Scholar] [CrossRef] [PubMed]
- Zhu, X.G.; Long, S.P.; Ort, D.R. Improving photosynthetic efficiency for greater yield. Annu. Rev. Plant Biol. 2010, 61, 235–261. [Google Scholar] [CrossRef]
- Ma, Y.; Dias, M.C.; Freitas, H. Drought and salinity stress responses and microbe-induced tolerance in plants. Front. Plant Sci. 2020, 11, 591911. [Google Scholar] [CrossRef]
- Tavakkoli, E.; Fatehi, F.; Coventry, S.; Rengasamy, P.; McDonald, G.K. Additive effects of Na+ and Cl–ions on barley growth under salinity stress. J. Exp. Bot. 2011, 62, 2189–2203. [Google Scholar] [CrossRef]
- Zhang, Y.; Kaiser, E.; Li, T.; Marcelis, L.F.M. NaCl affects photosynthetic and stomatal dynamics by osmotic effects and reduces photosynthetic capacity by ionic effects in tomato. J. Exp. Bot. 2022, 73, 3637–3650. [Google Scholar] [CrossRef] [PubMed]
- Zahra, N.; Al Hinai, M.S.; Hafeez, M.B.; Rehman, A.; Wahid, A.; Siddique, K.H.; Farooq, M. Regulation of photosynthesis under salt stress and associated tolerance mechanisms. Plant Physiol. Biochem. 2022, 178, 55–69. [Google Scholar] [CrossRef] [PubMed]
- Acosta-Motos, J.R.; Ortuño, M.F.; Bernal-Vicente, A.; Diaz-Vivancos, P.; Sanchez-Blanco, M.J.; Hernandez, J.A. Plant responses to salt stress: Adaptive mechanisms. Agronomy 2017, 7, 18. [Google Scholar] [CrossRef]
- Yang, Z.; Li, J.L.; Liu, L.N.; Xie, Q.; Sui, N. Photosynthetic regulation under salt stress and salt-tolerance mechanism of sweet sorghum. Front. Plant Sci. 2020, 10, 1722. [Google Scholar] [CrossRef]
- Hedrich, R.; Shabala, S. Stomata in a saline world. Curr. Opin. Plant Biol. 2018, 46, 87–95. [Google Scholar] [CrossRef]
- Yan, K.; Mei, H.; Dong, X.; Zhou, S.; Cui, J.; Sun, Y. Dissecting photosynthetic electron transport and photosystems performance in Jerusalem artichoke (Helianthus tuberosus L.) under salt stress. Front. Plant Sci. 2022, 13, 905100. [Google Scholar] [CrossRef]
- He, Y.; Yu, C.; Zhou, L.; Chen, Y.; Liu, A.; Jin, J.; Hong, J.; Qi, Y.; Jiang, D. Rubisco decrease is involved in chloroplast protrusion and Rubisco-containing body formation in soybean (Glycine max.) under salt stress. Plant Physiol. Biochem. 2014, 74, 118–124. [Google Scholar] [CrossRef] [PubMed]
- Stepien, P.; Johnson, G.N. Contrasting responses of photosynthesis to salt stress in the glycophyte Arabidopsis and the halophyte Thellungiella: Role of the plastid terminal oxidase as an alternative electron sink. Plant Physiol. 2009, 149, 1154–1165. [Google Scholar] [CrossRef] [PubMed]
- Majidian, P.; Ghorbani, H. Salinity Stress in Plants: Challenges in View of Physiological Aspects, In Abiotic Stress in Crop Plants-Ecophysiological Responses and Molecular Approaches; IntechOpen: London, UK, 2024. [Google Scholar]
- Chowaniec, K.; Rola, K. Evaluation of the importance of ionic and osmotic components of salt stress on the photosynthetic efficiency of epiphytic lichens. Physiol. Mol. Biol. Plants 2022, 28, 107–121. [Google Scholar] [CrossRef] [PubMed]
- Aziz, A.; Martin-Tanguy, J.; Larher, F. Salt stress-induced proline accumulation and changes in tyramine and polyamine levels are linked to ionic adjustment in tomato leaf discs. Plant Sci. 1999, 145, 83–91. [Google Scholar] [CrossRef]
- Pérez-Alfocea, F.; Larher, F. Sucrose and proline accumulation and sugar efflux in tomato leaf discs affected by NaCl and polyethylene glycol 6000 iso-osmotic stresses. Plant Sci. 1995, 107, 9–15. [Google Scholar] [CrossRef]
- Ledesma, F.; Lopez, C.; Ortiz, D.; Chen, P.; Korth, K.L.; Ishibashi, T.; Zeng, A.; Orazaly, M.; Florez-Palacios, L. A simple greenhouse method for screening salt tolerance in soybean. Crop Sci. 2016, 56, 585–594. [Google Scholar] [CrossRef]
- Kakar, N.; Jumaa, S.H.; Redoña, E.D.; Warburton, M.L.; Reddy, K.R. Evaluating rice for salinity using pot-culture provides a systematic tolerance assessment at the seedling stage. Rice 2019, 12, 57. [Google Scholar] [CrossRef]
- Kasote, D.M.; Jayaprakasha, G.K.; Patil, B.S. Leaf disc assays for rapid measurement of antioxidant activity. Sci. Rep. 2019, 9, 1884. [Google Scholar] [CrossRef]
- Goel, D.; Singh, A.K.; Yadav, V.; Babbar, S.B.; Murata, N.; Bansal, K.C. Transformation of tomato with a bacterial codA gene enhances tolerance to salt and water stresses. J. Plant Physiol. 2011, 168, 1286–1294. [Google Scholar] [CrossRef]
- Baloda, A.; Madanpotra, S.; Aiwal, P. Transformation of mungbean plants for salt and drought tolerance by introducing a gene for an osmoprotectant glycine betaine. J. Plant Stress Physiol. 2017, 3, 5–11. [Google Scholar] [CrossRef]
- Bhomkar, P.; Upadhyay, C.P.; Saxena, M.; Muthusamy, A.; Prakash, N.S.; Pooggin, M.; Hohn, T.; Sarin, N.B. Salt stress alleviation in transgenic Vigna mungo L. Hepper (blackgram) by overexpression of the glyoxalase I gene using a novel Cestrum yellow leaf curling virus (CmYLCV) promoter. Mol. Breed. 2008, 22, 169–181. [Google Scholar] [CrossRef]
- Yadav, N.S.; Shukla, P.S.; Jha, A.; Agarwal, P.K.; Jha, B. The SbSOS1 gene from the extreme halophyte Salicornia brachiata enhances Na+ loading in xylem and confers salt tolerance in transgenic tobacco. BMC Plant Biol. 2012, 12, 188. [Google Scholar] [CrossRef] [PubMed]
- Yang, Y.; Tang, R.J.; Jiang, C.M.; Li, B.; Kang, T.; Liu, H.; Zhao, N.; Ma, X.J.; Yang, L.; Chen, S.L. Overexpression of the P t SOS 2 gene improves tolerance to salt stress in transgenic poplar plants. Plant Biotechnol. J. 2015, 13, 962–973. [Google Scholar] [CrossRef] [PubMed]
- Zhang, G.; Chen, M.; Li, L.; Xu, Z.; Chen, X.; Guo, J.; Ma, Y. Overexpression of the soybean GmERF3 gene, an AP2/ERF type transcription factor for increased tolerances to salt, drought, and diseases in transgenic tobacco. J. Exp. Bot. 2009, 60, 3781–3796. [Google Scholar] [CrossRef]
- Reddy, I.N.B.L.; Kim, B.-K.; Yoon, I.-S.; Kim, K.-H.; Kwon, T.-R. Salt tolerance in rice: Focus on mechanisms and approaches. Rice Sci. 2017, 24, 123–144. [Google Scholar] [CrossRef]
- Wu, Y.; Wang, Q.; Ma, Y.; Chu, C. Isolation and expression analysis of salt up-regulated ESTs in upland rice using PCR-based subtractive suppression hybridization method. Plant Sci. 2005, 168, 847–853. [Google Scholar] [CrossRef]
- Sun, B.-R.; Fu, C.-Y.; Fan, Z.-L.; Chen, Y.; Chen, W.-F.; Zhang, J.; Jiang, L.-Q.; Lv, S.; Pan, D.-J.; Li, C. Genomic and transcriptomic analysis reveal molecular basis of salinity tolerance in a novel strong salt-tolerant rice landrace Changmaogu. Rice 2019, 12, 99. [Google Scholar] [CrossRef]
- Ma, L.; Liu, X.; Lv, W.; Yang, Y. Molecular mechanisms of plant responses to salt stress. Front. Plant Sci. 2022, 13, 934877. [Google Scholar] [CrossRef] [PubMed]
- Chinnusamy, V.; Jagendorf, A.; Zhu, J.K. Understanding and improving salt tolerance in plants. Crop Sci. 2005, 45, 437–448. [Google Scholar] [CrossRef]
- Arnon, D.I. Copper enzymes in isolated chloroplasts. Polyphenoloxidase in Beta vulgaris. Plant Physiol. 1949, 24, 1. [Google Scholar] [CrossRef]
- Bjorkman, O.; Demmig, B. Photon yield of O2 evolution and chlorophyll fluorescence characteristics at 77 K among vascular plants of diverse origins. Planta 1987, 170, 489–504. [Google Scholar] [CrossRef] [PubMed]
- Wu, X.; Bao, W. Leaf growth, gas exchange and chlorophyll fluorescence parameters in response to different water deficits in wheat cultivars. Plant Prod. Sci. 2011, 14, 254–259. [Google Scholar] [CrossRef]
- Sagun, J.V.; Badger, M.R.; Chow, W.S.; Ghannoum, O. Cyclic electron flow and light partitioning between the two photosystems in leaves of plants with different functional types. Photosynth. Res. 2019, 142, 321–334. [Google Scholar] [CrossRef] [PubMed]
- Yamori, W.; Kondo, E.; Sugiura, D.; Terashima, I.; Suzuki, Y.; Makino, A. Enhanced leaf photosynthesis as a target to increase grain yield: Insights from transgenic rice lines with variable Rieske FeS protein content in the cytochrome b6/f complex. Plant Cell Environ. 2016, 39, 80–87. [Google Scholar] [CrossRef]
- Kanazawa, A.; Chattopadhyay, A.; Kuhlgert, S.; Tuitupou, H.; Maiti, T.; Kramer, D.M. Light potentials of photosynthetic energy storage in the field: What limits the ability to use or dissipate rapidly increased light energy? R. Soc. Open Sci. 2021, 8, 211102. [Google Scholar] [CrossRef]
- Cruz, J.A.; Avenson, T.J.; Kanazawa, A.; Takizawa, K.; Edwards, G.E.; Kramer, D.M. Plasticity in light reactions of photosynthesis for energy production and photoprotection. J. Exp. Bot. 2005, 56, 395–406. [Google Scholar] [CrossRef] [PubMed]
- Avenson, T.J.; Cruz, J.A.; Kanazawa, A.; Kramer, D.M. Regulating the proton budget of higher plant photosynthesis. Proc Natl Acad Sci. USA 2005, 102, 9709–9713. [Google Scholar] [CrossRef]
- Santos, C.V. Regulation of chlorophyll biosynthesis and degradation by salt stress in sunflower leaves. Sci. Hortic. 2004, 103, 93–99. [Google Scholar] [CrossRef]
- Arif, Y.; Singh, P.; Siddiqui, H.; Bajguz, A.; Hayat, S. Salinity induced physiological and biochemical changes in plants: An omic approach towards salt stress tolerance. Plant Physiol. Biochem. 2020, 156, 64–77. [Google Scholar] [CrossRef]
- Lee, M.H.; Cho, E.J.; Wi, S.G.; Bae, H.; Kim, J.E.; Cho, J.-Y.; Lee, S.; Kim, J.-H.; Chung, B.Y. Divergences in morphological changes and antioxidant responses in salt-tolerant and salt-sensitive rice seedlings after salt stress. Plant Physiol. Biochem. 2013, 70, 325–335. [Google Scholar] [CrossRef]
- Chutimanukul, P.; Kositsup, B.; Plaimas, K.; Buaboocha, T.; Siangliw, M.; Toojinda, T.; Comai, L.; Chadchawan, S. Photosynthetic responses and identification of salt tolerance genes in a chromosome segment substitution line of ‘Khao Dawk Mali 105’rice. Environ. Exp. Bot. 2018, 155, 497–508. [Google Scholar] [CrossRef]
- Gjindali, A.; Johnson, G.N. Photosynthetic acclimation to changing environments. Biochem. Soc. Trans. 2023, 51, 473–486. [Google Scholar] [CrossRef]
- Yordanov, I.; Georgieva, K.; Velikova, V.; Tsonev, T.; Merakchiiska-Nikolova, M.; Paunova, S.; Stefanov, D. Response of the photosynthetic apparatus of different wheat genotypes to drought: I. Laboratory experiments under controlled Lig and temperature conditions. C. R. l’Academie Bulg. Sci. 2001, 54, 12–79. [Google Scholar]
- Porcel, R.; Redondo-Gómez, S.; Mateos-Naranjo, E.; Aroca, R.; Garcia, R.; Ruiz-Lozano, J.M. Arbuscular mycorrhizal symbiosis ameliorates the optimum quantum yield of photosystem II and reduces non-photochemical quenching in rice plants subjected to salt stress. J. Plant Physiol. 2015, 185, 75–83. [Google Scholar] [CrossRef] [PubMed]
- Nishiyama, Y.; Allakhverdiev, S.I.; Murata, N. Protein synthesis is the primary target of reactive oxygen species in the photoinhibition of photosystem II. Physiol. Plant. 2011, 142, 35–46. [Google Scholar] [CrossRef] [PubMed]
- Murchie, E.H.; Ruban, A.V. Dynamic non-photochemical quenching in plants: From molecular mechanism to productivity. Plant J. 2020, 101, 885–896. [Google Scholar] [CrossRef]
- Avenson, T.J.; Cruz, J.A.; Kramer, D.M. Modulation of energy dependent quenching of excitons (qE) in antenna of higher plants. Proc. Natl. Acad. Sci. 2004, 101, 5530–5535. [Google Scholar] [CrossRef]
- Ruban, A.V.; Wilson, S. The mechanism of non-photochemical quenching in plants: Localisation and driving forces. Plant Cell Physiol. 2020, 62, 1063–1072. [Google Scholar] [CrossRef]
- Elsheery, N.I.; Cao, K.-F. Gas exchange, chlorophyll fluorescence, and osmotic adjustment in two mango cultivars under drought stress. Acta Physiol. Plant. 2008, 30, 769–777. [Google Scholar] [CrossRef]
- Fritschi, F.B.; Ray, J.D. Soybean leaf nitrogen, chlorophyll content, and chlorophyll a/b ratio. Photosynthetica 2007, 45, 92–98. [Google Scholar] [CrossRef]
- Živčák, M.; Brestič, M.; Olšovská, K.; Slamka, P. Performance index as a sensitive indicator of water stress in Triticum aestivum L. Plant Soil Environ. 2008, 54, 133–139. [Google Scholar] [CrossRef]
- Yang, X.; Lu, C. Photosynthesis is improved by exogenous glycinebetaine in salt-stressed maize plants. Physiol. Plant. 2005, 124, 343–352. [Google Scholar] [CrossRef]
- Kasajima, I. Difference in oxidative stress tolerance between rice cultivars estimated with chlorophyll fluorescence analysis. BMC Res. Notes 2017, 10, 168. [Google Scholar] [CrossRef] [PubMed]
- Dinç, E.; Ceppi, M.G.; Tóth, S.Z.; Bottka, S.; Schansker, G. The chl a fluorescence intensity is remarkably insensitive to changes in the chlorophyll content of the leaf as long as the chl a/b ratio remains unaffected. Biochim. Biophys. Acta (BBA)-Bioenerg. 2012, 1817, 770–779. [Google Scholar] [CrossRef] [PubMed]
Disclaimer/Publisher’s Note: The statements, opinions and data contained in all publications are solely those of the individual author(s) and contributor(s) and not of MDPI and/or the editor(s). MDPI and/or the editor(s) disclaim responsibility for any injury to people or property resulting from any ideas, methods, instructions or products referred to in the content. |
© 2024 by the authors. Licensee MDPI, Basel, Switzerland. This article is an open access article distributed under the terms and conditions of the Creative Commons Attribution (CC BY) license (https://creativecommons.org/licenses/by/4.0/).