Article

A Comprehensive Benefit Evaluation of the Model of Salt-Tolerant Crops Irrigated by Mariculture Wastewater Based on a Field Plot Experiment

1
College of Agricultural Science and Engineering, Hohai University, Nanjing 211100, China
2
College of Resources and Environmental Sciences, Nanjing Agricultural University, Nanjing 210095, China
3
Department of Biological Systems Engineering, University of Nebraska-Lincoln, Lincoln, NE 68583, USA
*
Author to whom correspondence should be addressed.
Agronomy 2024, 14(9), 2161; https://doi.org/10.3390/agronomy14092161
Submission received: 5 August 2024 / Revised: 31 August 2024 / Accepted: 18 September 2024 / Published: 22 September 2024

Abstract

:
The intensified development of aquaculture and excessive use of agricultural fertilizers pose a threat to natural resource availability and deteriorate the environment. Utilizing aquaculture wastewater from mariculture for agricultural irrigation can mitigate pollution and alleviate the pressure on natural resources. This study investigated the comprehensive benefits of using freshwater and mariculture wastewater for irrigation, employing two concentration levels of mariculture wastewater in a pot experiment with saline-tolerant rice. Furthermore, we quantitively assessed the integrated benefits for farmland by utilizing an ecosystem service function value assessment and emergy value theory. The results indicate a significant enhancement in the growth and yield of saline-tolerant rice when irrigated with mariculture wastewater. Specifically, the theoretical yield increased by 9.01% relative to freshwater irrigation. Irrigation using aquaculture wastewater significantly enhanced the nutrient concentrations in the soil, including soil organic carbon (SOC), avail-K (AK), Olsen-P (OP), and alkali-N (AN). Additionally, the uptake of these nutrients by salt-tolerant crops during their late reproductive stage effectively mitigated the rise in soil salinity induced by the wastewater irrigation practice. Under experimental conditions, wastewater irrigation conferred superior ecological benefits compared with freshwater irrigation. The comprehensive benefits of wastewater irrigation, valued at 104,439.10 RMB/hm2, exceeded those of freshwater irrigation by 188.8%. The utilization of mariculture wastewater effectively enhances the coastal environment, augments crop yields, and diminishes treatment costs. From the perspectives of revenue enhancement, environmental compatibility, and sustainability, the model of utilizing salt-tolerant crops irrigated with mariculture wastewater holds substantial promotional and practical significance.

1. Introduction

Coastal mudflats, a crucial component of the coastal zone, serve as a pivotal intermediary for material exchange between the sea and land. They exhibit diverse substrate types, intricate hydrodynamic conditions, and abundant biodiversity, all of which contribute significantly to their resource values and ecological service functions. These areas are particularly concentrated hubs for marine resource development [1]. In recent years, there has been intensive development of coastal mudflats for fishery, agriculture, industry, and transportation in Eastern China. While this exploitation of resources brings significant economic benefits to the coastal areas, it also results in the sacrifice of certain ecological values. Nowadays, as China places greater emphasis on the development of ecological civilization, the conventional approach to exploiting coastal mudflat resources confronts novel challenges.
The population growth and sustained enhancement of living standards have significantly contributed to the burgeoning market demand for diverse aquatic products, thereby driving the rapid development of coastal aquaculture [2]. In order to facilitate management and the pursuit of yield, the normal aquaculture method has begun to develop toward a high degree of baiting intensification [3]. The bait and therapeutic drugs invested in large quantities during the breeding process are often not fully utilized and are deposited and discharged into the adjacent sea with the water exchange process, resulting in marine organic pollution. Furthermore, the excreta and carcasses of farmed animals expedite pollution, leading to degraded water quality and increased risk of disease [4]. Thus, intensive aquaculture has become the main source of organic pollution in the current mariculture industry.
Some scholars have carried out quantitative assessments of the pollution of elements such as nitrogen and phosphorus in mariculture. For example, an evaluation of pollutant emissions stemming from net–pen culture and pond culture in the mariculture sector of Guangdong Province, spanning from 2003 to 2018, revealed a consistent upward trend in emissions, with an average annual growth rate of 14.2% for nitrogen (N) and 12.2% for phosphorus (P) [5]. An assessment report on the nitrogen and phosphorus emissions of mariculture activities in China revealed that the annual output of N and P in the designated mariculture enrichment zone surpassed the corresponding seawater discharge levels by factors of 5.6 and 7.2, respectively [6]. Mariculture has become an important reason for pollution in China’s nearshore waters. Its pollution seriously restricts the healthy and sustainable development of offshore fisheries and lake fisheries. It may also cause an imbalance in the ecosystem of sea waters, which is obviously not beneficial to the sustainable development of the industry. The significance of exploring environment-friendly mariculture models is increasingly prominent.
Meanwhile, in the coastal region, the intrusion of seawater or highly mineralized brackish water into freshwater aquifers results in an elevation in chloride ion concentrations and mineralization, thereby degrading the groundwater quality [7]. A seawater intrusion-induced escalating chloride ion content was reported in coastal regions of Southeast Queensland, Australia [8,9]. It also causes brackish groundwater to rise along the soil capillaries to the cultivation layer [10,11]. This rise of salty groundwater leads to soil salinization, resulting in a decline in organic matter and soil fertility, and serious constraints on sustainable land use. In addition, the dense population and intense development in coastal areas have significantly strained the regional resources and environment [12]. Both freshwater resources and arable land resources are facing a serious contradiction between supply and demand.
Furthermore, the environmental implications of chemical fertilizer usage in traditional coastal agriculture should not be overlooked. Inappropriate fertilizer application may drastically alter the physical and chemical characteristics of cultivated soils, ultimately resulting in heavy metal contamination, soil acidification, and soil consolidation. Meanwhile, NH3, NOx, and N2O emissions caused by fertilizer application can accelerate the process of the greenhouse effect and ozone layer destruction [13]. Taking nitrogen fertilizer as an example, about 174,000 tons of nitrogen fertilizer applied to grain and vegetable crops in China has been lost every year, with half of it flowing from farmland to rivers, lakes, and seas, which has a serious impact on the environment and ecosystem function at local, regional, and even global scales [14]. Fertilizer inputs have significantly contributed to stable agricultural growth and mitigated food scarcity, yet excessive and imprudent application during fertilization has emerged as a primary contributor to agricultural pollution in China [15].
Under the triple pressure of mariculture pollution, agricultural pollution, and shortage of freshwater resources in arable land, it is urgent to carry out reasonable resource allocation and realize the resource utilization of waste among different industries. For instance, substituting irrigation water resources represents an effective way to foster mutual benefits among coastal agriculture, aquaculture, and the marine environment. A significant quantity of wastewater generated during water exchange in the mariculture industry can be repurposed for irrigation in coastal saline agricultural fields. By reducing freshwater irrigation, it alleviates the pressure on agricultural water resources. Furthermore, the nutrient-laden wastewater can partially substitute chemical fertilizers, thereby mitigating agricultural pollution.
However, the current research on salt-tolerant crops irrigated with mariculture wastewater has mainly focused on evaluating the physiological response of the crops and soil enhancement effects under varying wastewater irrigation ratios [16,17,18,19] Although there is a scarcity of benefit evaluation studies pertaining to this irrigation method, this paper establishes a quantitative framework for assessing the comprehensive benefits associated with the irrigation of salt-tolerant crops using mariculture wastewater based on a field plot experiment. We compare and analyze the extension value within this model, aiming to provide a theoretical foundation for the development of a mariculture wastewater irrigation agricultural model.

2. Materials and Methods

2.1. Study Area and Materials

(1) Study area
This experimental study was carried out from June to November 2021. Due to the epidemic, saline soils were transported back to the water conservation greenhouse of Hohai University at Jiangning Campus in Nanjing, Jiangsu, for potting experiments. The Jiang Ning District of Nanjing experiences a subtropical monsoon climate, characterized by an average annual temperature of 15.5 °C, an average annual precipitation of 1063.8 mm, and an average annual sunshine duration of 1686.5 h, as recorded by the Jiang Ning Dongshan Station. Salinity-tolerant rice was transplanted in late June, matured in mid-October, and harvested in late October.
(2) Test plants
Saline-tolerant rice (commonly known as seawater rice) is an annual-growing plant that can grow in soils with a salinity of 3‰ and above through seawater irrigation. Its yield can generally reach more than 300 kg per mu, and it is the preferred food crop for coastal mudflats and saline land improvement [20]. The test hybrid for this experiment was “Salt Rice 19”, which was cultivated internally by the Dongtai subsidiary company of Jiangsu Coast Development Group Co., Ltd., Nanjing, China.
(3) Test soil and water quality
The test soil was taken from the coastal mudflats in Dongtai City, Yancheng, Jiangsu Province of China. After it was transported to the water conservation greenhouse of Hohai University, it was then dried, sieved, and evenly filled into the test pots in evenly compacted layers. The main physical and chemical characteristics of the test soil are presented in Table 1.
The experimental wastewater was manually configured to mimic the composition of cultural wastewater based on relevant studies [21]. The culture wastewater was prepared and filled, and after the completion of the preparation, it was stirred and mixed until the water color and turbidity reached stability.
The freshwater in this experiment was tap water on campus. The basic physical and chemical characteristics of the artificially configured culture wastewater and freshwater are detailed in Table 2.

2.2. Experimental Design and Index Determination

2.2.1. Experimental Design

The experiment was conducted in an outdoor setting, protected by a rain shelter. This experiment had three treatments with three replicates in nine pots including freshwater irrigation, freshwater–mariculture wastewater mixture irrigation at a 1:1 volume ratio, and mariculture wastewater irrigation. In addition, there was a control group without planting crops in three pots under the same three irrigation conditions as above. The pots consisted of uncovered polyethylene plastic boxes, each measuring 0.7 m in length, 0.5 m in width, and 0.45 m in depth. These boxes were filled with saline soil, amended with a base fertilizer, and subjected to water compaction. The final soil depth in the pots was 30 cm. The salinity-tolerant rice was transplanted on 24 June, and the seedlings were set at a density of 15 holes per pot and 2 plants per hole, with a hole spacing of about 10 cm × 15 cm. The irrigation system was arranged according to its water consumption pattern in each growing period. Prior to planting, a base fertilizer dose of 70 g/pot was administered, and subsequently, on 13 August, during the growing season, a nitrogen fertilizer application of 7.87 g/pot was exclusively applied. The irrigation water depth for each pot was recorded at each event.
The irrigation scheme in this study was an intermittent irrigation system with alternating shallow–wet–dry cycles. Except for maintaining a water level of 0–30 mm during the early tillering stage, an intermittent irrigation system was adopted for the rest of the growth stages. Field drainage was implemented at the end of tillering, and the water supply was cut off after the rice reached the yellow maturity stage. ‘Shallow’ referred to maintaining a water layer of 20–30 mm during each irrigation. ‘Wet and dry’ meant allowing the field surface to naturally dry out without retaining water, with the soil’s saturated water content rate at 70–80% serving as the lower limit control indicator. The field was maintained with a thin layer of water or saturated soil moisture the day after each irrigation. Starting from the third day, the field was drained for two to three days. The next round of irrigation typically began four to six days later, and this cycle repeated until the rice reached the yellow maturity stage, and the field was dried.

2.2.2. Measurement Indexes and Methods

The plant height, number of tillers, number of leaves, leaf chlorophyll content, and leaf nitrogen content of the saline-tolerant rice were continuously monitored at each reproductive stage. The whole biomass of the saline-tolerant rice was measured, and the theoretical yield was calculated after the experiment. The number of tillers and leaves was counted manually. The plant height was measured with a straightedge ruler. The chlorophyll content and nitrogen content of leaves were measured with a plant nutrient meter (LYS-4N, Zhejiang NADE Scientific Instrument Co., Ltd., Hangzhou, China). The full biomass of the crop was weighed with an electronic balance by bundled rice after harvest. The theoretical yield was derived by calculating the thousand-grain weight, counting the number of effective spikes, and averaging the solid grain count per spike, and all data were acquired through the seed test.
Soil sampling was conducted at the conclusion of the experiment. Three sampling points were established along the diagonal of each pot. Soil samples from depths of 0–10 cm (top soil layer), 10–20 cm (middle soil layer), and 20–30 cm (bottom soil layer) were collected at each sampling point using a soil probe. The soil was mixed well at the same depth. The pH, EC, soil organic carbon (SOC), avail-K (AK), Olsen-P (OP), and alkali-N (AN) contents of the soil were measured. The pH and electrical conductivity (EC) of the soil suspension were measured using a pH meter and a conductivity meter, respectively, after the soil was shaken and centrifuged at a water-to-soil ratio of 5:1. The determination of fast-acting phosphorus was carried out by NaHCO3 extraction and the molybdenum–antimony colorimetric method, fast-acting potassium by the ammonium acetate extraction method, and alkaline nitrogen by the alkaline diffusion method.
For the experimental monitoring indicators, Excel was utilized to organize the experimental data and generate charts. SPSS 16.0 was employed for the analysis of variance (ANOVA) and multiple comparisons. The least significant difference (LSD) method was adopted for statistical significance testing at a p < 0.05 level. Additionally, a two-tailed test (T) was performed to analyze the bivariate correlation between indicators.

2.3. Analysis Methods

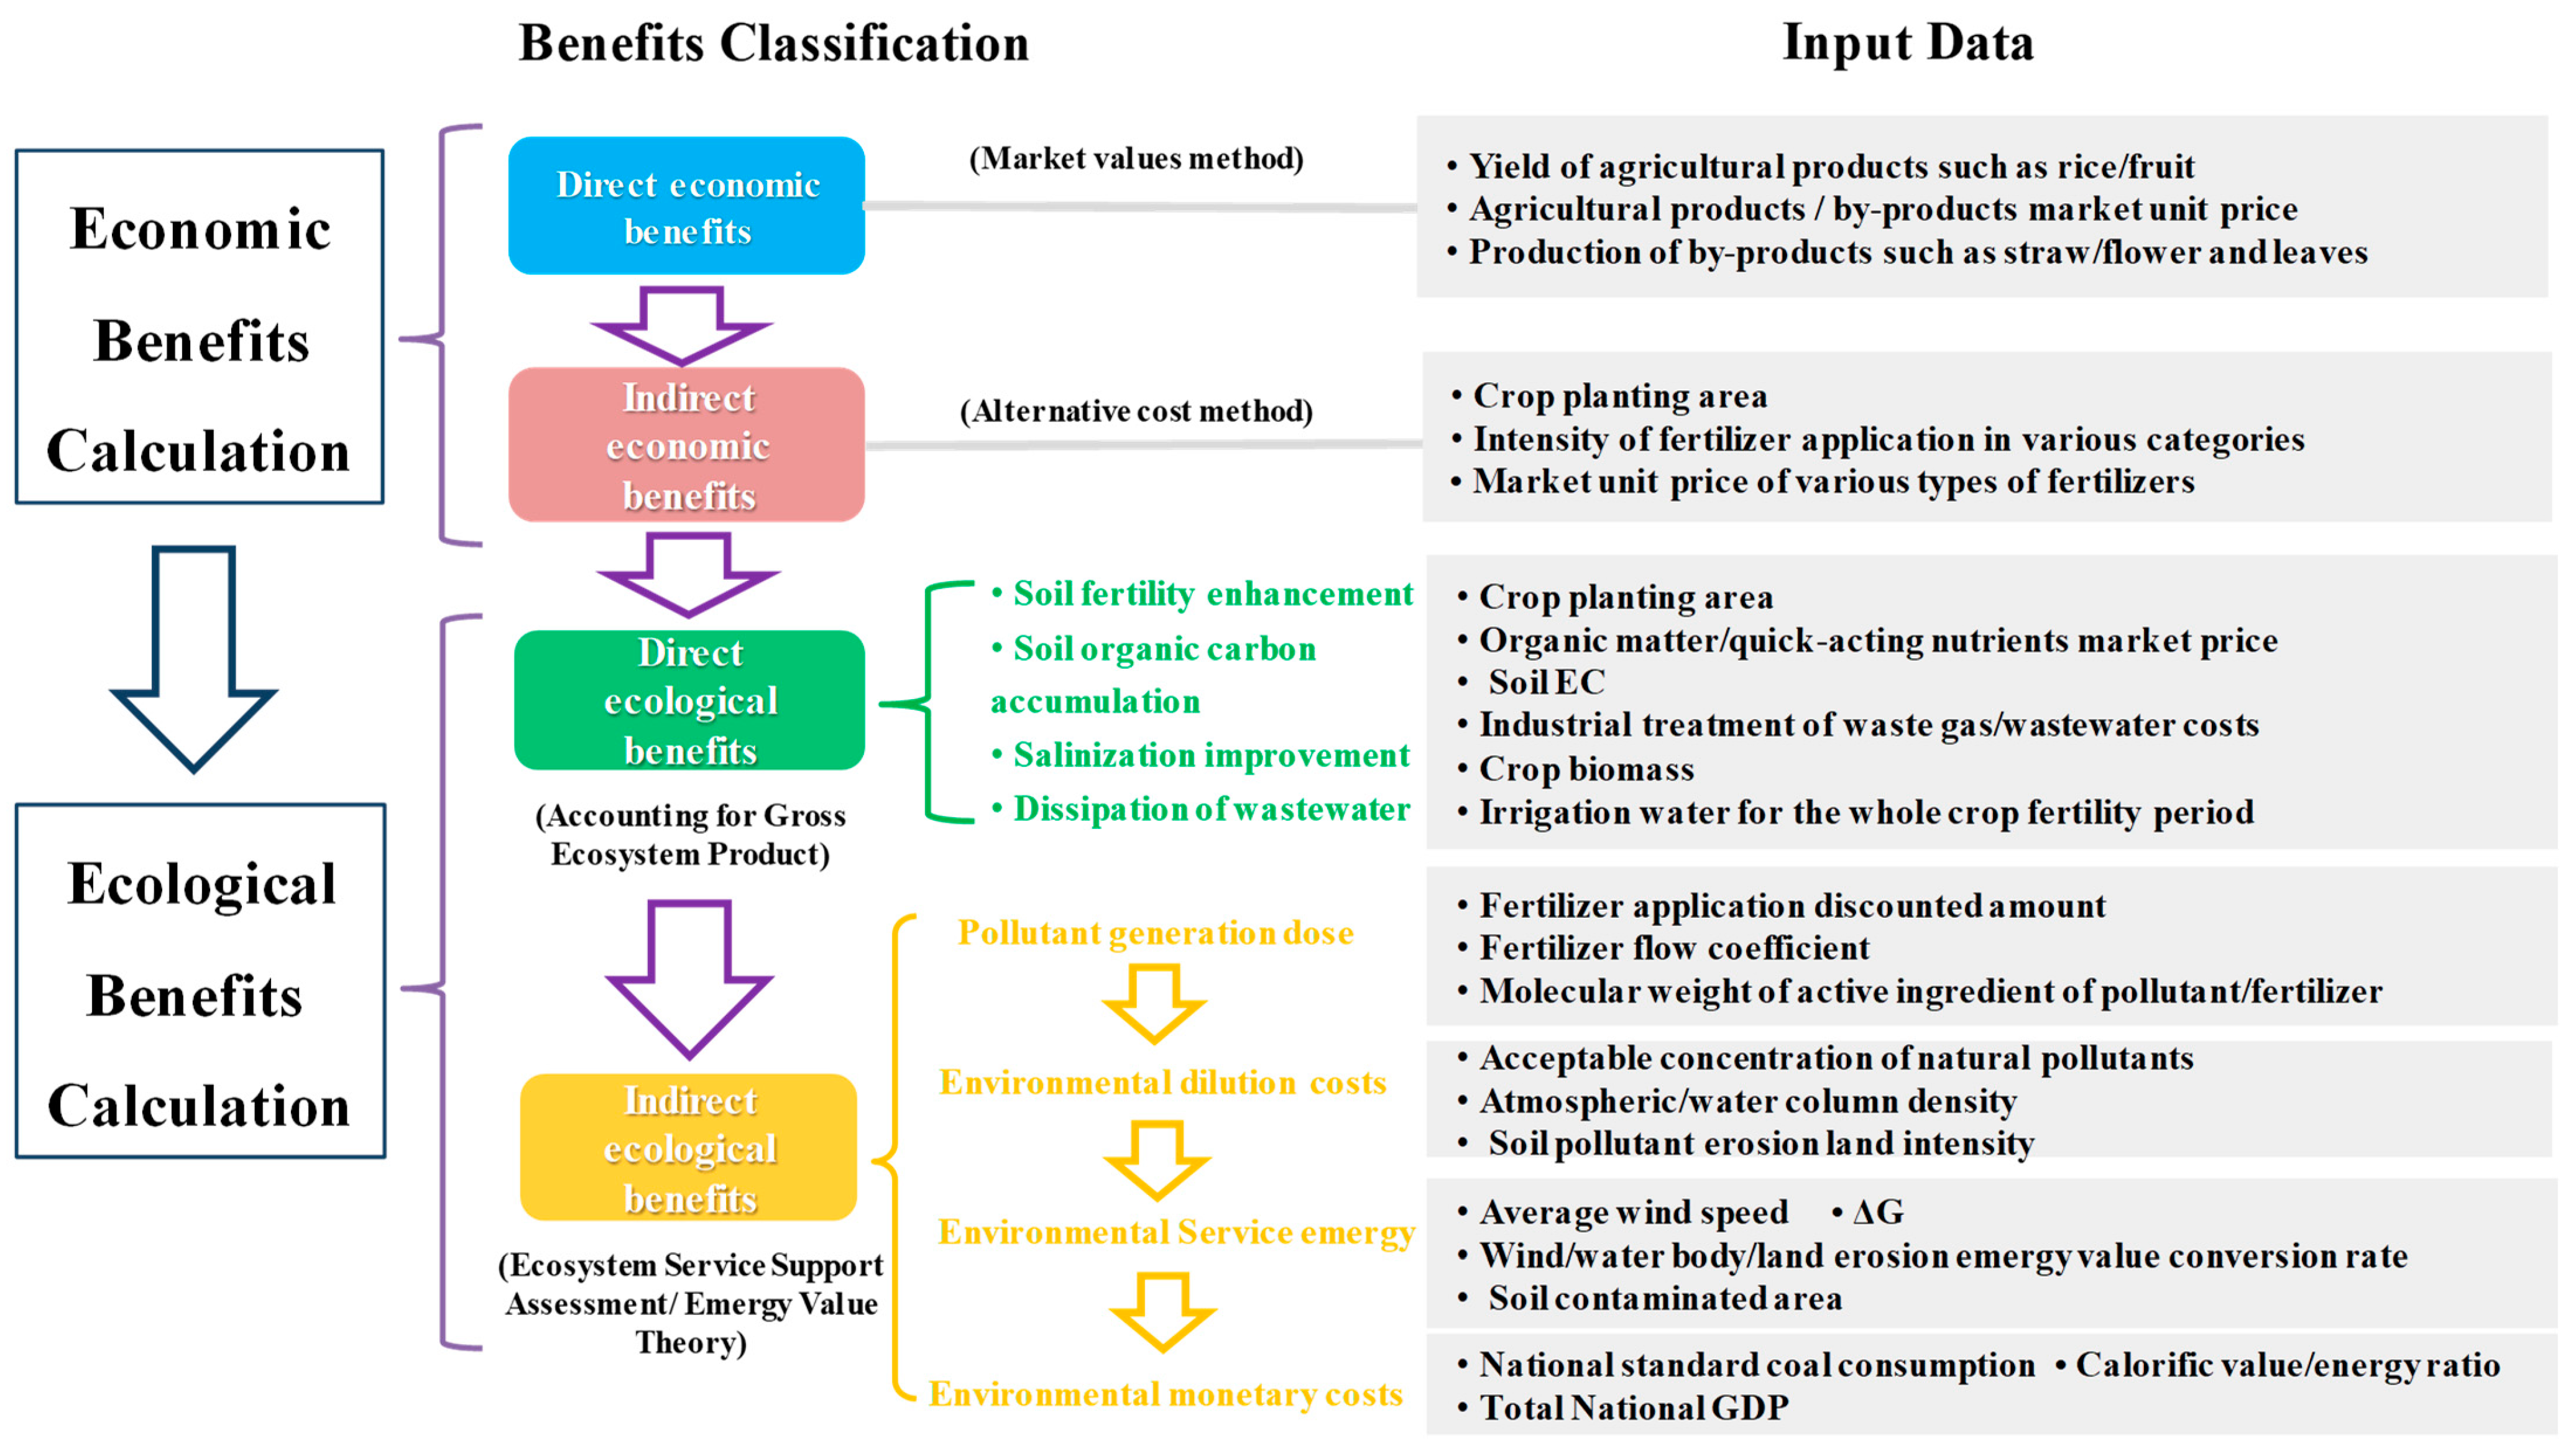
2.3.1. Analytical Framework of the Inputs and Outputs and Environmental Impacts

The purpose of this experiment was to explore the comprehensive benefits generated by using wastewater from coastal farming for irrigation in saline soil agriculture. We analyzed the input–output and environmental impact of the farming system and coastal farming pond system before and after the resource utilization model of farming waste, respectively. The analytical framework is presented in Figure 1.
For the traditional farming and aquaculture business models, independently, the benefit output was mainly derived from the harvesting/fishing of agricultural and fishery products. There were economic benefits (EB) and the added ecological benefit (EcoB) of farm ecosystems in the agricultural context. The costs included the economic costs of fertilizers, pesticides, baits, etc., in various forms and the treatment costs of eutrophic wastewater substrates (economic cost (EC)), as well as the environmental costs of the environmental damage caused by the cultivation/farming system (ecological cost (EcoC)). The utilization of farm wastewater and eutrophic substrates in agricultural systems changes compared with those before the resource utilization of waste. Owing to the restricted availability of data, this study focused solely on assessing the benefits from the farmland planting system perspective, neglecting the potential benefits of aquaculture and the input costs associated with the overall system. Furthermore, this experiment specifically examined irrigated salt-tolerant crops using mariculture wastewater, and, thus, the influence of substrate resource utilization on the agricultural system output, as depicted in the figure, remained unexamined.
This paper, based on the aforementioned analysis, categorized the comprehensive benefits derived from the resource utilization of farming waste into two primary domains: economic and ecological benefits. The economic benefits were divided into two categories according to whether they directly benefit local farmers. One was the direct economic benefits (EBD), which referred to the output of salt-tolerant crops and by-products after the maturation and harvesting. The other was the indirect economic benefits (EBI), which referred to the expenses and expenditures that could be avoided under this model compared with traditional freshwater-irrigated agriculture. For agriculture, it was mainly the reduction in fertilizer purchase and application costs. Similarly, the ecological benefits were divided into two categories according to whether they directly affected the surrounding environment. One was the direct ecological benefits (ECOBD), including the direct positive influence on the environment, such as soil salinity improvement and soil fertility enhancement. The other was the indirect ecological benefits (ECOBI), which mainly referred to the substitution of fertilizer with mariculture wastewater, resulting in the reduction in fertilizer application and, thus, reduction in agricultural surface pollution and coastal pollution.

2.3.2. Comprehensive Benefit Valuation Method

(1) Value of agricultural products (EBD)
The value of agricultural products produced by the farmland was the direct economic benefit. The average return per hectare was calculated through the rice yield, by-product output (mainly the value of rice straw as fuel and biomass energy), and the local market unit price in the following formula:
EBD = Y1 × P1+ Y2 × P2
where Y1 is the rice grain yield of saline-tolerant rice under wastewater irrigation (kg/hm2); Y2 is the above-ground biomass of saline-tolerant rice under wastewater irrigation after removing all rice grains (kg/hm2); P1 is the market unit price of rice grain (RMB/kg); and P2 is the market unit price of straw (RMB/kg) (in August 2024, USD 1 = RMB 7.09)
(2) Fertilizer cost reduction (EBI1)
Fertilizer cost reduction was an indirect economic benefit, which referred to the reduced cost of fertilizer application due to irrigation with aquaculture wastewater. The calculation formula is:
E B I 1 = i S × F i × P F i + S × P L
where S is the crop planting area (hm2); F i is the reduced fertilizer application intensity of each type of fertilizer due to the substitution effect of irrigation with farming wastewater on fertilizer, which is determined based on the concentration of nutrients in the wastewater in kg/(hm2·a); P F i is the local market unit price (RMB/kg) of nitrogen fertilizer, phosphorus fertilizer, potash fertilizer, and compound fertilizer at the average unit prices of 5.36 RMB/kg, 3.45 RMB/kg, 7.80 RMB/kg, and 5.36 RMB/kg, respectively, according to the market survey results; and P L denotes the human and mechanical cost of fertilizer application per unit area of farmland (RMB/hm2), which was taken as 40 RMB/hm2 according to a related study [22].
(3) Sewage dissipation value (EBI2)
Farming systems can purify polluted water bodies to a certain degree due to the absorption capacity and interception capacity of crop roots, so the effluent abatement benefit of farming should also be considered as a part of its ecological benefit. The value of farm wastewater abatement in the experiment was estimated using the treatment cost method, which was calculated in the formula below:
E B I 2 = V W × P t
where V W denotes the total amount of mariculture wastewater irrigated per unit area per year in m3/(hm2 a), and P t denotes the cost of treating mariculture wastewater. Since the treatment costs of the different types and compositions of culture wastewater were not identical, P t   was taken from previous studies (as shown in Table 3) under comprehensive consideration.
(4) Soil organic matter accumulation (ECOBD1)
Soil organic matter, as an essential nutrient for crop growth, is important for improving soil physical and chemical properties and increasing food production. Generally, crop cultivation increases the intensity of soil microbial activity due to the residues of roots and stubble, thus increasing the accumulation of organic matter. The opportunity cost method was used to calculate the cumulative value of soil organic matter with the following equation:
EcoBD1 = S × T × ρ × (SOM1SOM2) × PSOM
where T is the thickness of the tillage layer (m); ρ is the soil bulk weight (kg/m3); SOM2 and SOM1 are the soil organic matter contents (g/kg) before and after planting, respectively; and PSOM is the price of soil organic matter (RMB/kg), which was taken as 1.56 RMB/kg according to a related study [26].
(5) Soil nutrient enhancement (ECOBD2)
Mariculture wastewater contains a large amount of nitrogen and phosphorus elements, which may be partially unable to be fully absorbed and utilized by plants. These are deposited in the soil to increase the soil’s quick-acting nutrient content and enhance soil fertility. Therefore, the ecological benefit computation considered the value of cumulative benefits of wastewater irrigation on soil quick-acting nutrients, as the following equation indicates:
E c o B D 2 = S × T × ρ × i = 1 n A N i 2 A N i 1 × P A N i
where E c o B D 2 indicates the soil quick-acting nutrient enhancement value (RMB/hm2); A N i 2 and A N i 1 are the contents of various quick-acting nutrients in the soil before and after planting (mg/kg); and P A N i is the market price of each quick-acting nutrient (RMB/kg), due to the lack of direct market price of quick-acting nutrients. The shadow price method was used here, using the market price of fertilizers containing the same amount of nutrients. The value of the corresponding quick-acting nutrient was converted to the value of the corresponding quick-acting nutrient.
(6) Soil salinity mitigation (ECOBD3)
The roots of saline plants can absorb and accumulate a certain amount of salt from the soil as an osmotic regulating substance to adapt to the low water potential of saline soils. Planting salt-tolerant crops in saline lands can bring out the salt in the soil by harvesting the above-ground parts, thus alleviating the salinization of beach soils. The restoration cost method was used for this assessment. The ecological restoration value was measured according to the cost of managing salinization, which is currently 80,000–140,000 RMB/hm2 for salinized arable land [27]. The unit area management cost was discounted proportionally to the EC value of saline soils. Below is the calculation formula:
E c o B D 3 = S × E C 2 E C 1 × P E
where E C 1 and E C 2 denote the average EC values of each soil layer before and after planting salt-tolerant crops, respectively, and P E denotes the ecological value per unit of soil conductivity reduction, and different values were taken according to the conductivity range according to the salinity degree.
(7) Fertilizer pollution abatement (ECOBI)
Fertilizer pollution abatement was an indirect ecological benefit, which referred to the substitution effect of farming wastewater irrigation for chemical fertilizer to a certain extent. The cost of environmental dilution was calculated using the ecological service support assessment method. Its environmental service emergy value was calculated by combining it with the emergy value theory and finally converted into monetary units [28]. The calculation steps are shown in Table 4.
Firstly, the pollution generated by fertilizer application was classified, and the amount of each type of pollutant was calculated based on the current research results on the transport destination and transformation ratio of the N and P elements in the agricultural fields [13]. According to the amount of each type of pollutant, the cost required by nature to dilute, desalinate, or decompose the waste gas and wastewater discharged into the surrounding environment was calculated with the method of reference [33]. Finally, using the emergy value/money ratio, the total environmental service emergy value was converted into monetary units, which was the environmental monetary cost caused by agricultural surface source pollution.
The value of the combined benefits generated by the experimental simulated farming system was the sum of all the above direct/indirect economic and ecological benefits. In summary, the steps of the quantitative accounting of the integrated benefits of the farmland system under the mariculture wastewater irrigation model are shown in Figure 2.

3. Results and Discussion

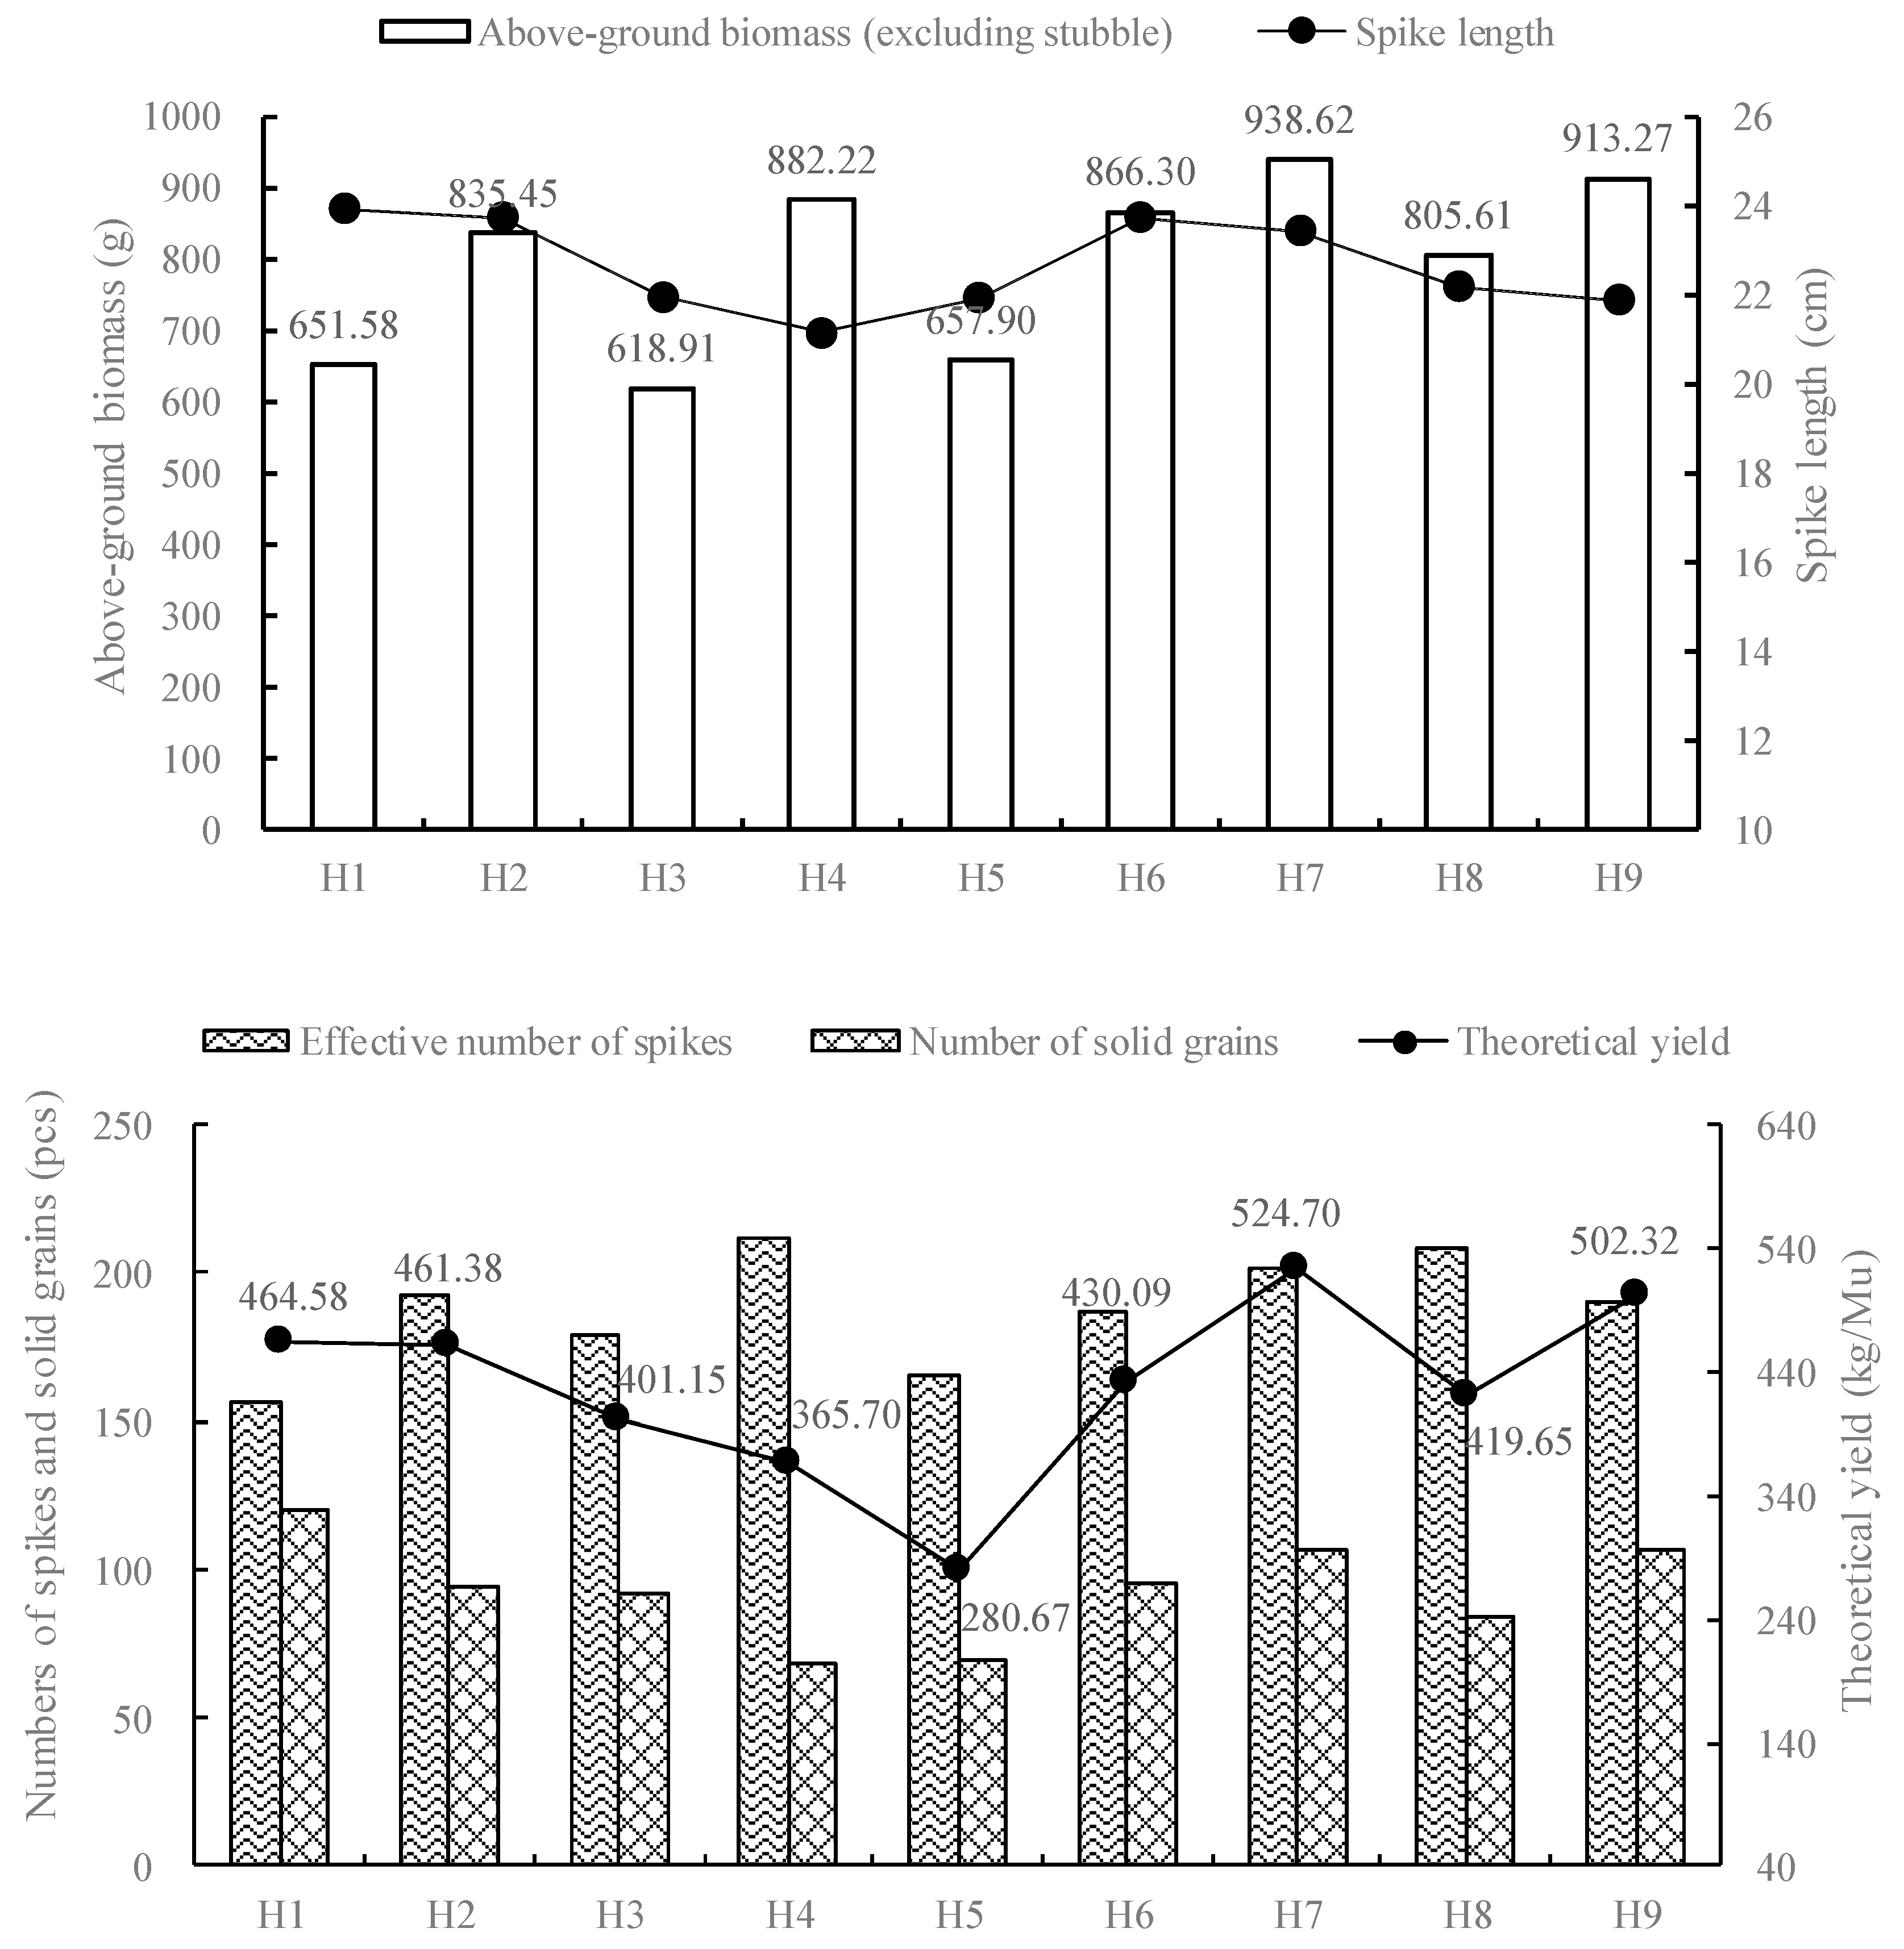
3.1. Yield Variation of Salinity-Tolerant Rice under Irrigation Pattern of Farm Wastewater

In this experimental study, the average theoretical yield of rice was calculated to be 427.80 kg/Mu (667 m2). The average above-ground biomass (excluding stubble) amounted to 796.65 g/pot. The average spike length measured at 22.66 cm. The average numbers of solid and empty grains per spike were 9129 and 3374, respectively. The average fruit set rate reached 72.74%. The average fresh and dry weights of 1000 grains were 26.21 and 24.59 g, respectively. The average moisture content within rice grains was measured at 6.20%. The average effective number of spikes per Mu amounted to 188,000. Each spike included an average number of solid grains of 93. These data are shown in Figure 3.
The analysis of the variability under the different irrigation treatments is shown in Table 5. The three treatments formed a significant difference in theoretical yield (p < 0.05). Full-wastewater irrigation increased the yield by 9.01% compared with freshwater irrigation, while the difference in the above-ground biomass between the three irrigation treatments was not significant. For the mean value, the above-ground biomass of rice under wastewater irrigation was higher. In general, high ratios of farmed wastewater had a beneficial effect on enhancing the rice yield and straw quality of salinity-tolerant rice.

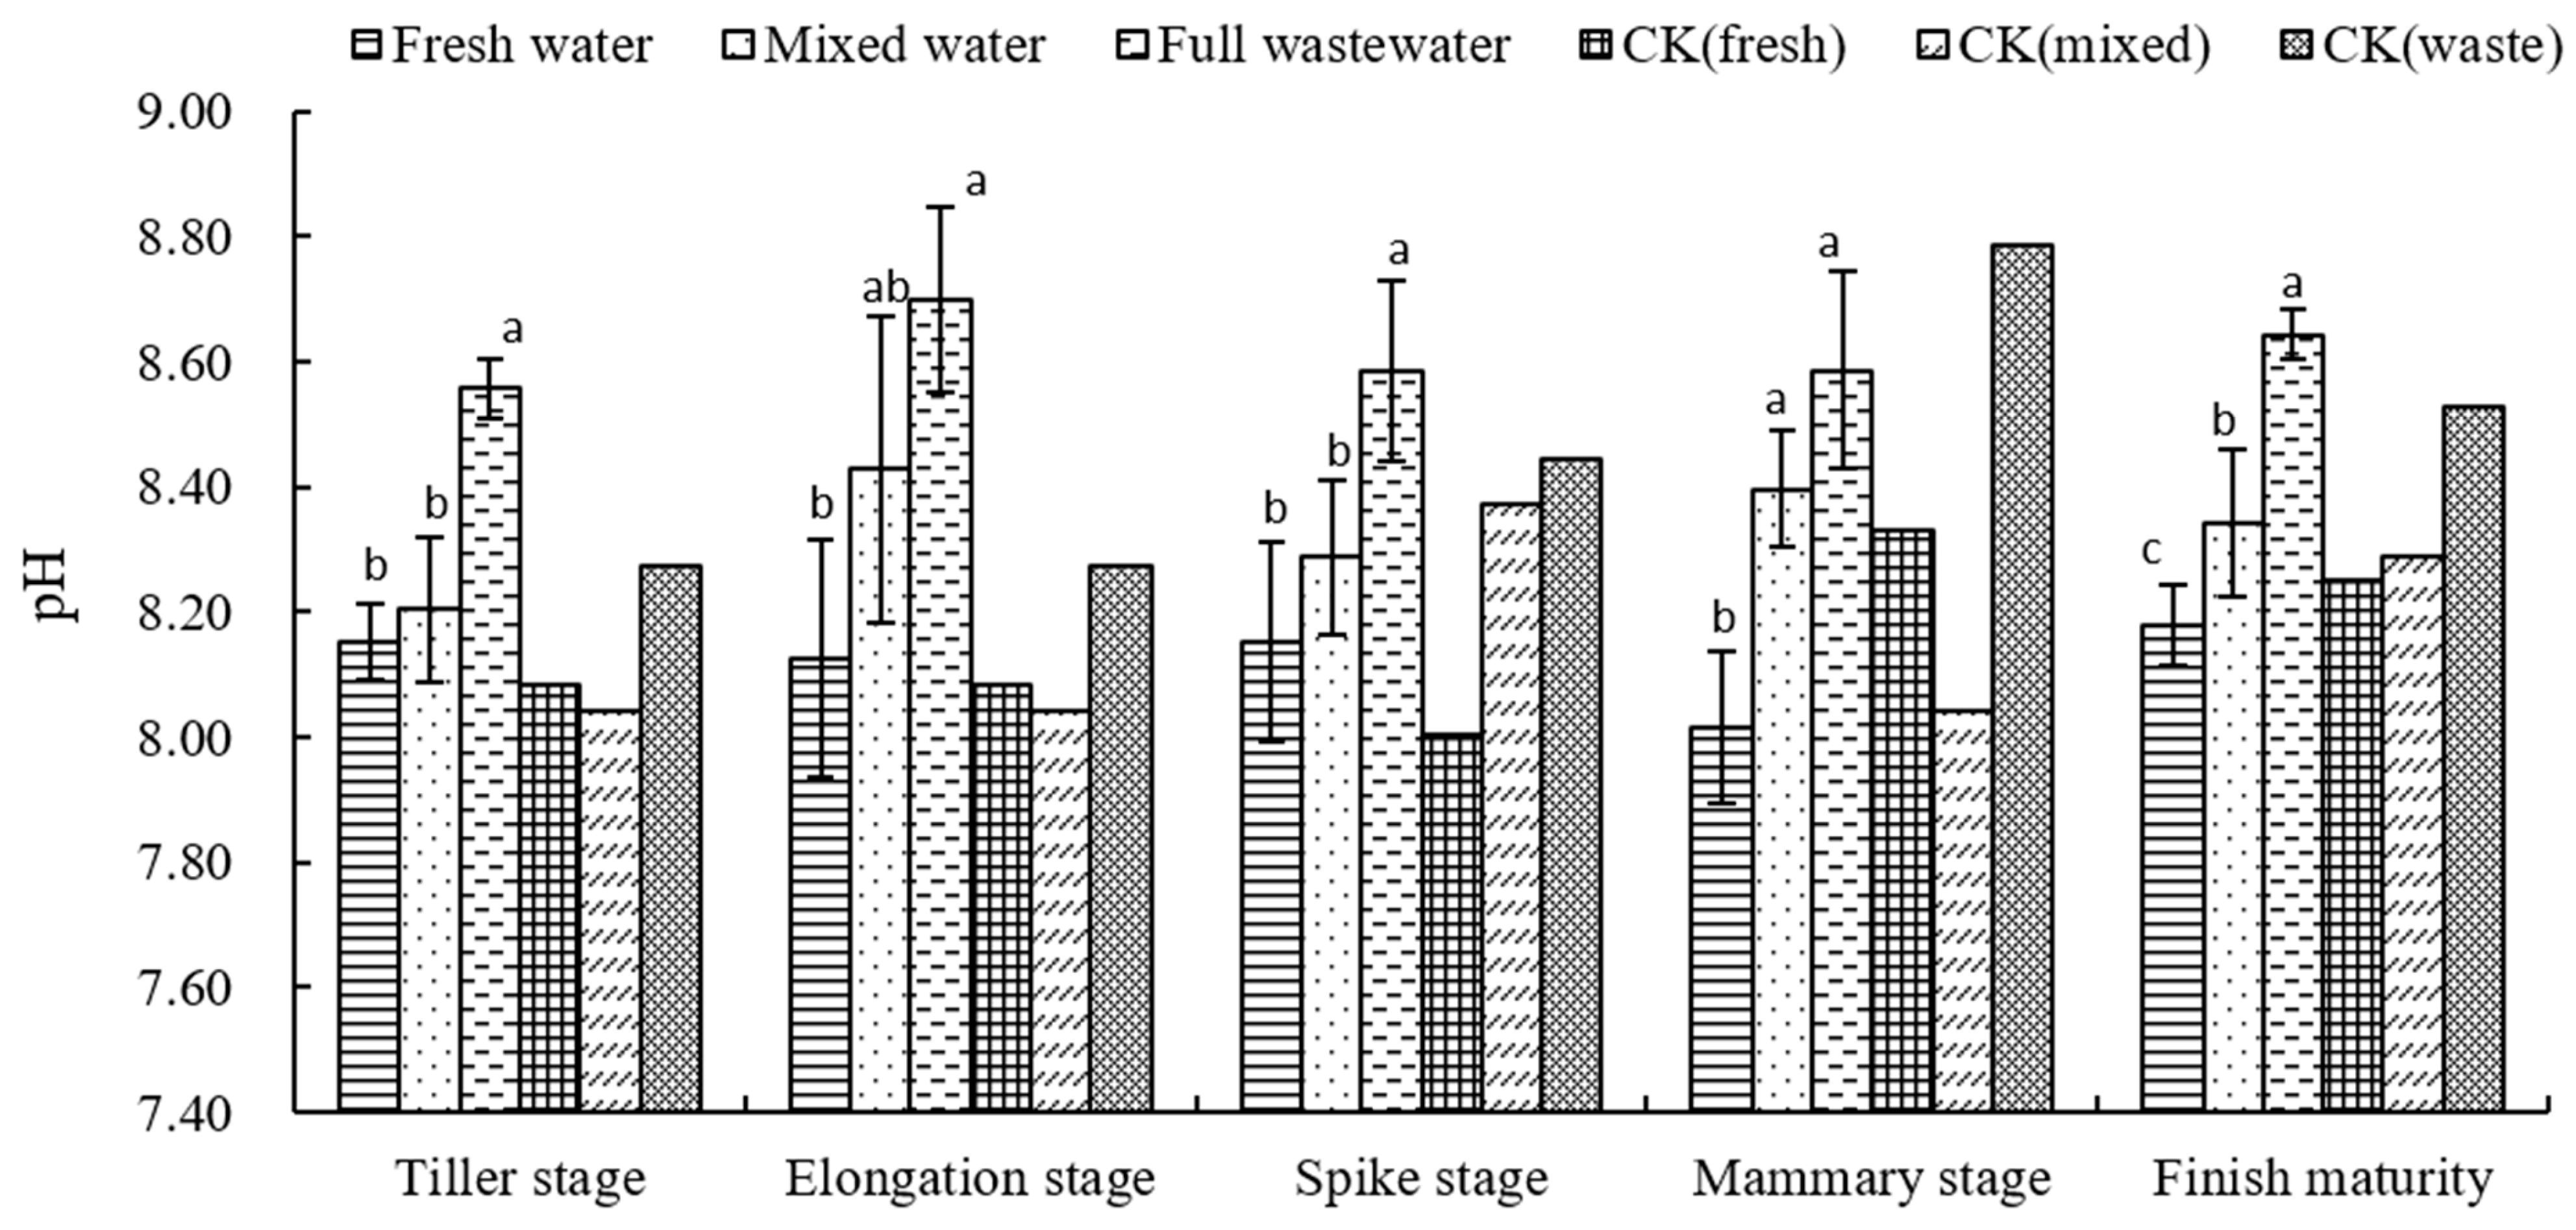
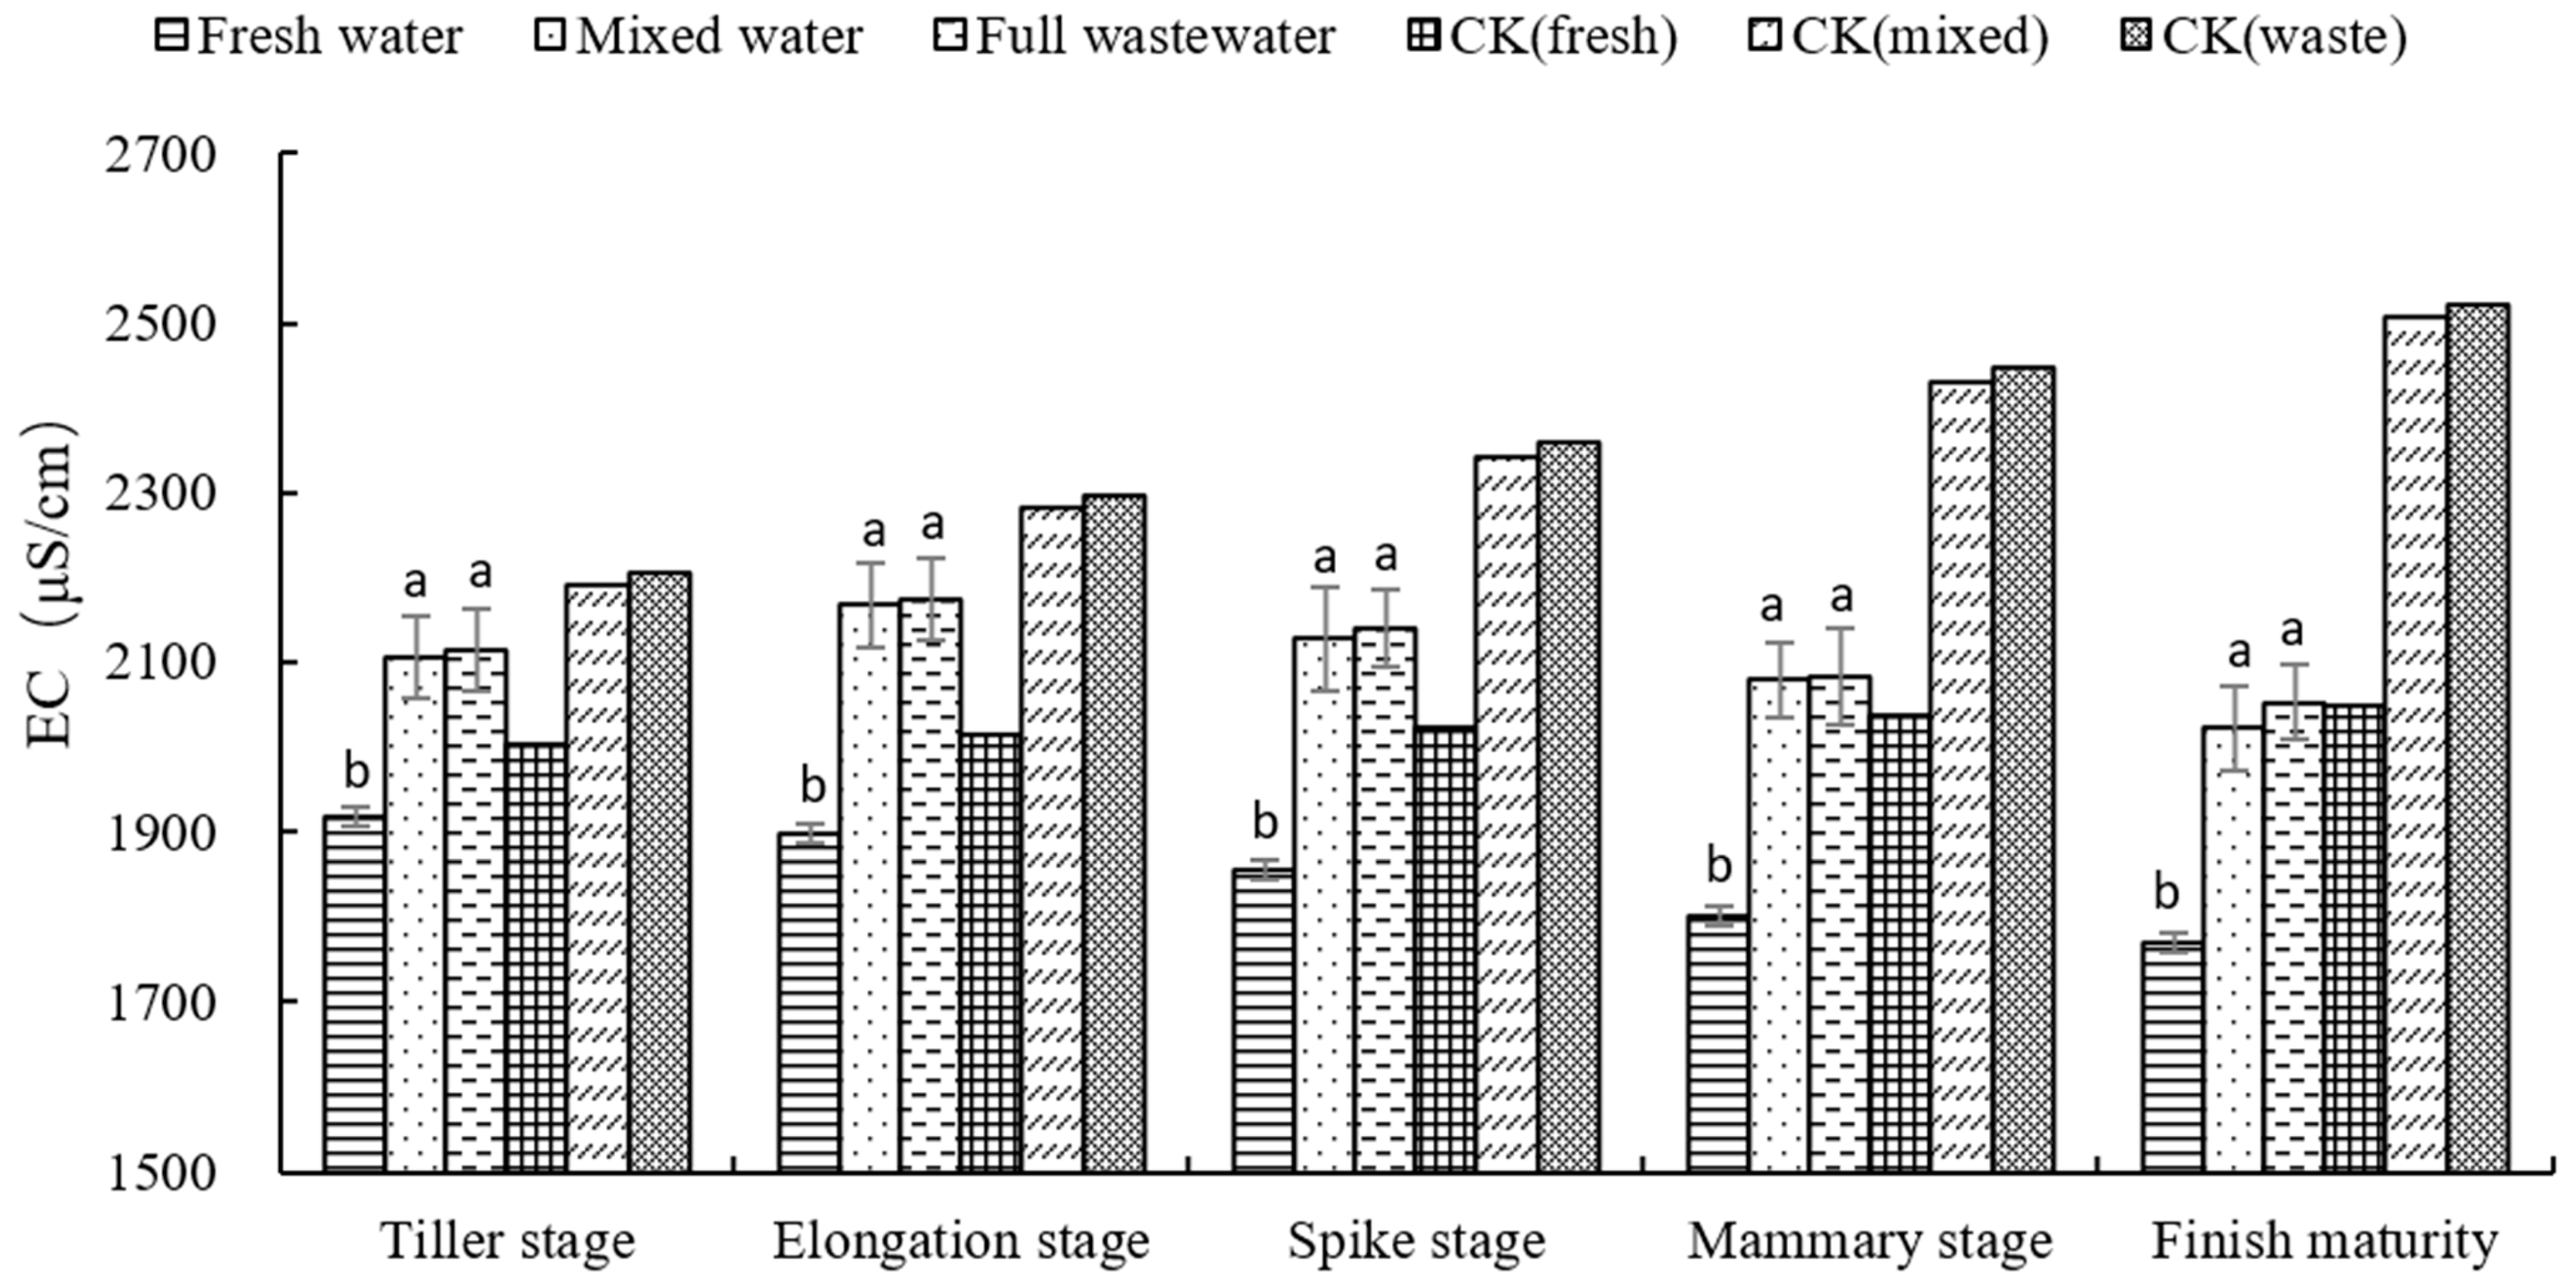
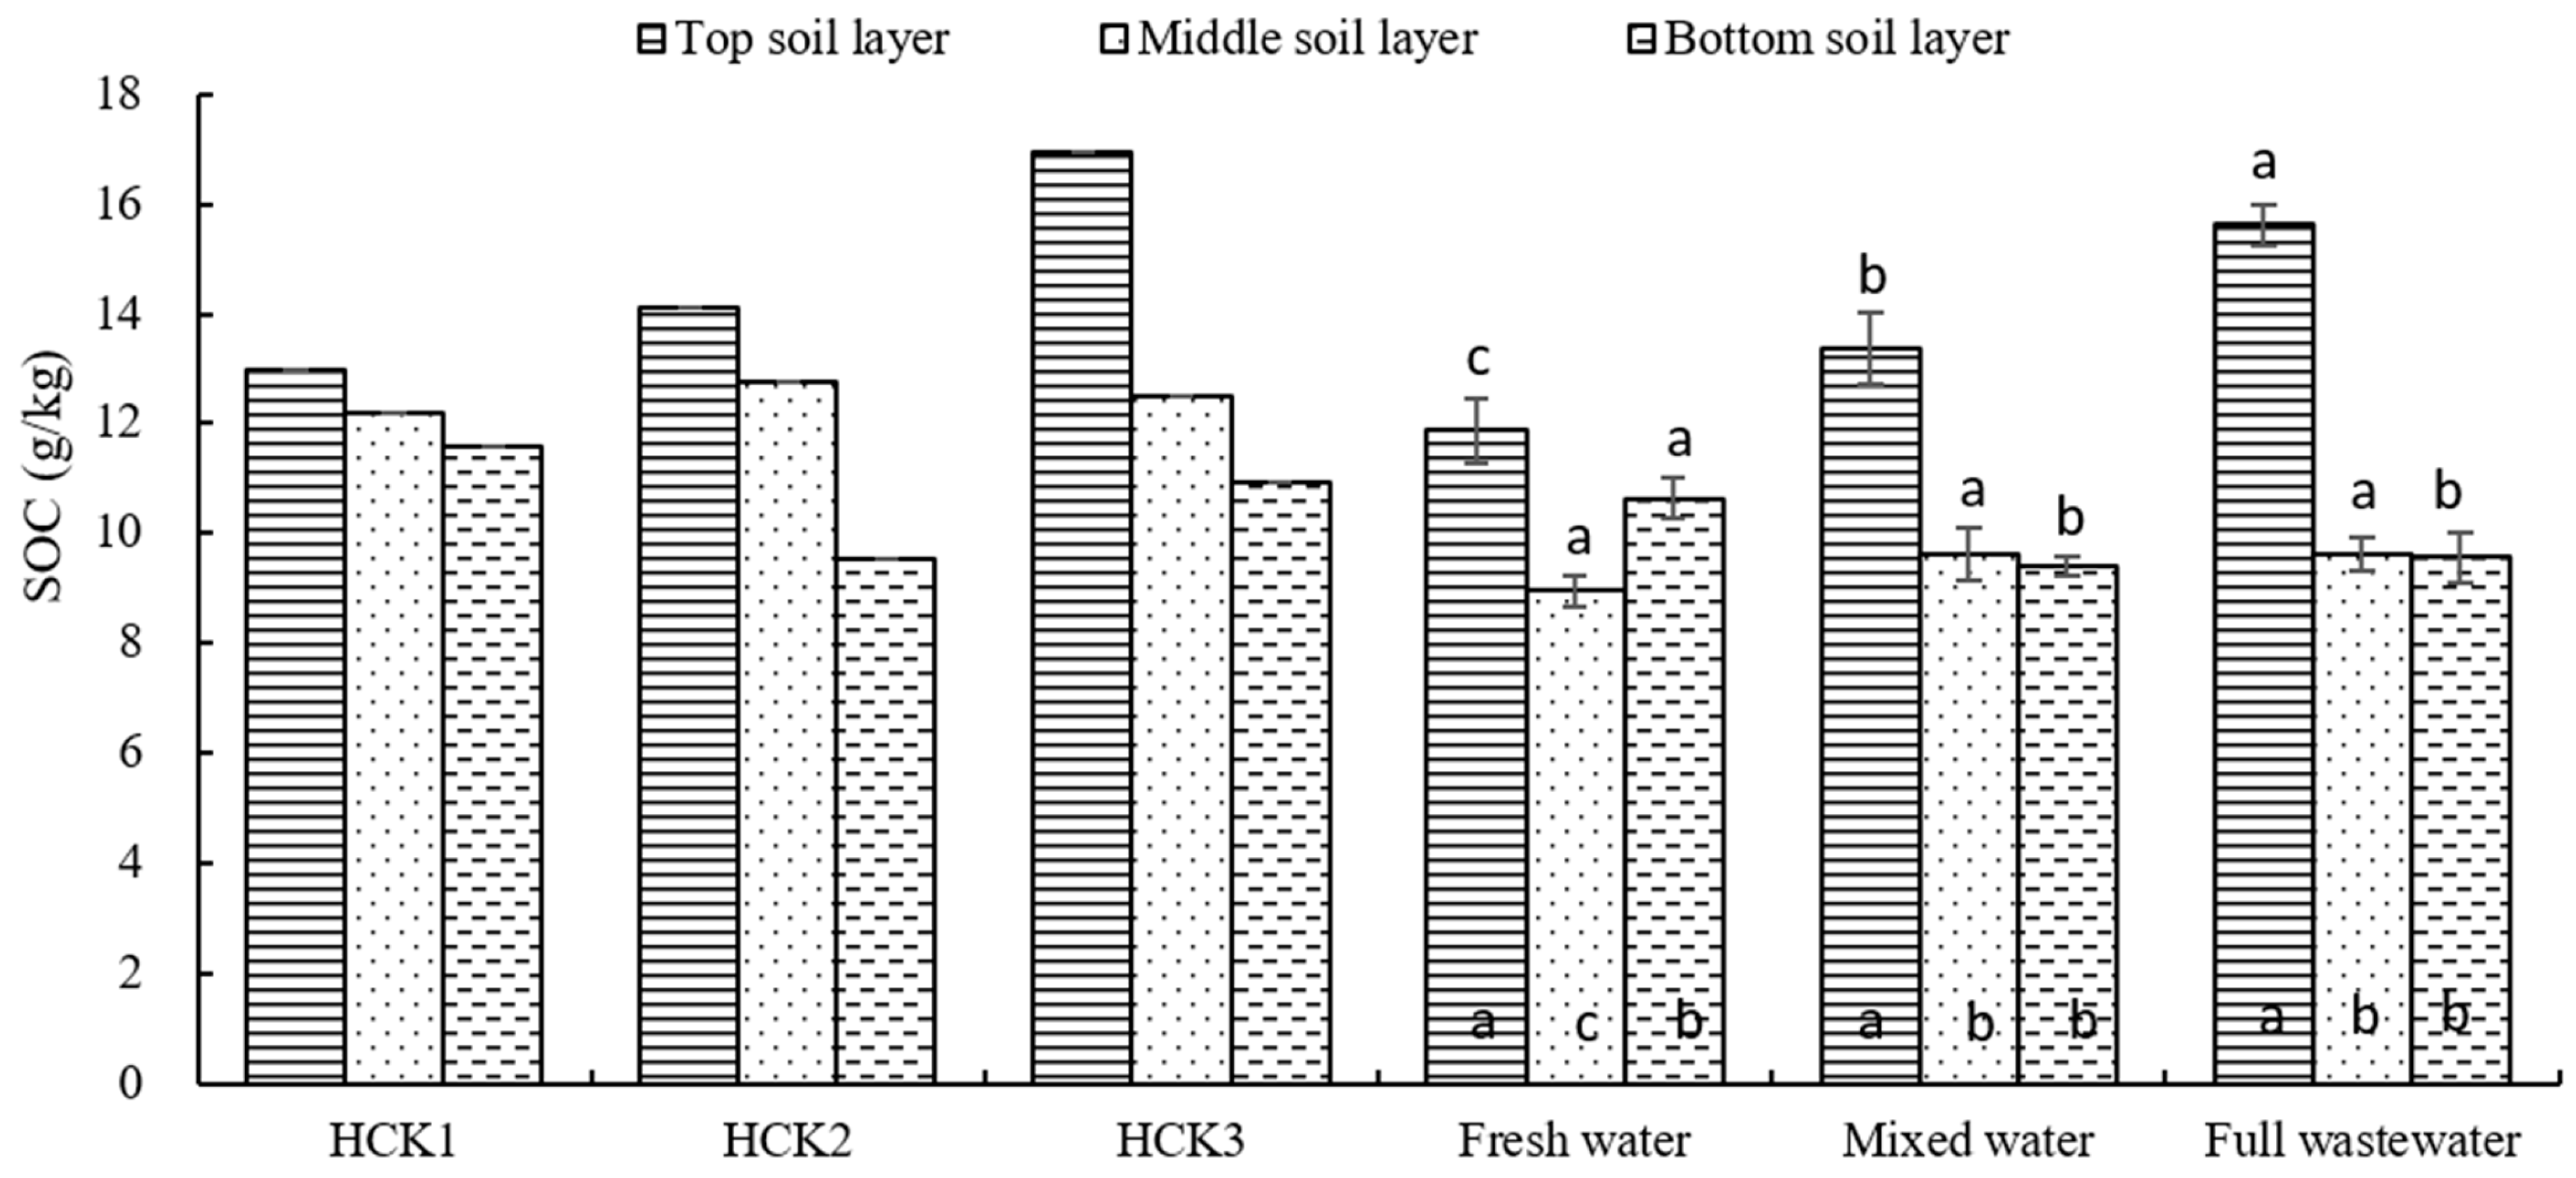
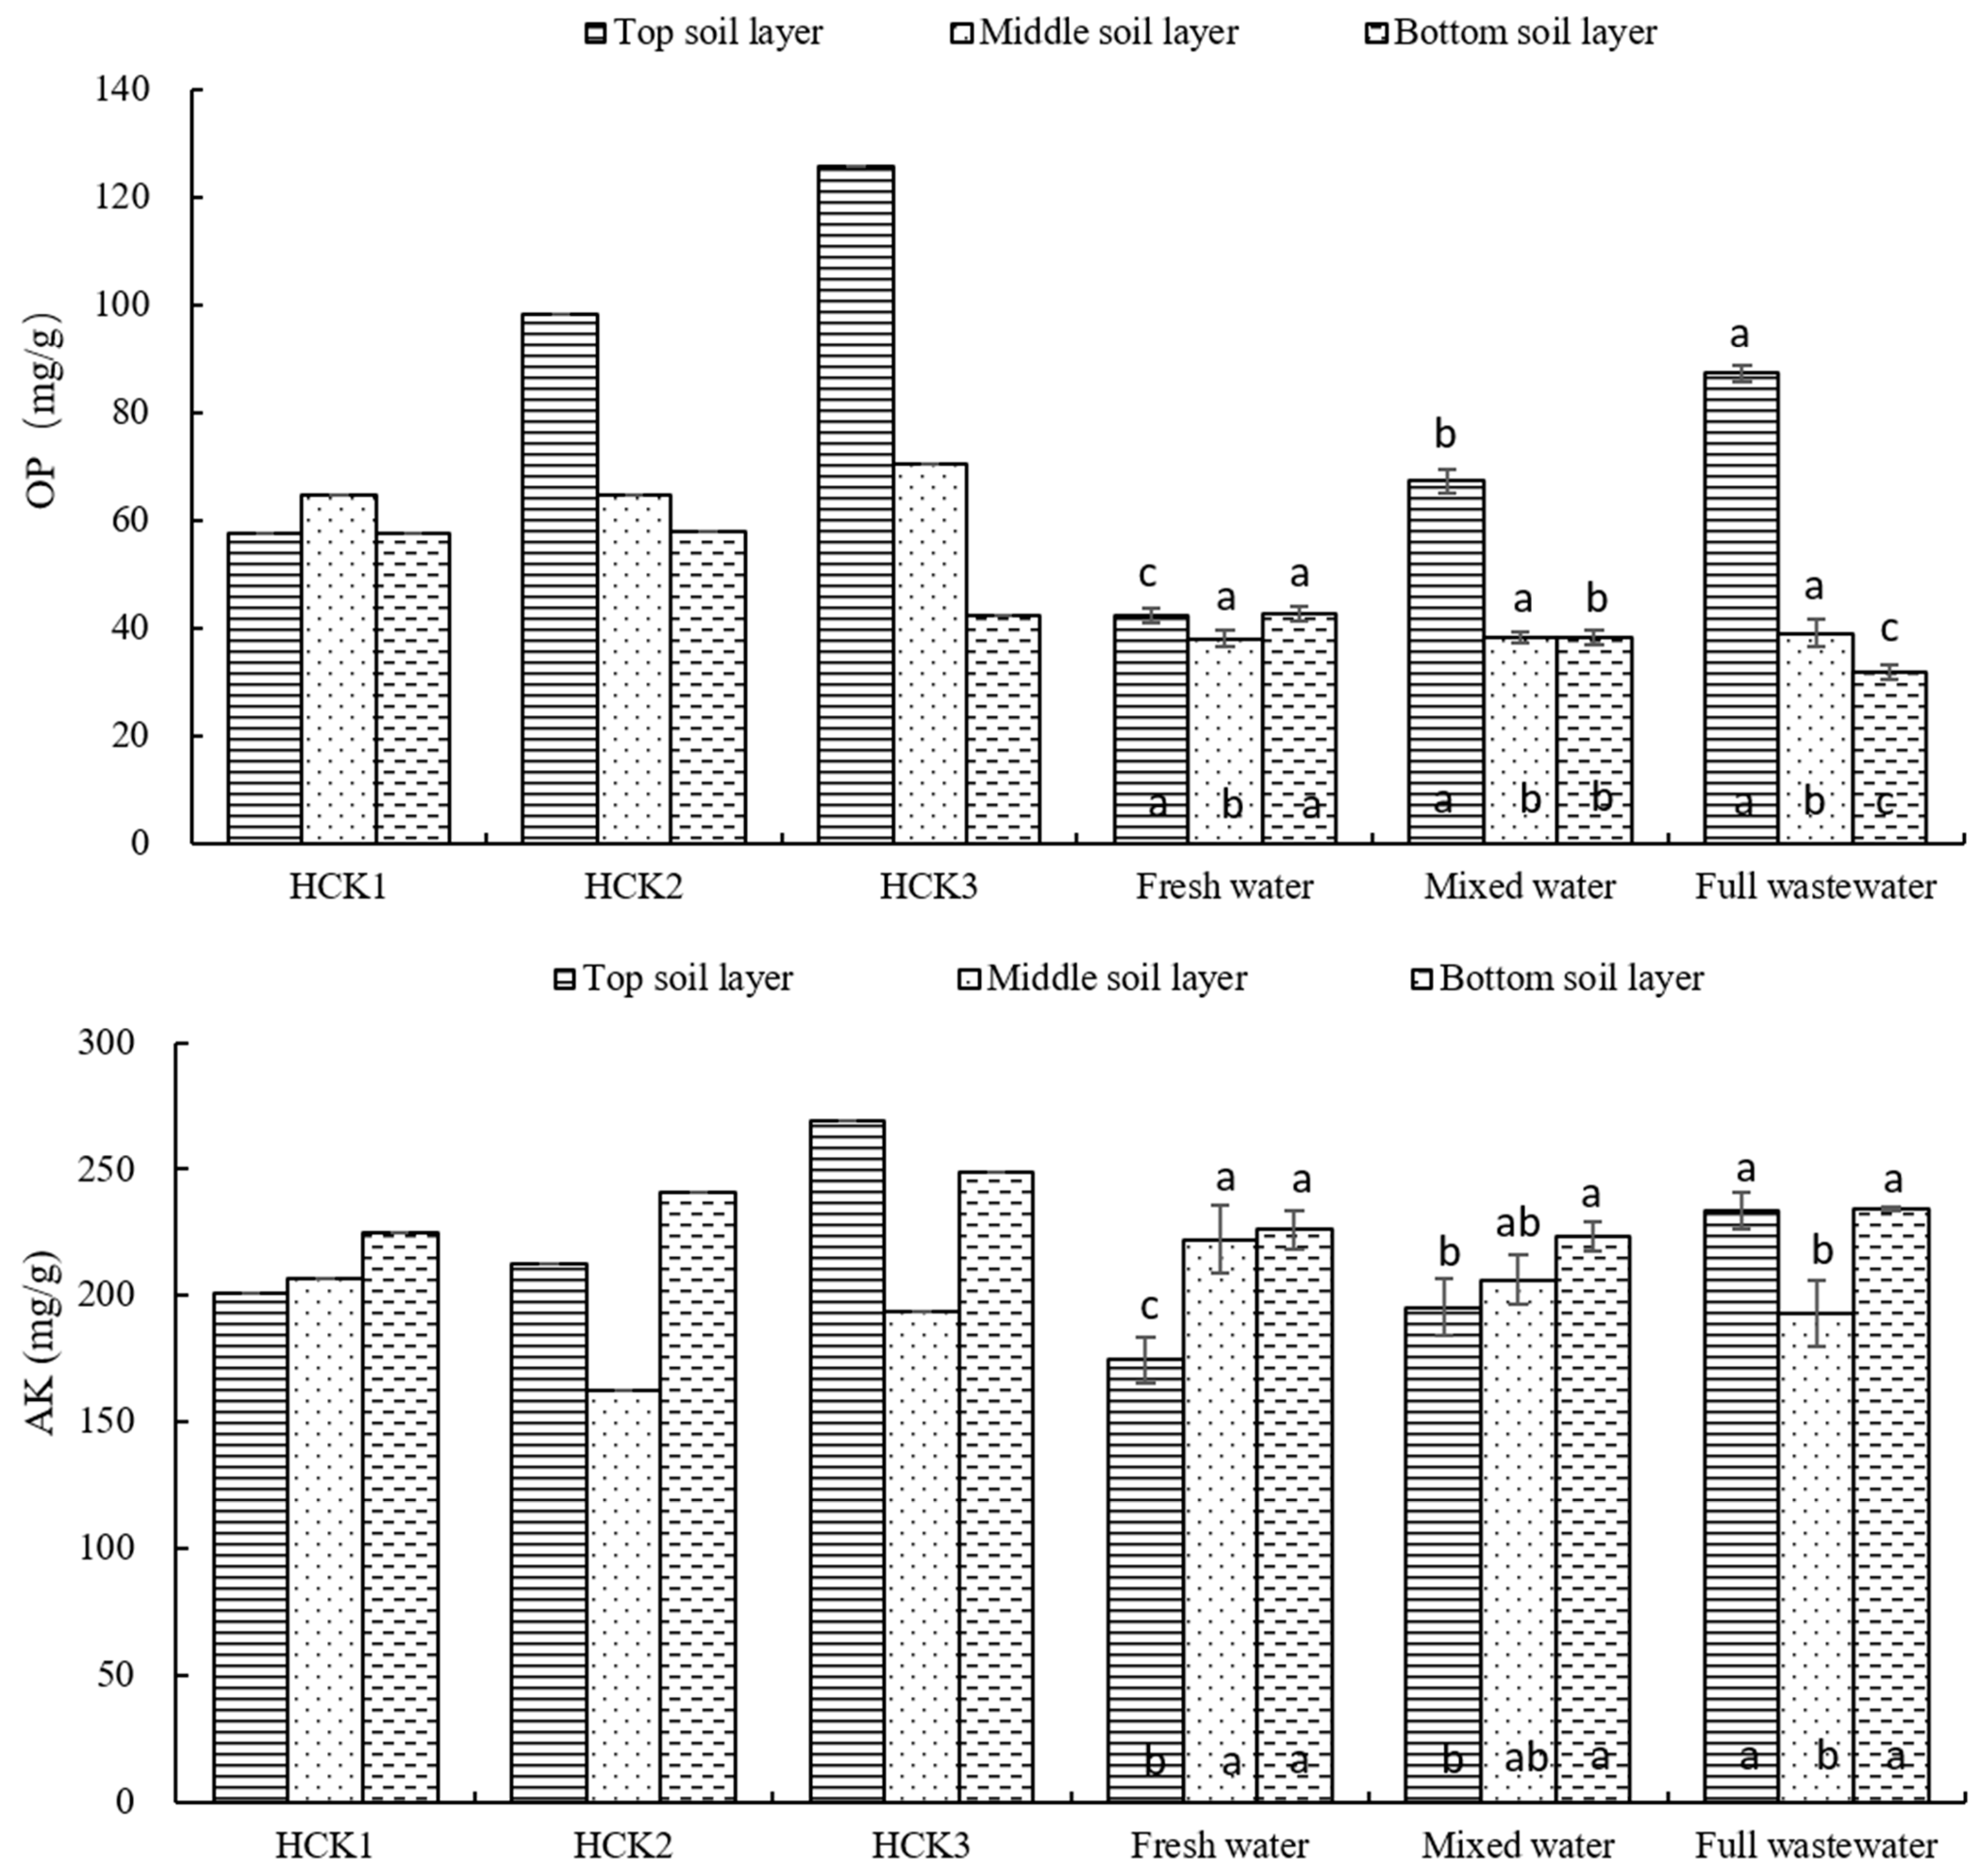
3.2. Soil Environmental Changes under Culture Wastewater Irrigation Mode

The results of testing the soil physicochemical properties at the end of the experiment are shown in Figure 4 and Figure 5. For the soil pH, the mariculture wastewater irrigation conditions enhanced the alkalinity of the soil in all layers. The higher the ratio of culture wastewater, the higher the final soil pH was. For the soil salinity (EC value), the root uptake of the salt-tolerant crop itself could significantly reduce the soil salinity, but the enhancement effect of mariculture wastewater on the soil salinity was also significant. According to the experimental observations, the negative effect was stronger in the early stage of crop growth. As the crop continued to grow, its positive effect began to dominate. Eventually, the salt uptake rate of the crop was greater than the salt accumulation rate brought by wastewater irrigation. For the soil nutrient content, the root uptake of salt-tolerant crops significantly reduced the contents of various nutrients in the soil except for fast-acting potassium. The law was mainly reflected in the surface layer of the soil, while irrigation by farming wastewater increased the contents of various nutrients. The nutrient content also increased as the ratio of wastewater increased. The nutrient content of the middle and subsoil tended to remain within a more stable range.
In conclusion, compared with freshwater irrigation, a high ratio of wastewater irrigation significantly increased the organic matter and fast-acting nutrient content in the soil surface layer (0–10 cm). Thus, it enhanced soil fertility compared with freshwater irrigation. The root uptake of saline-tolerant rice could largely offset the accumulation of soil salts from the farming wastewater. In general, the effect of irrigating salt-tolerant crops with farm wastewater on the soil was positive.

3.3. Accounting for Comprehensive Benefits of Farm Wastewater Irrigation Model

Based on the data on the crop yield, above-ground biomass, soil nutrient content, and soil salinity monitored in the experiment, the value of each economic and ecological benefit generated from the farmland under the farming wastewater irrigation mode was quantitatively accounted for according to the calculation methods in Section 2.3.
(1) Value of agricultural products (EBD)
The direct economic benefits under the freshwater irrigation and wastewater irrigation modes were calculated under the cropping conditions of this experiment shown in Table 6. The direct economic return of salinity-tolerant rice under full-wastewater irrigation was 33,187.11 RMB/hm2, while the direct economic return under freshwater irrigation was 28,863.87 RMB/hm2. Under the same conditions of other factors, the direct economic return brought by using wastewater irrigation increased by 14.98% compared with the traditional freshwater mode.
(2) Fertilizer cost reduction (EBI1)
In this study, assuming the actual planting with wastewater irrigation and supplemental fertilizer application model, the average fertilizer application in Jiangsu Province was used as the basis to project the fertilizer application savings, based on the total amount of nitrogen and phosphorus elements input from the wastewater irrigation. Then, the discounted amount of supplemental fertilizer application under the different models was calculated (Table 7).
It can be seen that the degree of fertilizer substitution differed between the three different irrigation water qualities due to the different contents of N, P, and K. The average cost of fertilizer in Jiangsu Province was 28.36 RMB/hm2, 788.87 RMB/hm2, and 1515.01 RMB/hm2, respectively (Table 8). The savings in fertilizer costs for the three irrigation modes were considerable compared with the traditional mode.
(3) Wastewater dissipation (EBI2)
The direct usage of mariculture wastewater for the irrigation of salt-tolerant crops can purify the wastewater with root absorption. Thus, it can reduce the cost of purification of the same amount of mariculture wastewater for irrigation under artificial treatment. The calculation results of the benefit value are shown in Table 9. Under the wastewater irrigation mode, 3108.57 m3 of aquaculture wastewater could be dissipated per hectare of farmland, and 1490.48 m3 could be dissipated under mixed irrigation. If the cost of wastewater treatment was 1.67 RMB/m3, the wastewater irrigation model could generate 5191.31 RMB/hm2 of mariculture wastewater dissipation benefits compared with traditional freshwater irrigation.
(4) Soil organic matter accumulation (ECOBD1)
The benefits of soil organic matter accumulation under the various irrigation water treatments were calculated with the results shown in Table 10. The value of the amount of organic matter accumulation benefits under conventional freshwater irrigation was 7328.97 RMB/hm2, while the value of the amount under the wastewater irrigation mode was 14,156.84 RMB/hm2, which was nearly double compared with that of freshwater irrigation.
(5) Soil nutrient enhancement (ECOBD2)
According to the shadow price method, the values of alkaline decomposed nitrogen, effective phosphorus, and fast-acting potassium were converted into the market prices of fertilizers containing the same amounts of nutrients, which were 3.15 RMB/kg, 8.82 RMB/kg, and 3.46 RMB/kg, respectively. The soil nutrient enhancement values are shown in Table 11. The soil nutrient enhancement values under the three treatments were −1496.27 RMB/hm2, −1296.43 RMB/hm2, and −886.24 RMB/hm2. The cumulative benefits of soil nutrients in the wastewater irrigation mode were negative in terms of value alone, but the negative increase was less than that with freshwater irrigation without fertilization. The loss was reduced compared with freshwater irrigation. The value of this benefit could reach a positive value if the irrigation water is farm wastewater with a higher concentration of nutrients.
(6) Soil salinity mitigation (ECOBD3)
According to a related study [27], the costs of treatment were 80,000 RMB/hm2, 110,000 RMB/hm2, and 140,000 RMB/hm2 for lightly salinized arable land (EC value: 2000−4000 μS/cm), moderately saline soils (EC value: 4000−8000 μS/cm), and heavily saline soils (EC value: 8000−16,000 μS/cm), respectively. Thus, the cost of treatment by the proportional conversion was the unit conductivity reduction benefit value of light saline soil 110,000 80,000 6000 3000 = 10 RMB/(μS/cm·hm−2), and the unit conductivity reduction benefit value of medium saline soil 140,000 110,000 12,000 6000 = 5 RMB/(μS/cm·hm−2).
The soil salinity improvement benefits were calculated under each treatment with the results shown in Table 12. Under the three different treatments, only the final EC values of all layers of soil under freshwater irrigation were lower than before planting (1923 μs/cm) and achieved salinity improvement. However, the value of the benefit generated was negligible because the original soil in this experiment was at a low salinity level. The EC values of the soil under mixed-water and full-wastewater irrigation were higher than the original soil and exceeded 2000 μS/cm, so the benefit value was negative.
(7) Fertilizer pollution abatement (ECOBI)
Relevant studies have shown that the main sources of agricultural surface source pollution are the excessive and unreasonable application of nitrogen and phosphorus fertilizers, while potassium fertilizers do not directly cause agricultural surface source pollution [34]. Thus, this paper mainly considered the destination of N and P elements in pollution activities. According to the existing results [13,35], agricultural fertilizer pollution-generating pollutants were classified into atmospheric pollutants (NH3, N2O, and NOx), water pollutants (NH4+, NO3, and PO43−), and soil pollutants (NO3, PO43−, and Cd). Following the previous steps, the doses of the various pollutants generated by fertilizer application within each hectare of farmland are calculated in Table 13. Based on the local average fertilizer application intensity in 2020 (229.22 kg/hm2 for N fertilizer and 87.48 kg/hm2 for phosphorus fertilizer), the process produced an average of 13.65 kg of ammonia, 2.37 kg of nitrous oxide, 3.06 kg of NOx, 66.94 kg of aqueous nitrate, 9.60 kg of aqueous ammonium nitrogen, 4.84 kg of water column phosphate, 344.71 kg of soil nitrate, 37.00 kg of soil phosphate, and 127 mg of soil cadmium contamination. The above pollutants were significantly reduced under mixed irrigation and wastewater irrigation due to a significant reduction in fertilizer reapplication.
On the basis of the dose of pollutants generated, the emergy values of environmental services of air, water, and soil required to dilute and dissipate these pollutants were calculated and converted into monetary units according to the monetary ratio of the emergy values. The calculation results are shown in Table 14 and Table 15. Under the traditional cropping model, each hectare of farmland required 2.98 × 10¹⁶ solar emjoules (abbreviated as sej) of the environmental service emergy value to offset the surface source pollution due to fertilizer application. It was converted into monetary units of RMB 88,258.93. Under farming wastewater irrigation, due to the reduction in chemical fertilizer application, the environmental cost caused by wastewater was also reduced. The savings under two ratios of wastewater irrigation relative to the traditional model were 27,161.21 RMB/hm2 and 55,178.39 RMB/hm2, respectively.
(8) Summary of comprehensive benefits
The direct/indirect economic and ecological benefits under the different irrigation modes are aggregated in Table 16. The integrated benefit values of the farming systems under freshwater irrigation, mixed irrigation, and wastewater irrigation were 36,164.44 RMB/hm2, 64,999.55 RMB/hm2, and 104,439.10 RMB/hm2, respectively. Wastewater irrigation increased the benefit value by 188.8% relative to freshwater irrigation, which was a significant improvement.
It is worth mentioning that the total economic benefits generated under the three different treatments were 28,892.23 RMB/hm2, 30,015.15 RMB/hm2, and 39,893.43 RMB/hm2, and the total ecological benefits generated were 7272.21 RMB/hm2, 34,984.40 RMB/hm2, and 64,545.66 RMB/hm2, respectively. It is noticeable that the difference in the ecological benefits between the different treatments was higher than that in the economic benefits. This was because the economic benefits were mainly derived from the value of agricultural products produced on the farm (the value of agricultural products accounted for 83.19% of the total economic benefits), and the difference in the crop yield and quality observed in the experiment under the different treatments was not huge. Thus, there were relatively small differences between the treatments in economic benefits. However, the main source of ecological benefits was the reduction in the environmental costs of surface pollution (85.49% of the total ecological benefits). Whether or not to use farming wastewater for irrigation and the amount of irrigation had the most direct effects on the amount of fertilizer applied. Thus, the ecological benefits generated under the different ratios of irrigation treatments produced results with large differences.
In addition, saline-tolerant rice irrigated by mariculture wastewater generated significant ecological benefits. For example, the ecological benefits quantified by the method of this paper were 61.80% of the total benefits, which was converted into a monetary value of about twice the market value of the agricultural products themselves. The reduction in environmental management costs was more meaningful than the increase in crop yield and the reduction in input costs, which was the biggest benefit of this cropping mode. However, in the actual production process, farmers tended to focus only on crop yield, quality, and direct economic value while easily ignoring the various environmental costs associated with traditional freshwater fertilization. They concentrated on the economic benefits in their management decision regardless of the ecological benefits, which resulted in a massive amount of irrigation and drainage, excessive fertilization, excessive baiting, etc. This exacerbates agricultural and coastal pollution. The shortage of regulations on the pollution from agriculture and mariculture resulted in the lack of farmers’ participation in the controlling process. It is important to promote farmers’ awareness of ecological benefits in the future.

4. Conclusions

Currently, coastal areas confront dual pressures: environmental pollution and resource constraints. Rational resource allocation between salt–soil agriculture and mariculture, coupled with the effective utilization of mariculture wastewater, are crucial strategies for fostering sustainable development in coastal fishery and agriculture. It is of great significance in mitigating agricultural surface and offshore aquaculture pollution, as well as alleviating the scarcity of freshwater resources. In this study, we utilized mariculture wastewater to irrigate salinity-tolerant rice under saline soil conditions, monitored the rice yield and soil environment, and developed a quantitative computational method to assess the comprehensive farmland benefits based on a field experiment conducted on specific plots. Methods including ecosystem service function value assessment and emergy value theory were employed to evaluate the viability of irrigating the salt-tolerant crop model with mariculture wastewater. The main findings indicate that mariculture wastewater irrigation exerted a positive influence on the growth and yield enhancement of salt-tolerant rice. In comparison with freshwater irrigation, the theoretical yield of rice irrigated with mariculture wastewater increased by 9.01%. The utilization of mariculture wastewater for irrigation enhanced the nutrient contents in the soil, specifically the levels of organic matter, fast-release potassium and phosphorus, and alkaline hydrolysis nitrogen. At a later growth stage, the uptake of nutrients by the roots of salt-tolerant crops could counteract the elevation in soil salinity resulting from the use of mariculture wastewater for irrigation. Under the current experimental setup, irrigation with mariculture wastewater and freshwater yielded benefit values of 104,439.10 RMB/hm2 and 36,164.44 RMB/hm2, respectively. Compared with freshwater irrigation, the comprehensive benefits of mariculture wastewater irrigation exhibited a remarkable increase of 188.8%. The ecological benefits comprised the majority (61.80%) of the comprehensive benefits. This suggests that the prevailing traditional farming model harbors substantial potential for ecological enhancement, thereby enabling the optimization of comprehensive benefits through prudent resource allocation.
In summary, the utilization of wastewater as a resource has multiple benefits, including mitigating environmental pollution, augmenting crop productivity, and ameliorating soil quality. This practice holds potential for promotion and application, considering its contributions to yield enhancement, income generation, environmental sustainability, and overall ecological friendliness. However, the potted plant experiment in this study served as a simulated planting trial, involving the transportation of saline–alkali soil to the experimental site and the utilization of artificially formulated aquaculture wastewater. This simulated experiment differed to some extent from the practical farming of salt-tolerant crops irrigated with mariculture wastewater in coastal saline–alkali soil environments. Further research could be conducted in the corresponding field to be more realistic. In studies examining alterations in soil nutrient and salt concentrations, the restricted depth and enclosed base of pot experiments have limited the consideration of vertical transport’s impacts on the results. To achieve a more profound comprehension of the underlying mechanisms, future research could prioritize the dynamic monitoring and analysis of soil properties across varying depths.

Author Contributions

Conceptualization, D.C. and Z.L.; methodology, Z.L. and D.C.; software, D.C.; validation, H.L. and Z.F.; formal analysis, Z.F. and H.L.; investigation, Z.F. and D.C.; writing—original draft preparation, H.L. and Z.F.; writing—review and editing, J.D. and D.C.; supervision, D.C. and Z.L.; project administration, Z.L.; funding acquisition, Z.L. All authors have read and agreed to the published version of the manuscript.

Funding

This research was funded by the National Key Research and Development Program of China (grant number: 2020YFD0900703).

Data Availability Statement

The data that support this study cannot be publicly shared due to ethical or privacy reasons and may be shared upon reasonable request to the corresponding author if appropriate.

Acknowledgments

We are grateful to the reviewers and editors for their insightful reviews and valuable comments that helped to improve this manuscript.

Conflicts of Interest

The authors declare no conflicts of interest.

Abbreviations

AKAvail-K
ANAlkali-N
CdCadmium
EBEconomic benefits
EBDDirect economic benefits
EBIIndirect economic benefits
ECEconomic costs
ECOBEcological benefit
ECOBDDirect ecological benefits
ECOBIIndirect ecological benefits
EcoCEcological cost
NNitrogen
OPOlsen-P
PPhosphorus
SOCSoil organic carbon
SOMSoil organic matter content

References

  1. Zhai, W.; Liu, W.; Fan, S. Problems and countermeasures facing coastal mudflat resource management. China Land 2022, 5, 49–50. [Google Scholar] [CrossRef]
  2. Mcginn, A.P. Rocking the boat: Conserving fisheries and protecting jobs. Wash. D 1998, 142, 23–26. [Google Scholar]
  3. Chen, Z.; Zheng, A. Estimation of self-pollution and pollution load from mariculture. J. Xiamen Univ. 2004, 1, 258–262. [Google Scholar]
  4. Qi, Z.; Yang, J. Application of several microbial agents and microalgae in aquaculture. J. Aquat. Biol. 2004, 1, 85–89. [Google Scholar]
  5. Li, C.; Lin, S.; Zhou, J.; Ruan, S.; Chen, H. Assessment of mariculture discharge in Guangdong Province. Mar. Lake Marsh Bull. 2021, 43, 100–107. [Google Scholar] [CrossRef]
  6. Zong, H.; Yuan, X.; Wang, L.; Yu, L.; Hu, Y.; Huo, C.; Zhang, Z. Preliminary assessment of nitrogen and phosphorus output from mariculture in China. Mar. Environ. Sci. 2017, 36, 336–342. [Google Scholar]
  7. Xiong, G.; Fu, T.; Xu, X.; Xu, X.; Chen, G.; Liu, W.; Su, Q. A review of research on factors influencing seawater intrusion in coastal aquifers. Mar. Sci. 2019, 43, 102–112. [Google Scholar]
  8. Cao, W.; Hofmann, H.; Yan, G.; Scheuermann, A. Porewater exchange and iron transformation in a coastal groundwater system: A field investigation, driving mechanisms analysis, and conceptual model. Front. Mar. Sci. 2024, 11, 1385517. [Google Scholar] [CrossRef]
  9. Cao, W.; Yan, G.; Hofmann, H.; Scheuermann, A. State of the Art on Fe Precipitation in Porous Media: Hydrogeochemical Processes and Evolving Parameters. J. Mar. Sci. Eng. 2024, 12, 690. [Google Scholar] [CrossRef]
  10. Vu, D.T.; Yamada, T.; Ishidaira, H. Assessing the impact of sea level rise due to climate change on seawater intrusion in Mekong Delta, Vietnam. Water Sci. Technol. 2018, 77, 1632–1639. [Google Scholar] [CrossRef]
  11. Colombani, N.; Mastrocicco, M. Scenario Modelling Of Climate Change’s Impact On Salinization Of Coastal Water Resources In Reclaimed Lands. In Proceedings of the 2nd International Conference on Efficient and Sustainable Water Systems Management toward Worth Living Development (EWaS), Platanias, Greece, 1–4 June 2016; pp. 25–31. [Google Scholar]
  12. Feng, Y.; Niu, J. A review of environmental issues in the Chinese coastal zone. Mar. Geol. Dyn. 2004, 20, 1–5. [Google Scholar]
  13. Lai, L.; Huang, X.; Wang, F.; Hong, Y.; Xiao, S. Environmental cost estimation of fertilizer application in China. J. Soil Sci. 2009, 46, 63–69. [Google Scholar]
  14. Zhang, F.; Hu, H. Pollution effects of chemical fertilizer inputs in China and their effects on the environment. J. Hunan Agric. Univ. 2011, 12, 33–38. [Google Scholar]
  15. Zhang, W.; Wu, S.; Ji, H.; Kolbe, H. Estimation of agricultural surface source pollution in China at the beginning of the 21st century. China Agric. Sci. 2004, 37, 1008–1017. [Google Scholar]
  16. Zhang, S.; Wang, X.; Xu, C. Effect of brackish water drip irrigation on fruit quality of red jujube. North. Hortic. 2016, 23–27. [Google Scholar] [CrossRef]
  17. Liu, Z.; Deng, L.; Liu, L.; Qi, C.; Chen, M.; Xia, T. Physiological and ecological characteristics of chrysanthemum under seawater irrigation in the Laizhou sea coat. J. Plant Ecol. 2005, 29, 474–478. [Google Scholar]
  18. Liu, W.; Fan, C.; Gan, C.; Zheng, C.; Chen, C.; Chen, J.; Zheng, Q. Physiological characteristics of different saline economic plants under mariculture wastewater irrigation and their comparison. J. Soil Water Conserv. 2019, 33, 253–262. [Google Scholar]
  19. Zhao, K. Study of Salt-Tolerant Plants, Chrysanthemum and Oleander, Irrigated by Mariculture Wastewater in Laizhou Bay. Ph.D. Thesis, Nanjing Agricultural University, Nanjing, China, 2006. [Google Scholar]
  20. Wang, C.; Zhang, Y.; Zhao, L.; Lu, K.; Zhu, Z.; Chen, T.; Zhao, Q.; Yao, S.; Zhou, L.; Zhao, C.; et al. Current status, problems and suggestions of salinity-tolerant rice research. China Rice 2019, 25, 1–6. [Google Scholar] [CrossRef]
  21. Liu, R. Study on the Absorption Effect of Large Wetland Plants on Multiple Pollutants in Aquaculture Wastewater with Different Salinities. Master’s Thesis, Nanjing Agricultural University, Nanjing, China, 2017. [Google Scholar]
  22. Zheng, Y.; Lu, J. Effect of different planting and fertilization methods on yield and fertilization cost of rice. Agric. Equip. Technol. 2022, 48, 28–29+32. [Google Scholar]
  23. Zhou, X.; Li, F.; Xu, C.; Fang, F. Assessment of ecosystem service value of artificial wetland in paddy fields in Zhejiang. Zhejiang Agric. Sci. 2009, 971–974. [Google Scholar] [CrossRef]
  24. Li, Y.; Du, Z.; Wang, X.; Yang, Q.; Chen, Z.; Sun, Y.; Liu, D. Valuation of ecological service function of wetlands in the Yellow River Delta Nature Reserve. Mar. Environ. Sci. 2019, 38, 761–768. [Google Scholar]
  25. Tang, H.; Zheng, Y.; Chen, F.; Yang, G.; Zhang, H.; Kong, Q. Ecosystem service value assessment of different farmland types and cropping patterns in Beijing. Ecological Economics. Environ. Sci. Technol. 2008, 56–59+114. [Google Scholar]
  26. Li, F.; Yin, C. Ecological service function and ecological value assessment of green manure in southern rice areas. Chin. J. Ecol. Agric. 2019, 27, 327–336. (In English) [Google Scholar]
  27. Zhang, F.; Tashifrati, T.; Ding, J.; He, Q. Assessment of soil salinization in arid areas and its damage to ecological environment: An example from Shaya County, Xinjiang. J. Nat. Hazards 2009, 18, 55–62. [Google Scholar]
  28. Chen, D.; Liu, Z.; Luo, Z.; Webber, M.; Chen, J. Bibliometric and visualized analysis of emergy research. Ecol. Eng. 2016, 90, 285–293. [Google Scholar] [CrossRef]
  29. GB 3838-2002; Environmental Quality Standards for Surface Water. Ministry of Ecology and Environment of the People’s Republic of China: Beijing, China; General Administration of Quality Supervision: Beijing, China; Inspection and Quarantine of the People‘s Republic of China: Beijing, China, 2002.
  30. GB 3095-2012; Ambient Air Quality Standards. Ministry of Ecology and Environment of the People’s Republic of China: Beijing, China; General Administration of Quality Supervision: Beijing, China; Inspection and Quarantine of the People’s Republic of China: Beijing, China, 2012.
  31. Zhang, Y. Research on Resource and Environmental Costs of Grain Production in Different Types of Zones. Master’s Thesis, Northwest Agriculture and Forestry University of Science and Technology, Xianyang, China, 2012. [Google Scholar]
  32. Reza, B.; Sadiq, R.; Hewage, K. Emergy-based life cycle assessment (Em-LCA) for sustainability appraisal of infrastructure systems: A case study on paved roads. Clean Technol. Environ. Policy 2014, 16, 251–266. [Google Scholar] [CrossRef]
  33. Liu, W.; Geng, C.; Sun, L.; Tian, X.; Zhang, L. Ecological compensation mechanism for non-ferrous metal mineral resources mining based on emergy value theory. J. Ecol. 2016, 36, 8154–8163. [Google Scholar] [CrossRef]
  34. Li, J.; Huang, J.F.; Cheng, J. Spatial and temporal distribution characteristics of chemical fertilizer application and its possible pollution in China. Ecol. Environ. 2003, 12, 145–149. [Google Scholar]
  35. Yang, H.; Shen, X.; Lai, L.; Huang, X.; Zhou, Y. Spatio-Temporal Variations of Health Costs Caused by Chemical Fertilizer Utilization in China from 1990 to 2012. Sustainability 2017, 9, 1505. [Google Scholar] [CrossRef]
  36. Liu, J.; Xu, W.; Huang, J.; Huang, H.; Zheng, H.; He, H.; Yao, L.; Chen, C. Environmental cost estimation of fertilizer application for summer and autumn grain production in China. J. China Agric. Univ. 2015, 20, 225–232. [Google Scholar]
  37. Zewei, Y.; Hong, Y. Estimation of environmental costs of fertilizer inputs for wheat cultivation: The case of Zhenjiang, Jiangsu. Tianjin Agric. Sci. 2016, 22, 10–14. [Google Scholar]
Figure 1. The analytical framework of the inputs and outputs and environmental impacts of the fishery and agriculture system under the resource utilization of farming waste.
Agronomy 14 02161 g001
Figure 2. Step-by-step diagram for quantitative accounting of comprehensive benefits of farm wastewater irrigation model.
Agronomy 14 02161 g002
Figure 3. Yield and above-ground biomass of salinity-tolerant rice under different irrigation modes (H1–H3: freshwater irrigation; H4–H6: mixed-water irrigation; H7–H9: full-wastewater irrigation).
Agronomy 14 02161 g003
Figure 4. Changes in soil pH and EC values under irrigation patterns of farm wastewater (Note: The lowercase letters in the figure indicate statistical significance of differences).
Agronomy 14 02161 g004aAgronomy 14 02161 g004b
Figure 5. Changes in soil organic matter and nutrient content under irrigation patterns of farm wastewater. The lowercase letters indicate statistical significance of differences.
Agronomy 14 02161 g005aAgronomy 14 02161 g005bAgronomy 14 02161 g005c
Table 1. Physical and chemical characteristics of the test soil.
ParameterValueUnit
pH8.17/
EC1923μS/cm
TDS964mg/L
SOC9.29g/kg
Sal0.1%
TN0.86g/kg
TP0.69g/kg
AN77.18mg/kg
OP56.48mg/kg
AK260.00mg/kg
Table 2. Physical and chemical characteristics of the test mariculture wastewater and freshwater.
Component/ParameterContent/Value
Farming WastewaterFreshwater
TN22.68 mg/L0.60 mg/L
TP14.34 mg/L0.41 mg/L
EC1182 μS/cm440 μS/cm
Sal0.05%0.00%
DO6.37 ppm
Eh116 mV
TUB47.3 NTU
Table 3. Wastewater treatment costs taken as reference.
CostReference
1.67 RMB/m3Assessment of the value of ecosystem services of artificial wetlands in rice fields in Zhejiang [23]
0.55 RMB/m3Assessment of the ecological service function value of wetlands in the Yellow River Delta Nature Reserve [24]
0.9 RMB/m3Assessment of ecosystem service values of different farmland types and cropping patterns in Beijing [25]
Table 4. Steps for calculating the value of fertilizer pollution abatement benefits.
Calculated ItemCalculation FormulaSymbol Meaning
Dose D o s e i = M × C e i × W c W f Dosei: pollutant generation dose, t
M: nitrogen and phosphorus fertilizer application discounted amount, t
Cei: nitrogen and phosphorus fertilizer flow coefficient; Wc: molecular weight of pollutants
Wf: molecular weight of nitrogen and phosphorus elements in the pollutant after conversion to N or P2O5
Ma/w M a / w = d × W i c i Ma/w: mass of fresh air or water consumed to dilute the pollutant, t
d: density of air or water in its natural state
Wi: annual generation dose of pollutants, t
ci: maximum acceptable concentration of pollutants [29,30]
Ema E m a = 1 2 × M a × V 2 × U E V a V: average wind speed, m/s
UEVa: wind emergy value conversion rate, sej/J
Ema: atmospheric environmental service emergy value, sej
Emw E m w = M w × G × U E V w G: Gibbs free emergy of water, kj/mol
UEVw: emergy value conversion rate of water, sej/J
Emw: environmental service emergy value of water, sej
EL E L = M × L O C × E L M: dose of cadmium (Cd) production, million t
LOC: area of soil eroded by cadmium per unit mass, 0.223 kg/hm2 [31]
EL: land erosion emergy value conversion rate, 1.05 × 10¹⁵ sej/hm2 [32]
EL: soil environmental service emergy value, sej
EcoBI E c o B I = E m a + E m w + E L E m r Emr: emergy/currency ratio, sej/RMB
EcoBI: the value of avoiding agricultural surface source pollution, RMB/hm2
Note: For soil pollutants, cadmium (Cd) is considered to be the most dominant substance polluting the soil seriously, so the environmental service emergy value of Cd was used as the soil environmental service emergy value for the analysis and calculation. The units of emergy were defined as solar emjoules (abbreviated as sej) for the emergy theory and methods. The units of transformity were sej/J, defined as the solar emergy required to provide a Joule of a product or service.
Table 5. Effects of different treatments on yield and components of salinity-tolerant rice.
Irrigation ModeAbove-Ground Biomass (g/Pot)Theoretical Acreage (kg/Mu)
Freshwater irrigation701.98 ± 116.74 a442.37 ± 35.73 ab
Mixed-water irrigation802.14 ± 125.17 a358.82 ± 74.95 b
Full-wastewater irrigation885.83 ± 70.62 a482.22 ± 55.33 a
Note: Statistical significance of differences are denoted as ‘a’, ‘b’, and ‘ab’.
Table 6. Values of agricultural products under different treatments.
ModeRice Yield per Mu
(kg/Mu)
Straw Yield per Mu
(kg/Mu)
Paddy Unit Price
(RMB/kg)
Straw Unit Price (RMB/kg)Economic Value
(RMB/hm2)
Freshwater irrigation442.371337.772.840.5028,863.87
Mixed irrigation358.821528.6526,737.18
Wastewater irrigation482.221688.1533,187.11
Table 7. The amount of fertilizer supplementation for each type under the different irrigation patterns.
Irrigation ModeFreshwater Irrigation Water
(mL)
Farming Wastewater Irrigation Water
(mL)
Total Nitrogen, Phosphorus, and Potassium Input
(mg)
Fertilizer Saving Discount Strength
(kg/a.hm2)
Traditional Folded Pure Application Strength
(kg/hm2)
Fertilizer Supplementation Folded Intensity
(kg/a.hm2)
Freshwater irrigation321,700/N 193.02NF 3.68NF 229.22NF 225.54
P 131.90PF 2.51PF 87.48PF 84.97
K 0.00KF 0.00KF 58.65KF 58.65
Mixed irrigation156,525156,525N 3643.90NF 69.41NF 229.22NF 159.81
P 2308.74PF 43.98PF 87.48PF 43.50
K 1784.39KF 33.99KF 58.65KF 24.66
Wastewater irrigation/326,400N 7402.75NF 141.00NF 229.22NF 88.22
P 4680.58PF 89.15PF 87.48PF 0.00
K 3720.96KF 70.88KF 58.65KF 0.00
Table 8. Values of fertilizer cost reduction under different irrigation patterns.
ModeNitrogen Fertilizer Reapplication Cost
(RMB/hm2)
Cost of Phosphate Fertilizer Reapplication
(RMB/hm2)
Potash Supplementation Costs
(RMB/hm2)
Manpower and Machinery Costs
(RMB/hm2)
Total
(RMB/hm2)
Benefit Value (RMB/hm2)
Freshwater irrigation1208.89293.15457.47401999.5128.36
Mixed irrigation856.58150.08192.35401239.00788.87
Wastewater irrigation472.860.000.0040512.861515.01
Table 9. Costs of mariculture wastewater treatment under different cropping patterns.
ModeTest Irrigation Wastewater Volume
(m3)
Wastewater Treatment Unit Price
(RMB/m3)
Experimenting with Wastewater Treatment Cost Reductions
(RMB)
Wastewater Treatment Cost Reduction per Unit Area
(RMB/hm2)
Freshwater irrigation0.001.670.000.00
Mixed irrigation0.15650.262489.10
Wastewater irrigation0.32640.555191.31
Note: The experimental irrigation wastewater volume in this table is the sum of the irrigation volume of three replications under the same treatment in one round of planting. The experimental irrigation area was calculated according to 0.5 × 0.7 × 3 = 1.05 m2.
Table 10. Values of cumulative benefits of soil organic matter under different irrigation patterns.
ModeSoil LayerOrganic Matter Content
(g/kg)
Organic Matter Accumulation
(g/1.05 m2)
Organic Matter Accumulation Value
(RMB/hm2)
Total
(RMB/hm2)
Freshwater irrigationSL11.88117.735247.257328.97
ML8.96−15.19−676.95
BL10.6361.892758.66
Mixed irrigationSL13.39189.038425.289342.95
ML9.6215.02669.37
BL9.415.57248.30
Wastewater irrigationSL15.62289.7612,915.0514,156.84
ML9.6114.87662.97
BL9.5712.99578.82
Note: SL is the surface soil layer; ML is the middle soil layer; BL is the bottom soil layer.
Table 11. Value of cumulative benefits of soil nutrients under different irrigation patterns.
ModeDepthANOPAKTotal
(RMB/hm2)
Accumulated Volume
(mg/kg)
Value
(RMB/hm2)
Accumulated Volume
(mg/kg)
Value
(RMB/hm2)
Accumulated Volume
(mg/kg)
Value
(RMB/hm2)
Freshwater irrigationSL−9.17−37.55−14.11−161.76−85.15−383.02−1496.27
ML−28.65−117.68−18.39−211.48−37.7−170.10
BS−24.05−99.93−13.77−160.14−33.88−154.62
Mixed irrigationSL−11.45−47.5610.82125.81−64.52−294.23−1296.43
ML−35.13−145.08−18.21−210.59−53.68−243.50
BS−24.98−103.62−18.2−211.37−36.49−166.29
Wastewater irrigationSL3.6314.9630.92356.42−26.16−118.32−886.24
ML−27.15−111.94−17.4−200.87−67.02−303.56
BS−28.45−117.96−24.75−287.31−25.84−117.67
Table 12. Benefit values of soil salinity improvement under different cropping patterns.
ModeDepthEC
(μS/cm)
Soil EC Reduction Value (μS/cm)Salinity Improvement Benefits
(RMB/hm2)
Total
(RMB/hm2)
Freshwater irrigationSL1762160.67/0.00
ML1725198.33/
SS1769154.00/
Mixed irrigationSL1977−54.00/−223.33
ML2000−77.00/
SS2022−99.33−223.33
Wastewater irrigationSL2236−312.67−2356.67−3903.33
ML2102−179.00−1020.00
SS2053−129.67−526.67
Note: The degree of soil salinization was low when the EC value was below 2000 μS/cm. Changes in the EC value within this range did not cause the improvement or deterioration of the farming environment, so the salinization improvement benefits within this range were not counted. SL is the surface soil layer; ML is the middle soil layer; SS is the bottom soil layer.
Table 13. Dose per unit area of each type of pollutant produced by fertilizer application.
Pollutant TypeAtmospheric PollutantsWater PollutantsSoil Pollutants
NH3N2ONOxNO3NH4+PO4NitratesPO4Cd
Flow factor Cei0.050.00670.0050.0670.0330.0850.3450.651.5 × 10−6
Wc/Wf1.211.572.714.431.290.674.430.671
Nitrogen/phosphorus fertilizer discounted supplemental application amount
(kg/hm2)
Freshwater irrigation225.54225.54225.54225.54225.5484.97225.5484.9784.97
Mixed irrigation159.81159.81159.81159.81159.8143.50159.8143.5043.50
Wastewater irrigation88.2288.2288.2288.2288.22088.2200
Dose of pollutant generation
(kg/hm2)
Freshwater irrigation13.652.373.0666.949.604.84344.7137.001.27 × 10−4
Mixed irrigation9.671.682.1747.436.802.48244.2518.956.53 × 10−5
Wastewater irrigation5.340.931.2026.183.760134.8200
Note: The nitrogen and phosphorus transport destination and transformation ratio refer to domestic and foreign research results [13,36,37]. For nitrogen fertilizer, the crop uptake rate in agricultural fields is about 20–50%, taking the average value of 35%. The flow rate to the soil is about 30–40%, and the residual rate is 34.5%. The flow rate to the atmosphere is about 10–30%, taking the average value of 20%, of which ammonia (NH3), N2O, and NOx are 5%, 0.67%, and 0.5% of the converted amount of nitrogen fertilizer application, respectively. The rate of surface runoff is about 10%, of which nitrate nitrogen (NO3) is about 6.7% and ammonium nitrogen (NH4+) is about 3.3%, and the rate of underground leaching is about 0.5%. For phosphorus fertilizer, the uptake rate of crops in farmland is about 7–15%, taking the average value of 11%. The proportion of soil adsorption is about 55–75%, with an average of 65%. The proportion of runoff carried to surface water is about 5−10%, with an average of 7.5%. The proportion of groundwater is less than 1%, calculated here as 1%. The proportion of flow to the atmosphere is about 5%, with no obvious pollution, which is not considered here. In addition, the cadmium (Cd) content in phosphate fertilizer is about 0.25−2.5 mg/kg, calculated here as 1.5 mg/kg.
Table 14. Results of integration of environmental service emergy values caused by fertilizer application under different cropping patterns.
Pollutant TypeAtmospheric PollutantsWater PollutantsSoil Pollutants
NH3N2ONOxNO3NH4+PO4NitratesPO4Cd
Naturally acceptable concentration5 mg/m30.25 mg/m30.25 mg/m30.2 mg/L20 mg/L0.5 mg/L50 mg/kg50 mg/kg0.3 mg/kg
Atmospheric/water column density (kg/m3)1.2931000/
Atmospheric/water/soil quality required to dilute pollutants (kg)Freshwater irrigation3.53 × 1061.23 × 1071.58 × 1073.35 × 1084.80 × 1059.68 × 1066.89 × 1067.40 × 1054.25 × 102
Mixed irrigation2.50 × 1068.69 × 1061.12 × 1072.37 × 1083.40 × 1054.96 × 1064.88 × 1063.79 × 1052.18 × 102
Wastewater irrigation1.38 × 1064.80 × 1066.18 × 1061.31 × 1081.88 × 1050.002.70 × 1060.000.00
Average wind speed (m/s)7.5//
Wind emergy value conversion rate (sej/J)2450//
Gwater (j/kg)/4940/
Energy conversion rate of water (sej/J)/18,000/
Cadmium mass required for contamination of arable land (kg/hm2)//4.48
Emergy value conversion rate of arable land (sej/hm2)//1.05 × 1015
Atmospheric/water/soil environmental service emergy values (sej)Freshwater irrigation2.43 × 10118.46 × 10111.09 × 10122.98 × 10164.27 × 10138.61 × 10142.99 × 1010
Mixed irrigation1.72 × 10115.99 × 10117.72 × 10112.11× 10163.02 × 10134.41 × 10141.53 × 1010
Wastewater irrigation9.51 × 10103.31 × 10114.26 × 10111.16 × 10161.67 × 10130.000.00
Table 15. The values of surface pollution abatement benefits under different cropping patterns.
ModelTotal Environmental Service Emergy Value (sej/hm2)Emergy/Currency Ratio (RMB/sej)Environmental Costs by Model (RMB/hm2)Traditional Environmental Costs (RMB/hm2)Value of Benefits
(RMB/hm2)
Freshwater irrigation2.98 × 10162.97 × 10−1288,258.9389,698.441439.51
Mixed irrigation2.11 × 101662,537.2327,161.21
Wastewater irrigation1.16 × 101634,520.0555,178.39
Table 16. The values of integrated benefits of farming systems under different irrigation patterns.
Accounting Benefits ClassificationFreshwater IrrigationMixed IrrigationWastewater Irrigation
Economic benefits (RMB/hm2)Direct economic benefitsValue of agricultural products28,863.8726,737.1833,187.11
Indirect economic benefitsFertilizer application cost reduction28.36788.871515.01
Wastewater treatment cost reduction0.002489.105191.31
Total28,892.2330,015.1539,893.43
Ecological benefits (RMB/hm2)Direct ecological
benefits
Soil organic matter accumulation benefits7328.979342.9514,156.84
Soil quick-acting nutrient accumulation benefits−1496.27−1296.43−886.24
Soil salinity improvement benefits0.00−223.33−3903.33
Indirect ecological benefitsEnvironmental cost reduction for surface source pollution1439.5127,161.2155,178.39
Total7272.2134,984.464,545.66
Comprehensive benefits (RMB/hm2)36,164.4464,999.55104,439.10
Disclaimer/Publisher’s Note: The statements, opinions and data contained in all publications are solely those of the individual author(s) and contributor(s) and not of MDPI and/or the editor(s). MDPI and/or the editor(s) disclaim responsibility for any injury to people or property resulting from any ideas, methods, instructions or products referred to in the content.

