Article

Combined Effects of Nitrogen Addition and Warming on Shrub Growth and Nutrient Uptake through Microbially Mediated Soil Fertility

1
Xi’an Botanical Garden of Shaanxi Province, Institute of Botany of Shaanxi Province, Cuihua Road 17, Xi’an 710061, China
2
Shaanxi Engineering Research Centre for Conservation and Utilization of Botanical Resources, Xi’an 710061, China
3
Aerial Survey and Remote Sensing Bureau of China Coal Geology Administration, Xi’an 710100, China
*
Author to whom correspondence should be addressed.
Agronomy 2024, 14(9), 2167; https://doi.org/10.3390/agronomy14092167
Submission received: 3 August 2024 / Revised: 28 August 2024 / Accepted: 13 September 2024 / Published: 22 September 2024
(This article belongs to the Section Grassland and Pasture Science)

Abstract

:
Plant restoration strategies are ubiquitously employed for the purposes of soil and water conservation and ecological improvement in forest ecosystems. Despite N and temperature being acknowledged as pivotal factors affecting plant restoration outcomes, their effects on soil fertility, microbial communities, and shrub biomass remain underexplored, particularly in the loess hilly regions of China. Here, we examined the growth patterns and nutrient acquisition abilities of three shrub species, Periploca sepium, Amorpha fruticosa, and Vitex negundo, along with the attendant alterations in soil properties and microbial community composition under controlled greenhouse conditions. Specifically, we imposed three levels of N fertilization (200, 400, and 600 kg ha−1; designated as N1, N2, and N3, respectively) and temperature regimes (18–23, 25–30, and 32–37 °C; labeled T1, T2, and T3, respectively). The results indicated a significant interplay between the combination of N fertilization and temperature significantly affecting shrub growth. Optimal growth conditions, as evidenced by the highest dry biomass accumulation, were identified as N3T1 for A. fruticosa, N1T1 for P. sepium, and N2T2 for V. negundo, with these conditions differentially influencing roots, stems, and leaves. Furthermore, soil microorganisms also responded significantly to the N fertilization and temperature. However, this was largely dependent on shrub species and soil nutrients. For A. fruticosa under N3T1 conditions, Actinobacteria and Basidiomycota abundances correlated strongly with soil C, N, and P contents, while leaf N uptake significantly correlated with the structure of both bacterial and fungal communities. For P. sepium at N1T1, Acidobacteriota was dominant in response to soil N and C, while leaf C uptake and leaf and stem N uptake positively correlated with bacterial and fungal communities, respectively. For V. negundo at N2T2, Chloroflexi had the greatest abundance, responding to the greatest variation in soil N and C, while its stem N uptake was significantly related to the structure of the fungal communities. Thus, our findings underscored the intricate interplay between abiotic factors, shrub growth, soil fertility, and microbial community dynamics, providing insights into the optimization of plant restoration efforts in ecologically sensitive regions.

1. Introduction

The Loess Plateau, a globally recognized vulnerable ecosystem situated in northern China, confronts severe challenges arising from its arid climate, nutrient-poor soils, and pervasive desertification. In response, comprehensive soil and water conservation measures, notably the landmark “Grain for Green” program initiated in 1999, have been implemented, resulting in notable ecological improvements [1]. By the end of the 2000s, the region witnessed a substantial increase in forest cover, from 14.8% to 21.7% [2]. However, over time, issues such as the degradation of planted forests, low productivity, and high maintenance costs have gradually come to the fore. Consequently, there is a pressing need to delve deeper into the intricate interactions between soils, microbial communities, and plants, specifically examining the flows of matter and energy within these systems. This analysis is essential for ensuring the efficacy and sustainability of plant-based ecological restoration processes, providing fundamental theoretical support for their improvement.
Soil constitutes the fundamental basis of ecosystems, and its significance in sustaining shrub productivity has been well documented in prior studies. Soil serves as a crucial source of essential nutrients, provided in optimal quantities and ratios, which support shrub growth and development [3,4]. This is exemplified by the robust positive relationship observed between soil nutrient levels and biomass accumulation across diverse plant species within forest systems [5]. Numerous investigations have highlighted the important intermediary role played by soil microorganisms in the process of nutrient supply to plants [6,7]. Specifically, soil microbial composition is instrumental in facilitating the biogeochemical cycling of carbon (C) and nitrogen (N), thereby exerting a profound influence on plant productivity and diversity [8]. Notably, previous studies have emphasized that soil N mineralization is significantly modulated by the fungi-to-bacteria ratio, as bacteria require a greater amount of N per unit biomass for assimilation compared to fungi [9]. Moreover, soil microorganisms contribute to enhanced plant growth through the production of phytohormones and their facilitation of nutrient uptake [10,11]. Further research illuminated the positive effect of phosphate-solubilizing microorganisms on plant productivity, achieved by augmenting phosphorus (P) nutrition [12]. However, it is worth noting that both soil nutrient availability and soil microbial composition and activity are easily affected by changes in the external environment, thereby altering the nutrient cycling between soils–microorganisms–plants, and ultimately influencing plant growth and community productivity.
The utilization of N fertilizers has traditionally been a prevalent method for improving plant productivity during ecological restoration endeavors [13]. Nevertheless, while nitrogen supplementation may stimulate plant growth, it also carries the risk of diminishing biodiversity, ultimately jeopardizing the long-term success of these restoration efforts. This underscores the imperative need for meticulous calibration in the quantity of N fertilizer applied, as it significantly impacts both the economic costs and ecological consequences of restoration projects. Moreover, the ongoing global warming adds another layer of intricacy to this equation. Projections indicate that by 2100, temperatures may soar by 2–4.5 °C above pre-industrial levels, with even more pronounced increases anticipated in warmer, high-altitude regions [14,15]. The interactions of warming and N fertilization often elicit nonlinear alterations in soil fertility, microbial community structure, and primary productivity [16,17]. Therefore, in the context of global warming, the interplay between nitrogen fertilization and temperature elevation holds crucial importance for the ecological restoration of the Loess Plateau region. Understanding and mitigating these complex interactions is crucial for achieving sustainable and resilient restoration outcomes.
Periploca sepium, Amorpha fruticosa, and Vitex negundo are three common shrubs in northern China, renowned for their robust adaptability and rapid growth, making them ideal candidates for ecological restoration projects [18,19]. However, the combined effects of warming and nitrogen fertilization on their biomass accumulation and the underlying mechanisms remain unclear, which holds significant implications for their utilization in ecological restoration within the Loess Plateau region. Consequently, we conducted a controlled experiment to investigate the joint influence of warming and N fertilization on the three species, as well as their plant and soil C:N:P stoichiometry, along with alterations in soil microbial composition and structure. Our objectives were the following: (1) to investigate the response of shrub growth and nutrient uptake to diverse N fertilization and warming treatments; (2) to examine soil fertility and microorganism responses to diverse N fertilization and warming treatments; and (3) to explore the mediating role of soil microorganisms. The significance of this research, despite being a pot experiment with results that may differ from those observed in field settings, lies in providing scientific insights and practical guidance for the ecological restoration of the Loess Plateau. The selection and management of appropriate plant species, coupled with strategic environmental manipulations, remain crucial for achieving sustainable and resilient ecosystem recovery in this region.

2. Materials and Methods

2.1. Shrub Species and Soil Samples

P. sepium, A. fruticosa, and V. negundo emerged as prime shrub species for ecological restoration endeavors in the loess hilly region of China, as evidenced by recent studies. In 2020, mature seeds of these shrubs were harvested from Huaziping Town, situated in Ansai County, Shaanxi Province, China (36°46′ N, 109°12′ E, 1140 m.a.s.l). The soil utilized in this investigation was meticulously collected from the immediate vicinity of the area where mature seeds of the shrubs were harvested. The study area is characterized by a distinct climatic regime, featuring humid summers and snowy winters. The annual mean temperature is 9.8 °C, with monthly averages ranging from a low of 4.1 °C in January to a high of 16.2 °C in July. The annual mean precipitation stands at 669 mm, with a notable concentration of 59% of this rainfall occurring between July and October.

2.2. Experimental Design, Shrub Growth, and Harvest

An orthogonal experimental design, incorporating two factors, was utilized to thoroughly investigate the combined effects of nitrogen (N) fertilization and temperature regulation on shrub productivity. To accurately mimic the nitrogen application levels encountered in field-based local ecological restoration projects, the experimental setup comprised three distinct levels of urea supplementation, N1 (low N addition, equivalent to 200 kg N ha−1), N2 (medium N addition, equivalent to 400 kg N ha−1), and N3 (high N addition, equivalent to 600 kg N ha−1), as specified in Table S1. Despite the local average summer temperature being 16 °C, without taking into account the extreme low temperatures during summer, and considering the fact that the maximum temperature in northern China can reach 43 °C [20], we implemented temperature control across three distinct intervals: (T1: 18–23 °C, T2: 25–30 °C, and T3: 32–37 °C). The greenhouse environment was meticulously maintained, ensuring precise temperature control with diurnal cycles of 14 h during the day and 10 h at night. This setup yielded a total of nine treatment combinations, each replicated five times for robust statistical analysis. A total of 135 pots, each with a diameter of 26.5 cm, were allocated to the three selected shrub species. Each pot was filled to a depth of 17.5 cm with 2500 g of loose loamy soil, optimized for fostering robust shrub root development, as corroborated by previous studies [21]. This ensured a standardized and conducive growing medium for the experimental shrubs.
After a 15-day incubation period, seedlings of uniform size from the three shrub species were meticulously selected and subsequently planted in distinct plots, with each plot comprising a standardized array of 135 pots. After 60 days of unrestricted natural growth in the field, all experimental treatments were subjected to a uniformly applied nitrogen (N) level. The nitrogen fertilizer, in the form of urea, was mixed into the soil in a single application. After 30 days of fertilization, the seedlings were transferred to greenhouses, where they were exposed to a controlled temperature protocol for 90 days. Throughout their growth period, the shrubs received regular irrigation with 300 mL of water every three days, with each watering session carefully regulated to not exceed the maximum water capacity of the pot. To eliminate any potential seedling competition, pots allocated to experimental treatments were spatially separated by a distance of 20 cm. Furthermore, to mitigate positional biases, the pots underwent random rotation every three days. After a comprehensive six-month growth period, the shrubs were harvested for the purpose of segregating roots, stems, and leaves. We measured the shrub height before harvesting. In the laboratory, the harvested plant samples underwent a rigorous cleaning process, involving three washes with diluted hydrochloric acid followed by distilled water, and were subsequently dried to constant weights at 65 °C. Concurrent with the shrub harvest, soil samples were collected, thoroughly mixed, and processed to remove stones and plant debris before being divided into two equal portions. One portion underwent physicochemical analysis subsequent to air-drying, grinding, and sieving through a 100-mesh (0.15 mm) nylon sieve. The remaining soil samples were preserved at −80 °C for potential future microbial analysis.

2.3. C, N, and P Analysis

The dried samples were then thoroughly mixed and pulverized into fine plant powders for analysis. The soil samples were subjected to air-drying, grinding, and sieving through a 100-mesh (0.15 mm) nylon sieve to ensure homogeneity. The total carbon (TC) and total nitrogen (TN) contents in the plant organs (roots, stems, and leaves) were precisely measured using a PE2400II elemental analyzer (PerkinElmer, Waltham, MA, USA). To determine the total phosphorus (TP) content in the plant samples, the samples were first ashed in a chamber furnace at 450 °C and then dissolved in a 1:2 (v/v) nitric acid solution. The resulting solution was analyzed using inductively coupled plasma optical emission spectrometry (ICP-OES, Perkin Elmer Optima 7300 DV, PerkinElmer, Waltham, MA, USA) [22]. Regarding soil analysis, the total soil organic carbon (TOC) content was determined using the potassium dichromate oxidation method. The soil inorganic carbon (IC) content was calculated as the difference between the total carbon (TC) and TOC measurements. Similarly to the plant analyses, all soil measurements were also performed in quintuplicate to maintain consistency and accuracy. All analyses were conducted with five replicates to ensure statistical reliability.

2.4. Soil Microbial Analysis

2.4.1. Soil DNA Extraction, Amplification, and Sequencing

Following the manufacturer’s instructions, microbial DNA was extracted from soil samples (0.5 g) in triplicate using an E.Z.N.A.® Soil DNA Kit (Omega Bio-tek, Norcross, GA, USA). An ABI GeneAmp 9700 polymerase chain reaction (PCR) thermocycler (ABI, Los Angeles, CA, USA) [23] was used to amplify the V4–V5 region of bacterial 16S rRNA genes with the primer pairs 515F (5′-GTGCCAGCMGCCGCGG-3′) and 907R (5′-CCGTCAATTCMTTTRAGTTT-3′). Briefly, PCRs were performed in a 20 μL reaction with mixtures of 5 × TransStart FastPfu buffer (4 μL), 2.5 mM dNTPs (2 μL), 5 μM primer (0.8 μL), TransStart FastPfu DNA polymerase (0.4 μL), template DNA (10 ng), and double-distilled water (10 μL). The PCR thermal cycling program consisted of initial denaturation (95 °C, 3 min), followed by 27 cycles at 95 °C (30 s), 55 °C (30 s), and 72 °C (45 s), and then a final extension at 72 °C (10 min) and end at 4 °C. The PCR products were isolated from agarose gel (2%), purified using an AxyPrep DNA Gel Extraction Kit (Axygen Biosciences, Union City, CA, USA), and then quantified using a Quantus™ Fluorometer (Promega, Madison, WI, USA).
ITS1F (5′-CTTGGTCATTTAGAGGAAGTAA-3′) and ITS2 (5′-GCTGCGTTCATCGATGC-3′) primers were used to amplify the fungal ITS1 region [24]. PCR was performed using bacterial 16S rRNA gene amplification. Equal amounts of purified amplicons were subjected to paired-end sequencing (2 × 300 bp) using standard protocols (Majorbio Bio-Pharm Technology Co. Ltd., Shanghai, China) on the Illumina MiSeq platform (Illumina, San Diego, CA, USA). The microbial DNA sequences of the soil samples were deposited in the SRA of the NCBI database under Accession Nos. NCBI: PRJNA1151869 and SRA: SUB14684204.

2.4.2. Bioinformatic Analyses

Illumina sequencing data were analyzed using Flash with the option “max-overlap 200”, and the unassembled sequences were removed. FASTQ files were generated and implemented in QIIME 1.9.1 [25]. The bacterial sequences were searched against the Ribosomal Database Project Classifier to identify and discard chimeric sequences [26]. Operational taxonomic units (OTUs) with 97% similarity cutoff were clustered using UPARSE (version 7.1) and the taxonomy of each OTU representative sequence was analyzed against the 16S rRNA database (Silva ribosomal RNA database, www.arb-silva.de/) using a confidence threshold of 0.7. Fungal ITS sequences were assigned to taxa using a naïve Bayesian classifier [27]. OTUs with a 97% similarity cutoff were clustered following previous studies [25,28]. The OTUs of bacterial and fungal datasets with low abundances were filtered and discarded following the OTU table [29,30]. The alpha diversity of the bacterial and fungal communities was calculated using the method described by Schloss [26].

2.5. Data Analysis

This study employed a one-way analysis of variance (ANOVA), subsequently complemented by Tukey’s post hoc test (at a significance level of p < 0.05), to rigorously examine the impact of various treatments on plant traits, soil properties, and the composition of soil microbial communities. Prior to statistical analysis, all data underwent rigorous testing for variance homogeneity and normality of distribution, with log transformation analysis applied as deemed necessary to ensure valid statistical inference.
For the investigation of microbial community structure, principal coordinate analysis (PCoA) was conducted based on Bray–Curtis distances derived from the relative abundances of phyla detected in each sample. This analysis was facilitated using the “vegan” package (version 2.4.3) within the R statistical environment. All figures were meticulously crafted using Sigma Plot software (Systat Software Inc., version 12.5, Chicago, IL, USA), enhancing the clarity and interpretability of the results.
To visually explore potential correlations among plant traits, soil properties, and microbial community compositions, the Mantel test was applied. This analysis provided a comprehensive understanding of the intricate interrelationships within the studied ecosystem. All statistical analyses were meticulously performed using R version 4.1.3 [31], ensuring the highest standards of scientific rigor and reproducibility.

3. Results

3.1. Response of Plant Growth to the Various Treatments

The primary indicators for measuring shrub growth in our experiments were biomass accumulation and average plant height. Figure 1, Figure 2 and Figure 3 showed the variations in the dry organ weight of A. fruticosa, P. sepium, and V. negundo across distinct nitrogen (N) and temperature (T) treatments. For A. fruticosa (Figure 1; Table S2), at a constant temperature, statistically significant enhancements in the dry weights of roots, stems, and leaves were observed with N addition. Notably, this augmentation was most pronounced under T1 conditions, with the N3T1 treatment exhibiting the most substantial effect (p < 0.05). The cumulative dry weight of A. fruticosa under N3T1 treatment peaked at 17.9 g per pot. Furthermore, the average plant height of A. fruticosa exhibited a biphasic response, rising concurrently with both N addition and temperature, culminating in a maximum height of 71.5 cm in the N3T3 treatment.
In contrast, for P. sepium (Figure 2; Table S2), the individual dry weights of individual roots, stems, and leaves did not significantly vary with N addition at a constant temperature (p > 0.05). The total weight decreased with warming at low N addition, while it increased with N addition at T3. Additionally, the average height of P. sepium responded insignificantly to both increased N and temperature.
Regarding V. negundo (Figure 3; Table S2), the dry weights of roots, stems, and leaves did not significantly increase with N addition at a specific temperature (p > 0.05). The optimal conditions for maximum weight varied among organs, with N2T2 yielding the heaviest stems and leaves, whereas N2T1 favored roots. Notably, the total weight of V. negundo did not significantly augment with either N addition or temperature treatments, yet it peaked at 18.4 g per pot in N2T2 treatment. Likewise, the average plant height of V. negundo significantly increased with both N addition and temperature treatments, attaining a maximum height of 43.4 cm per plant under the N2T2 treatment.

3.2. Response of Plant Nutrient Uptake to the Various Carbon (C), Nitrogen (N), and Phosphorus (P) Treatments within Plants and Soils

Table 1 comprehensively outlines the concentrations of total carbon (TC), total nitrogen (TN), and total phosphorus (TP) across various organs of three shrub species. For A. fruticosa, at a constant temperature, the TC content in its organs displayed minimal significant variation with varying N levels (p > 0.05), except in its roots at T2, where a notable trend emerged, N2T2 (48.5%) > N3T2 (46.9%) > N1T2 (45.0%), indicating the substantial influence of N under this specific temperature regime. Similarly, TN content in A. fruticosa organs held steady across different N additions at a fixed temperature (p > 0.05), with a notable exception observed in roots at T3, where TN adhered to the sequence, N2T3 (27.1 g kg−1) > N3T3 (23.3 g kg−1) > N1T3 (14.3 g kg−1), demonstrating a significant N effect at the elevated temperature. In the context of TP, the roots of A. fruticosa exhibited no significant changes in TP either with varying N levels or temperatures (p > 0.05). Conversely, in stems and leaves, TP was markedly influenced by the experimental treatments. Specifically, stem TP reached its maximum under N1T2 conditions, whereas leaf TP peaked under N3T3, emphasizing the distinct responsiveness of these organs to the combined stressors of N and temperature.
For P. sepium, TC within its organs at a constant temperature remained largely unaffected by varying N levels (p > 0.05). Nevertheless, notable maxima were observed under specific treatment combinations: roots displayed a peak TC under N1T1 and N3T1 (47%), stems achieved their maximum TC under N3T1 and N3T2 (44%), while leaves reached their highest TC under N1T1, N3T1, and N3T2 (45%). The TN in P. sepium organs at a given temperature were generally unaffected by N levels (p > 0.05), with one notable exception. In stems, a significant trend emerged as the following: N1T1 (10.7 g kg−1) > N3T1 (10.4 g kg−1) > N2T1 (5.2 g kg−1). Similarly, under constant temperature conditions, the TP in P. sepium organs did not significantly vary with N levels (p > 0.05). However, distinct patterns were discernible among certain organ types. Stems exhibited the highest TP under N2T3 (3.5 g kg−1), closely followed by N1T3 (3.3 g kg−1), and the lowest under N3T3 (1.9 g kg−1). In leaves, a comparable trend towards lower TP under higher N treatments was observed, with N1T2 (3.3 g kg−1) and N2T2 (3.3 g kg−1) having similar values, both greater than N3T2 (1.7 g kg−1).
In the case of V. negundo, the TC in roots and stems exhibited a response to various treatment combinations, whereas the TC in leaves was markedly affected, achieving its maximum under N2T2 treatment and its minimum under N3T2 treatment. In contrast to the TC, the TN in all organs of V. negundo was significantly influenced by the diverse treatment regimens (p < 0.05). Interestingly, the combined applications of nitrogen and temperature treatments had no discernible effect on TP concentrations in V. negundo roots, yet they significantly modulated TP levels in stems and leaves. Specifically, the leaf TP attained its maximum value of 3.3 g kg−1 under both N1T2 and N2T3 treatments, while its minimum was recorded at 0.5 g kg−1 under N3T1 treatments. Similarly, the stem TP peaked at 2.2 g kg−1 under N1T3 treatments and declined to its lowest level of 0.4 g kg−1 under N3T1 treatments, emphasizing the sensitivity of TP accumulation to these specific treatment conditions.

3.3. Response of Soil Fertility to the Various Treatments

Table 2 presents the contents of total carbon (TC), inorganic carbon (IC), total organic carbon (TOC), total nitrogen (TN), and total phosphorus (TP) in the soil, associated with the three distinct plant species. Notably, soil TC did not exhibit significant variations among the soils of the three plants. Similarly, the soil IC and TOC remained largely unaffected by the treatment regimens. The combined applications of nitrogen and temperature treatments significantly influenced the soil TN in both P. sepium and V. negundo, yet it had no discernible effect on A. fruticosa. Notably, the soil TN of A. fruticosa was considerably higher than that observed in the soils of the other two plant species. In contrast, the soil TP of all three shrub species was significantly modulated by the combined N–temperature treatments. Specifically, the highest soil TP was recorded in the N3T1 treatment of P. sepium (12.3 g kg−1), whereas the lowest was observed in the N1T2 treatment of V. negundo (2.5 g kg−1), underscoring the sensitivity of soil phosphorus dynamics to these treatment conditions.

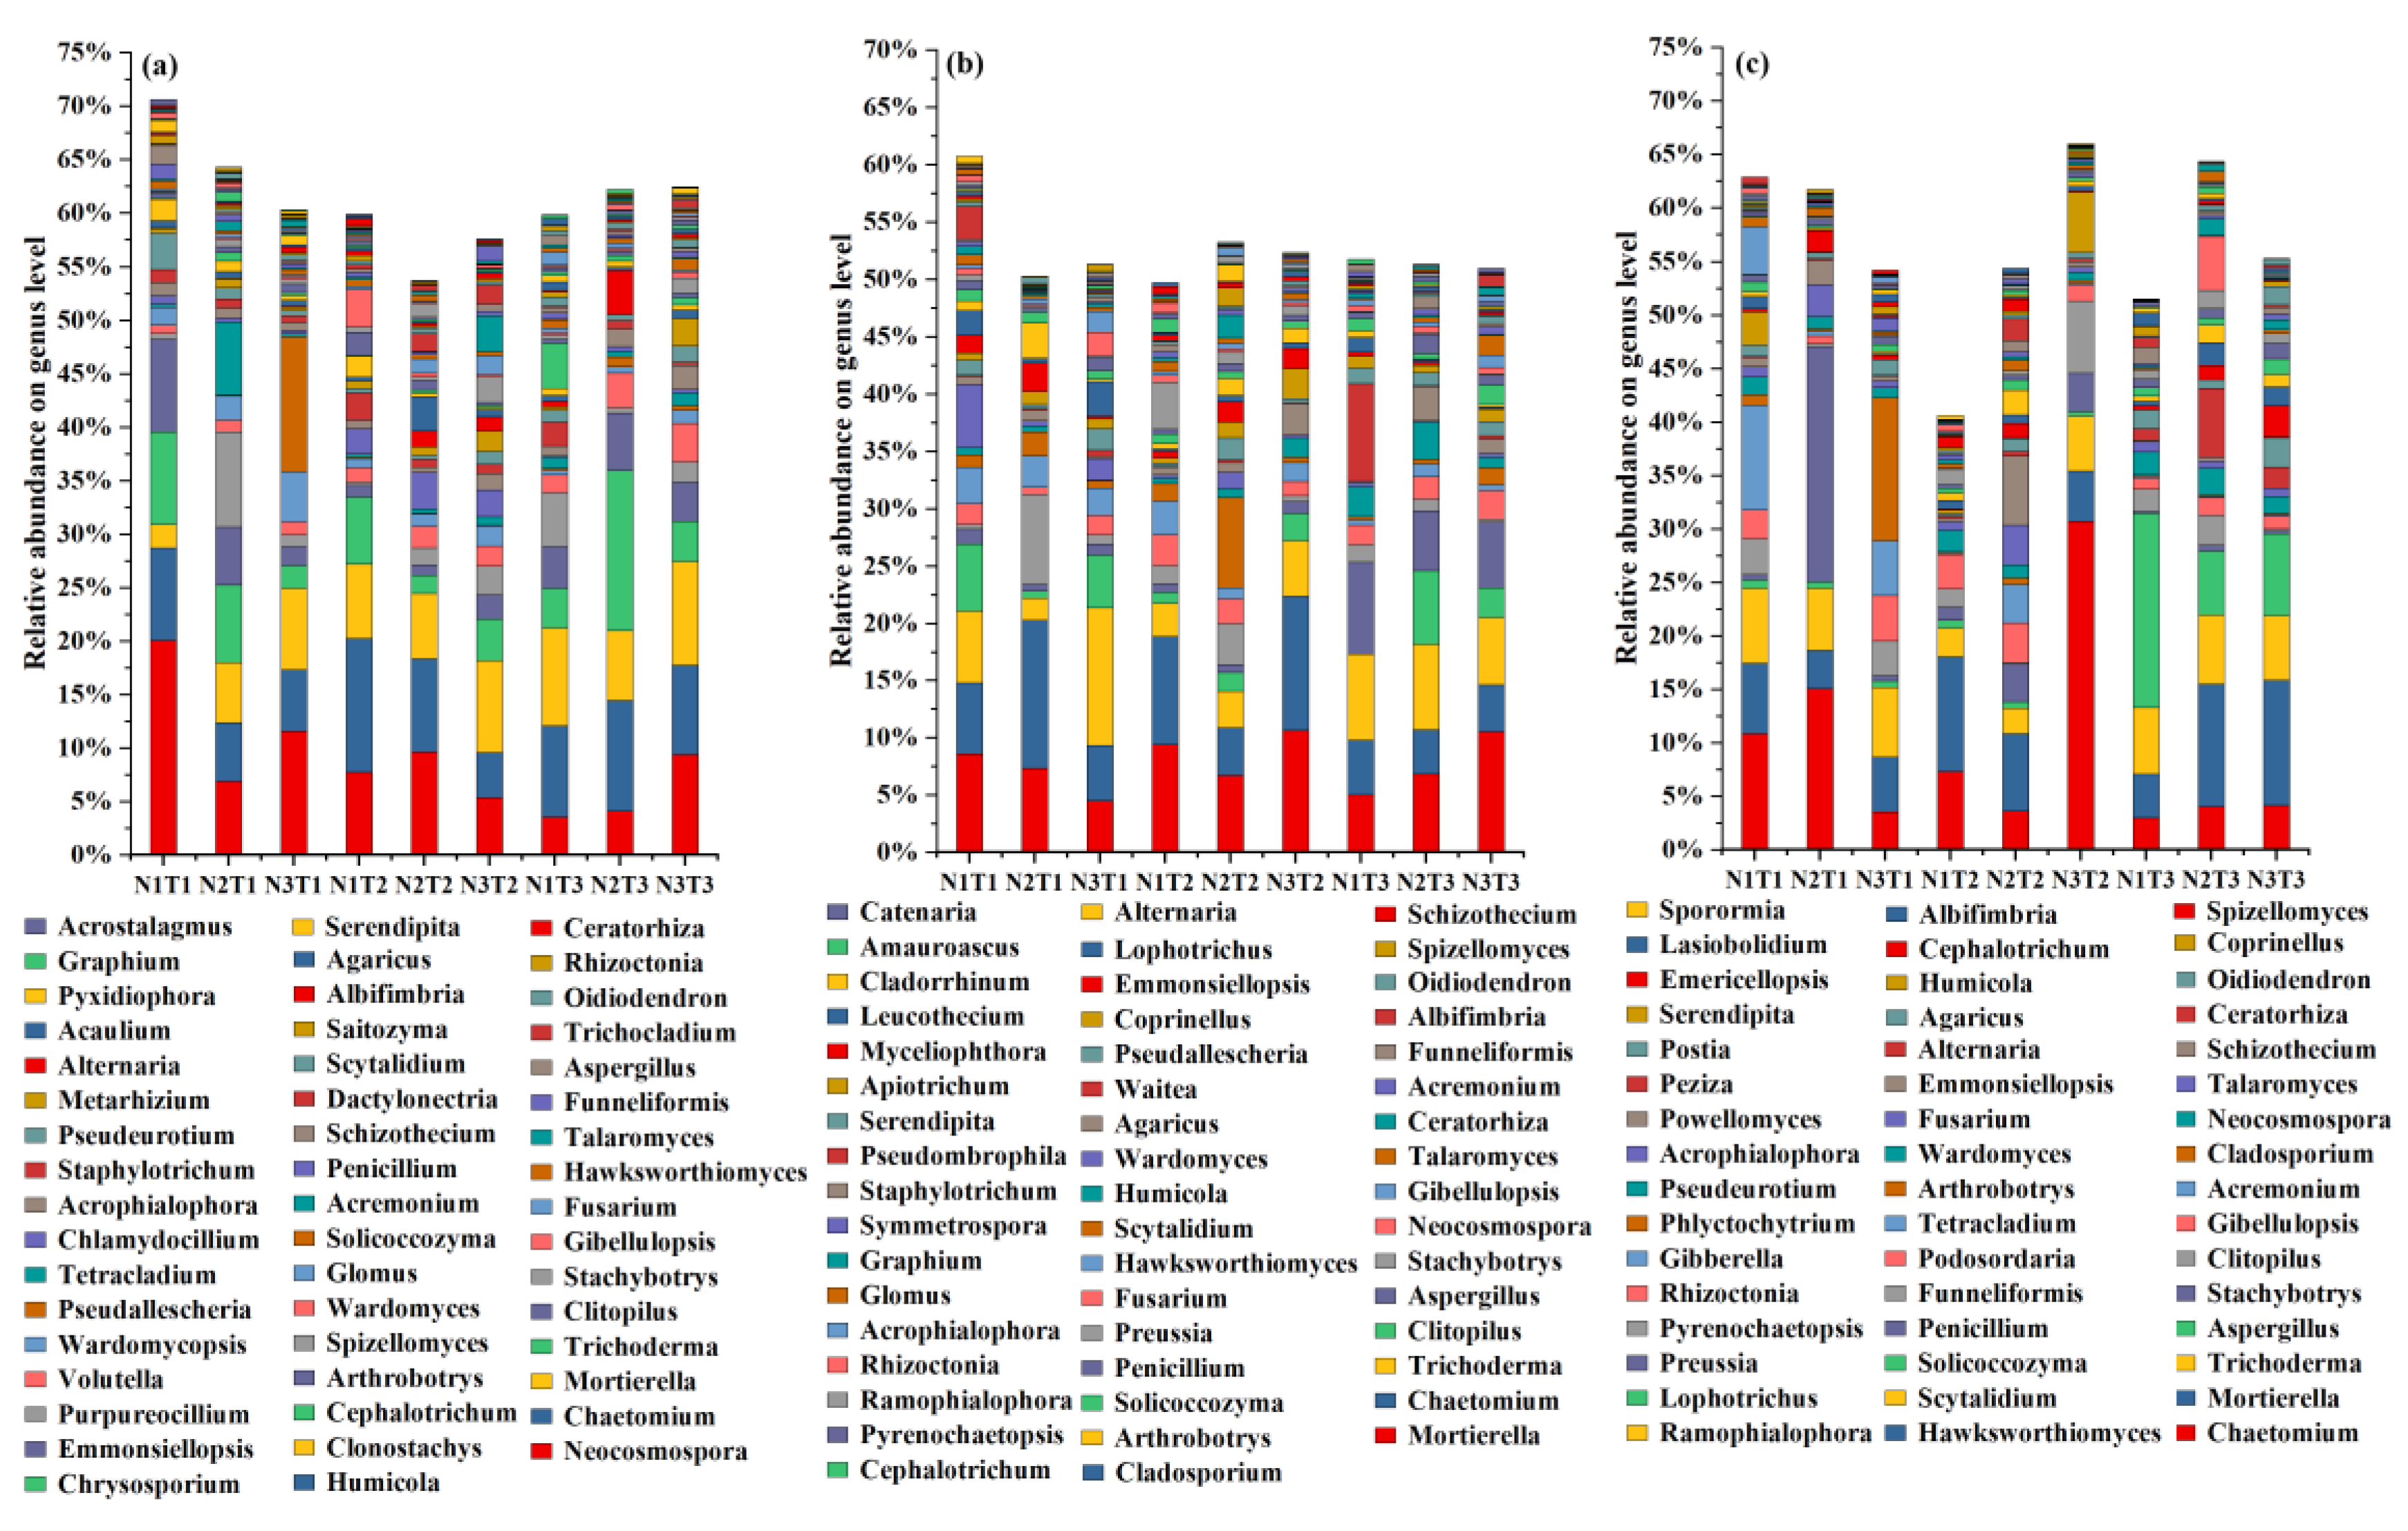
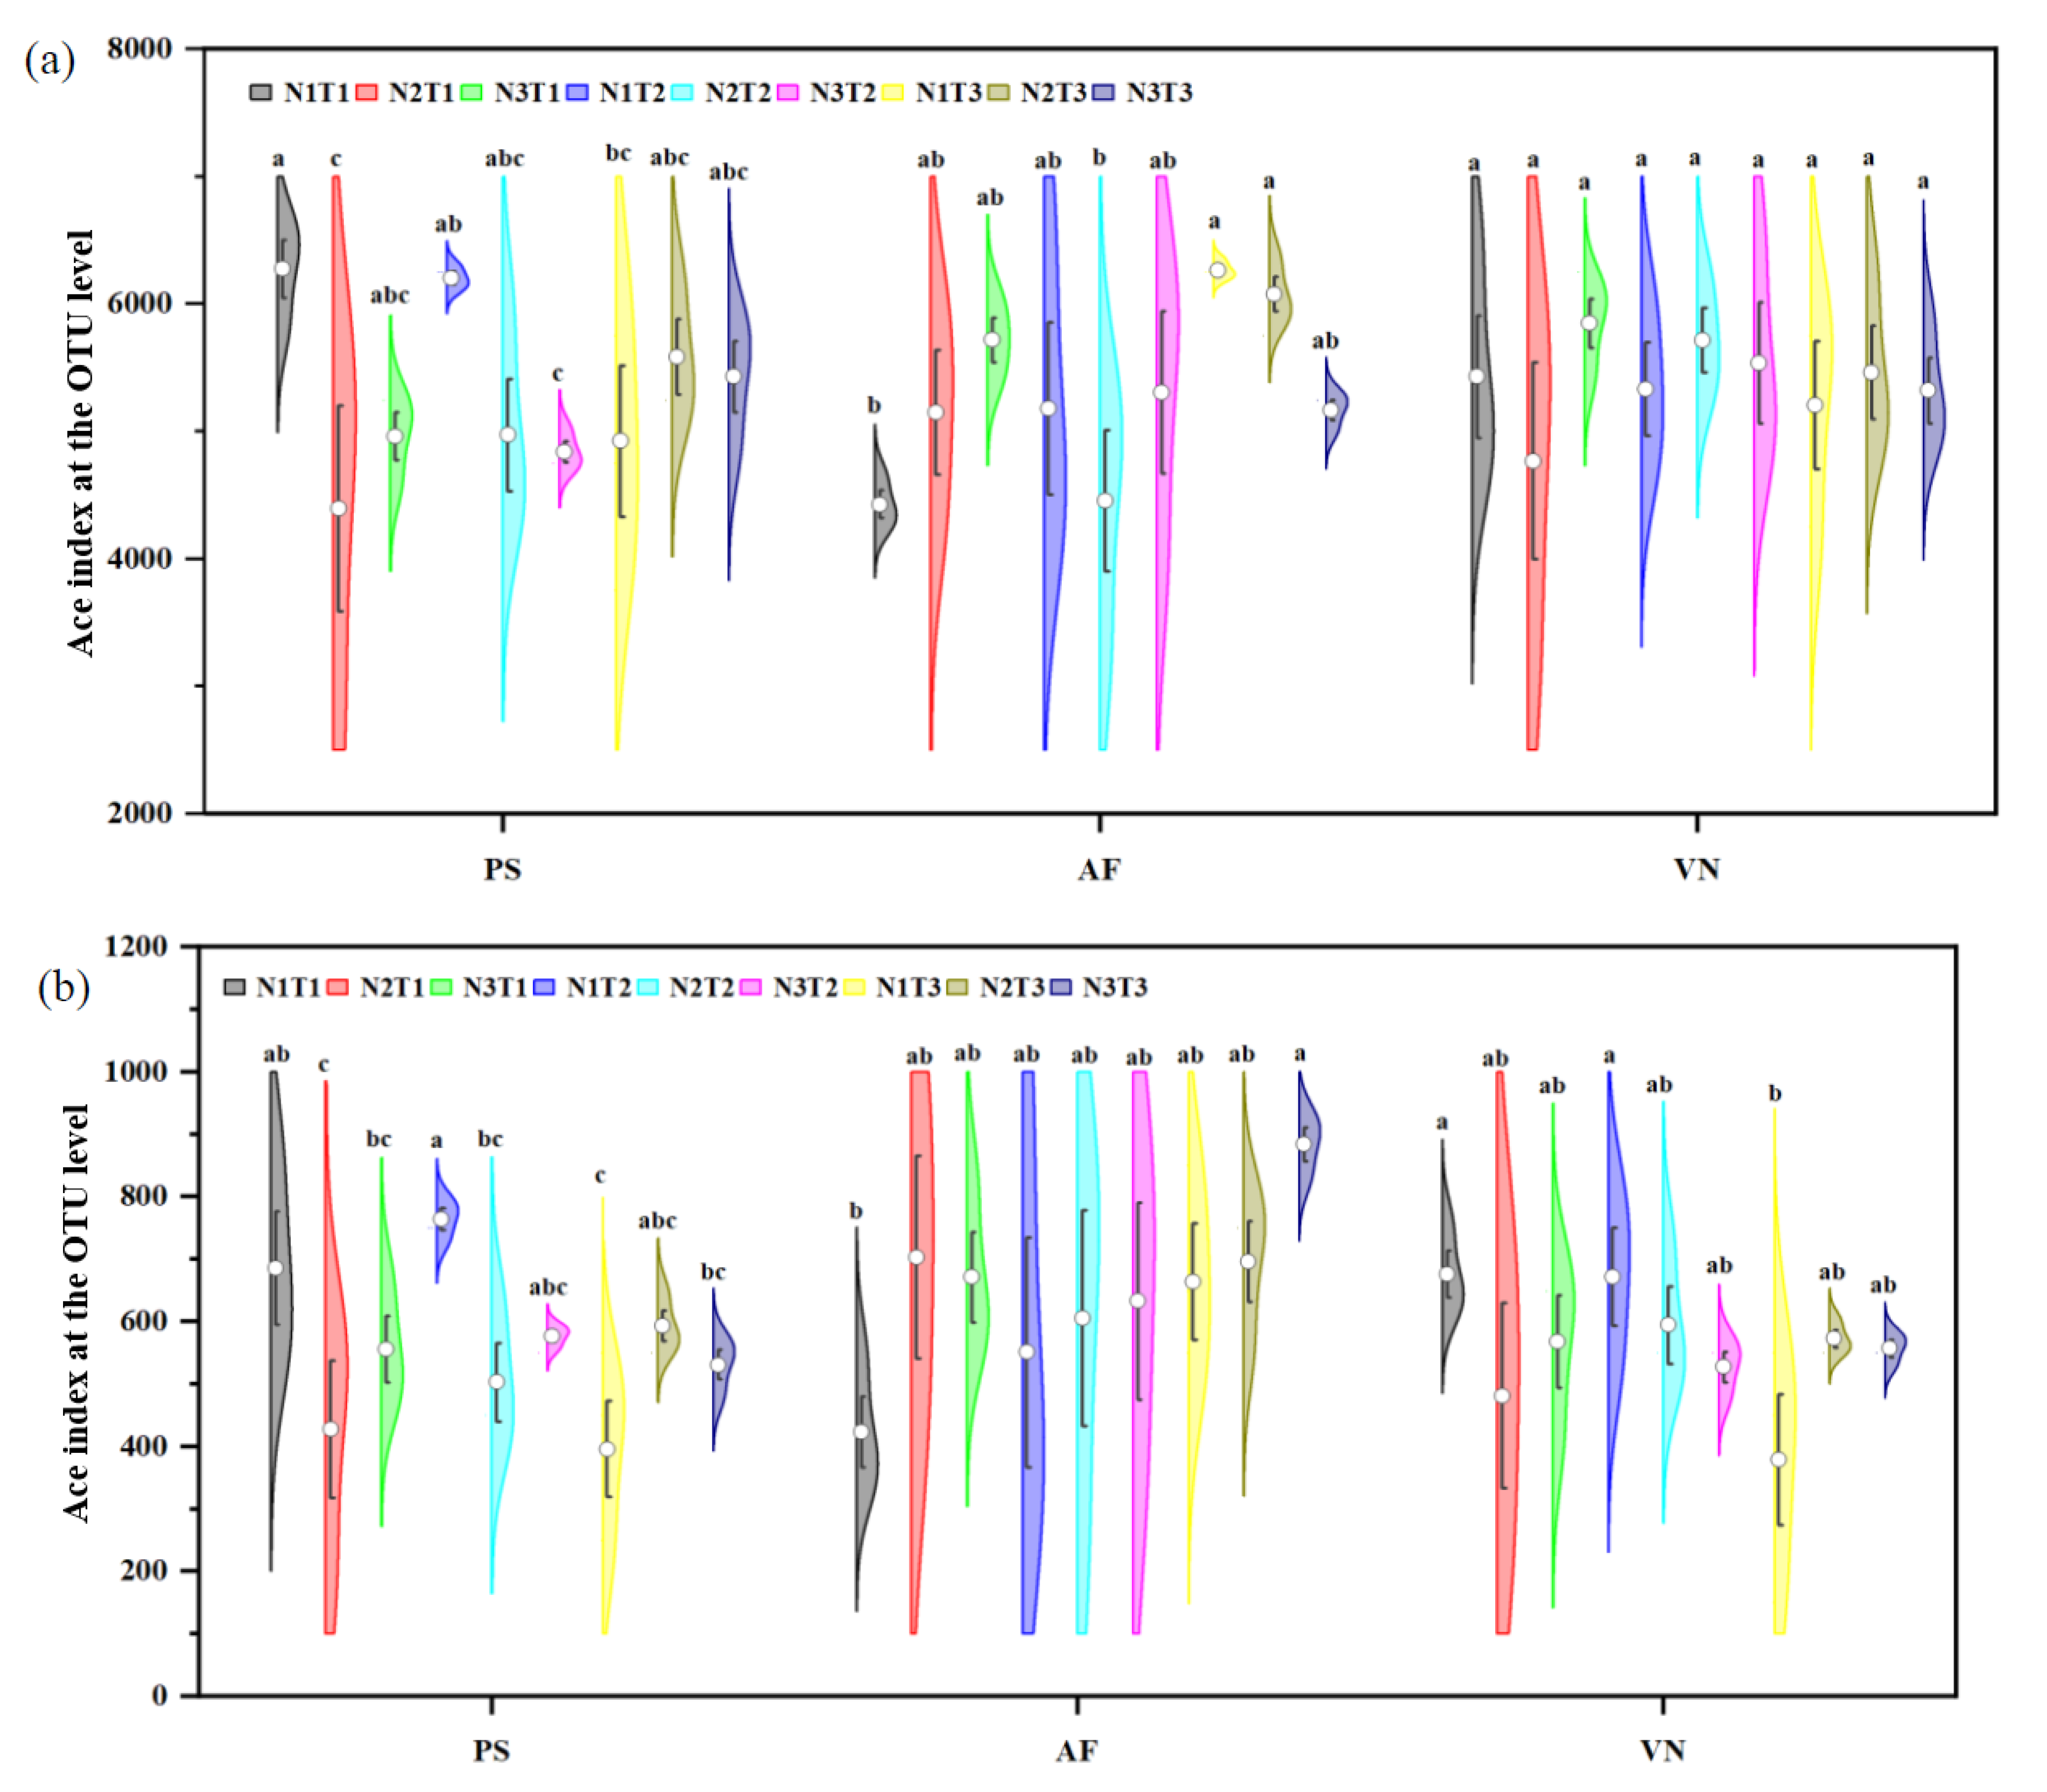
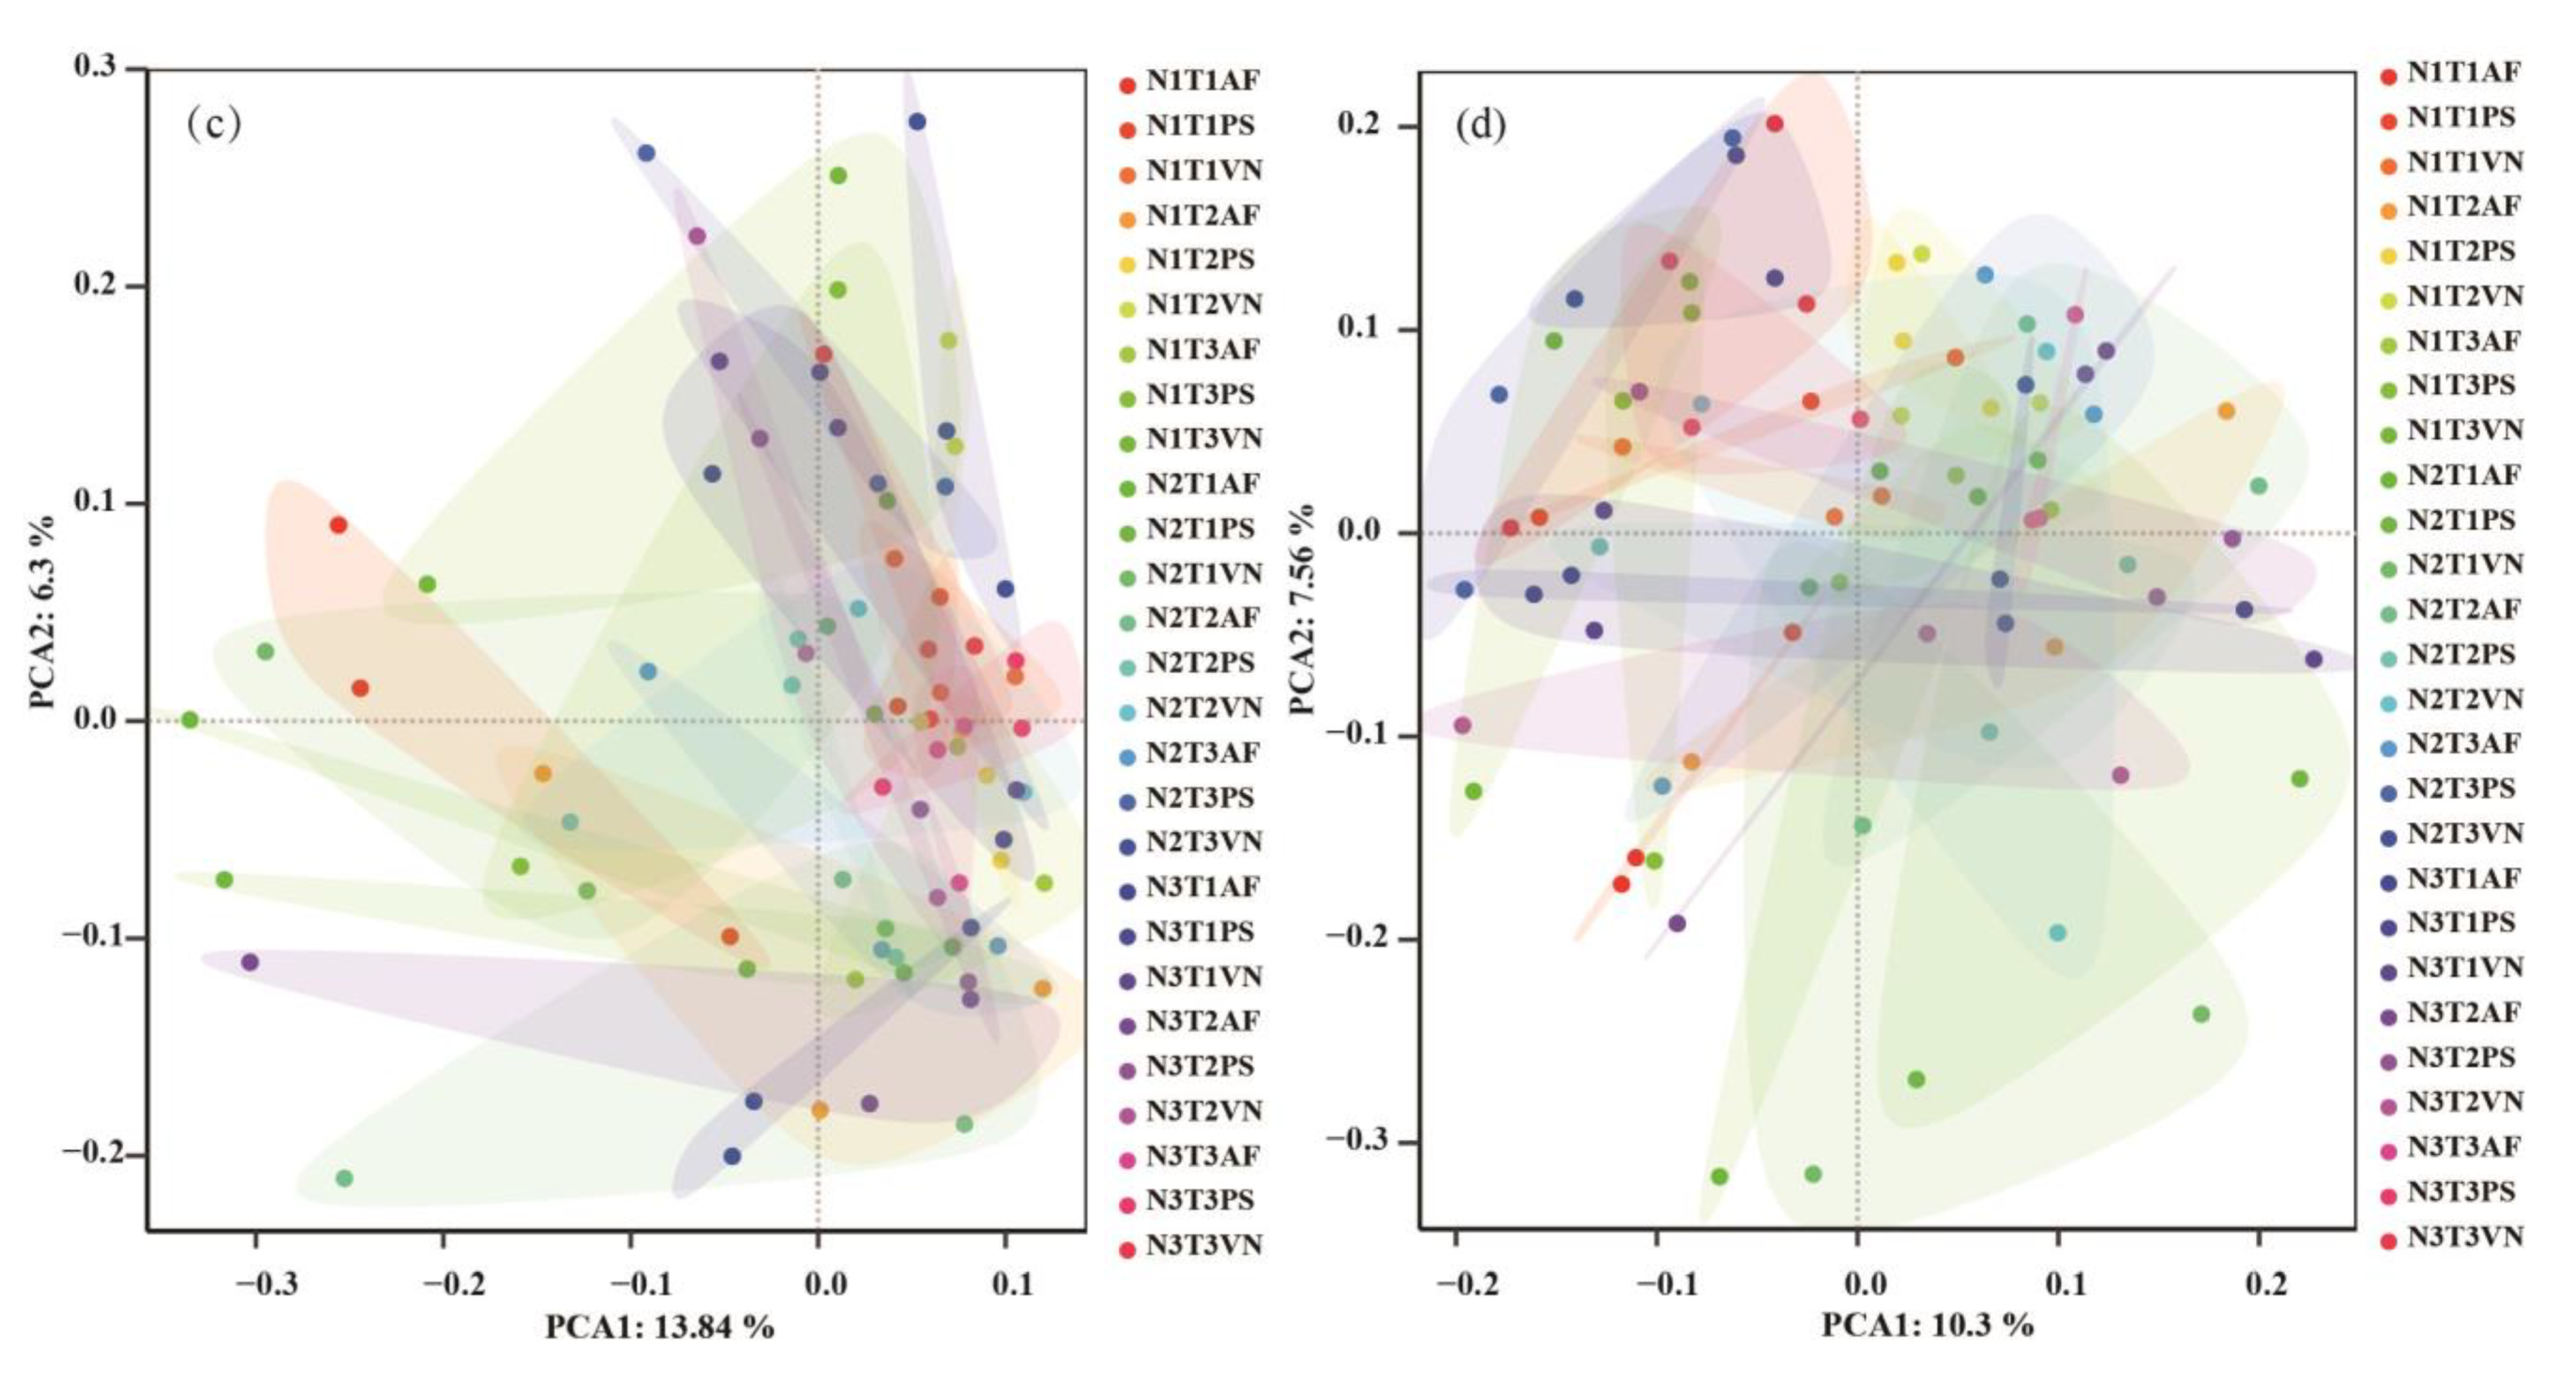
3.4. Response of Soil Microbial Community to the Various Treatments

Our analysis revealed Proteobacteria, Actinobacteria, Acidobacteria, and Chloroflexi as the predominant bacterial phyla, accounting for 20.04–33.10%, 14.35–24.24%, 7.89–19.93%, and 10.72–22.70% of the total bacterial community, respectively (Figure S1). The most abundant bacterial genera were Gaiella, Sphingomonas, Bacillus, and RB4, representing 1.88–3.21%, 1.23–2.79%, 1.37–2.45%, and 1.04–2.69% of the total bacterial community, respectively (Figure 4). At the phylum level, the fungal communities in soil predominantly comprised Ascomycota, Basidiomycota, and Mortierellomycota, accounting for 36.12–72.97%, 4.37–38.19%, and 2.21–11.80%, respectively (Figure S2). Further analysis at the genus level revealed Neocosmospora, Chaetomium, Mortierella, and Trichoderma as the most abundant fungal genera, accounting for 3.07–15.07%, 2.20–11.72%, 1.75–15.00%, and 1.22–2.65% of the total fungal community, respectively (Figure 5). Notably, all combined N–temperature treatments significantly influenced the composition and abundance of the soil bacterial and fungal phyla and genera, with these variations being contingent upon the specific shrub species.
In this study, comprehensive bacterial and fungal alpha diversity analyses were conducted to discern differences in microbial communities across various treatments within each shrub species. The alpha diversity assessment, utilizing multiple indices such as the Ace index (Figure 6), and the Shannon, Simpson, and Chao 1 indices (Figures S3 and S4), uncovered statistically significant variations among treatments for all shrub species, with the exception of fungal alpha diversity in V. negundo. Subsequently, we delved into the question of whether the overall bacterial and fungal phenotypes within treatments were consistent across all shrub species. Employing principal coordinate analysis (PCoA) based on Bray–Curtis dissimilarity, we identified significant disparities in both bacterial and fungal community structures among all treatments (Figure 6). Specifically, for bacterial communities, significant differences were discerned among treatments of A. fruticosa for Myxococcota and Nitrospirota; similarly, treatments of V. negundo exhibited significant variations in Firmicutes, Myxococcota, and Patescibacteria, whereas Bacteroidota showed significant differences among treatments of P. sepium. With respect to fungal communities, treatments of A. fruticosa demonstrated significant differences for Glomeromycota, while Mortierellomycota displayed significant variations among treatments of V. negundo. This underscored the intricate species-specific responses to treatment conditions.

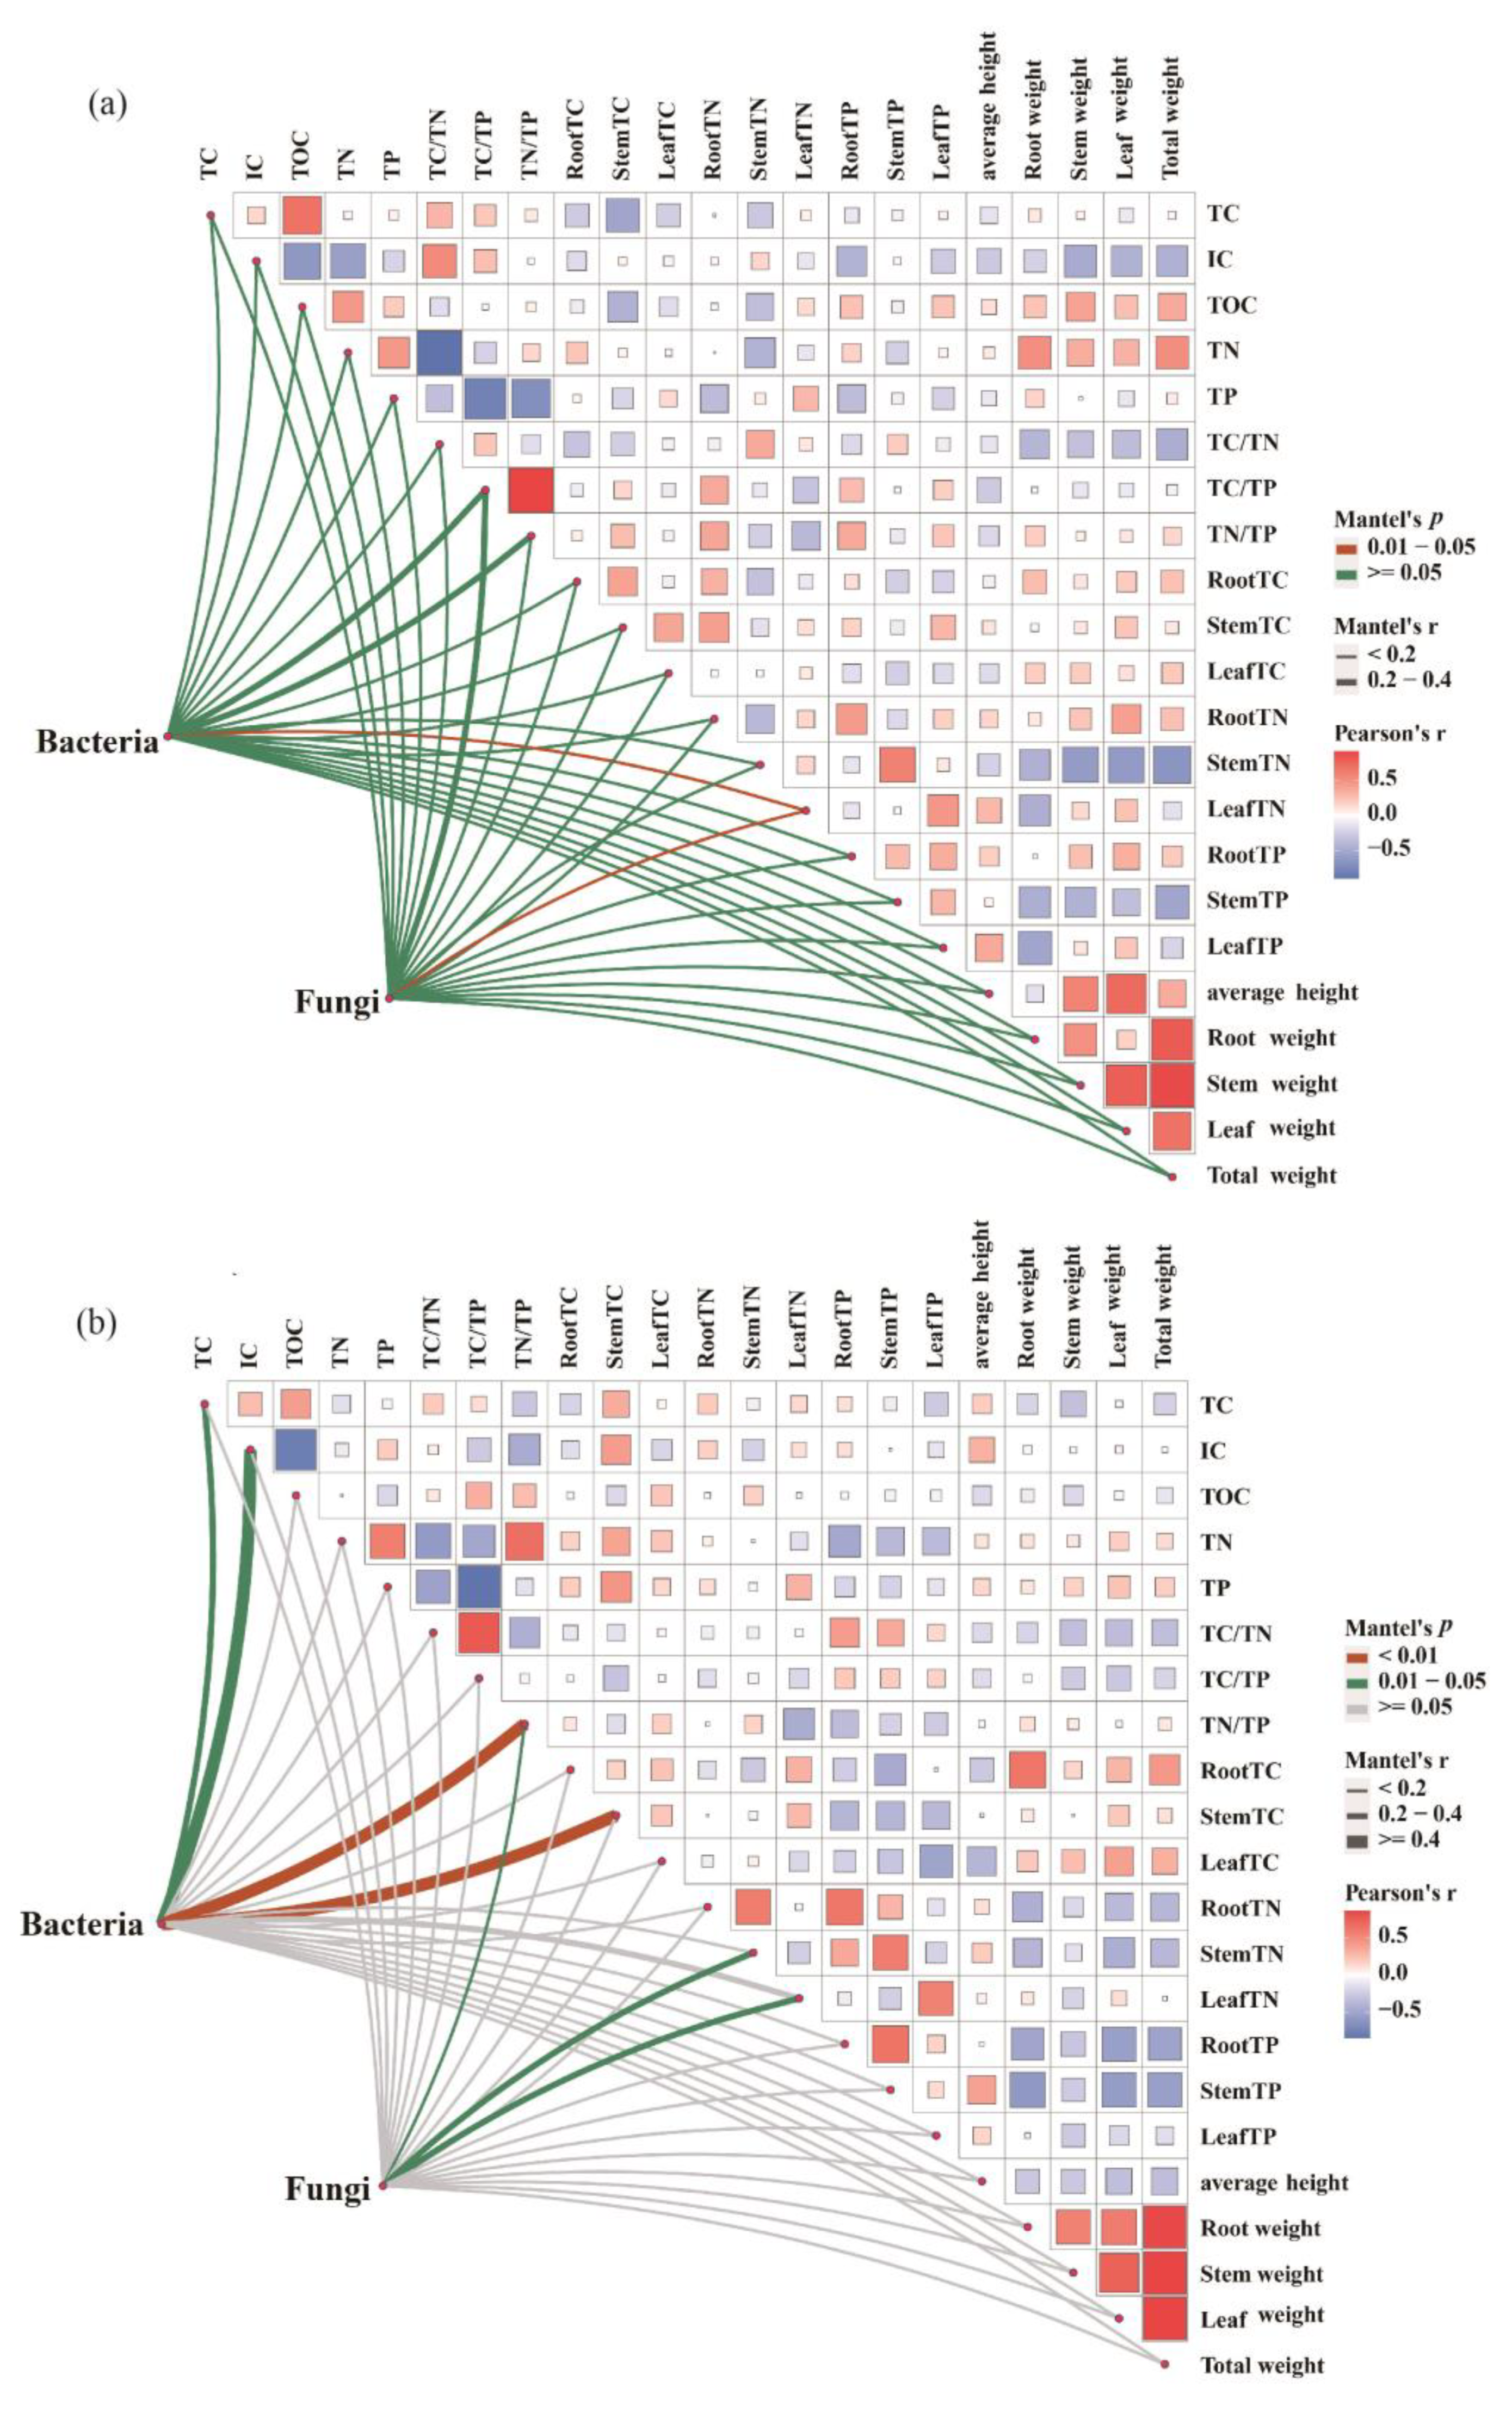
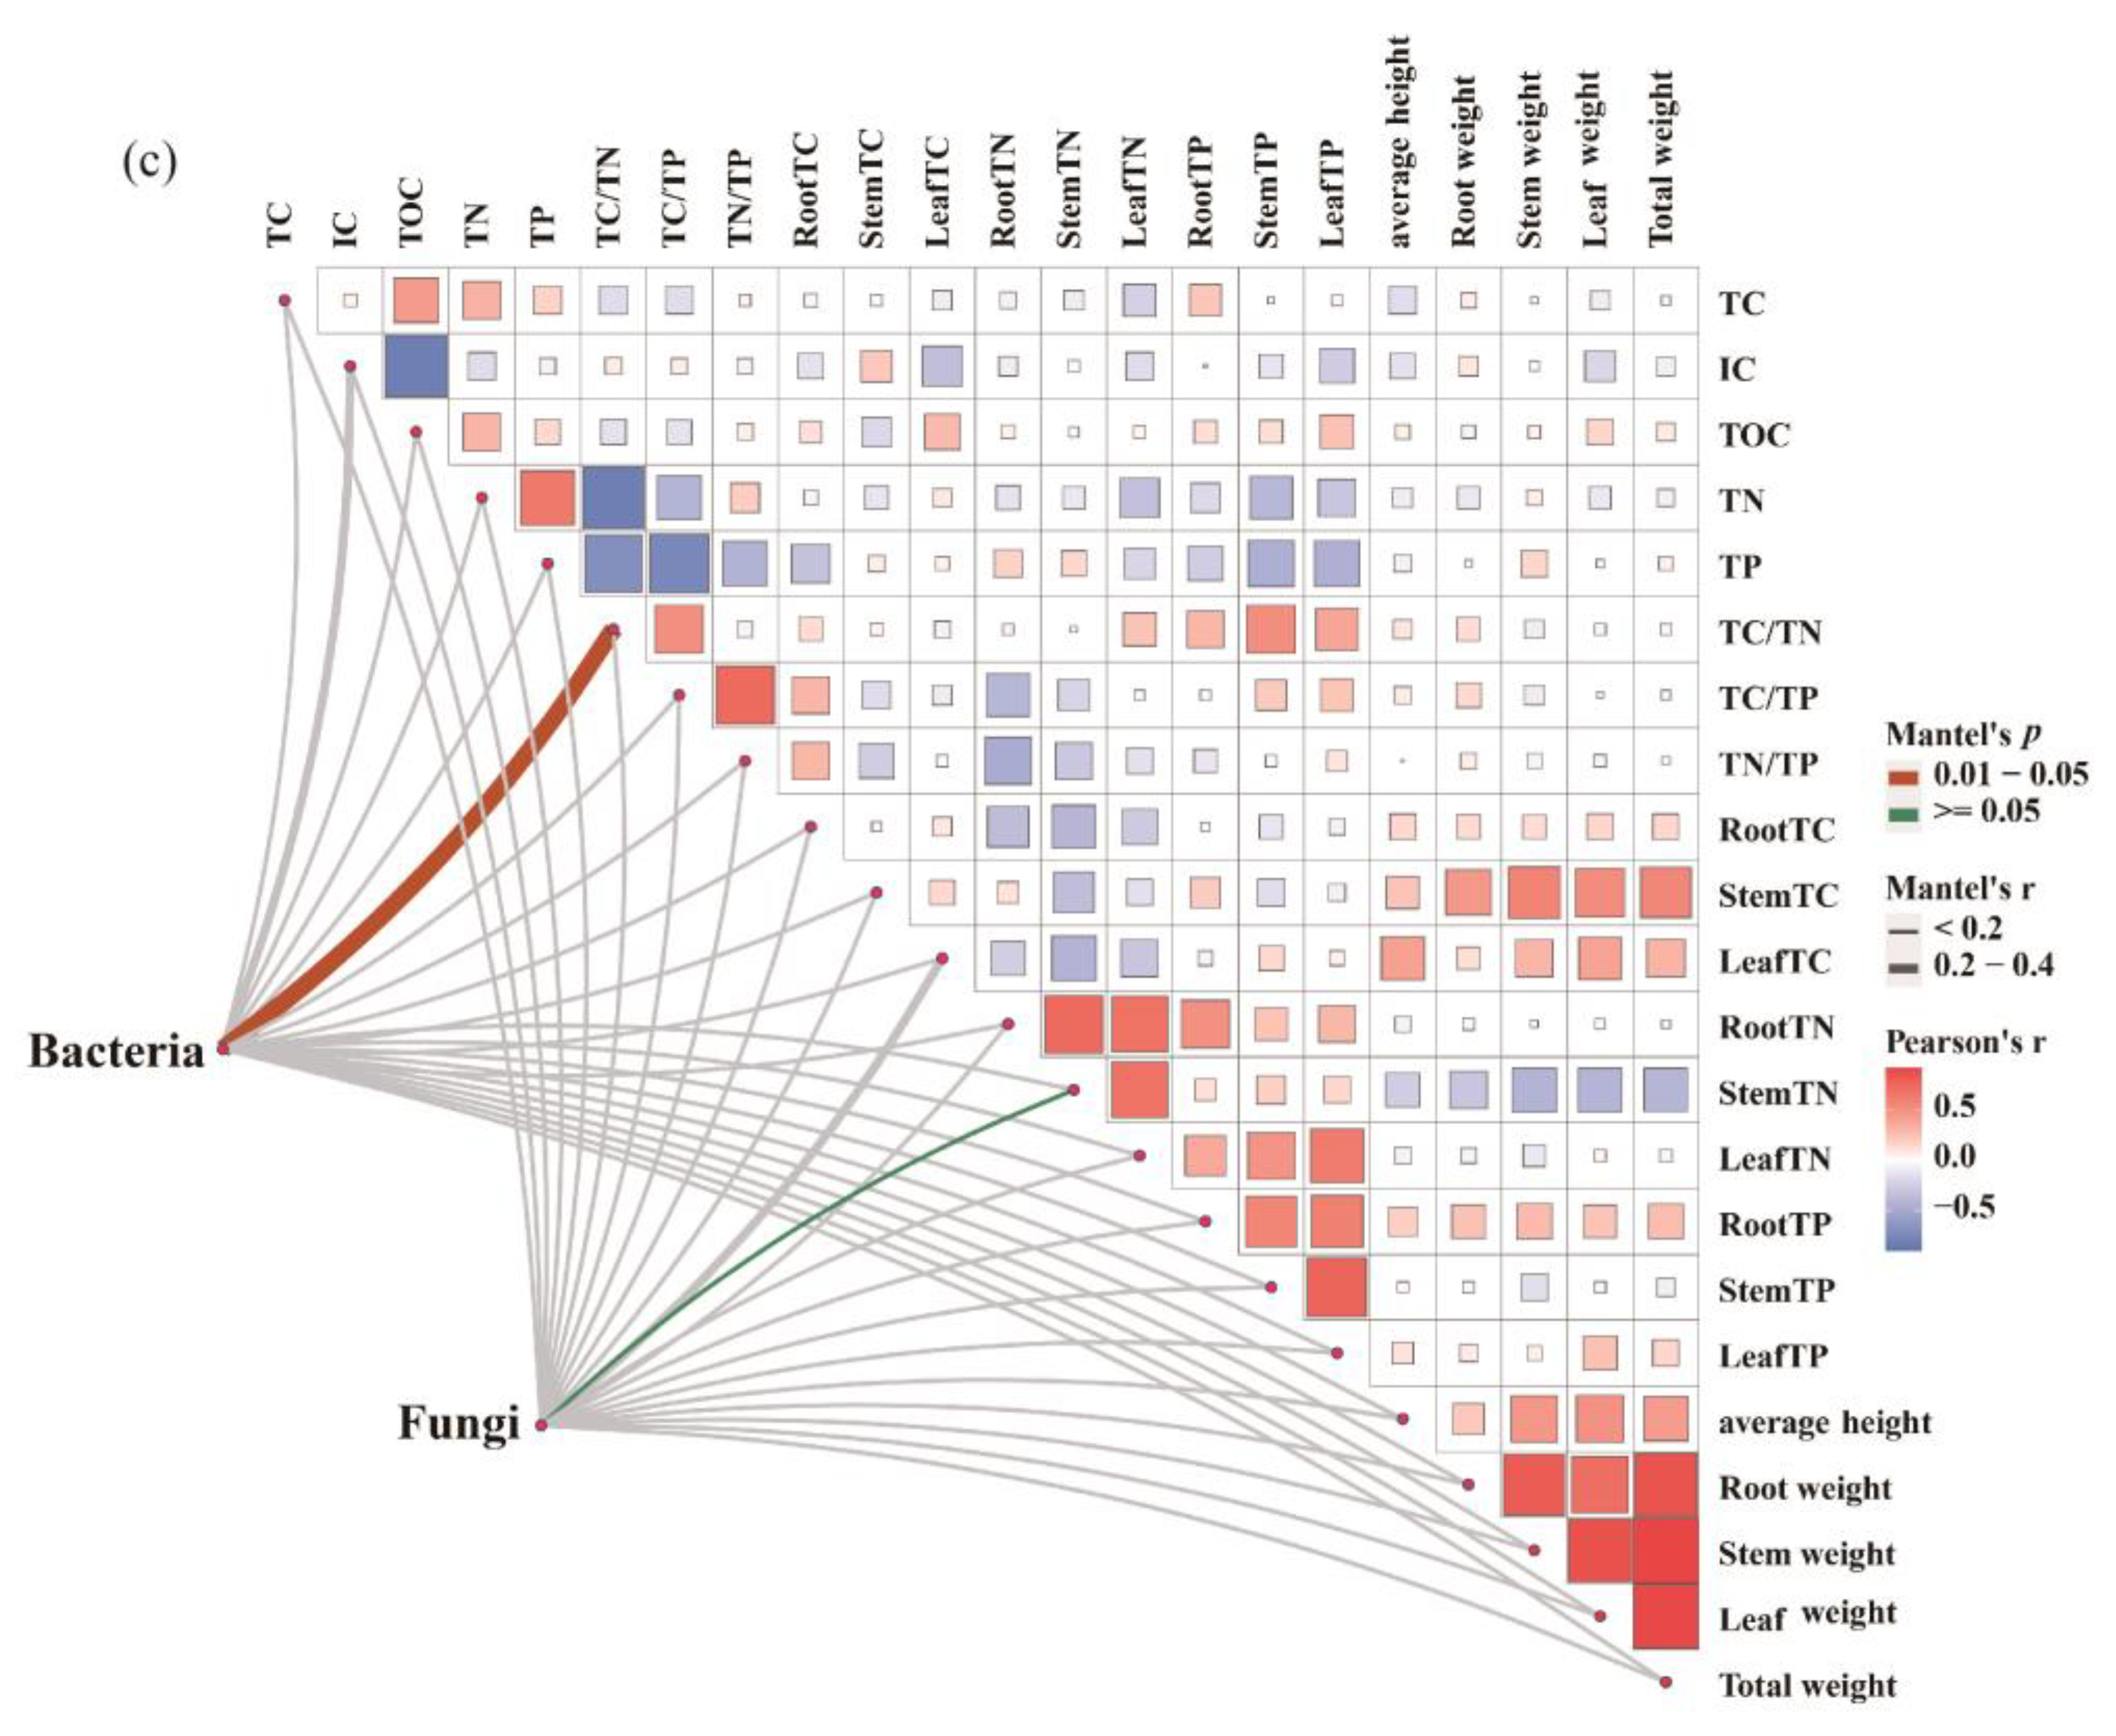
3.5. Relationship between Soil Microbial Community and C–N–P Stoichiometry of Plant and Soil

The applied treatments had a significant impact on the microbial communities associated with each plant species. For A. fruticosa, the TN of the leaf was positively associated with the bacterial and fungal community structures (p < 0.05, Figure 7a). For P. sepium, the bacterial community structure was significantly correlated with the soil TC, IC, and TN:TP, as well as the stem TC (all p < 0.05); the fungal community structure was significantly correlated with the soil TN:TP, stem TN, and leaf TN (all p < 0.05, Figure 7b). For V. negundo, the bacterial community structure was significantly correlated with the soil TC:TN (p < 0.05, Figure 7c).

4. Discussion

4.1. Response of Shrub Growth and Nutrient Uptake to Diverse Nitrogen and Temperature Treatments

Our experimental findings underscored the profound influence of combined N and temperature manipulations on the growth and productivity of diverse shrub species. This observation aligned well with previous studies conducted in crops [32], trees [33,34,35], and grasses [36], albeit with notable dependencies on specific N levels, temperature regimes, and shrub species. As depicted in Figure 1, Figure 2 and Figure 3, distinct patterns emerged. Across the three experimental temperature ranges, the growth of A. fruticosa, as measured by biomass accumulation and average plant height, exhibited a positive response to nitrogen addition, with this growth acceleration gradually attenuating as temperatures increased. Conversely, in medium- and low-temperature environments, the growth of P. sepium declined with increased nitrogen application. Notably, irrespective of temperature conditions, N addition consistently suppressed the growth of V. negundo. These findings indicated that the effects of nitrogen application on shrub species differed substantially in the context of rising temperatures, potentially linked to the differential responsiveness of their photosynthetic capacity to the external environment [37]. This underscored the complex and nuanced interactions between nutrient availability, temperature, and plant growth, with profound implications for ecosystem restoration.
Leaf carbon (C) accumulation typically serves as an indicator of a plant’s photosynthetic capacity, thereby modulating plant growth and biomass accumulation [38]. Prior research has elucidated a substantial correlation between plant C metabolism and biomass production under elevated temperature and varied nitrogen (N) supply conditions [39,40]. Our current experimental findings, as presented in Table 1 and Figure 1, Figure 2 and Figure 3, corroborated these earlier observations. Specifically, the leaves of all shrub species exhibited a pronounced sensitivity to C accumulation, with notable patterns emerging. Under the conditions of the highest N supply coupled with low temperature, the lowest N supply with low temperature, and medium N supply and temperature, the leaves accumulated the greatest amounts of C, which were positively associated with their respective biomasses.
However, the influence of N and temperature treatments on shrub biomass was intricately tied to growth conditions, notably soil nutrient availability and microbial community composition [41,42]. These factors exhibited a complex, intersecting pattern of effects on shrub growth, suggesting that their impacts cannot be decoupled but must be considered in concert. Hence, variations in shrub biomass under altered N and temperature regimes requires an ecological analysis that acknowledges the crucial roles of soil nutrients and microbial dynamics.

4.2. Soil Fertility and Microorganism Responses to Varied N and Temperature Treatments

Elevated temperatures and enhanced N supply stimulate soil fertility by modulating the mobility of essential nutrients (C, N, and P) within a soil–plant system. This process was intimately intertwined with soil microbial activities, including the decomposition of organic matter and the mineralization of N and P [41,43,44,45]. Our study revealed that alterations in soil microbial diversity and community composition (encompassing both bacterial and fungal communities) in response to various treatment regimens led to changes in soil nutrient availability, particularly N and P (Table 2). Notably, these effects were contingent upon the shrub species involved, as soil microorganisms influence the release of N and P nutrients from soil minerals, a process that is governed by the diverse root activities associated with individual shrub species [46,47].
Our experimental findings indicated that the N treatment significantly altered the soil microbial community of A. fruticosa, particularly under conditions of high N supply coupled with low-temperature control. These changes were most pronounced at the phylum level, with variations observed in the abundance of soil Actinobacteria (bacteria) and Basidiomycota (fungi). Concomitant with these microbial shifts, we also detected changes in soil C, N, and P concentrations. As depicted in Figure 7a, a significant correlation emerged between fungal and bacterial abundances and soil C/P and N/P ratios, respectively. This observation implies that the N treatment-induced fluctuations in soil microbial diversity and community composition exert a profound influence on the mobility of soil nutrients (C, N, and P). This phenomenon could be attributed to the fact that the preponderant Actinobacteria function as key saprophytic decomposers, capable of dismantling diverse plant and root litter during the decomposition process, thereby modulating the release of nutrients into the soil ecosystem (Table 2). Prior research has emphasized that the rate of soil nutrient (C, N, and P) release represented a pivotal factor regulating bacterial communities in soils. In this context, our findings suggest that the N treatment altered the soil microbial community, which later affected the C and P cycle by influencing nutrient release rates and microbial decomposition activities. These bacterial communities exhibited heightened sensitivity to variations in soil C/P and N/P ratios, further highlighting the intricate interplay between soil microbial communities and nutrient cycling [9,48].
In contrast to the observations made for A. fruticosa, the growth of P. sepium exhibited a notable correlation solely between bacterial abundance and low soil C levels along with a decreased N/P ratio (Figure 7b; Table 2). Notably, Acidobacteriota dominated the microbial community under the lowest N supply and low-temperature treatment conditions, demonstrating a pronounced responsiveness to fluctuations in soil N and C concentrations (Table 2). Acidobacteriota are renowned for their extensive diversity and physiological activity in situ, accounting for an average of 20% of all soil bacteria, with their abundance being significantly higher in forest soil compared to agricultural soil [49]. Paradoxically, their abundance is inversely correlated with soil C availability [50], suggesting that Acidobacteriota possess the adaptability to thrive in environments with limited substrate resources. Intriguingly, the prevalence of Acidobacteriota within microbial communities is tightly governed by soil pH [51], a phenomenon that may be intertwined with the role of inorganic C as a pH buffer [52]. Moreover, Acidobacteriota exhibit remarkable resilience in adapting to nutrient constraints (C, N, and P) in soil environments [53]. Consequently, our findings implied that conditions characterized by low N availability and temperature favoured the proliferation of Acidobacteriota, potentially enhancing the availability of limited soil nutrients (N and P) during the growth phase of P. sepium.
Intriguingly, during the growth of V. negundo, bacteria exhibited a pronounced correlation with soil C/N ratios, whereas Chloroflexi demonstrated the highest abundance under moderate N supply and temperature conditions, displaying a keen responsiveness to fluctuations in soil N and C sources (Table 2). Notably, Chloroflexi were highly susceptible to temperature changes, with elevated temperatures fostering the structural and functional development of phototrophic Chloroflexi, thereby augmenting the mobility of soil C and N resources [54,55]. Prior investigations underscored the ecological significance of Chloroflexi members in modulating the degradation of certain organic matter, leading to the increased liberation of C and N sources and consequently enhancing soil fertility [56].

4.3. The Mediating Role of Soil Microorganisms

Notably, numerous studies have concurred that the structural configuration of bacterial and fungal communities exert a favourable influence on nutrient uptake, particularly in response to environmental and climatic stressors, by facilitating the redirection of soil nutrient mobility into their respective biological cycles [57,58,59]. Specifically, certain plant growth-promoting bacteria and arbuscular mycorrhizal fungi exemplify mechanistic capabilities that interface with nutrient acquisition (N and P) even under conditions of limited supplementation, poor soil fertility, and fluctuating temperatures [60,61].
Consistent with this, our study uncovered a significant correlation between nutrient uptake and the composition of bacterial and fungal communities across diverse N and temperature treatments (Table 2; Figure 1, Figure 5, and Figure 6), as vividly depicted in Figure 7. However, this effect was contingent upon the shrub species under investigation. These findings underscored the existence of specific and productive plant–microbe interactions which contributed to enhanced shrub nutrient uptake and the perpetuation of biological cycles across varying N and temperature gradients. This phenomenon was likely attributable to the intricate interplay between organic N in various plants and soil microbes, coupled with temperature, which led to soil acidification and the mobilization of N nutrients, as evidenced by previous research [62,63,64,65,66]. The findings from these studies underscored significant disparities in soil bacterial community compositions in response to environmental fluctuations and variations in plant species. These observations have offered profound insights into the distributional patterns and underlying drivers of microbial communities within soils, which were shaped by the unique environmental niche created by plant growth. Consequently, our comprehension of microbial ecology within plant–soil ecosystems is significantly enhanced. Root-associated bacteria play a pivotal role in mineral weathering and nutrient provisioning for shrubs, facilitating plant nutrition by transporting nutrients liberated from weathered soil minerals across distances to the roots and into small pores [67,68]. This underscores the intricate interplay between microbes, soil, and plants in maintaining the ecological balance and fertility of terrestrial ecosystems.

5. Conclusions

The experimental outcomes clearly demonstrated the intricate interplay between nitrogen (N) supply, temperature, shrub species, and their associated microbial communities. These factors significantly impacted the growth and productivity of shrub species, underscoring the need for tailored management strategies. For specific shrub species, such as A. fruticosa, N fertilization initially stimulated growth; however, as temperature rose, its growth rate gradually decelerated. In contrast, V. negundo responded favorably to moderate amounts of nitrogen, particularly when coupled with moderate warming. Conversely, P. sepium did not benefit from nitrogen fertilization, highlighting the species-specific responses to N and temperature variations. These findings not only revealed the direct effects of N and temperature on shrub growth but also illuminated their indirect influence through soil fertility and microbial activity. Increased N supply under high-temperature conditions facilitated soil fertility by modulating nutrient mobility (C, N, P) within the soil–shrub system. This, in turn, fostered interactions with soil microorganisms, where the abundance of certain microbial taxa positively correlated with soil nutrient availability and shrub nutrient uptake. For example, Actinobacteria and Basidiomycota flourished in the rhizosphere of A. fruticosa, while Acidobacteriota and Chloroflexi were associated with P. sepium and V. negundo, respectively. Our study underscores the pivotal role of microbial communities in mediating shrub growth and development under environmental and climatic stresses.
The potential for combined nitrogen and warming treatments to enhance shrub productivity and foster the restoration of forest ecological services, including carbon sequestration, underscores the potential of tailored management strategies in degraded forest ecosystems. However, the complexities of these ecological interactions remain largely unexplored, necessitating further field-based research to unravel the mechanisms underpinning the productive partnerships between plants and microbes under diverse environmental stressors. Such endeavors will not only enrich our understanding of these ecological processes but also inform the development of more precise and sustainable forest management and restoration strategies.

Supplementary Materials

The following supporting information can be downloaded at: https://www.mdpi.com/article/10.3390/agronomy14092167/s1. Table S1. Experimental factors and level with nitrogen addition combined with temperature regulation. Table S2. Average height (cm plant−1) of each of three shrubs, and their organ dry weight (roots, stem, and leaf; g pot−1). Figure S1. Bacterial abundance under combined nitrogen-temperature treatments at the phylum level (A: A. fruticosa; B: P. sepium; and C: V. negundo). Figure S2. Fungal abundance of combined nitrogen-temperature treatments at the genus level (A: A. fruticosa; B: P. sepium; and C: V. negundo). Figure S3. The α diversity of Shannon (a), Coverage (b), and Simpson (c) index of bacteria in the combined nitrogen-temperature treatments (A. fruticosa, AF; P. sepium, PS; and V. negundo, VN). Figure S4. The α diversity of Shannon (a), Coverage (b), and Simpson (c) index of fungi in the combined nitrogen-temperature treatments (A. fruticosa, AF; P. sepium, PS; and V. negundo, VN).

Author Contributions

Conceptualization, Z.M., M.Y. and Y.L.; data curation, Z.M., Y.W. (Yuchao Wang), and G.J.; investigation, S.C., Y.W. (Ying Wei). and H.S.; methodology, Z.M., M.Y., Y.W. (Ying Wei). and Y.L.; writing—original draft, Z.M. and Y.L.; writing—review and editing, M.Y., Y.L., and M.Y. All authors have read and agreed to the published version of the manuscript.

Funding

This work was supported by the “Natural Science Foundation of Science and Technology Department of Shaanxi Province (S2024-JC-YB-2574, 2020ZDLSF06-01)”, “National Natural Science Foundation of China (32201588)”, “Xi’an Science Technology Bureau Fund (23NYGG0050, 22NYYF029)”, and “Project of the First Investigation of Wild Plants Resources in Xi’an (KRDL K6-2207039)”.

Data Availability Statement

Data are contained within the article.

Acknowledgments

We fully appreciate the editors and all anonymous reviewers for their constructive comments on this manuscript.

Conflicts of Interest

The authors declare no conflicts of interest. The funders had no role in the design of the study; in the collection, analyses, or interpretation of data; in the writing of the manuscript; or in the decision to publish the results.

References

  1. Bai, X.; Wang, B.; An, S.; Zeng, Q.; Zhang, H. Response of forest species to C:N:P in the plant-litter-soil system and stoichiometric homeostasis of plant tissues during afforestation on the Loess Plateau, China. Catena 2019, 183, 104186. [Google Scholar] [CrossRef]
  2. Fu, B.J.; Wang, S.; Liu, Y.; Liu, J.B.; Liang, W.; Miao, C.Y. Hydrogeomorphic ecosystem responses to natural and anthropogenic changes in the Loess Plateau of China. Ann. Rev. Earth Planet. Sci. 2017, 45, 223–243. [Google Scholar] [CrossRef]
  3. Kiryushin, V.I. The management of soil fertility and productivity of agrocenoses in adaptive-landscape farming systems. Eurasian Soil Sci. 2019, 52, 1137–1145. [Google Scholar] [CrossRef]
  4. Schjoerring, J.K.; Cakmak, I.; White, P.J. Plant nutrition and soil fertility: Synergies for acquiring global green growth and sustainable development. Plant Soil 2019, 434, 1–6. [Google Scholar] [CrossRef]
  5. Pang, X.P.; Guo, Z.G. Plateau pika disturbances alter plant productivity and soil nutrients in alpine meadows of the Qinghai-Tibetan Plateau, China. Rangel. J. 2017, 39, 133–144. [Google Scholar] [CrossRef]
  6. Liu, S.; Zheng, T.; Li, Y.; Zheng, X. A critical review of the central role of microbial regulation in the nitrogen biogeochemical process: New insights for controlling groundwater nitrogen contamination. J. Environ. Manag. 2023, 328, 116959. [Google Scholar] [CrossRef]
  7. Philippot, L.; Chenu, C.; Kappler, A.; Rillig, M.C.; Fierer, N. The interplay between microbial communities and soil properties. Nat. Rev. Microbiol. 2024, 22, 226–239. [Google Scholar] [CrossRef]
  8. Rumpel, C.; Crème, A.; Ngo, P.T.; Velásquez, G.; Mora, M.L.; Chabbi, A. The impact of grassland management on biogeochemical cycles involving carbon, nitrogen and phosphorus. J. Soil Sci. Plant Nut. 2015, 15, 353–371. [Google Scholar] [CrossRef]
  9. Zhang, X.; Xu, S.; Li, C.; Zhao, L.; Feng, H.; Yue, G.; Ren, Z.; Cheng, G. The soil carbon/nitrogen ratio and moisture affect microbial community structures in alkaline permafrost-affected soils with different vegetation types on the Tibetan plateau. Res. Microbiol. 2014, 165, 128–139. [Google Scholar] [CrossRef]
  10. Khatoon, Z.; Huang, S.; Rafique, M.; Fakhar, A.; Kamran, M.A.; Santoyo, G. Unlocking the potential of plant growth-promoting rhizobacteria on soil health and the sustainability of agricultural systems. J. Environ. Manag. 2020, 273, 111118. [Google Scholar] [CrossRef]
  11. Das, P.P.; Singh, K.R.; Nagpure, G.; Mansoori, A.; Singh, R.P.; Ghazi, I.A.; Kumar, A.; Singh, J. Plant-soil-microbes: A tripartite interaction for nutrient acquisition and better plant growth for sustainable agricultural practices. Environ. Res. 2022, 214, 113821. [Google Scholar] [CrossRef]
  12. Raymond, N.S.; Gómez-Muñoz, B.; van der Bom, F.J.; Nybroe, O.; Jensen, L.S.; Müller-Stöver, D.S.; Oberson, A.; Richardson, A.E. Phosphate-solubilising microorganisms for improved crop productivity: A critical assessment. New Phytol. 2021, 229, 1268–1277. [Google Scholar] [CrossRef] [PubMed]
  13. Scotton, M. Using fertilization rates in semi-natural grasslands to produce seed for ecological restoration. Agric. Ecosyst. Environ. 2022, 340, 108165. [Google Scholar] [CrossRef]
  14. Pisani, O.; Frey, S.D.; Simpson, A.J.; Simpson, M.J. Soil warming and nitrogen deposition alter soil organic matter composition at the molecular-level. Biogeochemistry 2015, 123, 391–409. [Google Scholar] [CrossRef]
  15. Sun, Q.; Miao, C.; Hanel, M.; Borthwick, A.G.; Duan, Q.; Ji, D. Global heat stress on health, wildfires, and agricultural crops under different levels of climate warming. Environ. Int. 2019, 128, 125–136. [Google Scholar] [CrossRef] [PubMed]
  16. Zhao, C.; Zhu, L.; Liang, J.; Yin, H.; Yin, C.; Li, D.; Zhang, N.; Liu, Q. Effects of experimental warming and nitrogen fertilization on soil microbial communities and processes of two subalpine coniferous species in Eastern Tibetan Plateau, China. Plant Soil 2014, 382, 189–201. [Google Scholar] [CrossRef]
  17. Li, C.; Li, Y.; Li, X.; Ma, L.; Xiao, Y.; Zhang, C. Differential responses of plant primary productivity to nutrient addition in natural and restored alpine grasslands in the qinghai lake basin. Front. Plant Sci. 2021, 12, 792123. [Google Scholar] [CrossRef]
  18. Li, Z.; Li, X.; Zhou, S.; Yang, X.; Fu, Y.; Miao, C.; Wang, S.; Zhang, G.; Wu, X.; Yang, C.; et al. A comprehensive review on coupled processes and mechanisms of soil-vegetation-hydrology, and recent research advances. China Earth Sci. 2022, 65, 2083–2114. [Google Scholar] [CrossRef]
  19. Yu, B.; Liu, G.; Liu, Q. Effects of land use changes for ecological restoration on soil moisture on the Chinese Loess Plateau: A meta-analytical approach. J. For. Res. 2020, 31, 443–452. [Google Scholar] [CrossRef]
  20. Ren, M.; Wang, S.; Zhang, X.; Wang, Z.; Yang, M. Rhizosheath soil microbial functional diversity of two typical Gramineae plants in the southern margin of the Junggar basin. Acta Ecol. Sin. 2017, 37, 5630–5639. [Google Scholar]
  21. Burylo, M.; Rey, F.; Mathys, N.; Dutoit, T. Plant root traits affecting the resistance of soils to concentrated flow erosion. Earth Surf. Process. Landf. 2012, 37, 1463–1470. [Google Scholar] [CrossRef]
  22. Gondek, K.; MierzwaHersztek, M. Effect of Soil-Applied L-tryptophan on the Amount of Biomass and Nitrogen and Sulfur Utilization by Maize. Agronomy 2021, 11, 2582. [Google Scholar] [CrossRef]
  23. Yusoff, M.Z.M.; Hu, A.; Feng, C.; Maeda, T.; Shirai, Y.; Hassan, M.A.; Yu, C.P. Influence of pretreated activated sludge for electricity generation in microbial fuel cell application. Bioresour. Technol. 2013, 145, 90–99. [Google Scholar] [CrossRef]
  24. Adams, R.P.; Boratynski, A.; Arista Palmero, M.; Schwarzbach, A.E.; Leschner, H.; Liber, Z.; Minissale, P.; Mataraci, T.; Manolis, A. Analysis of Juniperus phoenicea from throughout its range in the Mediterranean using DNA sequence data from nrDNA and petN-psbM: The case for the recognition of J. turbinata Guss. Phytologia 2013, 95, 202–209. [Google Scholar]
  25. Caporaso, J.G.; Kuczynski, J.; Stombaugh, J.; Bittinger, K.; Bushman, F.D.; Costello, E.K.; Fierer, N.; Peña, A.G.; Goodrich, J.K.; Gordon, J.I.; et al. QIIME allows analysis of high-throughput community sequencing data. Nat. Methods 2010, 7, 335–336. [Google Scholar] [CrossRef] [PubMed]
  26. Schloss, P.D.; Westcott, S.L.; Ryabin, T.; Hall, J.R.; Hartmann, M.; Hollister, E.B.; Lesniewski, R.A.; Oakley, B.B.; Parks, D.H.; Robinson, C.J.; et al. Introducing mothur: Open-source, platform-independent, community-supported software for describing and comparing microbial communities. Appl. Environ. Microbiol. 2009, 75, 7537–7541. [Google Scholar] [CrossRef]
  27. Abarenkov, K.; Nilsson, R.H.; Larsson, K.H.; Alexander, I.J.; Eberhardt, U.; Erland, S.; Høiland, K.; Kjøller, R.; Larsson, E.; Pennanen, T.; et al. The UNITE database for molecular identification of fungi–recent updates and future perspectives. New Phytol. 2010, 186, 281–285. [Google Scholar] [CrossRef]
  28. Edgar, R.C. UPARSE: Highly accurate OTU sequences from microbial amplicon reads. Nat. Methods 2013, 10, 996–998. [Google Scholar] [CrossRef]
  29. Brown, S.P.; Veach, A.M.; Rigdon-Huss, A.R.; Grond, K.; Lickteig, S.K.; Lothamer, K.; Oliver, A.K.; Jumpponen, A. Scraping the bottom of the barrel: Are rare high throughput sequences artifacts? Fungal Ecol. 2015, 13, 221–225. [Google Scholar] [CrossRef]
  30. Oliver, T.H.; Heard, M.S.; Isaac, N.J.; Roy, D.B.; Procter, D.; Eigenbrod, F.; Freckleton, R.; Hector, A.; Orme, C.D.; Petchey, O.L.; et al. Biodiversity and resilience of ecosystem functions. Trends Ecol. Evol. 2015, 30, 673–684. [Google Scholar] [CrossRef]
  31. R Core Team. R: A Language and Environment for Statistical Computing; R Foundation for Statistical Computing: Vienna, Austria, 2022. [Google Scholar]
  32. Heaton, E.; Voigt, T.; Long, S.P. A quantitative review comparing the yields of two candidate C4 perennial biomass crops in relation to nitrogen, temperature and water. Biomass Bioenergy 2004, 27, 21–30. [Google Scholar] [CrossRef]
  33. Burton, A.; Pregitzer, K.; Ruess, R.; Hendrick, R.; Allen, M. Root respiration in North American forests: Effects of nitrogen concentration and temperature across biomes. Oecologia 2002, 131, 559–568. [Google Scholar] [CrossRef] [PubMed]
  34. Lee, T.; Reich, P.; Bolstad, P. Acclimation of leaf respiration to temperature is rapid and related to specific leaf area, soluble sugars and leaf nitrogen across three temperate deciduous tree species. Funct. Ecol. 2005, 19, 640–647. [Google Scholar] [CrossRef]
  35. Martinez del Castillo, E.; Zang, C.S.; Buras, A.; Hacket-Pain, A.; Esper, J.; Serrano-Notivoli, R.; Hartl, C.; Weigel, R.; Klesse, S.; Resco de Dios, V.; et al. Climate-change-driven growth decline of European beech forests. Commun. Biol. 2022, 5, 163. [Google Scholar] [CrossRef]
  36. Christie, E.K.; Delting, J.K. Analysis of interferences between C (3) and C (4) grasses in relation to temperature and soil nitrogen supply. Ecology 1982, 63, 1277–1284. [Google Scholar] [CrossRef]
  37. Zani, D.; Crowther, T.W.; Mo, L.; Renner, S.S.; Zohner, C.M. Increased growing-season productivity drives earlier autumn leaf senescence in temperate trees. Science 2020, 370, 1066–1071. [Google Scholar] [CrossRef]
  38. Mooney, H.; Ferrar, P.J.; Slatyer, R. Photosynthetic capacity and carbon allocation patterns in diverse growth forms of Eucalyptus. Oecologia 1978, 36, 103–111. [Google Scholar] [CrossRef] [PubMed]
  39. Dusenge, M.E.; Duarte, A.G.; Way, D.A. Plant carbon metabolism and climate change: Elevated CO2 and temperature impacts on photosynthesis, photorespiration and respiration. New Phytol. 2019, 221, 32–49. [Google Scholar] [CrossRef]
  40. Palmroth, S.; Holm Bach, L.; Nordin, A.; Palmqvist, K. Nitrogen-addition effects on leaf traits and photosynthetic carbon gain of boreal forest understory shrubs. Oecologia 2014, 175, 457–470. [Google Scholar] [CrossRef]
  41. Dai, Z.; Yu, M.; Chen, H.; Zhao, H.; Huang, Y.; Su, W. Elevated temperature shifts soil N cycling from microbial immobilization to enhanced mineralization, nitrification and denitrification across global terrestrial ecosystems. Glob. Chang. Biol. 2020, 26, 5267–5276. [Google Scholar] [CrossRef]
  42. Sullivan, M.J.; Lewis, S.L.; Affum-Baffoe, K.; Castilho, C.; Costa, F.; Sanchez, A.C.; Ewango, C.E.; Hubau, W.; Marimon, B.; Monteagudo-Mendoza, A.; et al. Long-term thermal sensitivity of Earth’s tropical forests. Science 2020, 368, 869–874. [Google Scholar] [CrossRef] [PubMed]
  43. Powlson, D.S.; Hirsch, P.R.; Brookes, P.C. The role of soil microorganisms in soil organic matter conservation in the tropics. Nutr. Cycl. Agroecosystems 2001, 61, 41–51. [Google Scholar] [CrossRef]
  44. Sokol, N.W.; Slessarev, E.; Marschmann, G.L.; Nicolas, A.; Blazewicz, S.J.; Brodie, E.L.; Firestone, M.K.; Foley, M.M.; Hestrin, R.; Hungate, B.A.; et al. Life and death in the soil microbiome: How ecological processes influence biogeochemistry. Nat. Rev. Microbiol. 2022, 20, 415–430. [Google Scholar] [CrossRef]
  45. Zak, D.R.; Pregitzer, K.S.; King, J.S.; Holmes, W.E. Elevated atmospheric CO2, fine roots and the response of soil microorganisms: A review and hypothesis. New Phytol. 2000, 147, 201–222. [Google Scholar] [CrossRef]
  46. Rincón, A.; Valladares, F.; Gimeno, T.E.; Pueyo, J.J. Water stress responses of two Mediterranean tree species influenced by native soil microorganisms and inoculation with a plant growth promoting rhizobacterium. Tree Physiol. 2008, 28, 1693–1701. [Google Scholar] [CrossRef] [PubMed]
  47. Thoms, C.; Gleixner, G. Seasonal differences in tree species’ influence on soil microbial communities. Soil Biol. Biochem. 2013, 66, 239–248. [Google Scholar] [CrossRef]
  48. Ren, C.; Chen, J.; Deng, J.; Zhao, F.; Han, X.; Yang, G.; Tong, X.; Feng, Y.; Shelton, S.; Ren, G. Response of microbial diversity to C:N:P stoichiometry in fine root and microbial biomass following afforestation. Biol. Fertil. Soils 2017, 53, 457–468. [Google Scholar] [CrossRef]
  49. Lauber, C.L.; Strickland, M.S.; Bradford, M.A.; Fierer, N. The influence of soil properties on the structure of bacterial and fungal communities across land-use types. Soil Biol. Biochem. 2008, 40, 2407–2415. [Google Scholar] [CrossRef]
  50. Fierer, N.; Morse, J.L.; Berthrong, S.T.; Bernhardt, E.S.; Jackson, R.B. Environmental controls on the landscape-scale biogeography of stream bacterial communities. Ecology 2007, 88, 2162–2173. [Google Scholar] [CrossRef]
  51. Ward, N.L.; Challacombe, J.F.; Janssen, P.H.; Henrissat, B.; Coutinho, P.M.; Wu, M.; Xie, G. Three genomes from the phylum Acidobacteria provide insight into the lifestyles of these microorganisms in soils. Appl. Environ. Microb. 2009, 75, 2046–2056. [Google Scholar] [CrossRef]
  52. Magdoff, F.; Bartlett, R. Soil pH buffering revisited. Soil Sci. Soc. Am. J. 1985, 49, 145–148. [Google Scholar] [CrossRef]
  53. Castro, H.F.; Classen, A.T.; Austin, E.E.; Norby, R.J.; Schadt, C.W. Soil microbial community responses to multiple experimental climate change drivers. Appl Environ. Microbiology 2010, 76, 999–1007. [Google Scholar] [CrossRef]
  54. Bennett, A.C.; Murugapiran, S.K.; Hamilton, T.L. Temperature impacts community structure and function of phototrophic Chloroflexi and Cyanobacteria in two alkaline hot springs in Yellowstone National Park. Environ. Microbiol. Rep. 2020, 12, 503–513. [Google Scholar] [CrossRef] [PubMed]
  55. Sorokin, D.Y.; Lücker, S.; Vejmelkova, D.; Kostrikina, N.A.; Kleerebezem, R.; Rijpstra, W.I.C.; Damsté, J.S.S.; Paslier, D.L.; Muyzer, G.; Wagner, M.; et al. Nitrification expanded: Discovery, physiology and genomics of a nitrite-oxidizing bacterium from the phylum Chloroflexi. ISME J. 2012, 6, 2245–2256. [Google Scholar] [CrossRef]
  56. Miura, Y.; Watanabe, Y.; Okabe, S. Significance of Chloroflexi in performance of submerged membrane bioreactors (MBR) treating municipal wastewater. Environ. Sci. Technol. 2007, 41, 7787–7794. [Google Scholar] [CrossRef] [PubMed]
  57. Chen, X.; Wang, J.; You, Y.; Wang, R.; Chu, S.; Chi, Y. When nanoparticle and microbes meet: The effect of multi-walled carbon nanotubes on microbial community and nutrient cycling in hyperaccumulator system. J. Hazard. Mater. 2022, 423, 126947. [Google Scholar] [CrossRef]
  58. Courty, P.E.; Buée, M.; Diedhiou, A.G.; Frey-Klett, P.; Le, T.F.; Rineau, F. The role of ectomycorrhizal communities in forest ecosystem processes: New perspectives and emerging concepts. Soil Biol. Biochem. 2010, 42, 679–698. [Google Scholar] [CrossRef]
  59. Ortiz-Bobea, A.; Ault, T.R.; Carrillo, C.M.; Chambers, R.G.; Lobell, D.B. Anthropogenic climate change has slowed global agricultural productivity growth. Nat. Clim. Chang. 2021, 11, 306–312. [Google Scholar] [CrossRef]
  60. Herms, C.H.; Hennessy, R.C.; Bak, F.; Dresbøll, D.B.; Nicolaisen, M.H. Back to our roots: Exploring the role of root morphology as a mediator of beneficial plant–microbe interactions. Environ. Microbiol. 2022, 24, 3264–3272. [Google Scholar] [CrossRef]
  61. Tang, M.; Li, L.; Wang, X.; You, J.; Li, J.; Chen, X. Elevational is the main factor controlling the soil microbial community structure in alpine tundra of the Changbai Mountain. Sci. Rep. 2020, 10, 12442. [Google Scholar] [CrossRef]
  62. Calvaruso, C.; Turpault, M.P.; Frey-Klett, P. Root-associated bacteria contribute to mineral weathering and to mineral nutrition in trees: A budgeting analysis. Appl. Environ. Microbiology 2006, 72, 1258–1266. [Google Scholar] [CrossRef] [PubMed]
  63. Xie, L.; Li, W.; Pang, X.; Liu, Q.; Yin, C. Soil properties and root traits are important factors driving rhizosphere soil bacterial and fungal community variations in alpine Rhododendron nitidulum shrub ecosystems along an altitudinal gradient. Sci. Total Environ. 2023, 864, 161048. [Google Scholar] [CrossRef] [PubMed]
  64. Zhou, J.; Zhang, M.; Raza, S.T.; Yang, S.; Liu, J.; Cai, M.; Xue, S.; Wu, J. Fungal but not bacterial β-diversity decreased after 38-year-long grazing in a southern grassland. Plant Soil. 2023, 485, 1–13. [Google Scholar] [CrossRef]
  65. An, F.; Niu, Z.; Liu, T.; Su, Y. Succession of soil bacterial community along a 46-year choronsequence artificial revegetation in an arid oasis-desert ecotone. Sci. Total Environ. 2022, 814, 152496. [Google Scholar] [CrossRef]
  66. Kumar, A.; Mukhia, S.; Kumar, R. Microbial community dynamics from a fast-receding glacier of Western Himalayas highlight the importance of microbes in primary succession, nutrient recycling, and xenobiotics degradation. Ecol. Indic. 2022, 144, 109565. [Google Scholar] [CrossRef]
  67. Tedersoo, L.; Bahram, M. Mycorrhizal types differ in ecophysiology and alter plant nutrition and soil processes. Biol. Rev. 2019, 94, 1857–1880. [Google Scholar] [CrossRef]
  68. Kashkak, E.S.; Khakhinov, V.V.; Danilova, E.V.; Oorzhak, U.S.; Dagurova, O.P. Chemical component depositions in the microbial mats and travertine in the Khoito-Gol thermal spring (Eastern Sayan). IOP Conf. Ser. Earth Environ. Sci. 2021, 908, 012004. [Google Scholar] [CrossRef]
Figure 1. (a) Dry weight (g pot−1) of root, stem, and leaf, (b) total weight, and (c) average height (cm plant−1) of A. fruticosa. Note: different lowercase letters indicate the significant difference (p < 0.05) of the same plant parts under different fertilization and warming conditions.
Agronomy 14 02167 g001
Figure 2. (a) Dry weight (g pot−1) of root, stem, and leaf, (b) total weight, and (c) average height (cm plant−1) of P. sepium. Note: different lowercase letters indicate the significant difference (p < 0.05) of the same plant parts under different fertilization and warming conditions.
Agronomy 14 02167 g002
Figure 3. (a) Dry weight (g pot−1) of root, stem, and leaf, (b) total weight, and (c) average height (cm plant−1) of V. negundo. Note: different lowercase letters indicate a significant difference (p < 0.05) of the same plant parts under different fertilization and warming conditions.
Agronomy 14 02167 g003
Figure 4. Bacterial relational abundances under combined nitrogen–temperature treatments at the genus level for (a) A. fruticosa, (b) P. sepium, and (c) V. negundo.
Agronomy 14 02167 g004
Figure 5. Fungal relational abundances under combined nitrogen–temperature treatments at the genus level for (a) A. fruticosa; (b) P. sepium; and (c) V. negundo.
Agronomy 14 02167 g005
Figure 6. The alpha diversity of the Ace index (a,b) and PCoA (c,d) based on the Bray–Curtis distance of bacteria (a,c) and fungi (b,d) in the combined nitrogen–temperature treatments (AF: A. fruticosa, PS: P. sepium, and VN: V. negundo). Note: different lowercase letters indicate the significant differences (p < 0.05) of the same plant parts under different fertilization and warming conditions.
Agronomy 14 02167 g006aAgronomy 14 02167 g006b
Figure 7. The Spearman’s correlation coefficients among the C–N–P stoichiometries in soils and plants, as well as plant growth traits, under the combined nitrogen–temperature treatments: (a) A. fruticosa, (b) P. sepium, and (c) V. negundo (TC: total carbon content; IC: inorganic carbon content; TOC: total organic carbon content; TN: total nitrogen content; TP: total phosphorus content). The structure of the bacterial and fungal communities was correlated with each ecological factor by partial Mantel tests, as well as by microbial function. Curve width and color represent the correlation coefficients of the partial Mantel tests; the red in the figure indicates 0.01 < p < 0.05 and green indicates p ≥ 0.05. The boxes of varying sizes signify the magnitude of Pearson’s correlation coefficient (r).
Agronomy 14 02167 g007aAgronomy 14 02167 g007b
Table 1. Total carbon (TC), total nitrogen (TN), and total phosphorus (TP) in the roots, stems, and leaves of A. fruticosa (AF), P. sepium (PS), and V. negundo (VN). Note: different lowercase letters indicate the significant difference (p < 0.05) of the same plant parts under different nitrogen (N) fertilization and temperature (T) conditions.
RootStemLeafRootStemLeafRootStemLeaf
TC (%)TN (g/kg)TP (g/kg)
A. fruticosa, AF
N1T145.77 ± 0.35 bc44.31 ± 0.84 b43.68 ± 0.62 a18.57 ± 6.62 ab22.63 ± 5.93 ab17.82 ± 3.39 b2.50 ± 0.83 a1.93 ± 0.26 ab2.54 ± 0.44 b
N2T147.06 ± 0.31 ab44.55 ± 0.76 b44.44 ± 0.43 a17.92 ± 2.59 ab12.27 ± 2.59 b23.07 ± 1.46 ab1.12 ± 0.28 a0.67 ± 0.15 c0.91 ± 0.20 cd
N3T146.32 ± 0.90 bc44.00 ± 0.56 b44.64 ± 0.73 a22.75 ± 4.62 ab15.13 ± 1.00 ab21.82 ± 6.12 ab0.90 ± 0.39 a0.82 ± 0.07 bc0.52 ± 0.33 d
N1T245.00 ± 0.38 c45.17 ± 0.20 ab45.36 ± 0.41 a19.82 ± 2.53 ab22.99 ± 6.68 ab24.85 ± 7.04 ab1.68 ± 0.34 a2.59 ± 0.38 a2.42 ± 0.47 b
N2T248.47 ± 0.27 a47.08 ± 1.04 a44.65 ± 0.31 a29.42 ± 3.65 a16.46 ± 0.15 ab21.45 ± 3.94 ab2.46 ± 0.48 a1.57 ± 0.20 abc1.96 ± 0.42 bc
N3T246.85 ± 0.71 b44.99 ± 1.48 ab44.47 ± 0.23 a24.03 ± 2.14 ab16.54 ± 0.81 ab33.81 ± 2.60 a1.23 ± 0.60 a1.08 ± 0.13 bc2.51 ± 0.59 b
N1T346.04 ± 0.42 bc44.13 ± 0.65 b43.29 ± 1.86 a14.34 ± 0.48 b23.78 ± 1.66 a24.75 ± 2.81 ab1.47 ± 0.36 a2.51 ± 0.77 a2.29 ± 0.53 bc
N2T344.97 ± 0.32 c45.02 ± 0.26 ab43.95 ± 0.38 a27.07 ± 2.17 a14.01 ± 1.16 ab32.92 ± 1.10 a2.09 ± 0.11 a1.52 ± 0.27 abc3.15 ± 0.60 ab
N3T345.72 ± 0.32 bc45.69 ± 0.36 ab44.38 ± 0.21 a23.27 ± 1.95 ab15.64 ± 2.54 ab32.24 ± 2.25 a2.36 ± 0.65 a1.47 ± 0.35 abc4.41 ± 0.27 a
P. sepium, PS
N1T147.16 ± 0.40 a42.07 ± 0.12 abc45.54 ± 0.65 a10.03 ± 1.07 ab10.66 ± 0.79 ab24.68 ± 2.54 a1.72 ± 0.35 ab1.63 ± 0.12 bc2.55 ± 0.25 abc
N2T146.36 ± 0.78 ab41.94 ± 0.55 abc43.27 ± 0.05 ab6.09 ± 2.13 b5.21 ± 1.74 c20.69 ± 2.41 a0.95 ± 0.50 b1.19 ± 0.37 c2.48 ± 0.26 abc
N3T147.17 ± 0.45 a43.63 ± 0.61 a44.79 ± 0.86 a11.89 ± 1.29 ab10.42 ± 1.46 b24.16 ± 2.39 a1.09 ± 0.19 ab1.38 ± 0.44 bc2.15 ± 0.42 bc
N1T245.68 ± 0.49 b41.67 ± 0.27 bc42.31 ± 1.01 b9.06 ± 0.94 ab11.96 ± 1.11 ab23.78 ± 1.18 a1.95 ± 0.43 ab3.08 ± 0.45 a3.53 ± 0.27 a
N2T245.54 ± 0.37 b42.19 ± 0.40 abc43.68 ± 1.14 ab14.33 ± 2.12 a12.25 ± 1.05 ab24.01 ± 1.36 a2.35 ± 0.22 a2.42 ± 0.21 ab3.32 ± 0.64 ab
N3T246.58 ± 0.29 ab43.53 ± 0.29 a44.98 ± 0.19 a12.33 ± 1.46 a12.08 ± 0.25 ab22.48 ± 1.26 a1.98 ± 0.42 ab2.42 ± 0.47 ab1.69 ± 0.41 c
N1T345.67 ± 0.26 b41.16 ± 1.00 c44.65 ± 0.67 ab11.25 ± 1.00 ab13.50 ± 1.91 ab17.13 ± 5.11 a2.42 ± 0.37 a3.25 ± 0.16 a2.44 ± 0.32 abc
N2T345.33 ± 0.12 b42.52 ± 0.30 abc43.57 ± 0.63 ab12.03 ± 1.78 ab15.09 ± 1.58 a16.90 ± 3.85 a2.27 ± 0.21 ab3.49 ± 0.27 a1.58 ± 0.56 c
N3T345.54 ± 0.08 b42.94 ± 0.62 ab44.66 ± 0.41 ab14.18 ± 3.17 a14.16 ± 1.51 ab18.47 ± 3.67 a1.36 ± 0.72 ab1.91 ± 0.51 c1.22 ± 0.33 c
V. negundo, VN
N1T145.89 ± 0.21 a44.12 ± 0.30 a46.16 ± 0.77 ab12.16 ± 1.00 b10.54 ± 0.70 b16.44 ± 0.33 b1.52 ± 0.24 a1.33 ± 0.04 abc1.85 ± 0.43 ab
N2T145.03 ± 1.71 a45.31 ± 0.10 a44.27 ± 0.43 ab16.98 ± 0.84 a15.15 ± 0.50 a27.31 ± 0.94 a1.61 ± 0.42 a1.39 ± 0.17 abc2.22 ± 0.12 a
N3T145.83 ± 0.61 a44.57 ± 0.75 a45.66 ± 0.79 ab8.30 ± 1.48 c8.07 ± 0.71 b10.69 ± 1.78 c0.54 ± 0.11 a0.40 ± 0.20 c0.51 ± 0.12 b
N1T247.09 ± 0.23 a44.64 ± 0.59 a44.68 ± 0.74 ab9.70 ± 3.10 c8.53 ± 0.59 b22.04 ± 0.57 b1.74 ± 0.56 a1.81 ± 0.29 ab3.28 ± 0.28 a
N2T246.46 ± 0.33 a45.58 ± 1.19 a46.76 ± 0.56 a11.43 ± 3.25 b7.19 ± 2.17 b18.71 ± 3.67 b1.44 ± 0.68 a0.77 ± 0.33 bc1.81 ± 0.71 ab
N3T245.52 ± 0.57 a44.46 ± 0.23 a44.01 ± 1.47 b15.93 ± 0.79 a14.94 ± 1.19 a25.08 ± 2.55 a1.45 ± 0.27 a1.06 ± 0.22 bc1.90 ± 0.98 ab
N1T346.28 ± 0.42 a45.24 ± 0.27 a46.63 ± 0.33 ab9.23 ± 2.98 c7.40 ± 1.19 b19.72 ± 2.93 b1.57 ± 0.62 a2.15 ± 0.46 a3.15 ± 0.59 a
N2T345.43 ± 0.78 a45.29 ± 1.03 a46.67 ± 0.77 ab14.64 ± 1.03 a9.78 ± 2.19 b25.62 ± 1.67 a1.70 ± 0.25 a1.78 ± 0.59 ab3.33 ± 0.35 a
N3T345.26 ± 0.31 a44.38 ± 0.30 a45.12 ± 0.80 ab16.27 ± 0.16 a15.71 ± 0.87 a29.83 ± 1.53 a0.83 ± 0.13 a1.35 ± 0.13 abc2.96 ± 0.47 a
Table 2. Contents of total carbon (TC), inorganic (IC), organic carbon (TOC), nitrogen (TN), and phosphorus (TP) in soils of A. fruticosa (AF), P. sepium (PS), and V. negundo (VN). Note: different uppercase letters indicate a significant difference (p < 0.05) among various vegetation with the same treatment; different lowercase letters indicate a significant difference (p < 0.05) in the same plant with different treatment.
Soil Property TreatmentsAFPSVN
TC (%)N1T11.77 ± 0.03 Aa1.83 ± 0.02 Aa1.77 ± 0.04 Aa
N2T11.71 ± 0.04 Aab1.72 ± 0.05 Aa1.75 ± 0.02 Aab
N3T11.78 ± 0.01 Aa1.73 ± 0.02 Aa1.76 ± 0.02 Aab
N1T21.65 ± 0.13 Aab1.73 ± 0.05 Aa1.70 ± 0.02 Aab
N2T21.51 ± 0.10 Bb1.77 ± 0.01 Aa1.77 ± 0.01 Aa
N3T21.74 ± 0.01 Aa1.74 ± 0.05 Aa1.74 ± 0.03 Aab
N1T31.68 ± 0.05 Aab1.72 ± 0.06 Aa1.72 ± 0.02 Aab
N2T31.78 ± 0.03 Aa1.76 ± 0.02 Aa1.73 ± 0.01 Aab
N3T31.66 ± 0.03 Aab1.78 ± 0.01 Aa1.65 ± 0.09 Ab
IC (%)N1T11.40 ± 0.09 Aa1.32 ± 0.07 Aa1.33 ± 0.05 Aa
N2T11.34 ± 0.09 Aa1.42 ± 0.04 Aa1.45 ± 0.02 Aa
N3T11.39 ± 0.07 Aa1.38 ± 0.07 Aa1.34 ± 0.05 Aa
N1T21.42 ± 0.05 Aa1.35 ± 0.03 Aa1.34 ± 0.04 Aa
N2T21.37 ± 0.07 Aa1.42 ± 0.05 Aa1.33 ± 0.09 Aa
N3T21.38 ± 0.07 Aa1.42 ± 0.03 Aa1.39 ± 0.02 Aa
N1T31.35 ± 0.05 Aa1.33 ± 0.11 Aa1.35 ± 0.01 Aa
N2T31.40 ± 0.06 Aa1.44 ± 0.05 Aa1.28 ± 0.15 Aa
N3T31.21 ± 0.01 Ba1.39 ± 0.02 Aa1.23 ± 0.07 Ba
TOC (%)N1T10.38 ± 0.08 Aab0.46 ± 0.07 Aa0.44 ± 0.04 Aa
N2T10.37 ± 0.10 Aab0.30 ± 0.04 Aa0.31 ± 0.03 Aa
N3T10.39 ± 0.07 Aab0.35 ± 0.08 Aa0.42 ± 0.06 Aa
N1T20.23 ± 0.09 Aab0.38 ± 0.04 Aa0.37 ± 0.05 Aa
N2T20.15 ± 0.15 Ab0.36 ± 0.06 Aa0.39 ± 0.10 Aa
N3T20.37 ± 0.07 Aab0.32 ± 0.05 Aa0.35 ± 0.10 Aa
N1T30.33 ± 0.07 Aab0.39 ± 0.06 Aa0.42 ± 0.02 Aa
N2T30.38 ± 0.05 Aab0.32 ± 0.06 Aa0.45 ± 0.01 Aa
N3T30.46 ± 0.04 Aa0.44 ± 0.03 Aa0.42 ± 0.14 Aa
TN (g/kg)N1T11.72 ± 0.35 Ab0.74 ± 0.03 Bd1.15 ± 0.18 ABab
N2T11.98 ± 0.22 Aa1.32 ± 0.47 ABbcd0.71 ± 0.15 Bbc
N3T12.31 ± 0.18 Aa2.66 ± 0.22 Aa1.15 ± 0.16 Bab
N1T21.74 ± 0.12 Ab1.17 ± 0.17 Bbcd0.35 ± 0.04 Cc
N2T21.79 ± 0.23 Ab0.79 ± 0.14 Bcd1.51 ± 0.16 Aba
N3T21.71 ± 0.24 Ab1.72 ± 0.20 Abc0.82 ± 0.15 Bbc
N1T31.63 ± 0.07 Ab1.36 ± 0.63 Abcd0.87 ± 0.28 Abc
N2T31.83 ± 0.05 Ab0.61 ± 0.11 Bd0.58 ± 0.10 Bbc
N3T32.06 ± 0.28 Aab1.81 ± 0.02 ABab1.10 ± 0.25 Bab
TP (g/kg)N1T16.68 ± 2.07 Ab7.48 ± 2.44 Abc9.16 ± 0.38 Aa
N2T111.87 ± 1.05 Aa6.01 ± 0.85 Cbc9.06 ± 0.15 Ba
N3T19.79 ± 0.39 Bab12.32 ± 0.19 Aa9.93 ± 0.45 Ba
N1T29.71 ± 1.22 Aab9.29 ± 0.38 Aab2.52 ± 0.83 Bb
N2T27.73 ± 1.48 Ab6.36 ± 0.83 Abc8.84 ± 1.01 Aa
N3T29.30 ± 1.10 Aab9.27 ± 0.16 Aab7.86 ± 0.24 Aa
N1T38.82 ± 0.23 Aab4.39 ± 1.49 Acd7.26 ± 2.19 Aa
N2T38.96 ± 0.92 Aab6.69 ± 0.40 Abc6.75 ± 1.17 Aa
N3T37.91 ± 0.79 Ab2.10 ± 1.88 Bd9.00 ± 0.19 Aa
Disclaimer/Publisher’s Note: The statements, opinions and data contained in all publications are solely those of the individual author(s) and contributor(s) and not of MDPI and/or the editor(s). MDPI and/or the editor(s) disclaim responsibility for any injury to people or property resulting from any ideas, methods, instructions or products referred to in the content.

