Article

Evaluation of Models for Describing Photosynthetic Light–Response Curves and Estimating Parameters in Rice Leaves at Various Canopy Positions

College of Hydraulic Science and Engineering, Yangzhou University, Yangzhou 225009, China
*
Author to whom correspondence should be addressed.
Agronomy 2025, 15(1), 125; https://doi.org/10.3390/agronomy15010125
Submission received: 15 November 2024 / Revised: 17 December 2024 / Accepted: 23 December 2024 / Published: 6 January 2025
(This article belongs to the Section Farming Sustainability)

Abstract

:
The photosynthetic light–response (Pn/I) curve is a crucial tool for accurately estimating photosynthetic parameters. However, selecting the most suitable model from numerous available light–response models is still difficult because of the complex canopy structure. This study aimed to evaluate the performance of different models, including the rectangular hyperbolic model (RHM), non-rectangular hyperbolic model (NRHM), exponential model (EM), and modified rectangular hyperbolic model (MRHM), in modeling Pn/I curves and estimating photosynthetic parameters for rice leaves at various canopy positions. The results showed that the NRHM demonstrated the highest accuracy, and the EM was identified as the most ideal in estimating Pn. The RHM consistently overestimated the maximum net photosynthetic rate (Pnmax), apparent quantum efficiency (α), dark respiration rate (Rd), and light compensation point (LCP) while underestimating light saturation point (LSP) for all rice leaves. The NRHM overestimated Pnmax, underestimated LSP, and accurately estimated LCP for all leaves, and overestimated α and Rd for top leaves but performed well for lower leaves. The EM excelled in estimating Pnmax and LSP for all leaves and performed well in estimating α for the top third and fourth leaves, Rd for the top four leaves, and LCP for the top six leaves. The MRHM was effective in estimating Pnmax but consistently overestimated α, Rd, and LSP for all leaves.

1. Introduction

As the fundamental unit of plant photosynthesis, leaf photosynthesis plays a crucial role in assimilating CO2 from the atmosphere, thereby contributing to climate change mitigation and significantly influencing the biogeochemical cycles and energy dynamics in agricultural ecosystems [1]. Leaf photosynthesis is strongly influenced by surrounding environmental conditions (e.g., temperature, humidity, light, and CO2 concentration) [2] and canopy architecture factors (e.g., canopy height, leaf area index, and leaf angle distribution) [3]. Additionally, due to the varying developmental stages and light acclimation of leaves within the crop canopy, leaf position (referring to a leaf’s specific location in the sequence of leaves, such as the top first leaf, top second leaf, etc.) is also a key factor affecting photosynthetic capacity [4,5,6,7]. Understanding the mechanisms of photosynthesis at various canopy positions (referring to the position within the entire canopy) is critical for optimizing crop productivity and management, especially in dynamic crop growth modeling and parameterization of canopy photosynthesis [8,9].
Light response curves (Pn/I curves) describe the relationship between net photosynthetic rate (Pn) and photosynthetic photon flux density (I). Modeling these curves is becoming increasingly important for studying the photosynthetic response of plants to the surrounding environment and analyzing plant primary productivity [10,11]. Various models, including the rectangular hyperbola model (RHM), the non-rectangular hyperbola model (NRHM), the exponential model (EM), and the modified rectangular hyperbola model (MRHM), have been widely applied to capture Pn/I curves [12]. These models provide photo-physiological core parameters, such as maximum net photosynthetic rate (Pnmax), apparent quantum efficiency (α), dark respiration rate (Rd), light-compensation point (LCP), and light-saturation point (LSP), which play important roles in assessing crop photosynthesis, light use efficiency, maximum carboxylation efficiency, and other physiological processes related to plant growth and productivity [13,14]. However, the adaptability of these models varies across different crops and environments [11,15,16]. Importantly, a model that effectively simulates the Pn/I curves may not necessarily estimate photosynthetic parameters with the same level of accuracy [17]. Different models may exhibit similar overall fitting precision but still show discrepancies in estimating specific parameters [18]. Therefore, evaluating the accuracy of these models in both simulating Pn/I curves and estimating associated photosynthetic parameters is crucial to ensure that the results accurately reflect the actual photosynthetic capacity. Understanding how Pn/I curves and their associated photosynthetic parameters vary with leaf position is essential for comprehending the photosynthetic potential within the crop canopy. This knowledge provides a foundation for scaling leaf-level photosynthesis to the canopy level by integrating with detailed three-dimensional canopy structure models [19,20,21] or for identifying the optimal leaf position that represents the photosynthetic capacity of the entire canopy [22]. Therefore, further exploration of the applicability and accuracy of different light–response models and their estimated photosynthetic parameters across various positions within the crop canopy is necessary.
Rice ranks among the three major global food crops [23]. The Pn/I curve and associated photosynthetic parameters (Pnmax, α, Rd, LCP, and LSP) vary significantly among leaves at various canopy positions [22,24,25,26]. The spatiotemporal dynamics, including leaves, sheaths, stems, and panicles, can be quantitatively described and predicted throughout the rice season [27]. Gaining insight into the vertical profile of leaf photosynthetic parameters within the canopy is critical for understanding the vertical characteristic of leaf photosynthesis within the crop canopy, which provides basic information for upscaling photosynthesis or photosynthetic parameters from leaf level to canopy level by incorporating detailed three-dimensional canopy structure models [28]. However, the optimal light response model for estimating Pn/I curves and parameters within the rice canopy remains unclear. In this study, we identified the most suitable model (from RHM, NRHM, EM, and MRHM) for simulating Pn/I curves and estimating photosynthetic parameters (Pnmax, α, Rd, LCP, and LSP) for rice leaves at different canopy positions. The results are expected to enhance our understanding of the spatial heterogeneity of photosynthetic parameters within rice canopy and provide a basis for upscaling these parameters from leaf to canopy scales.

2. Materials and Methods

2.1. Measurements of the Light–Response Process

Japonica Rice variety NJ46 was transplanted on 1 July with hill spacing of 13 cm × 25 cm and harvested on 26 October 2017 at the Kunshan Irrigation and Drainage Experiment Station (31°15′50″ N; 120°57′43″ E) in Kunshan, Jiangsu, East China. During the latter jointing stage, on August 15, 17, and 19, a primary shoot with a fully expanded top first leaf was randomly selected to measure Pn/I curves at 19 levels of I, in decreasing order of 2000, 1950, 1900, 1800, 1600, 1400, 1200, 1000, 800, 600, 400, 300, 200, 150, 100, 70, 50, 30, and 0 μmol m−2 s−1. Measurements were taken using a portable photosynthesis system (LI-6800; LI-COR, Lincoln, NE, USA) on all unwithered leaves of the selected primary shoot (from the top first to the top seventh leaf, marked as T-1st, T-2nd, T-3rd, T-4th, T-5th, T-6th and T-7th) between 8:00 and 12:00 a.m. For each Pn/I curve measurement, the chamber conditions were maintained at 30 °C, 70% relative humidity, and a CO2 concentration of 400 μmol mol−1 under saturated soil moisture conditions. These conditions were maintained for 15 min at I of 2000 μmol m−2 s−1 to allow for the adaptation and stabilization of leaf photosynthesis before automatically recording leaf Pn at 120-s intervals at each I level. In total, twenty-one Pn/I curves from three individual primary shoots were obtained.

2.2. Photosynthetic Light Response Curve-Fitting Model and Its Parameters

The RHM for photosynthesis is given in Equation (1) [29]
P n = α I P nmax α I + P nmax R d
where Pn (μmol m−2 s−1) is the net photosynthetic rate; α (μmol μmol−1) is the apparent quantum efficiency; I (μmol m−2 s−1) is the photosynthetic photon flux density; Pnmax (μmol m−2 s−1) is the maximum net photosynthetic rate; Rd (μmol m−2 s−1) is the dark respiration rate. The light compensation point (LCP, μmol m−2 s−1) and light saturation point (LSP, μmol m−2 s−1) are given as LCP = R d P nmax α ( P nmax R d ) and LSP = P nmax + R d α .
The NRHM is represented in the following form in Equation (2) [30]:
P n = α I + P nmax α I + P nmax 2 4 θ α I P nmax 2 θ R d
where θ (dimensionless) is the convexity of the curve. The LCP is given as LCP = R d P nmax θ R d 2 α P nmax R d , and the LSP is estimated using the same method as for the RHM.
The EM for photosynthesis is given in Equation (3) [31]:
P n = P nmax ( 1 e α I P nmax ) R d
The LCP is given as LCP = P nmax α ln ( 1 R d P nmax ) , and the LSP is assumed to be the light intensity where Pn equals 0.9Pnmax.
The MRHM is represented in Equation (4) [32]:
P n = α 1 β I 1 + γ I I R d
where β and γ are correction coefficients. Here, LCP = Rd/α, LSP = β + γ / β 1 γ , and P nmax = α β + γ β γ 2 R d .

2.3. Fit of Measured Photosynthetic Light Response Curves and Estimation of Its Parameters

The RHM, NRHM, EM, and MRHM models, as described in Equations (1)–(4), were applied individually to fit the measured Pn/I curves for leaves at different canopy positions. This process generated seven sets of photosynthetic parameters (Pnmax, α, and Rd), which were determined during the fitting process, and the corresponding LCP and LSP were subsequently estimated. These parameter sets corresponded to the leaves at positions T-1st, T-2nd, T-3rd, T-4th, T-5th, T-6th, and T-7th. The fitting of the Pn/I curves was achieved using the Solver function in Microsoft Office Excel 2023, with the goal of minimizing the root mean square error (RMSE), as described in Equation (5).
R M S E = 1 n i = 1 n P ncal , i P nobs , i 2
where Pncal,i is the Pn estimated by the RHM, NRHM, EM, or MRHM; Pnobs,i is the measured Pn, and n is the total number of Pn data.

2.4. Model Assessment

Akaike information criterion (AIC), as described in Equation (6), is primarily used to assess the complexity of a model and balance its goodness of fit. It not only evaluates the degree of fit of the model but also penalizes the model’s complexity. Therefore, it tends to select models that can explain the data well while remaining relatively simple [33]. Therefore, the AIC statistic is not used to evaluate the absolute quality of a model; instead, it helps to compare the relative proximity of two or more models to the ideal model [34]. A model with the lowest AIC is regarded as the most ideal, and preference for a model decreases as the AIC increases [35]. Thus, the RHM, NRHM, EM, and MRHM were ranked based on their AIC [36], followed by comparison using determinants coefficients (R2) in Equation (7) and RMSE in Equation (5). The AIC and R2 values for the RHM, NRHM, EM, and MRHM were calculated using Microsoft Office Excel 2023.
A I C = 2 ln ( 1 n i = 1 n ( P ncal , i P nobs , i ) 2 ) + 2 p
R 2 = 1 i = 1 n P ncal , i P nobs , i P ncal , i P ncal ¯ i = 1 n P nobs , i P nobs ¯ 2 i = 1 n P ncal , i P ncal ¯ 2
where P ncal ¯ is the corresponding average Pncal,I; P nobs ¯ is the corresponding average Pn; p is the number of parameters in the evaluated model, which are 3, 4, 3, and 4 for RHM, NRHM, EM, and MRHM models, respectively.
Furthermore, the one-way analysis of variance (ANOVA) and least significant difference multiple comparison tests were conducted to assess the differences at p < 0.05 level among estimated and measured photosynthetic parameters (including Pnmax, α, Rd, LCP, and LSP). These statistical analyses were performed using SPSS 16.0 (IBM, Chicago, IL, USA), and the estimated parameters were obtained from the RHM, NRHM, EM, and MRHM.

3. Results

3.1. Performances of RHM, NRHM, EM, and MRHM Models

The RHM, NRHM, EM, and MRHM effectively captured light response curves for rice leaves at various canopy positions (Figure 1 and Table 1). The estimated Pn based on the RHM, NRHM, EM, and MRHM respectively explained 99.63% to 99.98%, 99.95% to 99.99%, 99.93% to 99.98%, and 99.93% to 99.99% of the measured Pn for rice leaves at various canopy positions (99.93%, 99.99%, 99.97% and 99.98%, on average), with the RMSE falling between 0.2977 and 0.7283 μmol m−2 s−1, 0.1791 and 0.2770 μmol m−2 s−1, 0.2665 and 0.3904 μmol m−2 s−1, 0.1880 and 0.3202 μmol m−2 s−1 (0.5208 μmol m−2 s−1, 0.2340 μmol m−2 s−1, 0.3202 μmol m−2 s−1, and 0.2739 μmol m−2 s−1, on average), and with the R2 falling between 0.9854 and 0.9995, 0.9979 and 0.9998, 0.9972 and 0.9994, 0.9972 and 0.9998 (0.9979, 0.9996, 0.9992, and 0.9994, on average) (Table 1). Among these models, the estimates based on NRHM showed the highest percentage of explained variance for measured Pn, the lowest RMSE, and the highest R2, indicating that NRHM provided the most accurate estimation of light response curves for rice leaves. Specifically, the RHM performed well for the T-1st and T-2nd leaves but slightly underestimates Pn at I between 600 and 1200 μmol m−2 s−1 and slightly overestimates Pn at I greater than 1900 μmol m−2 s−1 for leaves lower than the T-3rd (Figure 1A). The NRHM and MRH provided accurate estimations of light response curves for all leaf positions under various light intensity conditions (Figure 1B,D). However, the MRH exhibited slightly lower accuracy compared to the NRHM model (Table 1). The EM accurately represented light response curves for all leaf positions, though it overestimates Pn for the T-1st and T-2nd leaves at I between 800 and 1400 μmol m−2 s−1 (Figure 1C). Overall, the NRHM provided the most accurate estimates of light response curves for rice leaves across various light intensities and leaf positions.
According to calculated values of AIC (Table 1), the preference for models varied across different leaf positions. For the T-1st leaf, the preference decreased in the sequence of EM, MRHM, NRHM, and RHM, suggesting that the EM provided the ideal fit, followed by MRHM. The NRHM and RHM showed relatively poorer fit, with higher AIC values indicating less optimal performance. For the T-2nd leaf, the preference sequence shifted to NRHM, RHM, MRHM, and EM, with the NRHM providing the ideal fit, closely followed by RHM. Interestingly, the EM, which was preferred for the T-1st leaf, performed less favorably here, as indicated by its higher AIC. This suggested that the EM may not capture the specific characteristics of photosynthesis in the T-2nd leaf as effectively as the NRHM and RHM. The preference sequence reverted to EM, NRHM, RHM, and MRHM for the T-3rd leaf, and the preference sequence was EM, NRHM, MRHM, and RHM for the T-4th, T-5th, T-6th, T-7th, and the overall dataset, indicating that the EM explained Pn/I curves well while remaining relatively simple across these positions, as well as when considering all leaves together. This trend suggested that the EM was particularly ideal at capturing the photosynthetic dynamics in the majority of the leaf positions, providing a good balance of accuracy and simplicity. Overall, the EM was generally considered the ideal model compared to NRHM, RHM, and MRHM, particularly for the majority of leaf positions, including T-3rd through T-7th and the overall dataset. While the NRHM was preferred for the T-2nd leaf, the EM consistently outperformed the other models in terms of AIC for most cases, making it the most suitable choice for explaining the photosynthetic processes.

3.2. Photosynthetic Response Parameters and Their Estimations Based on the RHM, NRHM, EM, MRHM

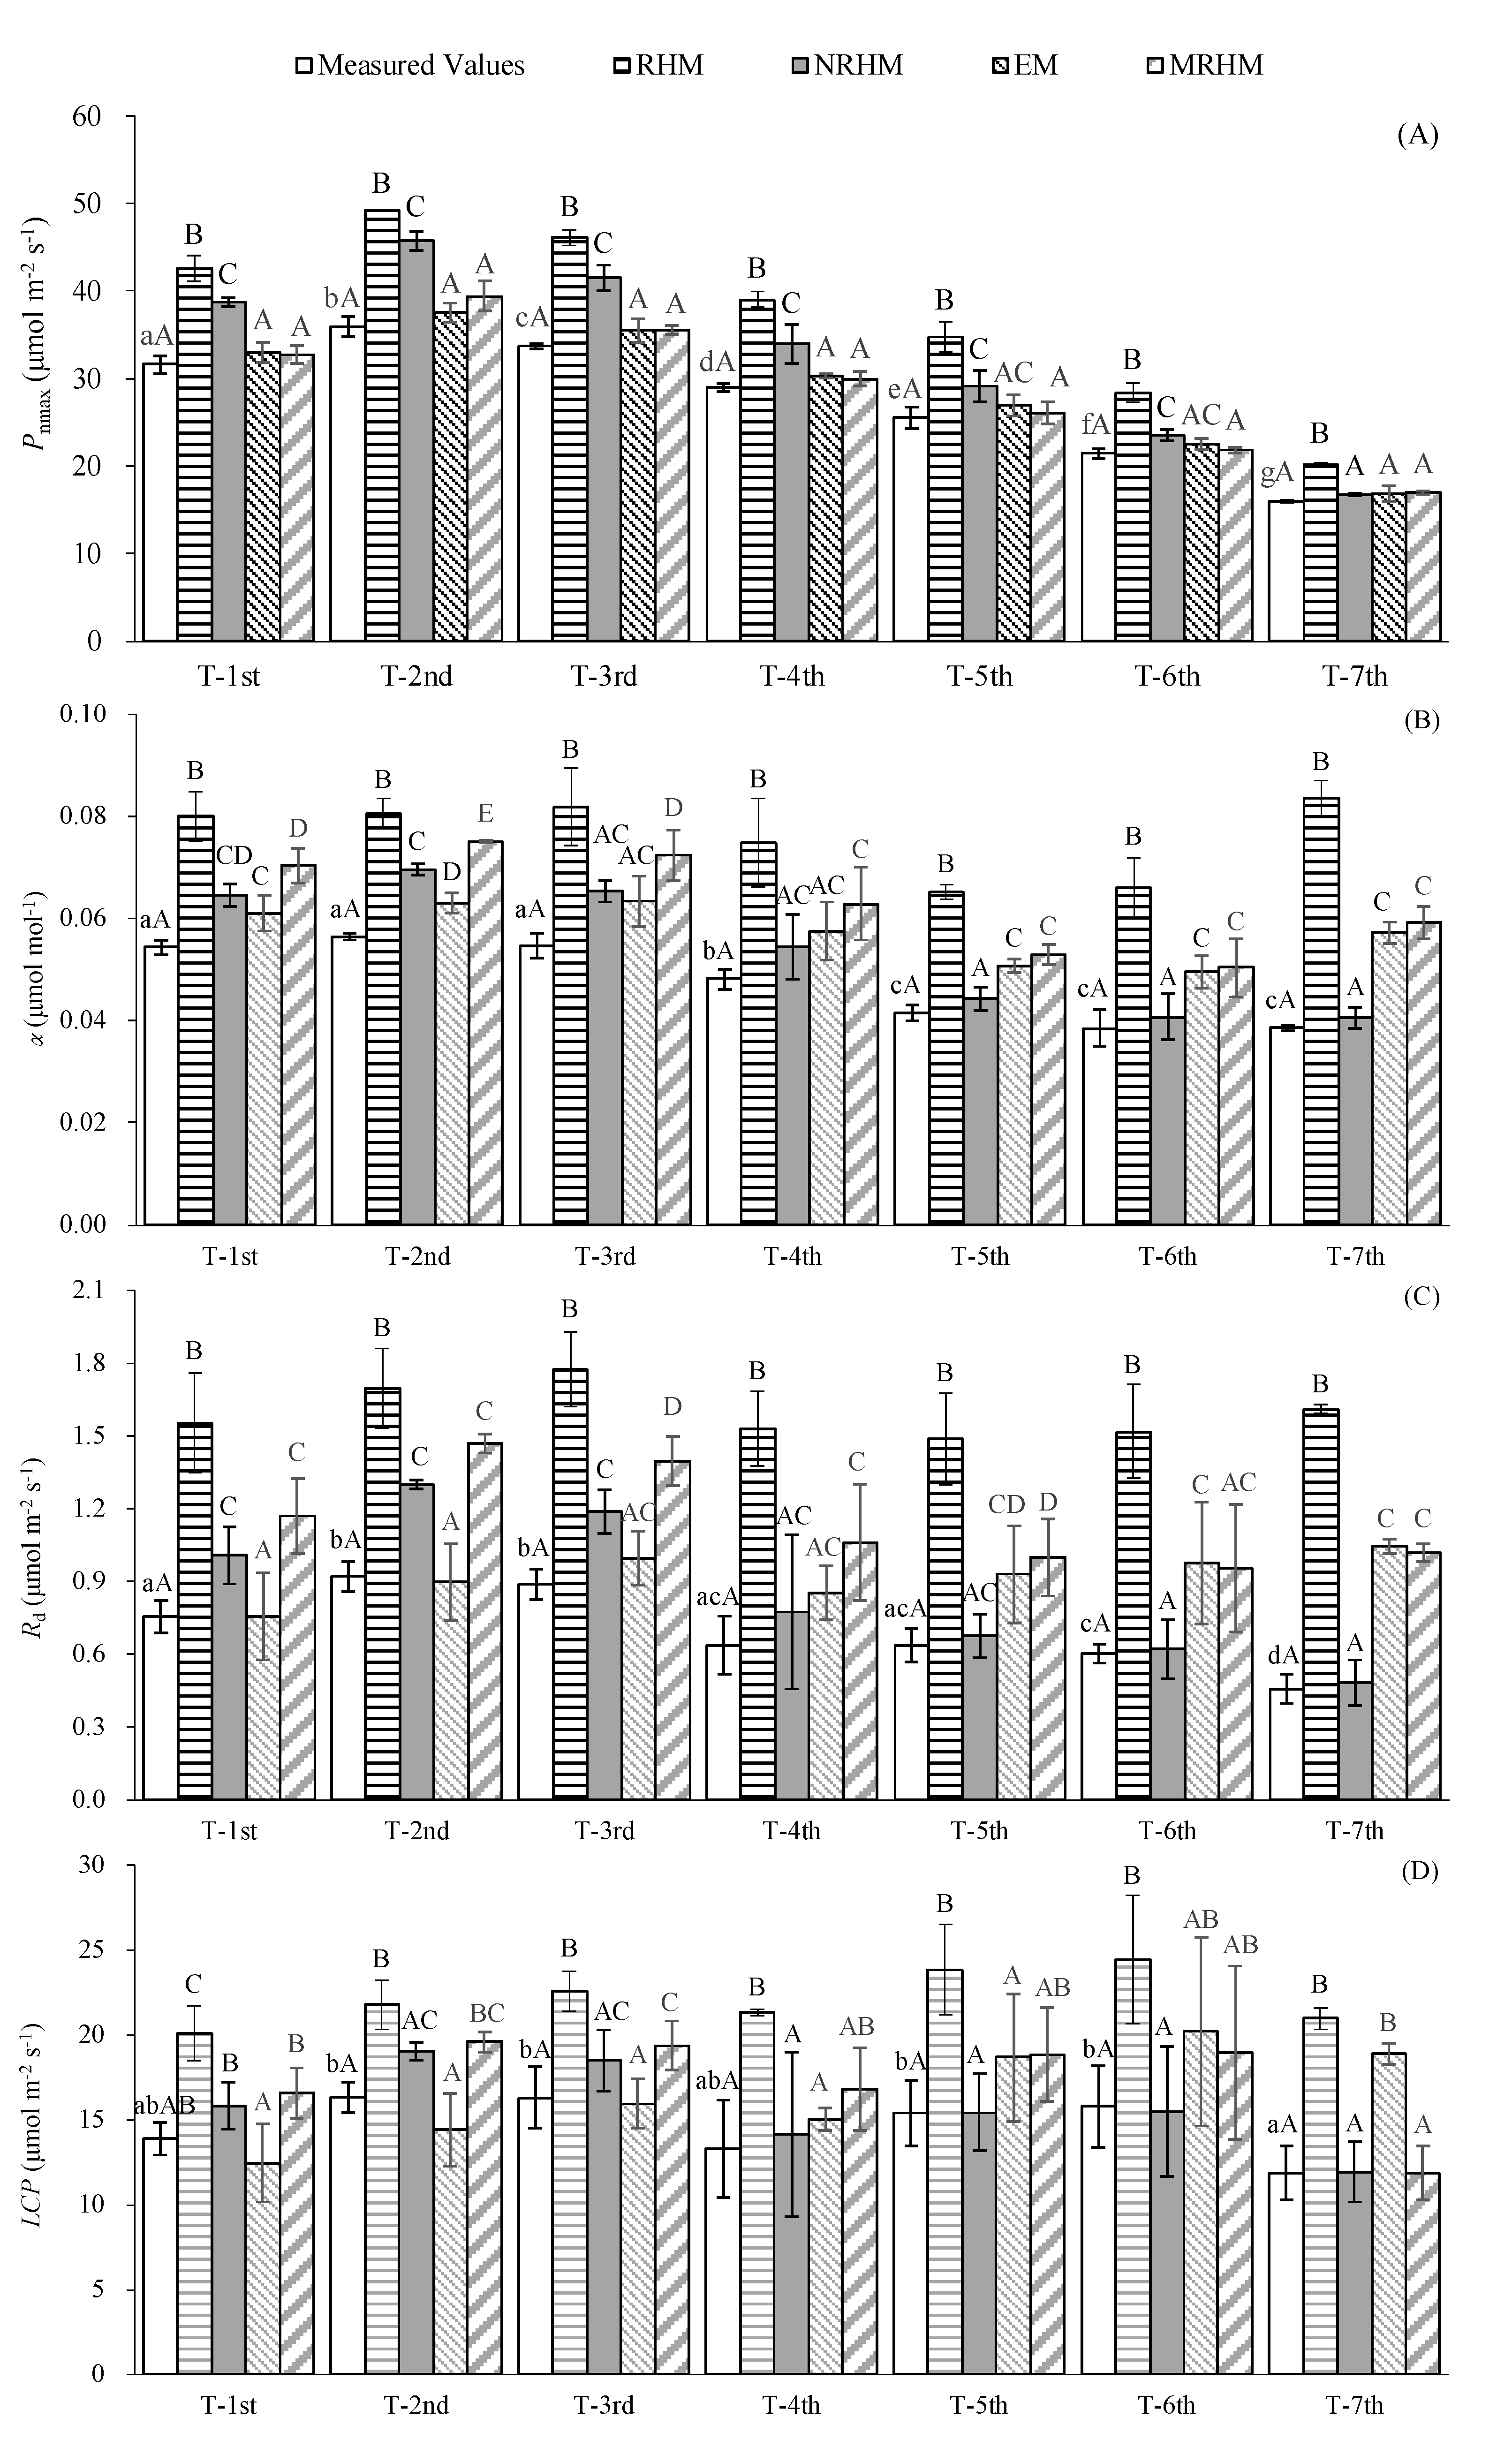
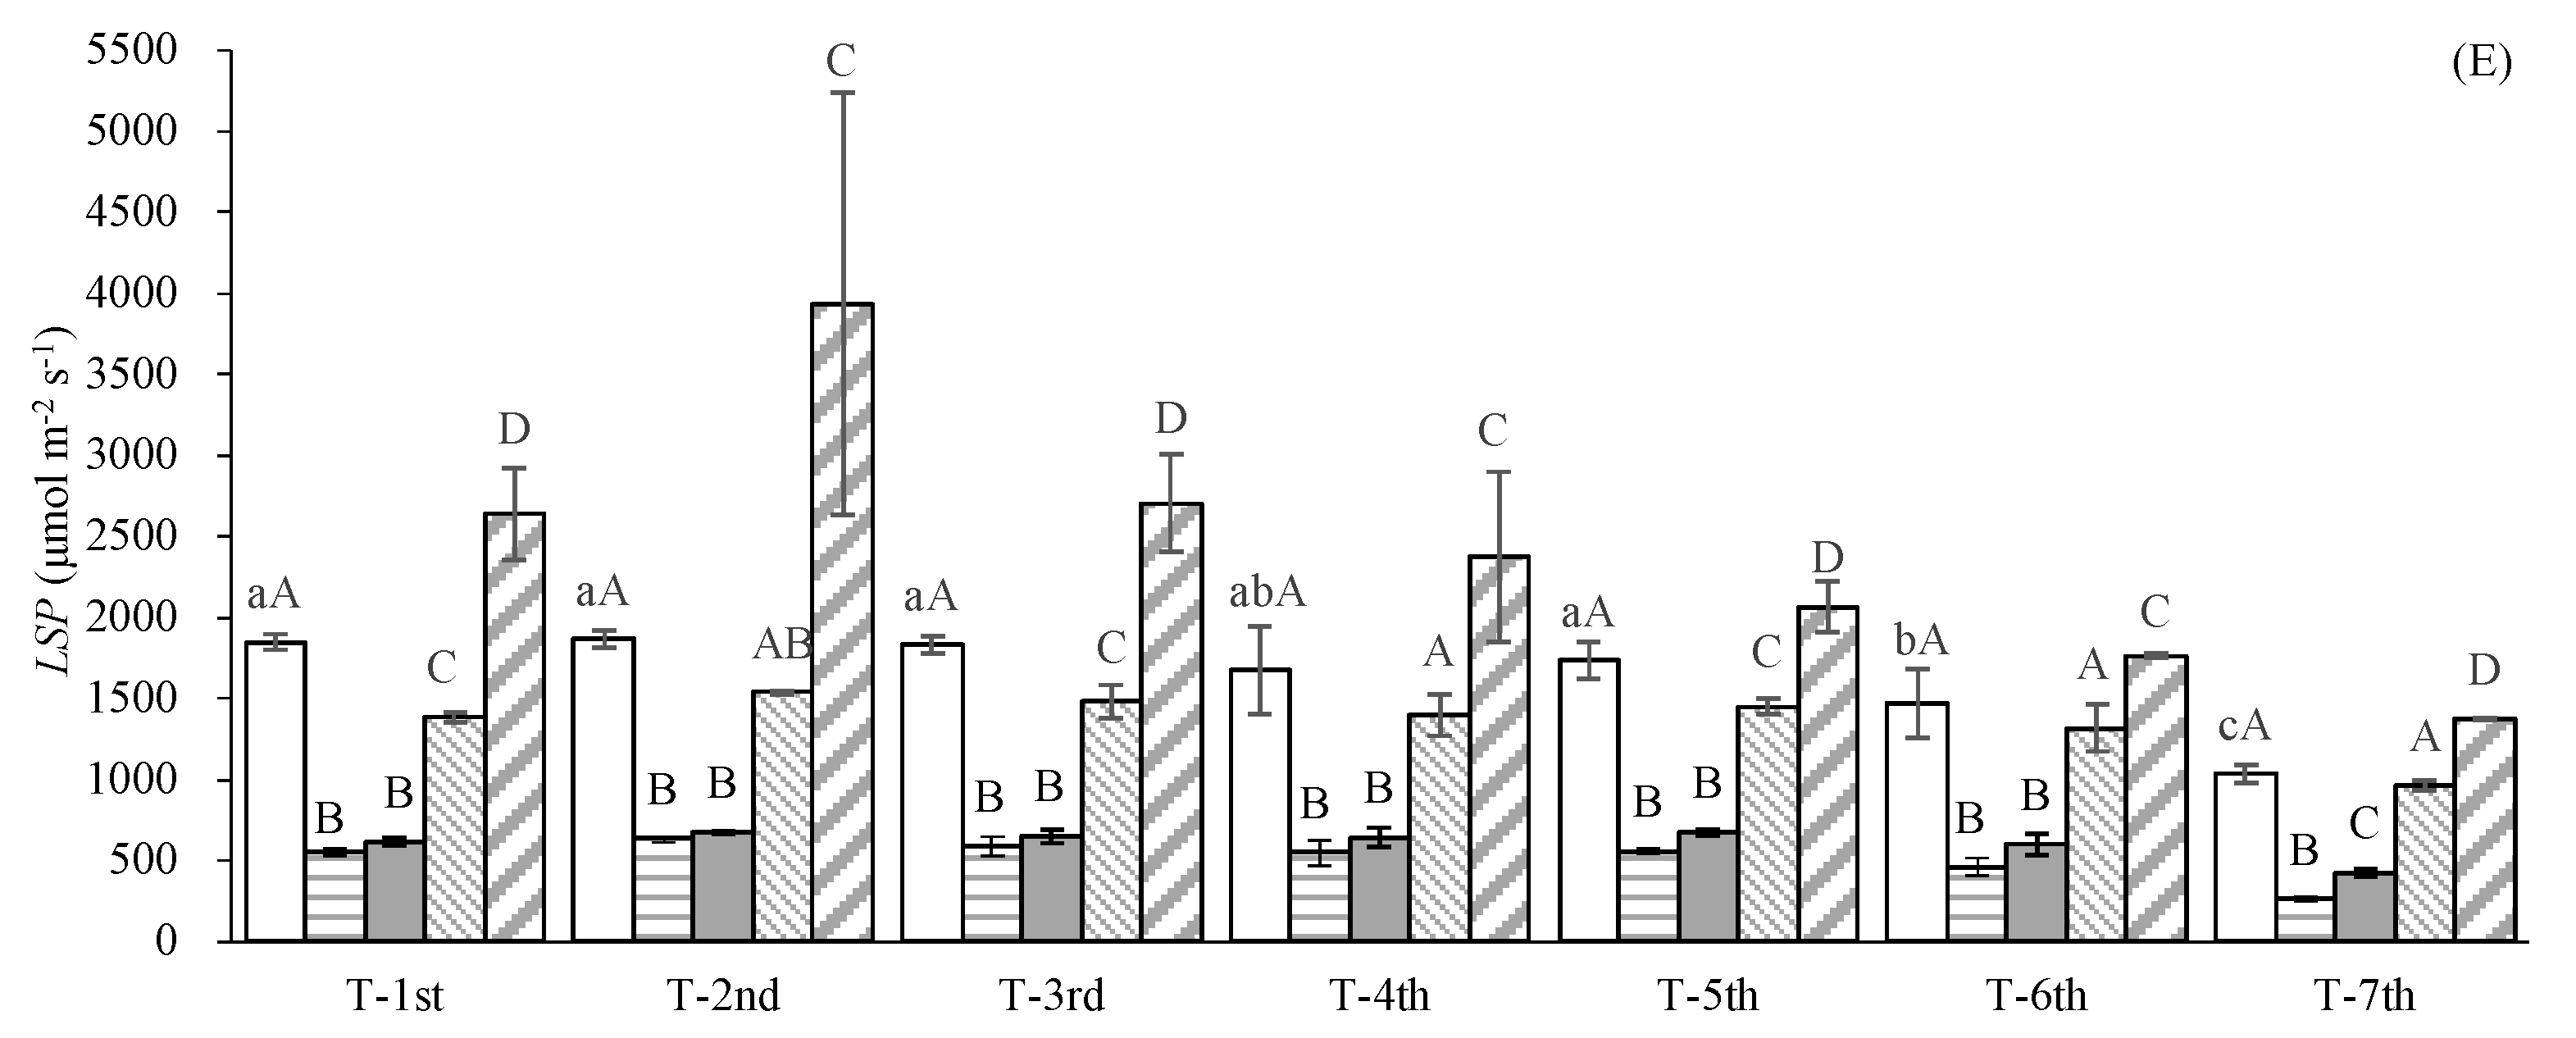
The measured Pnmax, α, Rd, LCP, and LSP differed among leaves at different positions (Figure 2). The Pnmax exhibited significant variation between adjacent leaf positions, peaking at 35.92 μmol m−2 s−1 at the T-2nd and decreasing to a minimum of 16.00 μmol m−2 s−1 at the T-7th with lowering leaf position. The α remained relatively stable among the top three leaves, ranging from 0.0543 μmol mol−1 to 0.0563 μmol mol−1, and then decreased significantly in the T-4th and T-5th, with a further insignificant decrease in downward leaves. The Rd increased significantly to the maximum of approximately 0.90 μmol m−2 s−1 at T-2nd or T-3rd and then decreased to a minimum of 0.46 μmol m−2 s−1 at the T-7th. The LCP showed no significant differences among the top six leaves, ranging from 13.3 μmol m−2 s−1 to 16.3 μmol m−2 s−1, and was significantly higher compared to the T-7th. The LSP also showed no significant differences among the top five leaves, ranging from 1673.3 μmol m−2 s−1 to 1866.7 μmol m−2 s−1, and was significantly higher compared to the T-7th.
The estimated Pnmax based on the RHM and NRHM were significantly higher than the measured Pnmax across different leaf positions within the canopy; the Pnmax estimated using the EM and MRHM showed no significant difference for all leaves within the rice canopy (Figure 2A). The estimated α and Rd were generally significantly or slightly higher than the measured ones (Figure 2B,C). Specifically, the α estimated using the RHM, NRHM, EM, and MRHM were significantly higher than measured values for the top two leaves. The α estimated using the EM for the T-3rd and T-4th, as well as those estimates using the NRHM for the T-3rd to T-7th leaves, did not show a significant difference from the measured values. For Rd, the estimates based on the NRHM for T-4th to T-7th, as well as the estimates from the EM for the T-1st to T-4th, showed no significant differences from the measured values. Regarding LCP, estimates based on the RHM tended to be significantly higher than the measured values across various leaf positions (Figure 2D). The LCP estimates using the NRHM did not significantly differ from the measured values across different leaf positions. The LCP based on the EM showed no significant difference for the top six leaves but was significantly higher than the measured LCP for the T-7th. The LCP estimated using the MRHM were significantly higher than the measured values for T-2nd to T-3rd and showed no significant difference for T-1st and from T-4th to T-7th. The LSP estimated using the RHM and NRHM were significantly lower than measured values; those estimates using the MRHM were significantly higher, and the LSP based on the EM showed no significant difference from the measured values (Figure 2E). The choice of model significantly impacts the accuracy of photosynthetic parameter estimates.

4. Discussion

The light response curve is an important tool for describing the response of the Pn to I, identifying photosynthetic parameters and evaluating crop photosynthetic efficiency [11,37,38,39,40]. Choosing an appropriate model is crucial to estimate canopy photosynthesis and predict crop productivity. The RHM, NRHM, EM, and MRHM generally effectively capture light response curves for rice leaves across various canopy positions in the current study. And the RHM, EM, and MRHM performed inferior to the NRHM under certain light intensity conditions and for specific leaf positions, with the NRHM providing accurate estimations of light response curves across all leaf positions and various light intensity conditions (Figure 1). Many studies have shown that the simulation accuracy of RH, NRH, and EM models was poor under high light intensity due to their monotonically increasing functions, which could not simulate the decrease in Pn under conditions of photoinhibition [41]. However, these models performed well in the current study, which could be attributed to the fact that no obvious photoinhibition was observed in this research (Figure 1), as rice has a relatively high light saturation point, generally above 1600 μmol m−2 s−1 [42].
The maximum photosynthetic capacity of leaves, represented by Pnmax, reflects the maximum assimilation capacity under certain environmental conditions [43,44]. The Pnmax peaked at the T-2nd and then decreased in downward leaves (Figure 2A), indicating that the ability to utilize strong light, photosynthetically active range, and organic matter production capacity was highest at the T-2nd leaf and diminished in the leaves below. This pattern is consistent with previous findings [26], which reported that Pnmax reached its maximum at the penultimate fully developed leaf and then gradually declined in the lower rice leaves. The light-utilization efficiency, denoted by α, is another crucial indicator [45]. The measured α ranged from 0.0385 to 0.0563 across different leaf positions (Figure 2B), with the top three leaves exhibiting significantly higher α values than the lower leaves, consistent with the finding that the upper leaves are the primary functional leaves for canopy photosynthesis [46,47]. The Rd, related to the physiological activity of leaves [48], reached its maximum at the T-2nd or T-3rd and then gradually decreased with downward leaves (Figure 2C), illustrating that physiological activity diminished with decreasing leaf height. The LCP, meaning that the assimilation of carbon dioxide through photosynthesis is equal to the carbon dioxide emitted by respiration [49], showed no significant variation with leaf position (Figure 2D). This could be attributed to the fact that leaves with a stronger ability to utilize weak light (as indicated by α) also exhibited stronger respiration (as indicated by Rd). The top five leaves showed significantly higher LSP (Figure 2E), indicating that these leaves could utilize more light energy [50]. Overall, the photosynthetic capacity and physiological activity of rice leaves decrease with lower canopy positions. This trend is closely linked to variations in leaf nitrogen levels, chlorophyll content, Rubisco content, and enzyme activities within the rice canopy [4,24,51]. Notably, leaf photosynthetic capacity exhibits a strong correlation with leaf nitrogen levels [51,52,53], and specific leaf nitrogen content decreases in downward leaves [54]. Additionally, reductions in chlorophyll content, Rubisco content, and enzyme activities result in decreased efficiencies of radiant energy utilization, electron transport, and photophosphorylation from the top to the base of the canopy [4,24,55], collectively contributing to a decline in leaf photosynthetic capacity. Additionally, the variation in photosynthetic capacity with decreasing leaf position may also be attributed to leaf adaptations to reduced incident irradiance at lower canopy levels [56].
Furthermore, the estimated values of Pnmax, α, Rd, LCP, and LSP based on RHM, NRHM, EM, and MRHM exhibited noticeable differences compared to measured data at different leaf positions (Figure 2). Pnmax was overestimated by the RHM and NRHM but was accurately estimated by the EM and MRHM (Figure 2A). This aligned with previous studies, where asymptotic models (Equations (1) and (2)) were shown to overestimate Pnmax due to their inability to account for photoinhibition under high light conditions [12]. The superior performance of MRHM can be attributed to its ability to incorporate adjusting factors (β and γ in Equation (4)), enabling better modeling under high light intensities [57]. The parameter α estimated by RHM was generally higher than the measured values, consistent with earlier findings [32]. NRHM performed better in estimating α, as the inclusion of the convexity coefficient (θ in Equation (2)) made the curve’s turning point more pronounced and stable under increasing light intensity, resulting in closer agreement with the measured data (Figure 2B) [58]. For Rd, EM provided accurate estimates in the top canopy, while NRHM performed better at lower canopy levels (Figure 2C). LCP was well estimated by both NRHM and EM for most leaf positions (Figure 2D). These results were consistent with some prior studies, though contradictory to others [59,60,61]. LSP values estimated by RHM and NRHM were significantly lower than the measured values (Figure 2E), which agreed with the findings by Chen et al. (2011) [59]. The MRHM, on the other hand, significantly overestimated LSP, exceeding both measured values and those estimated by other models (Figure 2E). This aligned with the findings of Ma et al. (2021) [62], who reported that MRHM predicted higher LSP values compared to other models, though their study also reported no significant difference between MRHM estimates and measured LSP values, which contrasts with the current findings. The absence of obvious photoinhibition (Figure 1D) in this study might explain the overestimation of LSP by MRHM. Overall, the varying performance of these models reflected their distinct structural strengths and limitations under different canopy conditions, underscoring the importance of selecting an appropriate model when estimating photosynthetic parameters, as the accuracy of these estimates was highly dependent on the model used and the specific leaf positions within the canopy.

5. Conclusions

This study evaluated the performance of four photosynthetic light–response models, including the rectangular hyperbolic model (RHM), non-rectangular hyperbolic model (NRHM), exponential model (EM), and modified rectangular hyperbolic model (MRHM), in modeling photosynthetic light–response (Pn/I) curves and estimating photosynthetic parameters in rice leaves across different canopy positions. The NRHM demonstrated superior accuracy in modeling Pn/I curves, while the EM was identified as the ideal model, explaining the data well and remaining relatively simple. The Pnmax was estimated well by the EM and MRHM for all leaves within the rice canopy. The α was accurately estimated by the NRHM for the T-3rd to T-7th leaves. The Rd was estimated well by the NRHM for the T-4th to T-7th leaves and by the EM for the T-1st to T-4th leaves. The LCP was estimated well by the NRHM for all leaves within the rice canopy and by EM for the top six leaves. The LSP based on the EM showed no significant difference from the measured values. These findings highlighted the importance of model selection in estimating photosynthetic parameters, offering valuable guidance for accurately predicting crop photosynthesis in agroecosystems.

Author Contributions

Conceptualization, Y.L.; methodology, Y.L.; formal analysis, Y.G.; data curation, Y.L.; writing—original draft preparation, Y.G.; writing—review and editing, Y.G. and Y.L.; funding acquisition, Y.L. All authors have read and agreed to the published version of the manuscript.

Funding

This research was funded by the National Science Foundation of China, grant number NO. 52309064.

Data Availability Statement

The original contributions presented in this study are included in this article; further inquiries can be directed to the corresponding authors. Raw code is available upon request.

Conflicts of Interest

The authors declare no conflicts of interest.

References

  1. Li, R.Q.; He, Y.; Chen, J.Y.; Zheng, S.Y.; Zhuang, C.X. Research Progress in Improving Photosynthetic Efficiency. Int. J. Mol. Sci. 2023, 24, 9286. [Google Scholar] [CrossRef] [PubMed]
  2. Kaiser, E.; Morales, A.; Harbinson, J.; Kromdijk, J.; Heuvelink, E.; Marcelis, L.F.M. Dynamic photosynthesis in different environmental conditions. J. Exp. Bot. 2015, 66, 2415–2426. [Google Scholar] [CrossRef] [PubMed]
  3. Liu, F.S.; Song, Q.F.; Zhao, J.K.; Mao, L.X.; Bu, H.Y.; Hu, Y.; Zhu, X.G. Canopy occupation volume as an indicator of canopy photosynthetic capacity. New Phytol. 2021, 232, 941–956. [Google Scholar] [CrossRef] [PubMed]
  4. Suzuki, Y.; Miyamoto, T.; Yoshizawa, R.; Mae, T.; Makino, A. Rubisco content and photosynthesis of leaves at different positions in transgenic rice with an overexpression of RBCS. Plant Cell Environ. 2009, 32, 417–427. [Google Scholar] [CrossRef]
  5. Li, D.D.; Tian, M.Y.; Cai, J.; Jiang, D.; Cao, W.X.; Dai, T.B. Effects of low nitrogen supply on relationships between photosynthesis and nitrogen status at different leaf position in wheat seedlings. Plant Growth Regul. 2013, 70, 257–263. [Google Scholar] [CrossRef]
  6. Niinemets, Ü. Leaf age dependent changes in within-canopy variation in leaf functional traits: A meta-analysis. J. Plant Res. 2016, 129, 313–338. [Google Scholar] [CrossRef]
  7. Townsend, A.J.; Retkute, R.; Chinnathambi, K.; Randall, J.W.P.; Foulkes, J.; Carmo-Silva, E.; Murchie, E.H. Suboptimal acclimation of photosynthesis to light in wheat canopies. Plant Physiol. 2017, 176, 1213–1246. [Google Scholar] [CrossRef]
  8. Wu, A.; Song, Y.; van Oosterom, E.J.; Hammer, G.L. Connecting Biochemical Photosynthesis Models with Crop Models to Support Crop Improvement. Front. Plant Sci. 2016, 7, 1518. [Google Scholar] [CrossRef]
  9. Lee, M.S.; Boyd, R.A.; Ort, D.R. The photosynthetic response of C3 and C4 bioenergy grass species to fluctuating light. GCB Bioenergy 2022, 14, 37–53. [Google Scholar] [CrossRef]
  10. Ye, Z.P.; Suggett, D.J.; Robakowski, P.; Kang, H.J. A mechanistic model for the photosynthesis-light response based on the photosynthetic electron transport of photosystem II in C3 and C4 species. New Phytol. 2013, 199, 110–120. [Google Scholar] [CrossRef]
  11. Kieffer, C.; Kaur, N.; Li, J.W.; Matamala, R.; Fay, P.A.; Hui, D.F. Photosynthetic responses of switchgrass to light and CO2 under different precipitation treatments. GCB Bioenergy 2024, 16, e13138. [Google Scholar] [CrossRef]
  12. Zhu, T.T.; Li, J.; Liu, Y.Y.; Tong, X.J.; Yu, Q. Leaf photosynthetic light response of summer maize: Comparison of models and analysis of parameters. Photosynthetica 2020, 58, 19–28. [Google Scholar] [CrossRef]
  13. Zheng, T.; Chen, J.; He, L.M.; Altaf Arain, M.; Thomas, S.C.; Murphy, J.G.; Geddes, J.A.; Andrew Black, T. Inverting the maximum carboxylation rate (Vcmax) from the sunlit leaf photosynthesis rate derived from measured light response curves at tower flux sites. Agric. For. Meteorol. 2017, 236, 48–66. [Google Scholar] [CrossRef]
  14. Lin, Y.; Chen, Z.; Yu, G.R.; Yang, M.; Hao, T.X.; Zhu, X.J.; Zhang, W.K.; Han, L.; Liu, Z.G.; Ma, L.X.; et al. Spatial patterns of light response parameters and their regulation on gross primary productivity in China. Agric. For. Meteorol. 2024, 345, 109833. [Google Scholar] [CrossRef]
  15. Xia, J.B.; Zhang, G.C.; Wang, R.R.; Zhang, S.Y. Effect of soil water availability on photosynthesis in Ziziphus jujuba var. spinosus in a sand habitat formed from seashells: Comparison of four models. Photosynthetica 2014, 52, 253–261. [Google Scholar] [CrossRef]
  16. Fang, L.D.; Zhang, S.Y.; Zhang, G.C.; Liu, X.; Xia, X.X.; Zhang, S.S.; Xing, W.; Fang, X.C. Application of Five Light-Response Models in the Photosynthesis of Populus × Euramericana cv. ’Zhonglin46’ Leaves. Appl. Biochem. Biotech. 2015, 176, 86–100. [Google Scholar] [CrossRef]
  17. Ye, Z.P.; Duan, S.H.; Chen, X.M.; Duan, H.L.; Gao, C.P.; Kang, H.J.; An, T.; Zhou, S.X. Quantifying light response of photosynthesis: Addressing the long-standing limitations of non-rectangular hyperbolic model. Photosynthetica 2021, 59, 185–191. [Google Scholar] [CrossRef]
  18. Gomes, F.P.; Oliva, M.A.; Mielke, M.S.; de Almeida, A.A.F.; Leite, H.G. Photosynthetic irradiance-response in leaves of dwarf coconut palm (Cocos nucifera L. ‘nana’, Arecaceae): Comparison of three models. Sci. Hortic. 2006, 109, 101–105. [Google Scholar] [CrossRef]
  19. Evers, J.B.; Vos, J.; Fournier, C.; Andrieu, B.; Chelle, M.; Struik, P.C. An architectural model of spring wheat: Evaluation of the effects of population density and shading on model parameterization and performance. Ecol. Model. 2007, 200, 308–320. [Google Scholar] [CrossRef]
  20. Ma, Y.T.; Wen, M.P.; Guo, Y.; Li, B.G.; Cournede, P.H.; De Reffye, P. Parameter Optimization and Field Validation of the Functional–Structural Model GREENLAB for Maize at different Population Densities. Ann. Bot. 2008, 101, 1185–1194. [Google Scholar] [CrossRef]
  21. Retkute, R.; Townsend, A.J.; Murchie, E.H.; Jensen, O.E.; Preston, S.P. Three-dimensional plant architecture and sunlit-shaded patterns: A stochastic model of light dynamics in canopies. Ann. Bot. 2018, 122, 291–302. [Google Scholar] [CrossRef] [PubMed]
  22. Lv, Y.P.; Xu, J.Z.; Liu, X.Y.; Wang, H.Y. Vertical profile of photosynthetic light response within rice canopy. Int. J. Biometeorol. 2020, 64, 1699–1708. [Google Scholar] [CrossRef] [PubMed]
  23. Bai, X.D.; Liu, P.C.; Cao, Z.G.; Lu, H.; Xiong, H.P.; Yang, A.P.; Cai, Z.; Wang, J.J.; Yao, J.G. Rice Plant Counting, Locating, and Sizing Method Based on High-Throughput UAV RGB Images. Plant Phenomics 2023, 5, 20. [Google Scholar] [CrossRef] [PubMed]
  24. Murchie, E.H.; Hubbart, S.; Chen, Y.Z.; Peng, S.B.; Horton, P. Acclimation of Rice Photosynthesis to Irradiance under Field Conditions. Plant Physiol. 2002, 130, 1999–2010. [Google Scholar] [CrossRef]
  25. Jin, S.H.; Wang, P.M.; Zhao, K.; Yang, Y.Q.; Yao, S.; Jiang, D.A. Characteristic of gas exchange and chlorophyll fluorescence in different position leaves at booting stage in rice plants. Rice Sci. 2004, 11, 283–289. [Google Scholar]
  26. Wang, D.; Lu, Q.; Li, X.F.; Jiang, Q.S.; Wu, J.X.; Jiang, D.A. Relationship between Rubisco activase isoform levels and photosynthetic rate in different leaf positions of rice plant. Photosynthetica 2009, 47, 621–629. [Google Scholar] [CrossRef]
  27. Hirooka, Y.; Homma, K.; Shiraiwa, T.; Kuwada, M. Parameterization of leaf growth in rice (Oryza sativa L.) utilizing a plant canopy analyzer. Field Crop Res. 2016, 186, 117–123. [Google Scholar] [CrossRef]
  28. Shi, Z.; Chang, T.G.; Chen, G.Y.; Song, Q.F.; Wang, Y.J.; Zhou, Z.W.; Wang, M.Y.; Qu, M.N.; Wang, B.S.; Zhu, X.G. Dissection of mechanisms for high yield in two elite rice cultivars. Field Crop. Res. 2019, 241, 107563. [Google Scholar] [CrossRef]
  29. Thornley, J.H.M. Dynamic model of leaf photosynthesis with acclimation to light and nitrogen. Ann. Bot-Lond. 1998, 81, 421–430. [Google Scholar] [CrossRef]
  30. Marshall, B.; Biscoe, P.V. A model for C3 leaves describing the dependence of net photosynthesis on irradiance. J. Exp. Bot. 1980, 31, 41–48. [Google Scholar] [CrossRef]
  31. Bassman, J.H.; Zwier, J.C. Gas exchange characteristics of Populus trichocarpa, Populus deltoides and Populus trichocarpa× P. deltoides clones. Tree Physiol. 1991, 8, 145–159. [Google Scholar] [CrossRef] [PubMed]
  32. Ye, Z.P. A new model for relationship between irradiance and the rate of photosynthesis in Oryza sativa. Photosynthetica 2007, 45, 637–640. [Google Scholar] [CrossRef]
  33. Glatting, G.; Kletting, P.; Reske, S.N.; Hohl, K.; Ring, C. Choosing the optimal fit function: Comparison of the Akaike information criterion and the F-test. Med. Phys. 2007, 34, 4285–4292. [Google Scholar] [CrossRef] [PubMed]
  34. Cavanaugh, J.E.; Neath, A.A. The Akaike information criterion: Background, derivation, properties, application, interpretation, and refinements. Wires. Comput. Stat. 2019, 11, e1460. [Google Scholar] [CrossRef]
  35. Modiegi, M.; Rampedi, I.T.; Tesfamichael, S.G. Comparison of multi-source satellite data for quantifying water quality parameters in a mining environment. J. Hydrol. 2020, 591, 125322. [Google Scholar] [CrossRef]
  36. Brewer, M.J.; Butler, A.; Cooksley, S.L. The relative performance of AIC, AICC and BIC in the presence of unobserved heterogeneity. Methods Ecol. Evol. 2016, 7, 679–692. [Google Scholar] [CrossRef]
  37. Li, X.; Zheng, J.C.; Yan, S.H.; Ren, C.G.; Wang, M.; Cong, W.; Sheng, J.; Zhu, P.P. Dynamics of photosynthesis in Eichhornia crassipes Solms of Jiangsu of China and their influencing factors. Afr. J. Biotechnol. 2010, 9, 7302–7311. [Google Scholar]
  38. Wang, Z.C.; Kang, S.Z.; Jensen, C.R.; Liu, F.L. Alternate partial root-zone irrigation reduces bundle-sheath cell leakage to CO2 and enhances photosynthetic capacity in maize leaves. J. Exp. Bot. 2012, 63, 1145–1153. [Google Scholar] [CrossRef]
  39. Song, X.L.; Zhou, G.S.; Xu, Z.Z.; Lv, X.M.; Wang, Y.H. A self-photoprotection mechanism helps Stipa baicalensis adapt to future climate change. Sci. Rep. 2016, 6, 25839. [Google Scholar] [CrossRef]
  40. Guo, H.N.; Wang, Y.R.; Li, G.Q.; Du, S. Effects of Rainfall Exclusion Treatment on Photosynthetic Characteristics of Black Locust in the Sub-Humid Region of the Loess Plateau, China. Plants 2024, 13, 704. [Google Scholar] [CrossRef]
  41. Li, Y.L.; Liu, X.G.; Hao, K.; Yang, Q.L.; Yang, X.Q.; Zhang, W.H.; Cong, Y. Light-response curve of photosynthesis and model fitting in leaves of Mangifera indica under different soil water conditions. Photosynthetica 2019, 57, 796–803. [Google Scholar] [CrossRef]
  42. Lv, Y.P.; Gu, L.H.; Man, R.Z.; Liu, X.Y.; Xu, J.Z. Response of stomatal conductance, transpiration, and photosynthesis to light and CO2 for rice leaves with different appearance days. Front. Plant Sci. 2024, 15, 1397948. [Google Scholar] [CrossRef] [PubMed]
  43. Lykins, S.; Scammon, K.; Lawrence, B.T.; Melgar, J.C. Photosynthetic Light Response of Floricane Leaves of Erect Blackberry Cultivars from Fruit Development into the Postharvest Period. HortScience 2021, 56, 347–351. [Google Scholar] [CrossRef]
  44. Lin, L.; Niu, Z.M.; Jiang, C.D.; Yu, L.; Wang, H.N.; Qiao, M.Y. Influences of open-central canopy on photosynthetic parameters and fruit quality of apples (Malus x domestica) in the Loess Plateau of China. Hortic. Plant J. 2022, 8, 133–142. [Google Scholar] [CrossRef]
  45. Man, R.Z.; Lu, P.X.; Parker, W.C.; Kayahara, G.J.; Dang, Q.L. Light-Use Efficiency and Photosynthetic Capacity of Northern White-Cedar (Thuja occidentalis L.) Cuttings Originated from Layering and Seed. North. J. Appl. For. 2013, 30, 53–57. [Google Scholar] [CrossRef]
  46. Fletcher, A.L.; Johnstone, P.R.; Chakwizira, E.; Brown, H.E. Radiation capture and radiation use efficiency in response to N supply for crop species with contrasting canopies. Field Crop Res. 2013, 150, 126–134. [Google Scholar] [CrossRef]
  47. Yoshinaga, S.; Takai, T.; Arai-Sanoh, Y.; Ishimaru, T.; Kondo, M. Varietal differences in sink production and grain-filling ability in recently developed high-yielding rice (Oryza sativa L.) varieties in Japan. Field Crop Res. 2013, 150, 74–82. [Google Scholar] [CrossRef]
  48. Fonseca, J.P.; Griffiths, M.; York, L.M.; Mysore, K.S. Dark Respiration Measurement from Arabidopsis Shoots. Bio-Protocol 2021, 11, e4181. [Google Scholar] [CrossRef]
  49. Francini, A.; Toscano, S.; Ferrante, A.; Romano, D. Method for selecting ornamental species for different shading intensity in urban green spaces. Front. Plant Sci. 2023, 14, 1271341. [Google Scholar] [CrossRef]
  50. Meng, H.F.; Yi, X.P.; Jiang, C.D.; Zhang, W.F.; Chow, W.S.; Zhang, Y.L. Enhanced thermal dissipation confers photoprotection in top leaves despite systemic regulation from lower leaves in cotton. J. Agron. Crop Sci. 2021, 207, 557–564. [Google Scholar] [CrossRef]
  51. Yang, J.; Gong, W.; Shi, S.; Du, L.; Sun, J.; Song, S.L. Estimation of nitrogen content based on fluorescence spectrum and principal component analysis in paddy rice. Plant Cell Environ. 2016, 62, 178–183. [Google Scholar] [CrossRef]
  52. Xu, J.Z.; Yu, Y.M.; Peng, S.Z.; Yang, S.H.; Liao, L.X. A modified nonrectangular hyperbola equation for photosynthetic light-response curves of leaves with different nitrogen status. Photosynthetica 2014, 52, 117–123. [Google Scholar] [CrossRef]
  53. Sun, J.L.; Ye, M.; Peng, S.B.; Li, Y. Nitrogen can improve the rapid response of photosynthesis to changing irradiance in rice (Oryza sativa L.) plants. Sci. Rep. 2016, 6, 31305. [Google Scholar] [CrossRef] [PubMed]
  54. Okami, M.; Kato, Y.; Yamagishi, J. Canopy Architecture and Leaf Nitrogen Distribution of Rice (Oryza sativa L.) under Chronic Soil Water Deficit. J. Agron. Crop. Sci. 2016, 202, 464–471. [Google Scholar] [CrossRef]
  55. Shirke, P.A. Leaf Photosynthesis, Dark Respiration and Fluorescence as Influenced by Leaf Age in an Evergreen Tree, Prosopis Juliflora. Photosynthetica 2001, 39, 305–311. [Google Scholar] [CrossRef]
  56. Gunasekera, H.K.L.K.; DE Costa, W.A.J.M.; Nugawela, A. Canopy Photosynthetic Capacity and Light Response Parameters of Rubber Hevea brasiliensis with Reference to Exploitation. Curr. Agri. Res. J. 2013, 1, 1–12. [Google Scholar] [CrossRef]
  57. Wan, L.; Xing, Z.; Chang, X.; Liang, L.; Zhang, G. Research on light response curve fitting model of four Chamaenerion plants on the Serzilla Mountains. Am. J. Plant Sci. 2018, 9, 1630–1645. [Google Scholar] [CrossRef]
  58. Calama, R.; Puértolas, J.; Madrigal, G.; Pardos, M. Modeling the environmental response of leaf net photosynthesis in Pinus pinea L. natural regeneration. Ecol. Model. 2013, 251, 9–21. [Google Scholar] [CrossRef]
  59. Chen, Z.Y.; Peng, Z.S.; Yang, J.; Chen, W.Y.; Ou-Yang, Z.M. A mathematical model for describing light-response curves in Nicotiana tabacum L. Photosynthetica 2011, 49, 467–471. [Google Scholar] [CrossRef]
  60. Liao, L.; Rong, Y.; Qiu, X.; Dong, T.T.; Wang, Z.H. Photosynthetic model for citrus cultivar Huangguogan. Semin.-Cienc. Agrar. 2020, 41, 61–72. [Google Scholar] [CrossRef]
  61. Fan, Z.L.; Quan, Q.M.; Li, Y.X.; Jun, Y.; Wang, S.G. Exploring the best model for describing light-response curves in two Epimedium species. Technol. Health Care 2015, 23, S9–S13. [Google Scholar] [CrossRef]
  62. Ma, X.M.; Liu, Q.; Zhang, Z.D.; Zhang, Z.W.; Zhou, Z.Y.; Jiang, Y.; Huang, X.R. Effects of photosynthetic models on the calculation results of photosynthetic response parameters in young Larix principis-rupprechtii Mayr. Plantation. PLoS ONE 2021, 16, e0261683. [Google Scholar] [CrossRef]
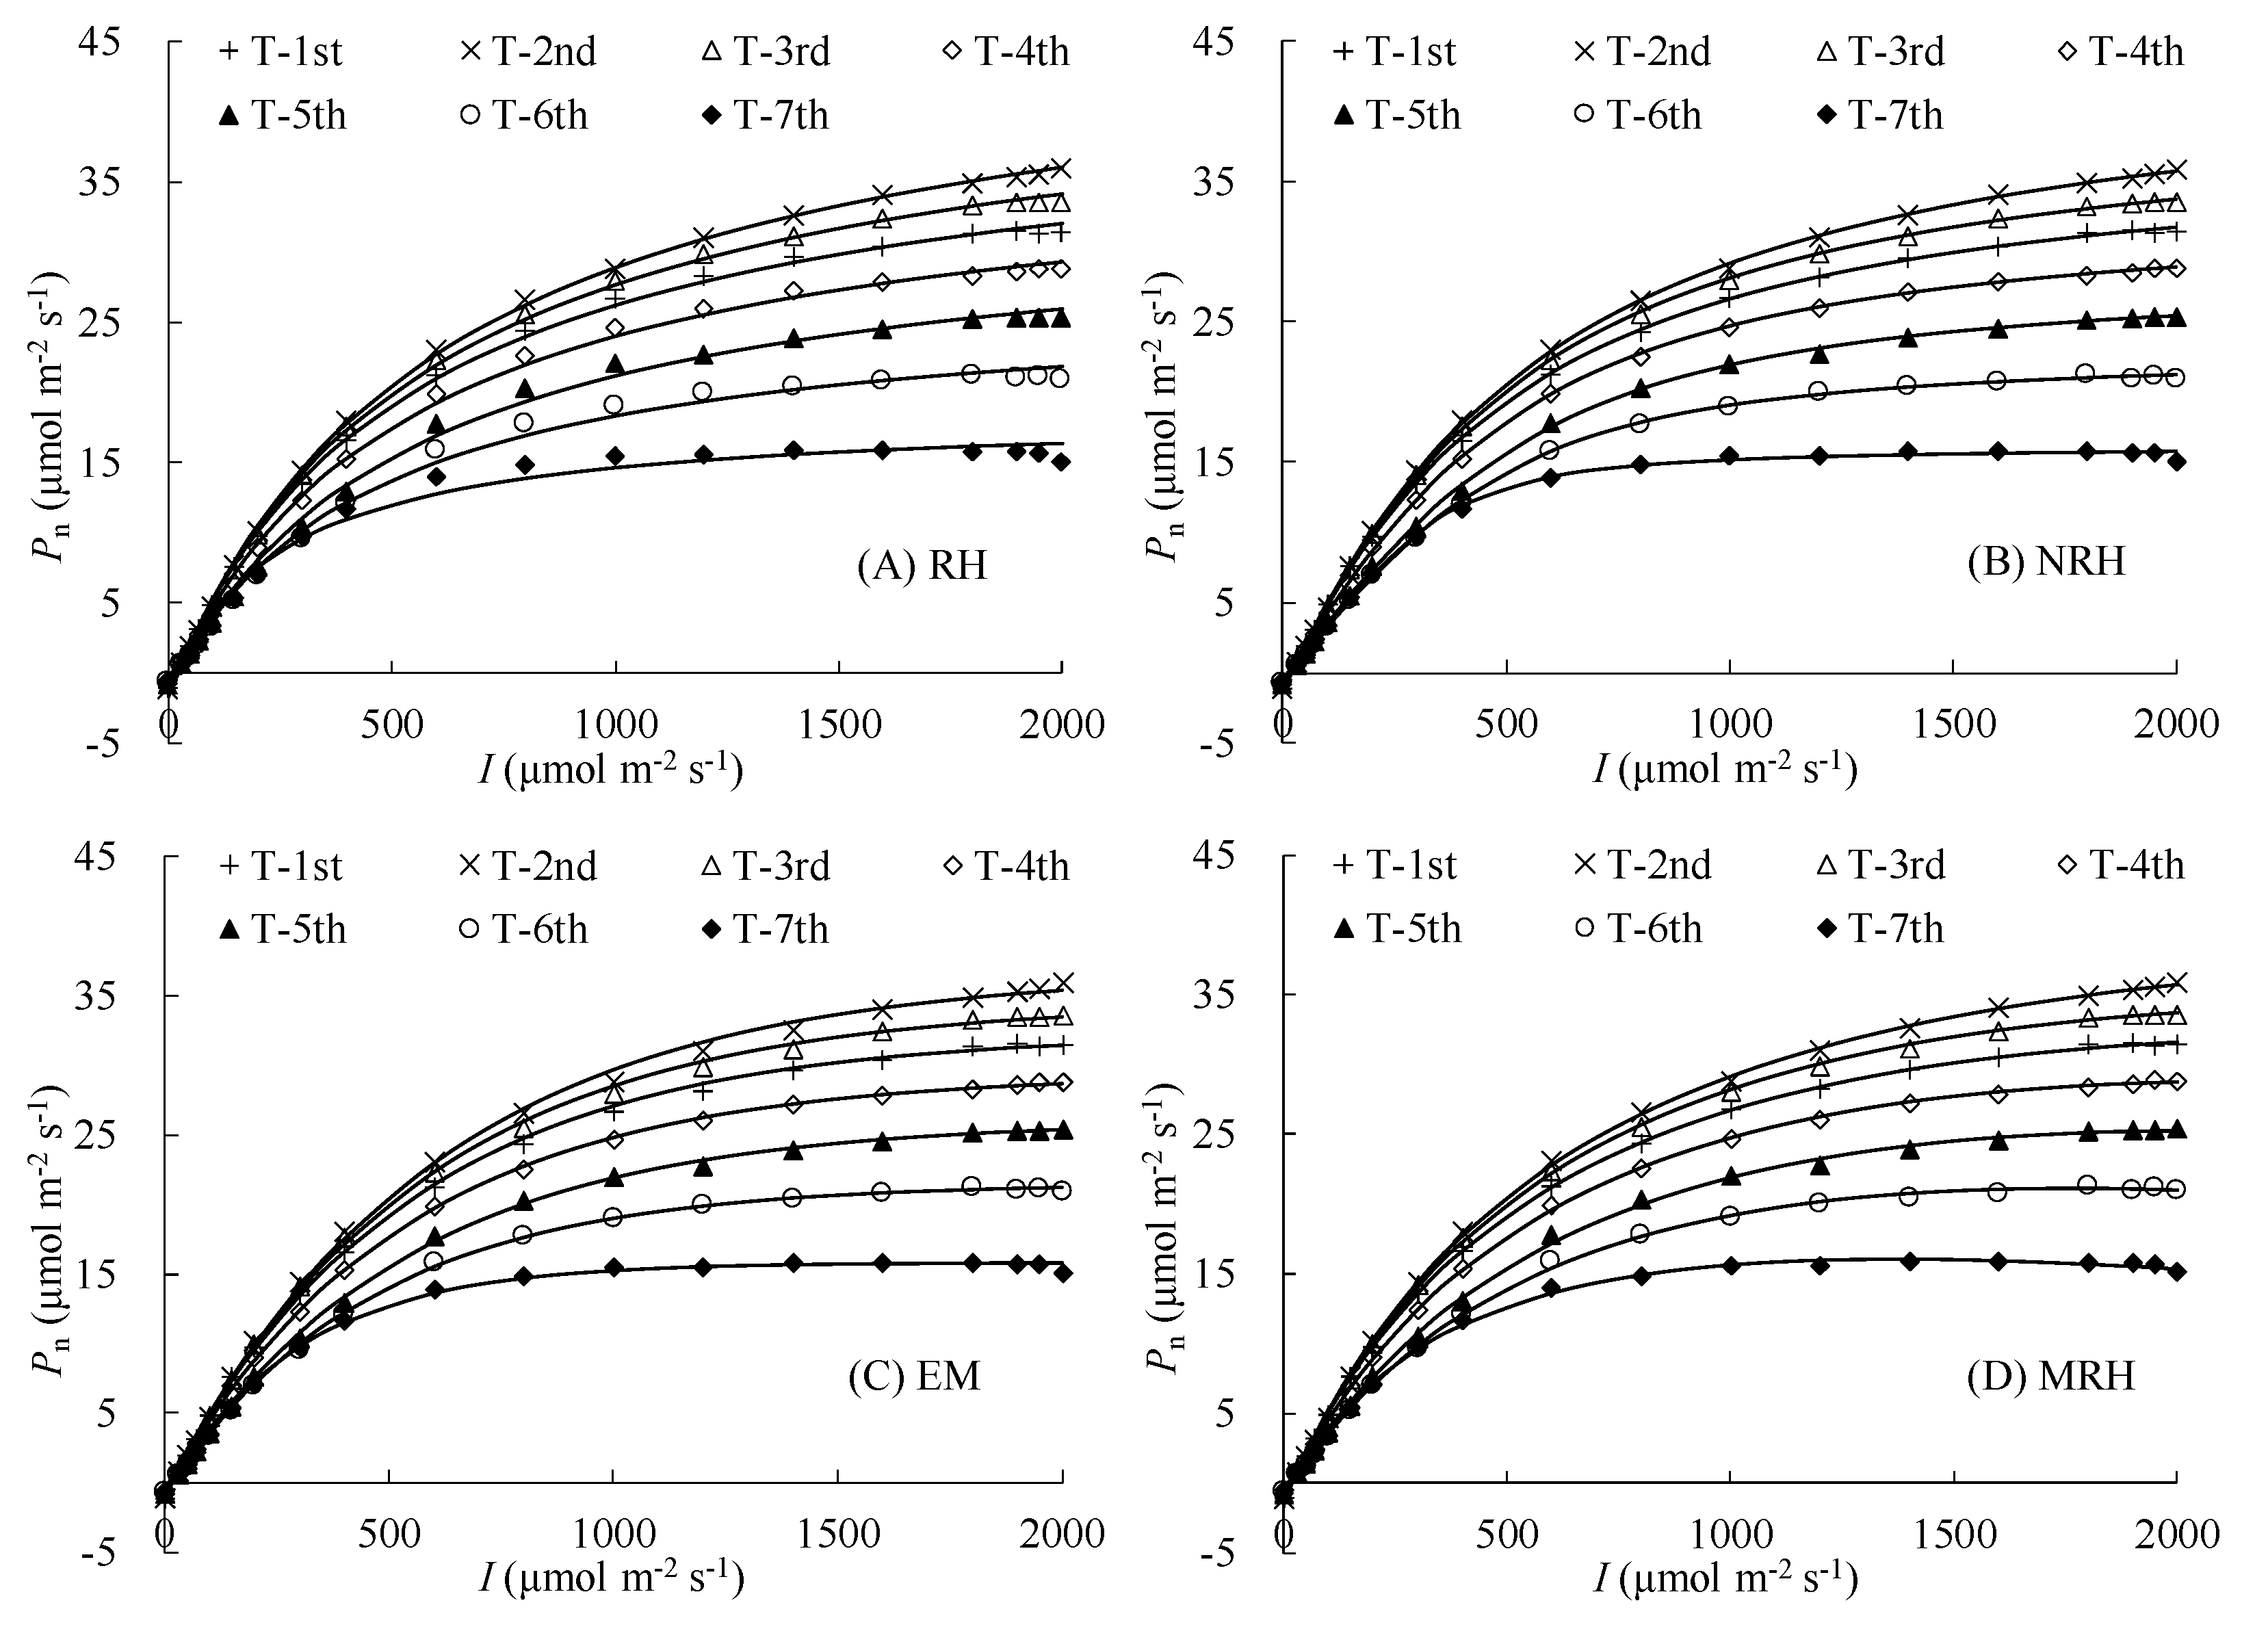
Figure 1. Net photosynthetic rate (Pn) estimated based on rectangular hyperbola model (RHM), non-rectangular hyperbola model (NRHM), exponential model (EM), and modified rectangular hyperbola model (MRHM) for rice leaves at various canopy positions under different photosynthetic photon flux density (I) conditions (T-1st, T-2nd, T-3rd, T-4th, T-5th, T-6th, and T-7th represent the top first to the top seventh leaf, respectively. Points denote average measured leaf Pn for T-1st, T-2nd, T-3rd, T-4th, T-5th, T-6th, or T-7th, and the solid lines represent the fitted Pn/I curves).
Agronomy 15 00125 g001
Figure 2. Measured maximum net photosynthetic rate Pnmax (A), apparent quantum efficiency α (B), dark respiration rate Rd (C), light compensation point LCP (D), and light saturation point LSP (E) for leaves at various canopy positions, and their estimated values based on rectangular hyperbola model (RHM), non-rectangular hyperbola model (NRHM), exponential model (EM), and modified rectangular hyperbola model (MRHM) for leaf positions (columns denote the mean of three measured or estimated parameters, bars show the standard error of the mean. T-1st, T-2nd, T-3rd, T-4th, T-5th, T-6th, and T-7th, respectively represent the top first to the top seventh leaf. Different lowercase letters indicate significant differences in measured parameters among leaf positions. For each leaf position, different uppercase letters indicate significant differences between measured and estimated parameters, as well as among estimated parameters based on different models at p < 0.05 level).
Agronomy 15 00125 g002aAgronomy 15 00125 g002b
Table 1. Performance of rectangular hyperbola model (RHM), non-rectangular hyperbola model (NRHM), exponential model (EM), and modified rectangular hyperbola model (MRHM) on estimating net photosynthetic rate for rice leaves at different leaf positions.
Leaf PositionStatisticsRHMNRHMEMMRHM
T-1stk0.99970.99990.99980.9999
RMSE0.36450.20500.28930.1880
R20.99910.99970.99940.9998
AIC1.96291.66141.03851.3148
T-2ndk0.99980.99990.99970.9999
RMSE0.29770.17910.39040.2199
R20.99950.99980.99920.9997
AIC1.15381.12142.23801.9417
T-3rdk0.99970.99990.99980.9998
RMSE0.42900.22770.33580.2816
R20.99890.99970.99930.9995
AIC2.61522.08181.63522.9314
T-4thk0.99930.99990.99980.9998
RMSE0.53600.23630.30950.2647
R20.99760.99950.99920.9994
AIC3.50552.22901.30932.6838
T-5thk0.99910.99980.99980.9997
RMSE0.53940.22680.26650.2993
R20.99700.99950.99930.9991
AIC3.53052.06490.71043.1751
T-6thk0.99830.99970.99960.9996
RMSE0.62020.27050.31310.3159
R20.99430.99890.99860.9985
AIC4.08922.77051.35453.3905
T-7thk0.99630.99950.99930.9993
RMSE0.72830.27700.32270.3202
R20.98540.99790.99720.9972
AIC4.73182.86451.47623.4450
All leavesk0.99930.99990.99970.9998
RMSE0.52080.23400.32020.2739
R20.99790.99960.99920.9994
AIC3.39072.18941.44532.8195
T-1st, T-2nd, T-3rd, T-4th, T-5th, T-6th, and T-7th represent the top first to the top seventh leaf, respectively. k, RMSE, R2, and AIC denote respectively the slopes of the linear regression between simulated and measured values, the root mean square error, coefficient of determination, and Akaike information criterion.
Disclaimer/Publisher’s Note: The statements, opinions and data contained in all publications are solely those of the individual author(s) and contributor(s) and not of MDPI and/or the editor(s). MDPI and/or the editor(s) disclaim responsibility for any injury to people or property resulting from any ideas, methods, instructions or products referred to in the content.