Abstract
Heilongjiang Province, China, is a major soybean-producing area where low temperatures in early spring and poor soil moisture retention are the main limiting factors leading to low soybean yields. To improve land productivity, this study was conducted in Heilongjiang Province, China, from 2020–2021 via a field plot trial method, where four different intertillage treatments were set up in 2020: conventional intertillage (T1), early intertillage (T2), conventional subsoiling (T3), and early subsoiling (T4). In 2021, the effects of intertillage on soil biochemical characteristics and soybean yield formation were systematically analyzed under the T5 treatment (subsoiling at the stage of full development from the fourth to the fifth compound leaf) and the T6 treatment (soil culture at the stage of full development from the fourth to the fifth compound leaf). The results of the experiment revealed that deep loosening in advance improved the chemical properties of the soil. Compared with those of the T1 treatment, the contents of the organic carbon, total nitrogen, and available phosphorus and potassium in the early subsoiling treatments (T4, T5, and T6) were significantly increased. Intertillage time and depth had a strong influence on the soil microbial characteristics. Early medium intertillage could significantly increase the species abundance of bacteria and fungi in the soil, whereas subsoiling could increase the relative abundance ratio and uniformity of the dominant species. Compared with that in the T1 treatment, the yield of soybean in the T4 treatment was significantly greater, with yield increases ranging from 18.71% to 19.36%. In summary, the intertillage measures of one deep loosening and one medium soil cultivation at the stage of full development from the fourth to the fifth compound leaf and one large soil cultivation at the stage of full development from the sixth to the seventh compound leaf can be adopted on the basis of early deep loosening 4–5 d after soybean sowing to achieve high soybean yields. The results provide a theoretical basis for increasing the yield and efficiency of soybean fields under corn–soybean rotation, as well as innovation and development of cultivation systems
1. Introduction
It is common in agricultural production to improve environmental conditions such as soil water, air, and heat to promote high soybean yields through soil tillage. While the chemical properties of soil and soybean yield change with different tillage methods, it is generally believed that traditional tillage allows the tilled soil to directly contact the air, accelerating the loss of soil organic matter, and at the same time, large-scale agricultural practices disturb high-intensity soil, which disintegrates the stable agglomerate structure [1]. Therefore, conservation tillage is essential to protect the farmland ecological environment. At present, tillage methods such as no tillage, tilling, rotary tillage, deep loosening, and combinations of various technical measures have become the main research objects in recent years [2].
Scholars at home and abroad have generally affirmed the ability of conservation tillage to improve soil biochemical characteristics [3,4]. Intertillage is an effective method for improving the soil microenvironment [5,6,7]. Intertillage is a tillage measure used to loosen the topsoil layer and turn over the tilled soil during crop growth and development, which is an important part of high-yield soybean cultivation technology. At present, in the process of soybean cultivation, the method of medium tillage is mainly based on soil cultivation and deep pine, and soil cultivation can play an ANT-inversion role and promote the development of the soybean root system. Deep pine can break the subsoil layer of the plow, build a combination of real and virtual tillage structures, accelerate rain infiltration, and improve the ability of the soil to store water and retain moisture, resulting in long-term effects [8].
Appropriate soil physical and chemical properties are necessary for high soybean yields and are closely related to soil chemical properties (pH, nutrient content, etc.) and biological activities [9,10,11]. Different tillage methods also affect microbial growth and reproduction by changing the soil structure and the soil environment. Zhang et al. [12] studied the effects of subsoiling on the functional diversity of soil microbial communities and reported that subsoiling significantly increased the number of microorganisms and the microbial diversity index of soil. Li et al. [13] also reported that subsoiling treatment could increase the Shannon index of bacteria and fungi and that bacteria and archaea increased by 0.3% and 40.5%, respectively, compared with those in the control treatment, and subsoiling mulch could also increase the carbon and nitrogen contents of particulate organic matter in soil.
At present, scholars at home and abroad have carried out many studies on the effects of different intertillage measures on soil and crop growth and have also verified that there is a significant correlation between soil physicochemical and biological properties and crop yields [14]; however, the effects of time and depth of intertillage on the soil chemical and microbial traits of soybean fields still need to be explored in depth [15]. The research hypothesis is that tillage measures can improve soil chemistry, increase soil microbial diversity, and increase soybean yield and quality. On the basis of this hypothesis, this study aimed to address problems such as low soil temperature, poor soil moisture retention and slow increases in soybean yield due to the long-term use of traditional tillage measures in the main soybean-producing areas of Heilongjiang Province. In this study, the effects of tillage time and depth on soil chemical properties, microbial characteristics and soybean yield formation in different years were analyzed on the basis of long-term tilling location tests of a soybean rotation system, so as to achieve the effect of increasing soybean production and improving soil.
2. Materials and Methods
2.1. Overview of the Experimental Site
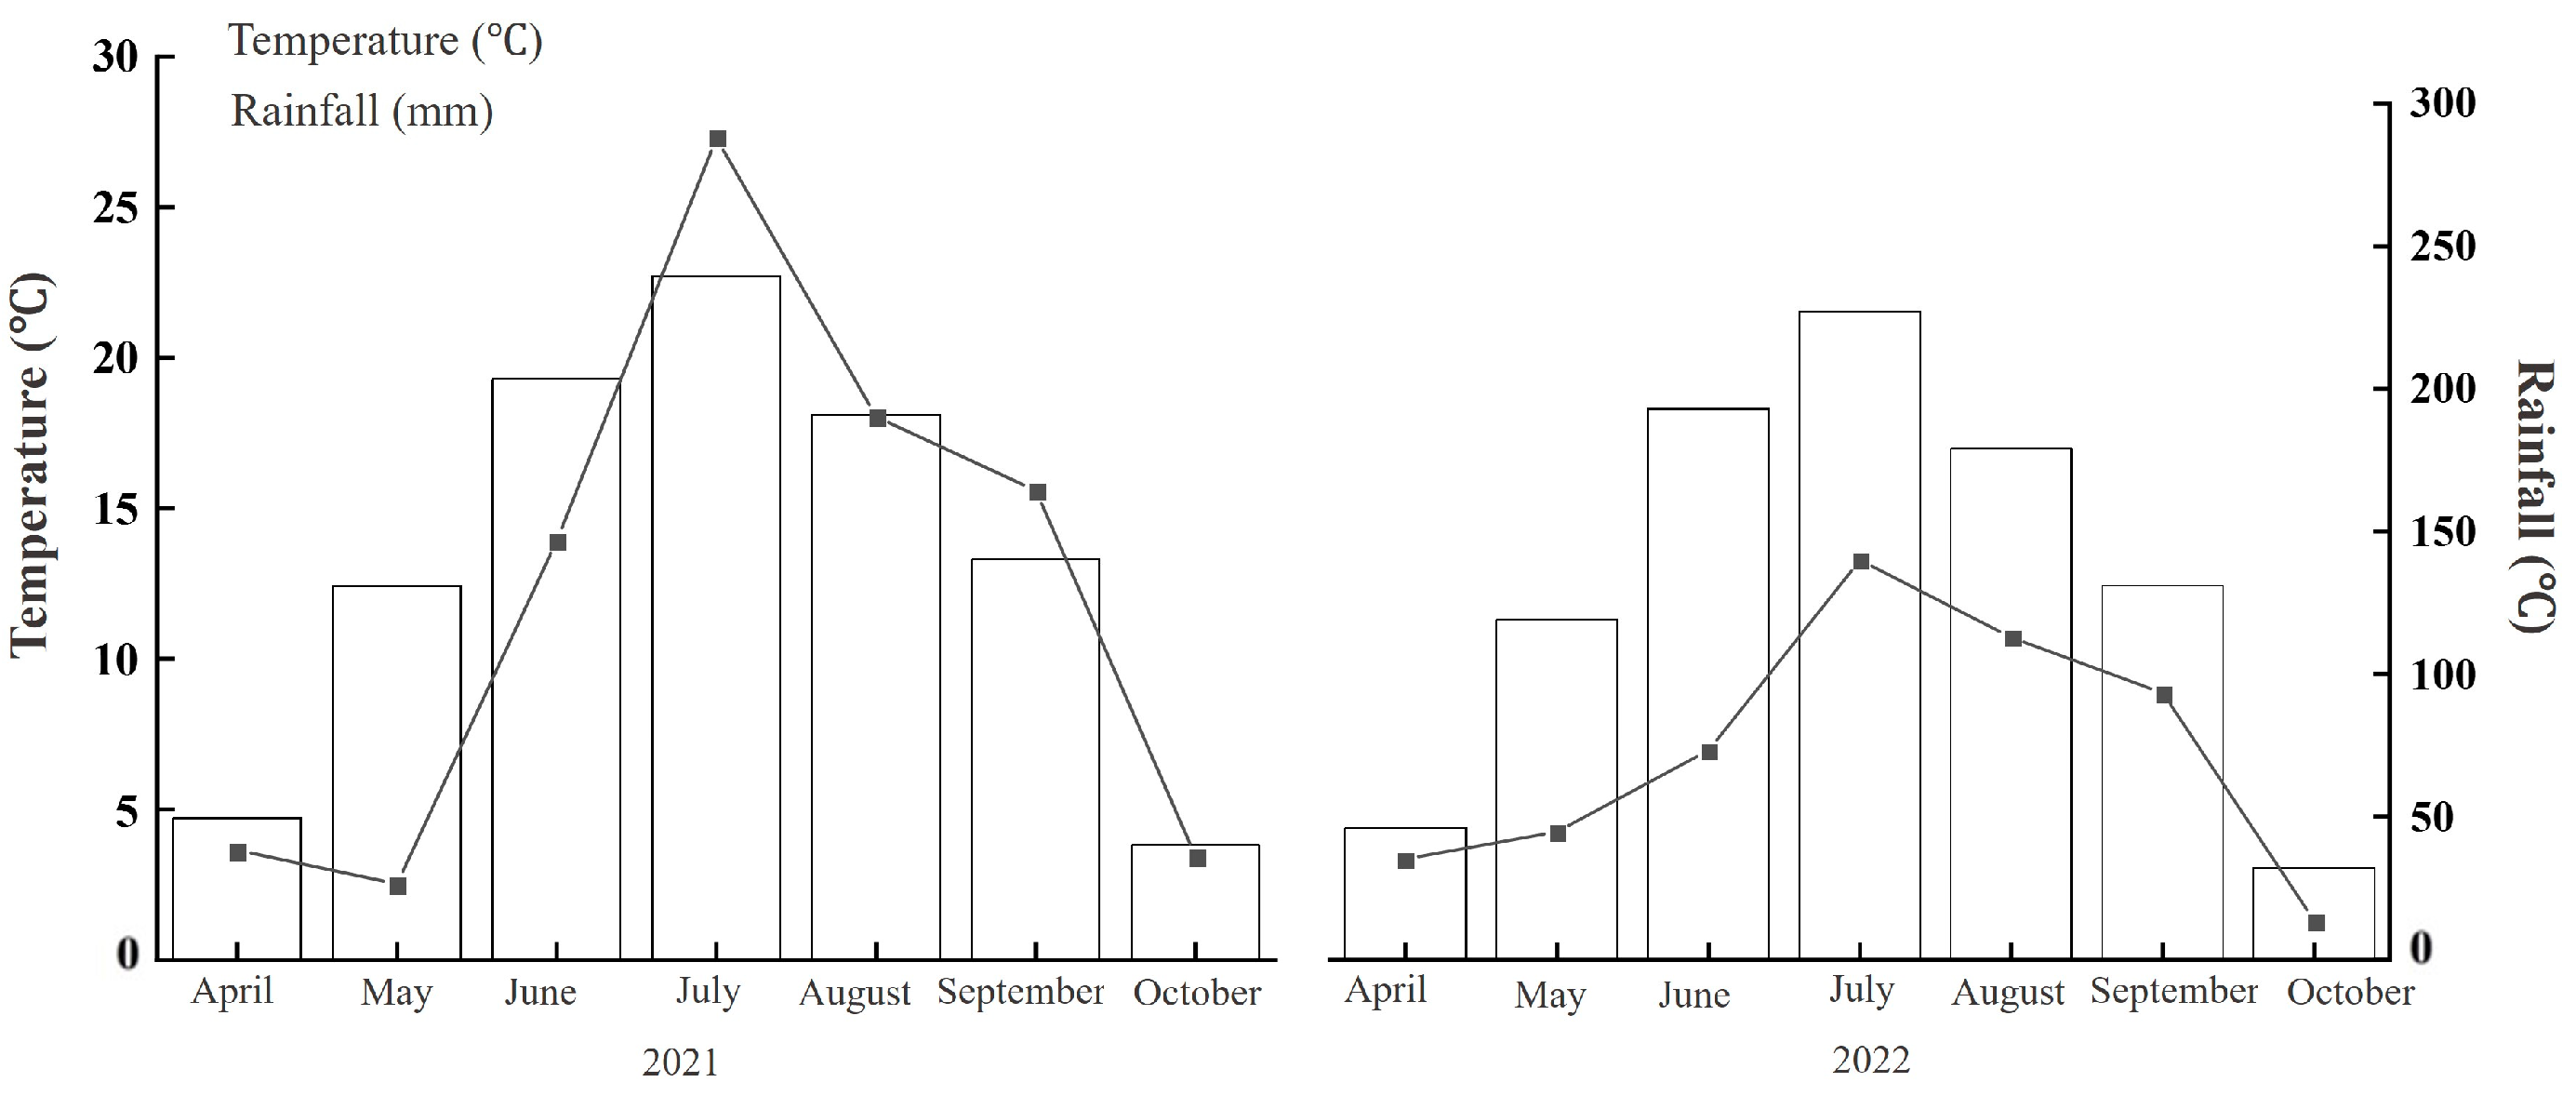
The experimental site is located at Heshan Farm, Beidahuang Group, Heilongjiang Province, China, at latitude 48°43′–49°03′ N and longitude 124°56′–126°21′ E. It has a cold–temperate continental climate, with an annual average temperature of 13 °C, an annual effective cumulative temperature ranging from 1100 °C to 1300 °C, an annual average number of hours of sunshine amounting to 2429.3 h, an annual average rainfall of 601.1 mm, and an average annual frost-free period of 119 day. The local average temperature and rainfall from April to October 2020 and 2021 are shown in Figure 1. The soil type of the test field was black soil, and the basic physical and chemical properties of the soil in the 0–20 cm layer before the test are shown in Table 1.
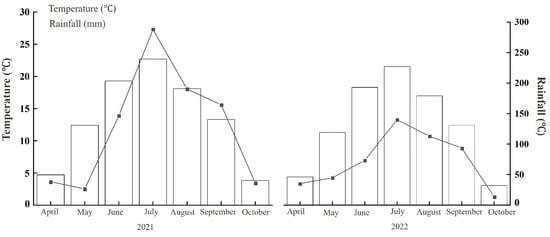
Figure 1.
Temperature and rainfall in 2020 and 2021.

Table 1.
Basic chemical properties of the 0–20 cm surface soil before the experiment.
2.2. Test Materials
The test variety of this experiment was the local main cultivar Heihe 43. Heihe 43 has a sub-limited podding habit and is planted in the adaptation area (effective cumulative temperature above 22 °C), with seedling emergence to maturity fertility days of approximately 115 days.
The tested fertilizer components in this experiment were urea (nitrogen content ≥46%), diammonium phosphate (nitrogen content ≥ 18%, P2O5 ≥ 46%), and potassium sulfate (K2O ≥ 50%).
2.3. Experimental Design
In this study, fields with previous crops of soybean and corn (corn–soybean rotation plots) were selected in 2017 to plant corn and soybean, respectively, and corn–soybean rotation planting started in 2018. Research on the soil chemical properties and microbial traits of soybean fields was carried out in 2020 and 2021.
The experiment was conducted in 2019 and 2020 and included harrowing and ridging after fall tilling, compaction in early spring to increase moisture, sowing on 9 May 2020, harvesting on 12 October, sowing on 6 May 2021, and harvesting on 30 September. The previous crop at the experimental site was corn, and the fertilizer application was consistent with the local fertilization level, with 54 kg·hm−2 of N fertilizer, 67.5 kg·hm−2 of P2O5, and 30 kg·hm−2 of K2O, and the other field management practices were the same as those used for local production.
2.3.1. Experimental Design in 2020
In 2020, a one-way randomized block design was adopted, and four intertillage treatments were set up as follows (Table 2): (1) conventional intertillage (T1), one small soil cultivation was carried out from the soybean growth stage to the V2–V3 stage (the stage of full development from the second segment to the third segment), one medium soil cultivation was carried out from the V4–V5 stage (the stage of full development from the fourth to the fifth compound leaf), and one large soil cultivation was carried out from the V6–V7 stage (the stage of full development from the sixth to the seventh compound leaf); (2) early intertillage (T2), one small soil cultivation from 4 to 5 d after soybean sowing, one large soil cultivation from the V4–V5 period, and one large soil cultivation from the V6–V7 period; and (3) conventional subsoiling (T3), one deep loosening (depth of 25%) from the period of soybean growth to the V2–V3 period. Then, 1 case of deep loosening (depth of 25–30 cm) occurred during the period of V4–V5, as well as 1 case of deep loosening (depth of 30–35 cm) and 1 case of medium soil cultivation, and, during the period of V6–V7, 1 case of large soil cultivation occurred. Another case of early subsoiling (T4), one case of deep loosening (depth of 25–30 cm) was carried out 4–5 d after soybean sowing, one case of deep loosening (depth of 30–35 cm), and one case of medium soil cultivation was carried out during V4–V5, and one case of large soil cultivation was carried out during V6–V7.
Table 2.
Experimental treatment in 2020.
The row length of each treatment was 30 m, with an 8-row zone, the width of the row was 65 cm, and the plot area was 156 m2, with 3 replications.
2.3.2. Design of the 2021 Trial
An analysis of the results of the 2020 experiment revealed that adjusting the time and depth of intertillage improved the soil temperature, humidity, and nutrient conditions and promoted the growth and development of soybeans. Therefore, to ensure the rigor of the experiment and to further explore the differences between deep loosening and cultivation, as well as the response of the basic soil structure to the time and depth of intertillage, the design of 2021 was supplemented with six intertillage treatments on the basis of the design of 2020, with refinement and validation of the experimental findings, as detailed in Table 3.
Table 3.
Experimental treatment in 2021.
2.4. Measurement Items and Methods
The five-point sampling method was as follows: in the soybean V5–R8 period in each plot, the 0–20 till layer of soil was collected, fresh soil samples were completely mixed, the plant stubble and root system were manually removed, and some of the fresh soil samples were spread on A4 paper, placed in an indoor air-drying sieve, and put into a sealing bag placed in a 4 °C refrigerator to determine the soil microbial characteristics of the soil samples stored at −80 °C.
2.4.1. Determination of Soil Chemical Properties
The soil pH was determined via the potentiometric method, the conductivity was determined via the electrode method, and the soil samples were selected from R8 stage soil, with three replications for each treatment. Soil cation exchange was determined via the hexachloroammonium cobalt trichloride leaching–spectrophotometric method, and the soil samples were selected as R8 phase soil, with three replications for each treatment. The detailed methods can be found in the third edition of Soil Sampling and Methods of Analysis by Carter (2007) [16].
The soil organic carbon content was determined via the potassium dichromate external heating method; the total nitrogen content was determined via the Kjeldahl nitrogen determination method; the available phosphorus and available potassium contents were determined via the molybdenum–antimony colorimetric method and the ammonium acetate leaching–flame photometric method, respectively [17]; the soil samples were selected from the R8 phase soils for the determination of soil samples in 2020; and the soil samples were selected from the V5–R8 phase soils for the determination of soil samples in 2021, with three replications for each treatment.
2.4.2. Soil Microbial Characterization
Soil samples from the R8 phase (soybean ripening period) were sent to Biomarker Technologies (Beijing, China) for high-throughput sequencing of soil microorganisms via the Illumina NovaSeq platform and paired-end sequencing method to construct small fragment libraries. After the total DNA of the samples was extracted, the primers were designed according to the conserved regions, and the sequencing connector was added at the end of the primers. PCR amplification was carried out, and the libraries that passed the quality control were sequenced via Illumina NovaSeq 6000 (Illumina, San Diego, CA, USA). High-quality sequences were subjected to clustering/denoising, the OTUs/ASVs were divided into OTUs/ASVs (features), and the species classification was obtained on the basis of the composition of feature sequences. On the basis of the results of feature analysis, the samples were analyzed taxonomically at each taxonomic level to obtain the community structure and species clustering of each sample at the phylum, order, phylum, family, and genus taxonomic levels; the species diversity within individual samples was investigated via alpha diversity analysis and the Ace, Chao1, Shannon, and Simpson indices; and beta diversity analysis was used to compare the magnitude of differences in microbial community structure among different samples.
2.4.3. Measurement of Soybean Yield and Yield Components
Yield measurement was carried out after soybean maturity, and a representative 2 m2 of each treatment was randomly selected for seed testing and yield measurement to determine the number of pods per plant, the number of grains per plant, and the weight of one hundred grains. The moisture content of the seeds was determined by using a PM-8188-A Grain Moisture Meter (Kett Kett Co., Kyoto, Japan), and the soybean seed yield was converted to 13.5% moisture content for all 2 years. The harvested kernels were taken to determine the soybean protein content via GB/T 24870-2010 [18], “Grain and Oil Test soybean crude protein, crude fat content determination via the near infrared method”.
2.5. Data Processing
Excel 2010 was used for data processing and calculations, ANOVA and significance analysis (p < 0.05) were performed via SPSS 22.0 software, multiple comparisons were performed via Duncan’s method, and the results were plotted via Origin 2021.
3. Results
3.1. Effects of Different Intertillage Measures on Soil Chemical Properties
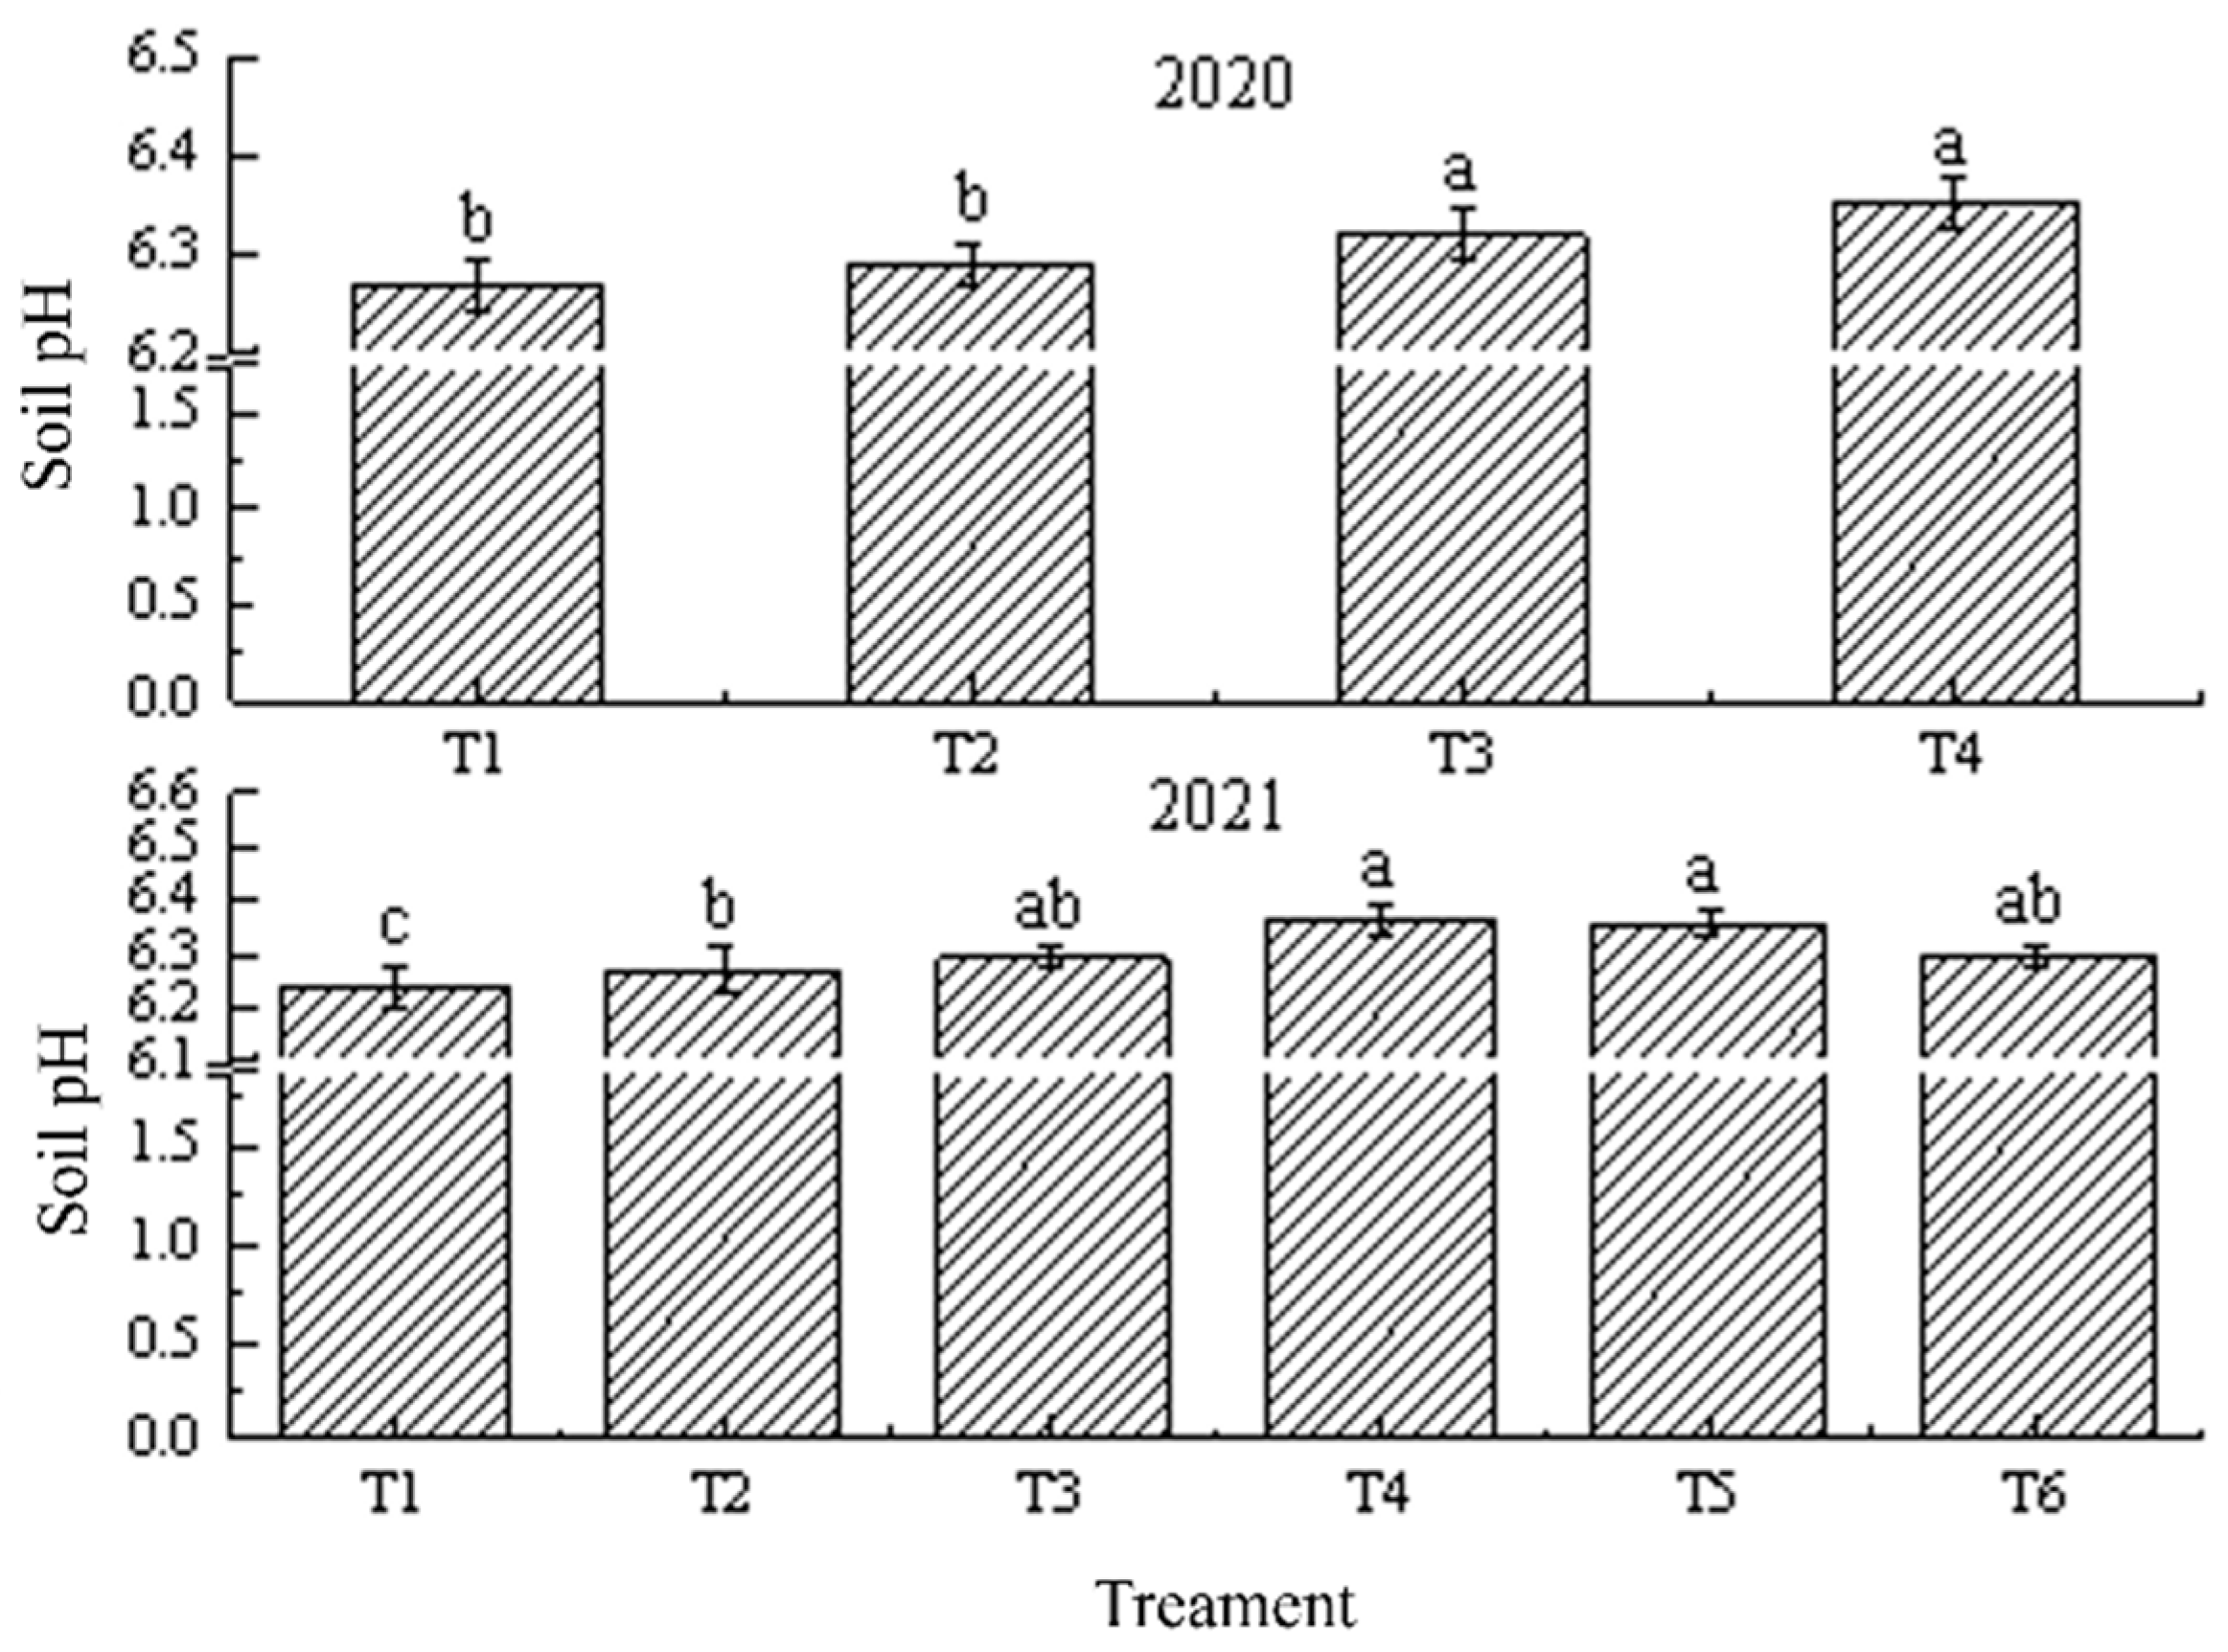
As shown in Figure 2, in 2020, the soil pH of the deep pine treatments (T3 and T4) was greater than that of the soil cultivation treatments (T1 and T2), reaching a significant difference (p < 0.05); increasing the time of intertillage also increased the soil pH. The results of 2021 were in line with those of 2020, and under the same intertillage time, the soil pH of the T4 and T5 treatments was significantly greater than that of the T2 treatment (p < 0.05). Under the same depth of intertillage, the soil pH of the T2 treatment was significantly greater than that of the T1 treatment (p < 0.05), and the pH of the T5 treatment was slightly greater than that of the T6 treatment. These findings indicate that the depth of the tillage layer has a greater effect on the soil pH and that deepening the tillage layer can increase the soil pH to a certain extent.
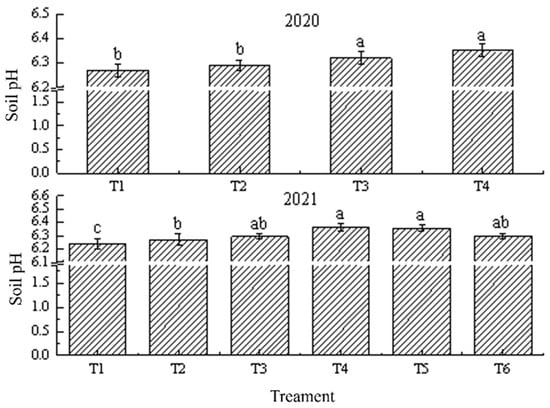
Figure 2.
Effects of different intertillage measures on soil pH. T1: During the V2–V3 stage, little earth is present; during the V4–V5 stage, a medium quantity of earth is present; and during the V6–V7 stage, a considerable quantity of earth is present. T2: During the 4–5 days after the broadcast, a small quantity of earth is present; during the V4–V5 stage, a medium quantity of earth is present; and during the V6–V7 stage, a considerable quantity of earth is present. T3: During the V2–V3 stage, subsoiling was performed at depths of 25–30 cm; during the V4–V5 stage, subsoiling was performed at depths of 30–35 cm, and a moderate quantity of earthing-up occurred; and during the V6–V7 stage, a considerable quantity of earthing-up occurred. T4: During the 4–5 days after broadcast, subsoiling was performed at depths of 25–30 cm; during the V4–V5 stage, subsoiling was performed at depths of 30–35 cm, and a medium quantity of earthing-up occurred; and during the V6–V7 stage, considerable quantities of earthing-up occurred. T5: During the 4–5 days after broadcast, subsoiling was performed at depths of 25–30 cm; during the V4–V5 stage, subsoiling was performed at depths of 30–35 cm; and during the V6–V7 stage, considerable quantities of earthing-up occurred. T6: During the 4–5 days after broadcast, subsoiling is performed at depths of 25–30 cm; during the V4–V5 stage, a medium quantity of earth is present; and during the V6–V7 stage, a considerable quantity of earth is present. Note: Different lowercase letters indicate significant differences between treatments (p < 0.05).
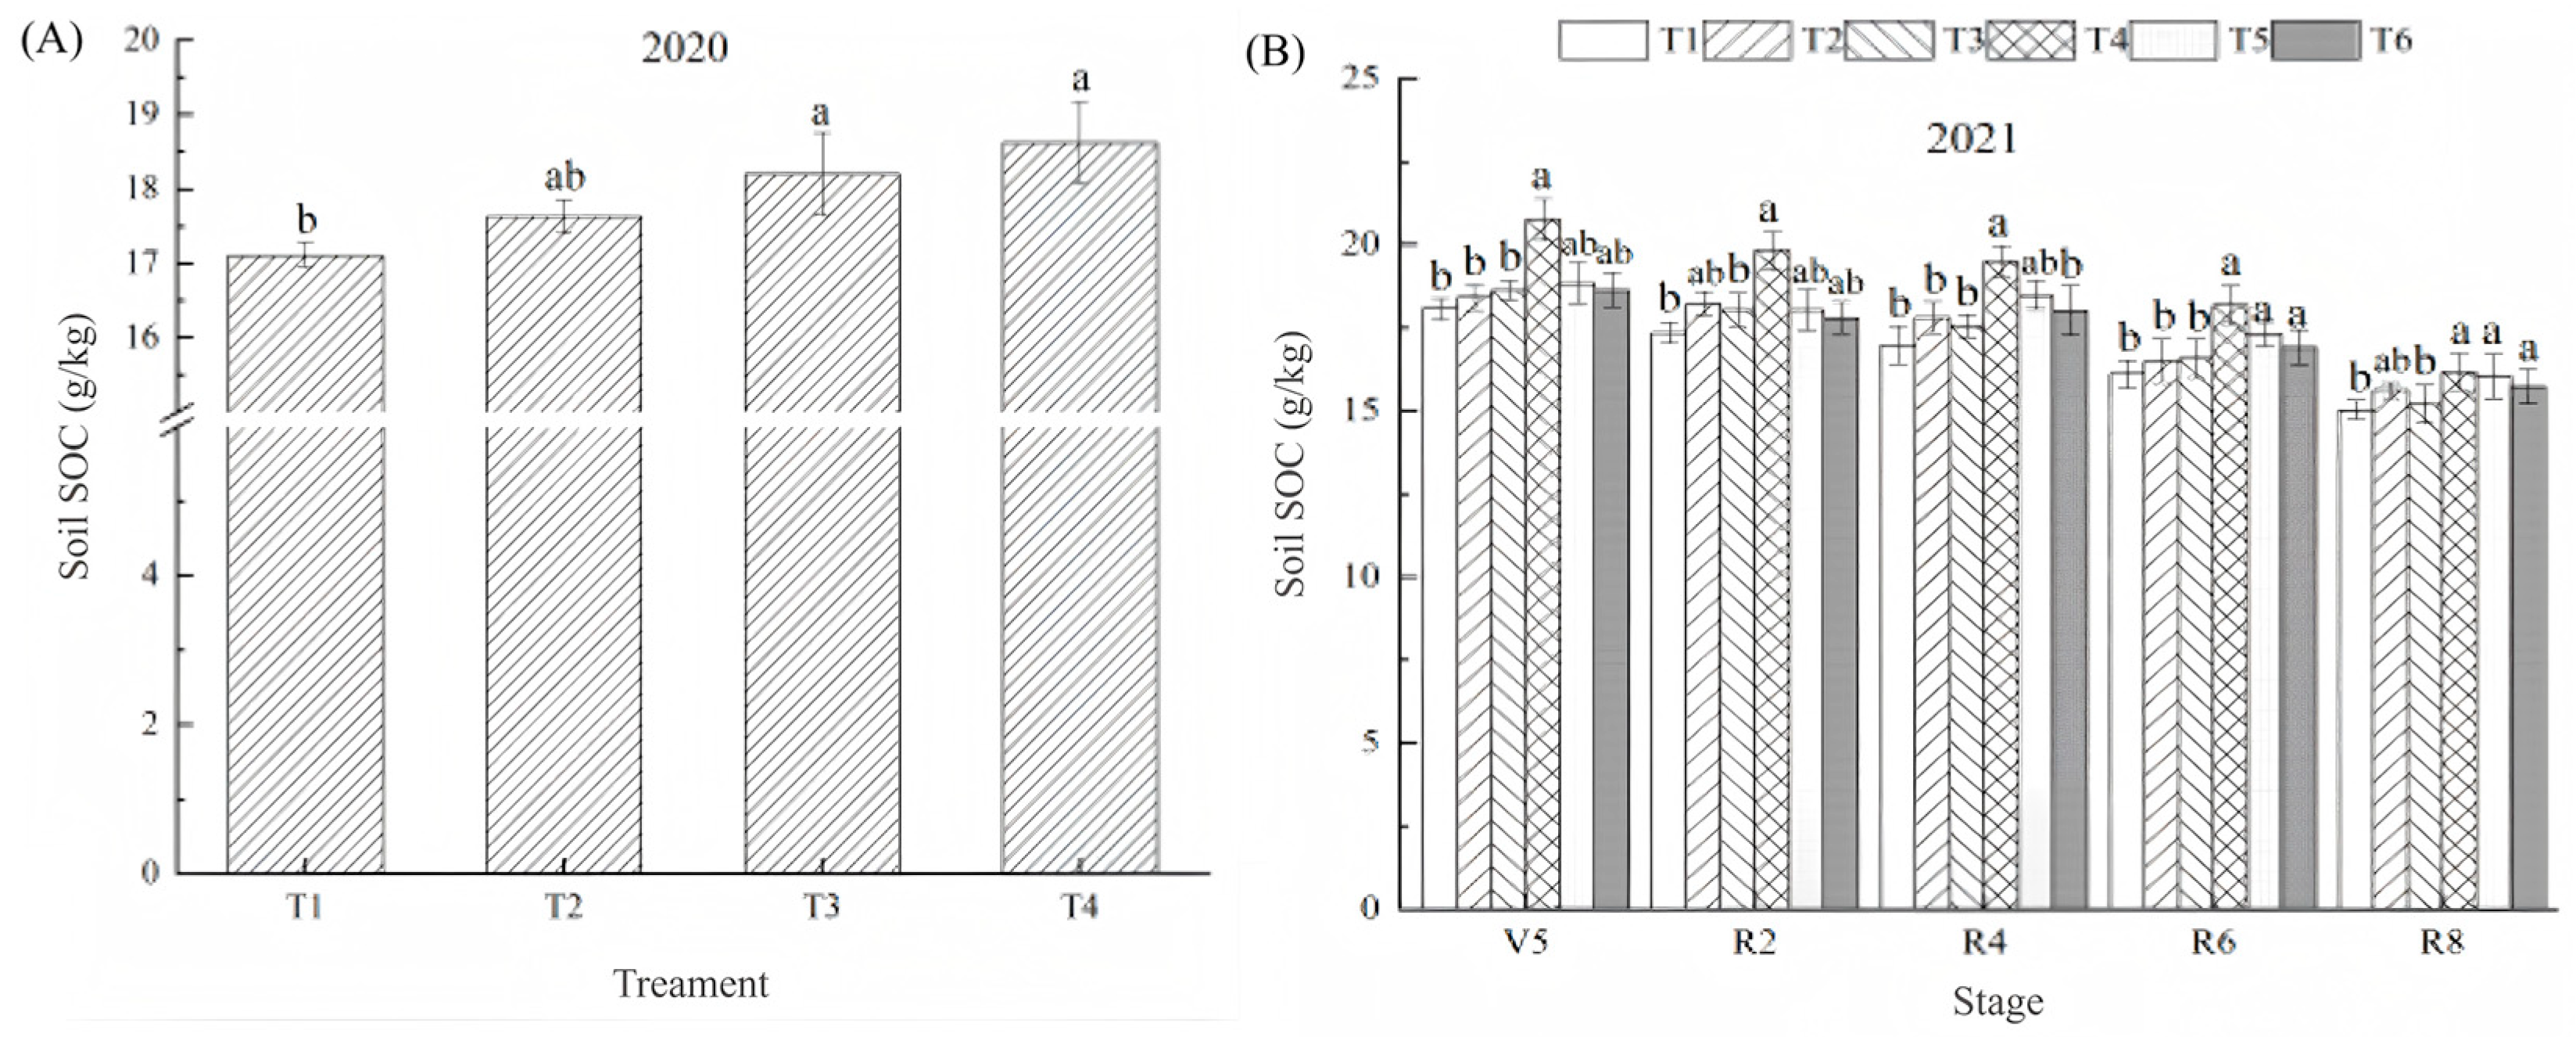
Compared with those in the T1 treatment, the soil organic carbon contents in the T2, T3, and T4 treatments increased by 3.04%, 6.37%, and 8.83%, respectively, in 2020 (p < 0.05). To explore the effects of different intertillage methods on the soil organic carbon content of soybean during the entire reproductive period, the soil organic carbon content of each treatment was studied in 2021 during the V5–R8 period (Figure 3B), and the results revealed that the soil organic carbon content gradually decreased as the reproductive period progressed. Under the same medium tillage time, the soil organic carbon content of the T1 treatment was lower than that of the T3 treatment during the whole fertility period, and the soil organic carbon content of the T4 treatment during the V5–R4 period was significantly greater than that of the T2 treatment by 12.71%, 8.78%, and 9.43%, respectively (p < 0.05); the soil organic carbon contents of the T4, T5, and T6 treatments during the R6 period were significantly greater than those of the T2 treatment, with increases of 10.18%, 4.91%, and 4.42% (p < 0.05), respectively. Under the same mesocosm depth, the organic carbon content of the T5 treatment was slightly greater than that of the T6 treatment. During the V5–R4 period, the organic carbon content of the T4 treatment was significantly greater than that of the T3 treatment by 9.43–11.44% (p < 0.05), and that of the T3 treatment was close to that of the T5 and T6 treatments. During the R6–R8 period, the organic carbon contents of the T4, T5, and T6 treatments were close to that of the T3 treatment, and that of the R6–R8 treatment was significantly greater than that of the T3 treatment compared with the T3 treatment. During the R6–R8 period, the organic carbon contents of T4, T5, and T6 significantly increased (p < 0.05) compared with those of T3, with the T4 treatment resulting in the greatest increase of 6.38% to 19.17%.
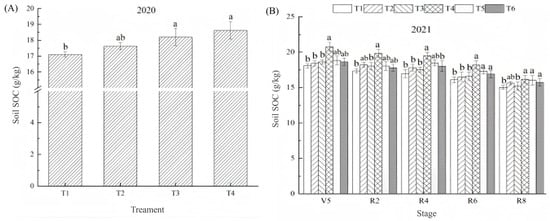
Figure 3.
(A) In 2021, effects of different intertillage measures on soil SOC; (B) In 2022, effects of different intertillage measures on soil SOC. T1: During the V2–V3 stage, little earthing-up occurred; during the V4–V5 stage, a medium quantity of earthing-up occurred; and during the V6–V7 stage, a considerable quantity of earthing-up occurred. T2: During the 4–5 days after the broadcast, a small quantity of earth is present; during the V4–V5 stage, a medium quantity of earth is present; and during the V6–V7 stage, a considerable quantity of earth is present. T3: During the V2–V3 stage, subsoiling was performed at depths of 25–30 cm; during the V4–V5 stage, subsoiling was performed at depths of 30–35 cm, and a moderate quantity of earthing-up occurred; and during the V6–V7 stage, a considerable quantity of earthing-up occurred. T4: During the 4–5 days after broadcast, subsoiling was performed at depths of 25–30 cm; during the V4–V5 stage, subsoiling was performed at depths of 30–35 cm, and a medium quantity of earthing-up occurred; and during the V6–V7 stage, considerable quantities of earthing-up occurred. T5: During the 4–5 days after broadcast, subsoiling was performed at depths of 25–30 cm; during the V4–V5 stage, subsoiling was performed at depths of 30–35 cm; and during the V6–V7 stage, considerable quantities of earthing-up occurred. T6: During the 4–5 days after broadcast, subsoiling is performed at depths of 25–30 cm; during the V4–V5 stage, a medium quantity of earth is present; and during the V6–V7 stage, a considerable quantity of earth is present. Note: Different lowercase letters indicate significant differences between treatments (p < 0.05).
Overall, the organic carbon content was greater in the early deep loosening treatments (T4, T5, and T6), was highest in the T4 treatment, and there was no significant difference in the organic carbon content among the T1, T2, and T3 treatments. The soil organic carbon content of the whole soybean reproductive period is determined mainly in the early stage of soybean fertility, and changing only the time or depth of intertillage has a certain promoting effect on the increase in the soil organic carbon content. Early subsoiling and the combination of subsoiling and cultivation of intertillage measures in the period of V4–V5 are conducive to increasing the soil organic carbon content.
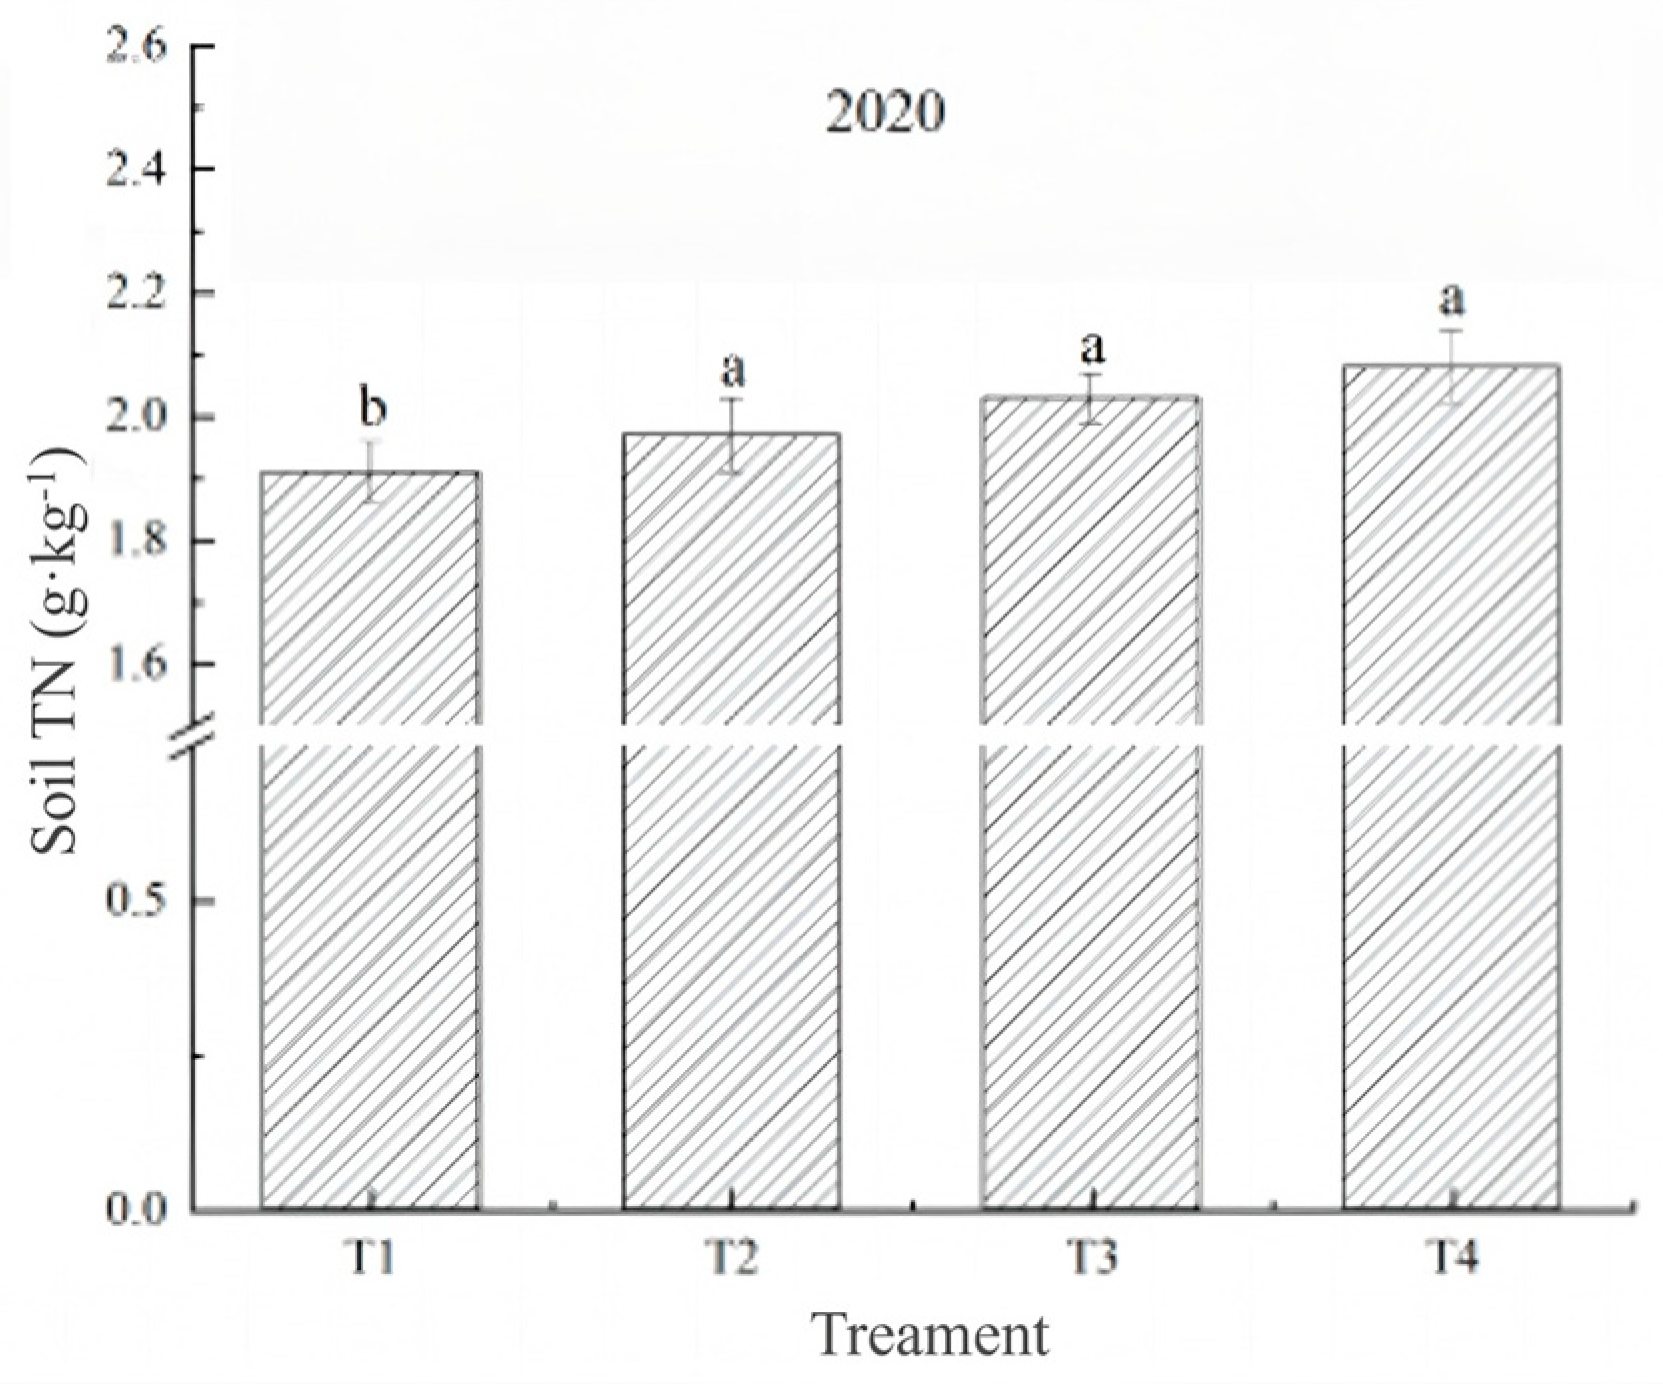
As shown in Figure 4, the soil total nitrogen content and soil organic carbon content of each treatment were similar in 2020, and compared with those of the T1 treatment, the soil total nitrogen contents of the T2, T3, and T4 treatments increased by 3.14%, 6.28%, and 8.90%, respectively, which were significantly different (p < 0.05). The soil total nitrogen content of the T4 treatment was greater than that of the T3 treatment, but the difference was not significant, which indicated that the depth of the intertillage had more obvious effects on the soil. The effect of intertillage depth on soil total nitrogen was more obvious, and when the depth of intertillage was the same, the tillage layer of cultivated soil was shallower, and the time of intertillage advancement had a greater effect on the soil total nitrogen content.
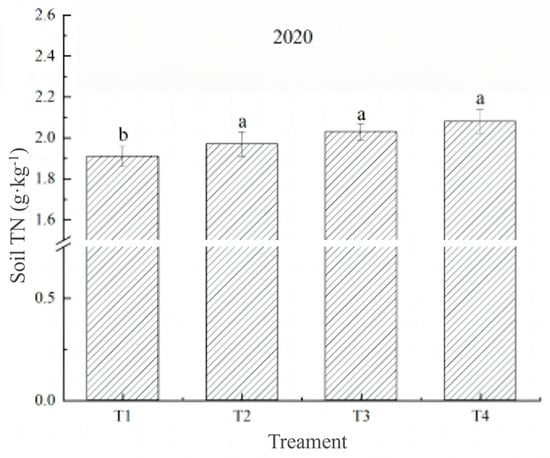
Figure 4.
Effects of different intertillage measures on soil nitrogen (2020). T1: During the V2–V3 stage, little earthing-up occurred; during the V4–V5 stage, a medium quantity of earth-up occurred; and during the V6–V7 stage, a considerable quantity of earth-up occurred. T2: During the 4–5 days after the broadcast, a small quantity of earth is present; during the V4–V5 stage, a medium quantity of earth is present; and during the V6–V7 stage, a considerable quantity of earth is present. T3: During the V2–V3 stage, subsoiling was performed at depths of 25–30 cm; during the V4–V5 stage, subsoiling was performed at depths of 30–35 cm, and a moderate quantity of earthing-up occurred; and during the V6–V7 stage, a considerable quantity of earthing-up occurred. T4: During the 4–5 days after broadcast, subsoiling was performed at depths of 25–30 cm; during the V4–V5 stage, subsoiling was performed at depths of 30–35 cm, and a medium quantity of earthing-up occurred; and during the V6–V7 stage, considerable quantities of earthing-up occurred. Note: Different lowercase letters indicate significant differences between treatments (p < 0.05).
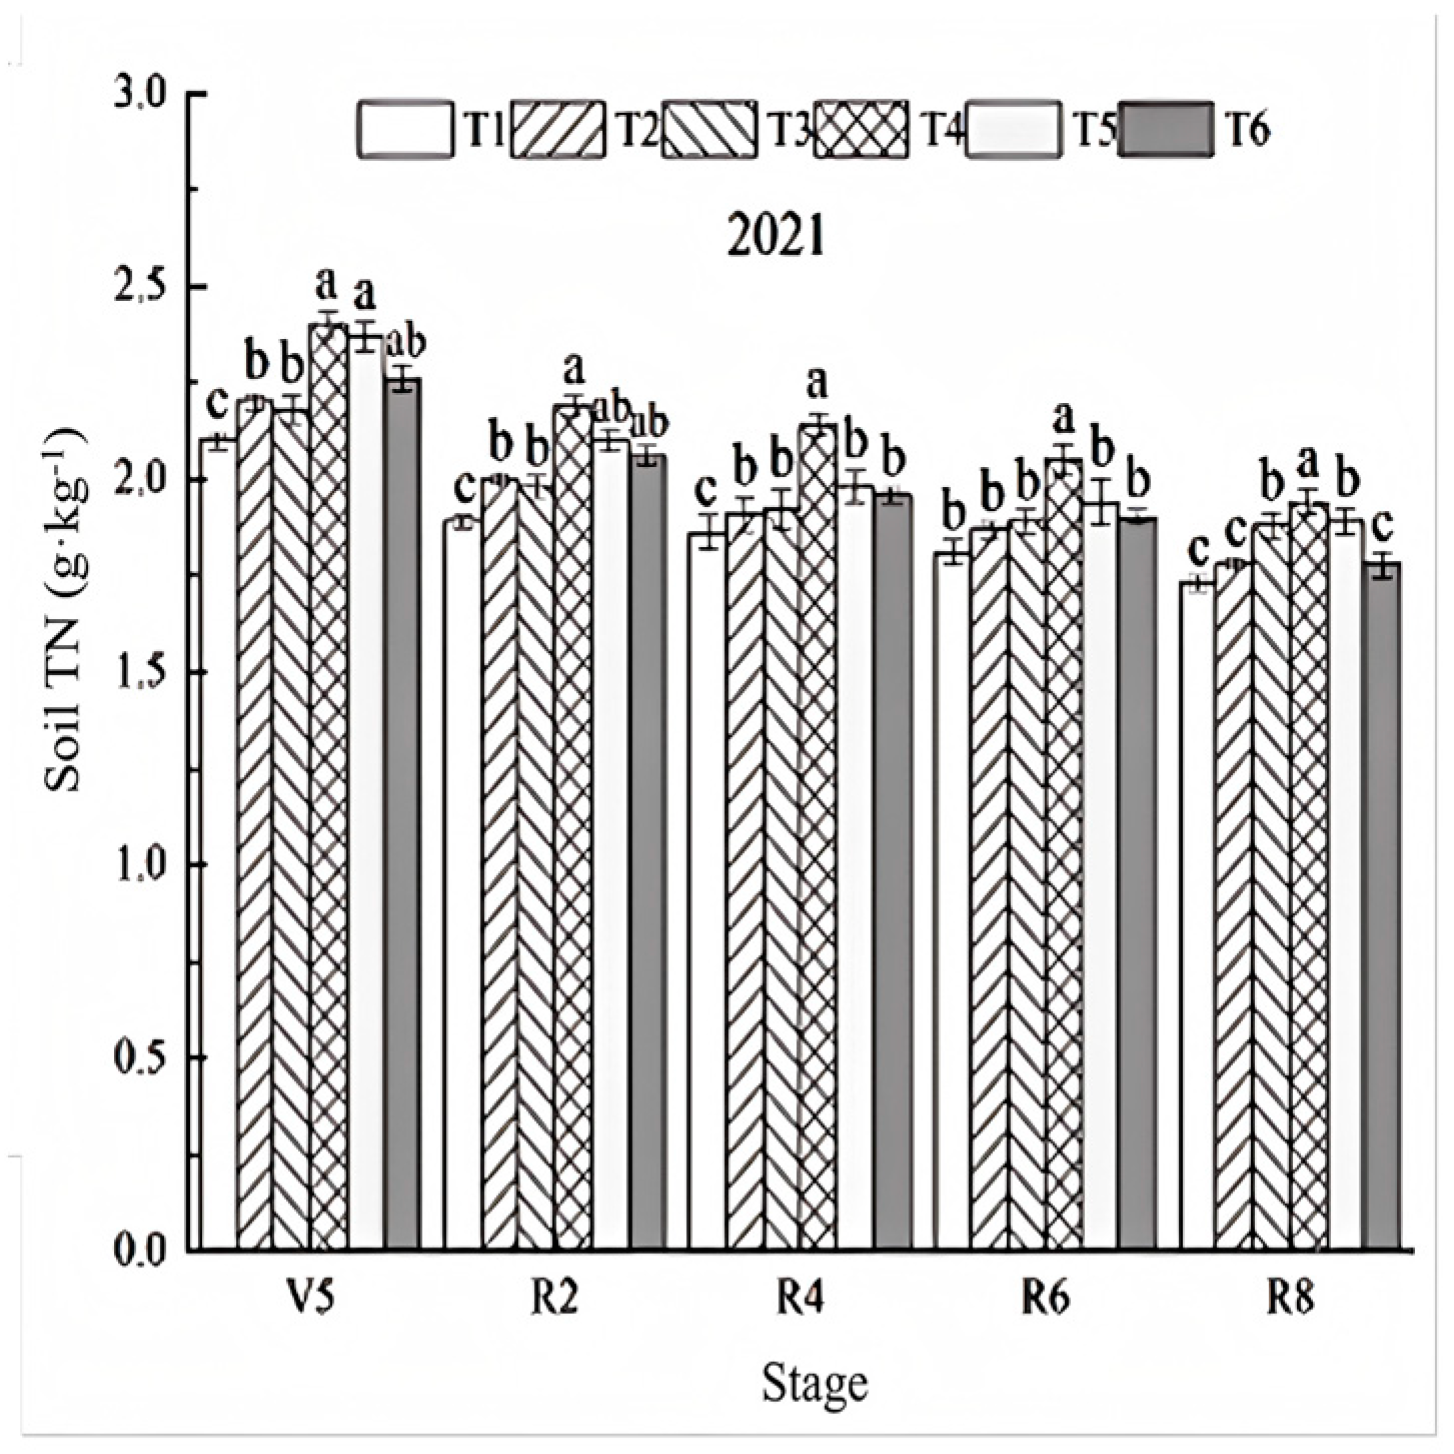
The soil total nitrogen content in 2021 tended to decrease during soybean growth and development (Figure 5), with the greatest decrease occurring during the growth stage of the V5–R2 period. In the V5 stage, compared with that in the conventional soil cultivation treatment (T1), the soil total nitrogen content in both the deep loosening treatment and the early cultivation treatment increased and reached a significant difference, in which the increases in the T2 and T3 treatments were 4.18% and 3.81%, respectively, whereas the total nitrogen contents in the T4, T5, and T6 treatments were higher by 14.29%, 12.85%, and 7.62%, respectively (p < 0.05). Except for the T1 treatment, under the same plowing time, the total nitrogen content of the T4 and T5 treatments was significantly greater than that of the T2 treatment by 9.09% and 7.73%, respectively; under the same plowing depth, the total nitrogen content of the T4 and T5 treatments was significantly greater than that of the T3 treatment by 10.09% and 9.05%, respectively (p < 0.05). These findings indicate that advancing the tillage time and deepening the tillage layer are both conducive to increasing the soil total N content and that subsoiling during the V4–V5 period promotes the effect of soil total N better than soil cultivation.
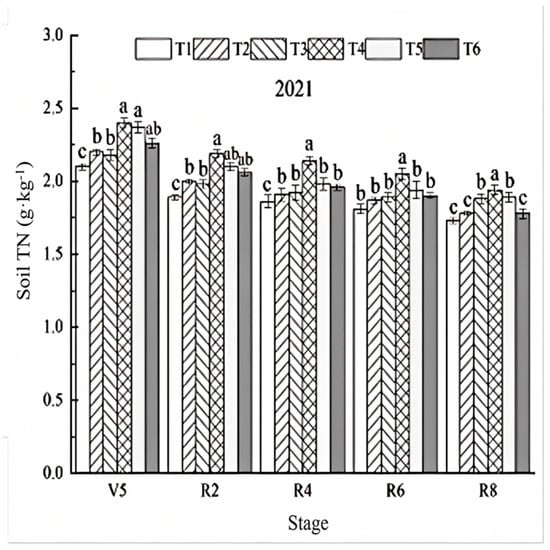
Figure 5.
Effects of different intertillage measures on soil total nitrogen (TN) (2021). T1: During the V2–V3 stage, little earthing-up occurs; during the V4–V5 stage, a medium quantity of earthing-up occurs; and during the V6–V7 stage, a considerable quantity of earthing-up occurs. T2: During the 4–5 days after the broadcast, a small quantity of earth is present; during the V4–V5 stage, a medium quantity of earth is present; and during the V6–V7 stage, a considerable quantity of earth is present. T3: During the V2–V3 stage, subsoiling was performed at depths of 25–30 cm; during the V4–V5 stage, subsoiling was performed at depths of 30–35 cm, and a moderate quantity of earthing-up occurred; and during the V6–V7 stage, a considerable quantity of earthing-up occurred. T4: During the 4–5 days after broadcast, subsoiling was performed at depths of 25–30 cm; during the V4–V5 stage, subsoiling was performed at depths of 30–35 cm, and a medium quantity of earthing-up occurred; and during the V6–V7 stage, considerable quantities of earthing-up occurred. T5: During the 4–5 days after broadcast, subsoiling was performed at depths of 25–30 cm; during the V4–V5 stage, subsoiling was performed at depths of 30–35 cm; and during the V6–V7 stage, considerable quantities of earthing-up occurred. T6: During the 4–5 days after broadcast, subsoiling is performed at depths of 25–30 cm; during the V4–V5 stage, a medium quantity of earth is present; and during the V6–V7 stage, a considerable quantity of earth is present. Note: Different lowercase letters indicate significant differences between treatments (p < 0.05).
In the R2 stage, when the demand for nitrogen in the soil was high, the total nitrogen content in the T4 treatment was greater than that in the other treatments (8.08% to 15.05%), which was significantly different from that in the T1, T2, and T3 treatments (p < 0.05). In the T5 treatment, the total nitrogen content in the soil was greater than that in the T6 treatment, whereas in the T1, T2, and T3 treatments, the total nitrogen content in the soil was lower than that in the V5 period. The characteristics of soil total nitrogen were consistent with those of the V5 stage, indicating that only deep polishing accelerated the rate of soil total nitrogen depletion in the V4–V5 stage and that the combination of deep polishing and soil cultivation could maintain soil total nitrogen at a relatively high level. In the R4 stage, the soil total nitrogen content of the T1 treatment was the lowest, and those of the T2, T3, T5, and T6 treatments were close to the same, whereas that of the T4 treatment was significantly greater than those of the other treatments (p < 0.05). In the late reproductive stage, the soil total nitrogen content was similar to that in the stabilization stage. Compared with that in the other treatments, the nitrogen content in the R8 period was greater, with a trend of 1.94–2.05 g/kg, and that in the other treatments was significantly different (p < 0.05). With the exception of the T4 treatment, the total nitrogen content in the R6 period was not significantly different. In the R8 period, the total nitrogen content in the T5 > T3> T2 > T6 > T1. The difference between the T3 and T5 treatments and the T1, T2, and T6 treatments was significant (p < 0.05), indicating that early deep polishing effectively increased the soil total nitrogen content in the soybean field. In addition, soil cultivation during the V4–V5 period slowed the total nitrogen content in the late reproductive stage, but the total nitrogen content in the late reproduction stage was lower. In addition, deep polishing during this period accelerated the soil total nitrogen depletion rate in the prereproductive stage. However, the deeper tillage layer could still maintain a high soil total nitrogen content.
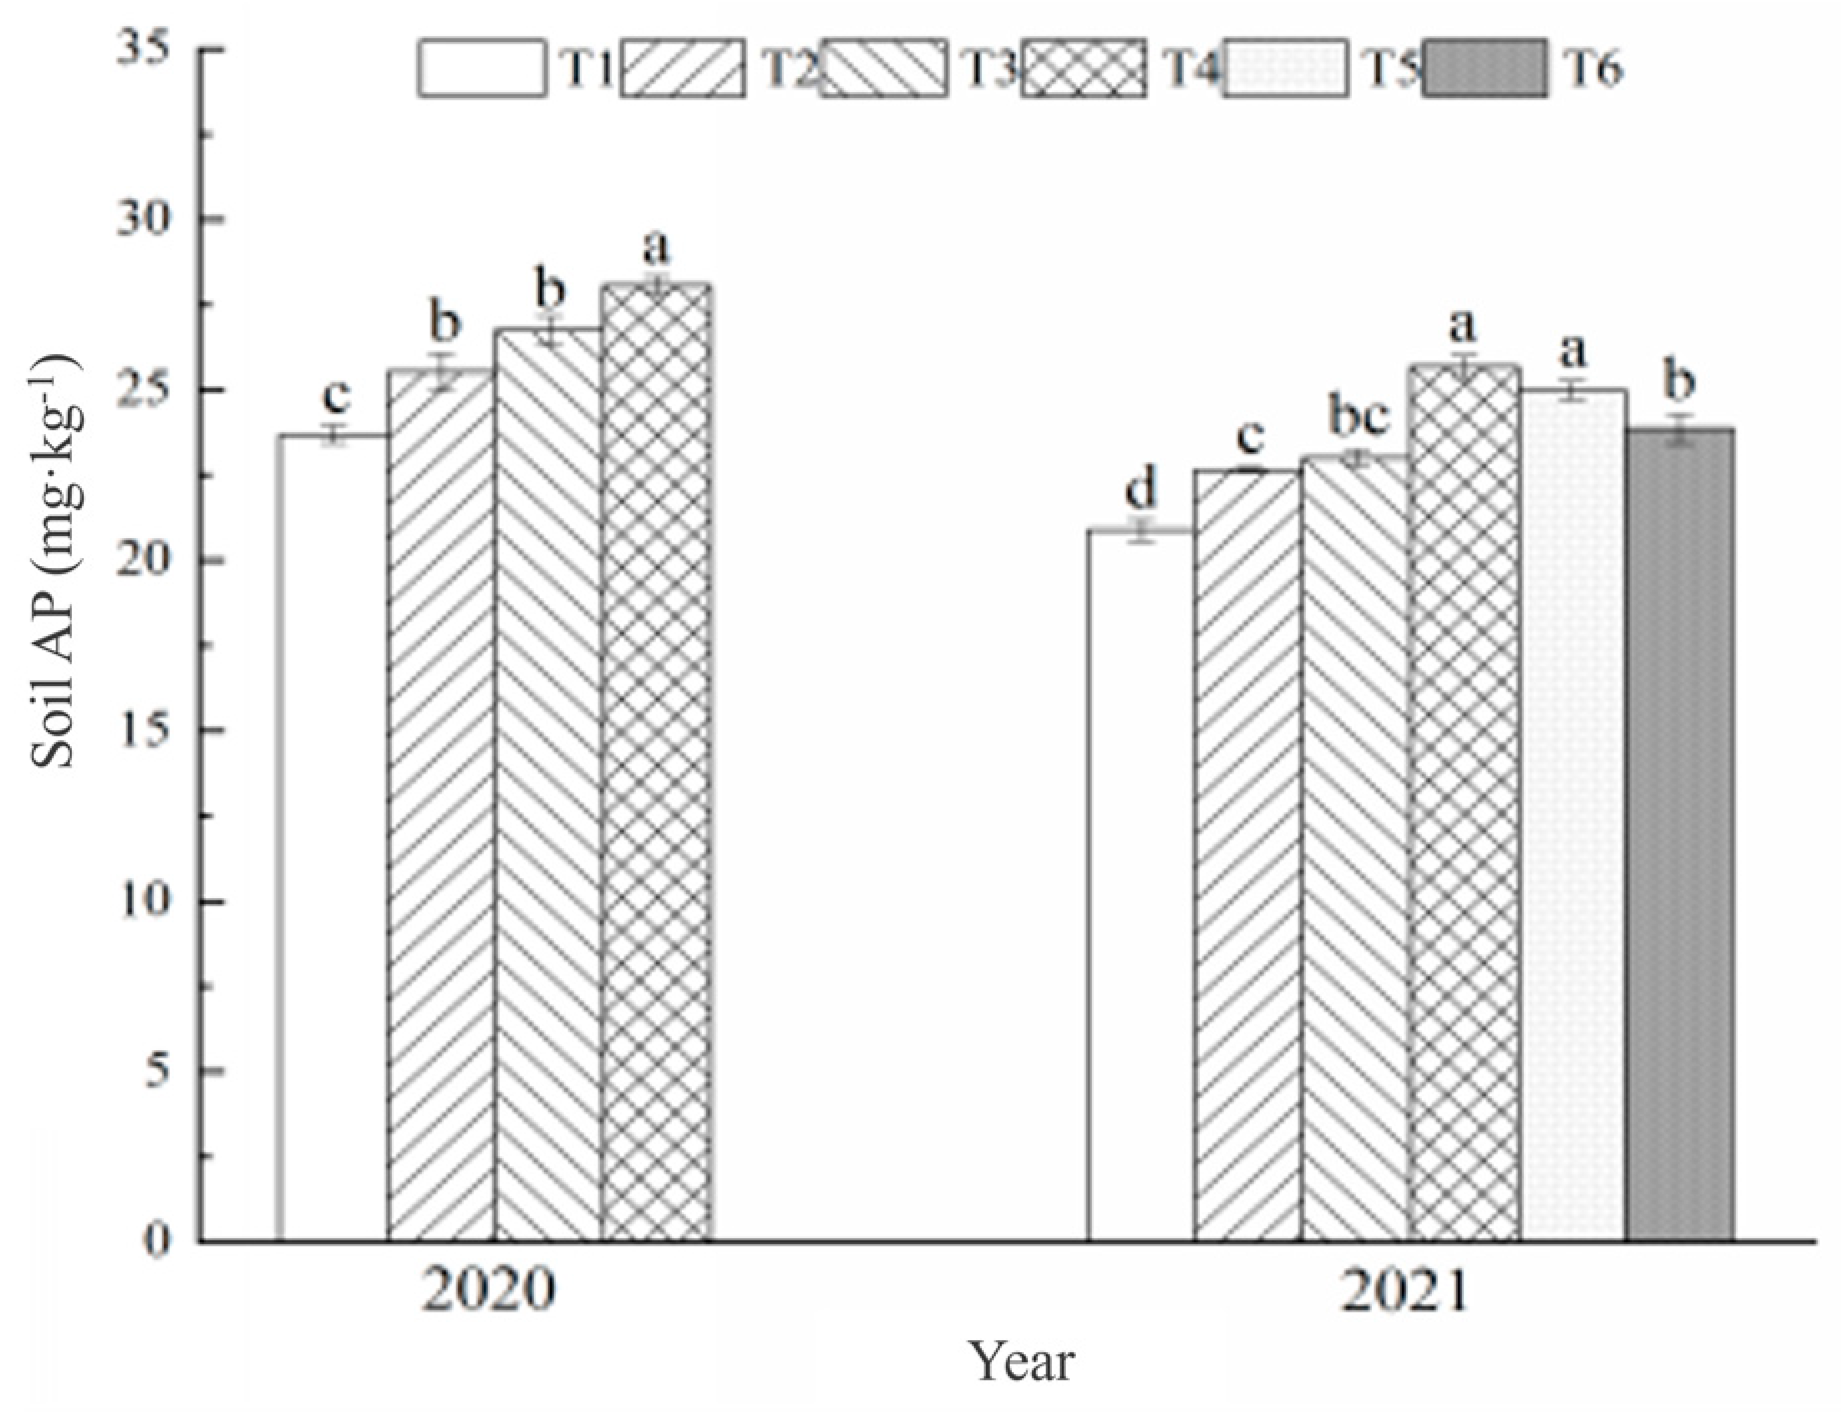
Figure 6 shows the soil available phosphorus contents of the different intertillage treatments at the maturity stage of the soybean plants in 2020 and 2021. In 2020, under the same duration of intertillage, the available phosphorus content of the T3 treatment was significantly greater than that of the T1 treatment by 11.43% (p < 0.05), and the available phosphorus content of the T4 treatment was significantly greater than that of the T2 treatment by 9.95% (p < 0.05); under the same depth of intertillage and compared with the available phosphorus content of different treatments, the available phosphorus content of the T2 treatment was significantly greater than that of the T1 treatment, and that of the T4 treatment was significantly greater than that of the T3 treatment, with increases of 7.77% and 4.93%, respectively (p < 0.05); among the treatments, the available phosphorus content of the T1 and T4 treatments had the greatest difference, amounting to 4.38 mg kg−1. In 2021, early intertillage played a certain role in increasing the available phosphorus content of the soil. The promotion effects of the T1 and T2 treatments were 20.89 mg kg−1 and 22.66 mg kg−1, respectively, and those of the T2 treatment were significantly greater than those of the T1 treatment (p < 0.05). Compared with those of the T3 treatment, the available phosphorus contents of the T4, T5, and T6 treatments increased by 11.65%, 8.60%, and 3.69%, respectively, of which the T4 and T5 treatments were significantly different (p < 0.05). Moreover, the soil available phosphorus content in the deep-polishing treatments (T3, T4, T5, and T6) was greater than that in the soil cultivation treatments (T1 and T2), of which the soil available phosphorus content in the T3 treatment was significantly greater than that in the T1 treatment and reached a significant difference (p < 0.05) between the T4, T5, and T6 treatments and the T2 treatment. Among the early deep plowing treatments, the soil available phosphorus content significantly increased by 7.67% and 4.74% in the T4 and T5 treatments, respectively, compared with that in the T6 treatment. The results of the two years indicated that the time and depth of intertillage had different degrees of influence on the soil available phosphorus content and that increasing the depth of intertillage had a more obvious effect on improving the soil available phosphorus content. On the basis of early deep peddling, simultaneous deep peddling and cultivation in the period of V4–V5 were more conducive to increasing the soil available phosphorus content.

Figure 6.
Effects of different intertillage measures on soil AP. T1: During the V2–V3 stage, little earth is present; during the V4–V5 stage, a medium quantity of earth is present; and during the V6–V7 stage, a considerable quantity of earth is present. T2: During the 4–5 days after the broadcast, a small quantity of earth is present; during the V4–V5 stage, a medium quantity of earth is present; and during the V6–V7 stage, a considerable quantity of earth is present. T3: During the V2–V3 stage, subsoiling was performed at depths of 25–30 cm; during the V4–V5 stage, subsoiling was performed at depths of 30–35 cm, and a moderate quantity of earthing-up occurred; and during the V6–V7 stage, a considerable quantity of earthing-up occurred. T4: During the 4–5 days after broadcast, subsoiling was performed at depths of 25–30 cm; during the V4–V5 stage, subsoiling was performed at depths of 30–35 cm, and a medium quantity of earthing-up occurred; and during the V6–V7 stage, considerable quantities of earthing-up occurred. T5: During the 4–5 days after broadcast, subsoiling was performed at depths of 25–30 cm; during the V4–V5 stage, subsoiling was performed at depths of 30–35 cm; and during the V6–V7 stage, considerable quantities of earthing-up occurred. T6: During the 4–5 days after broadcast, subsoiling is performed at depths of 25–30 cm; during the V4–V5 stage, a medium quantity of earth is present; and during the V6–V7 stage, a considerable quantity of earth is present. Note: Different lowercase letters indicate significant differences between treatments (p < 0.05).
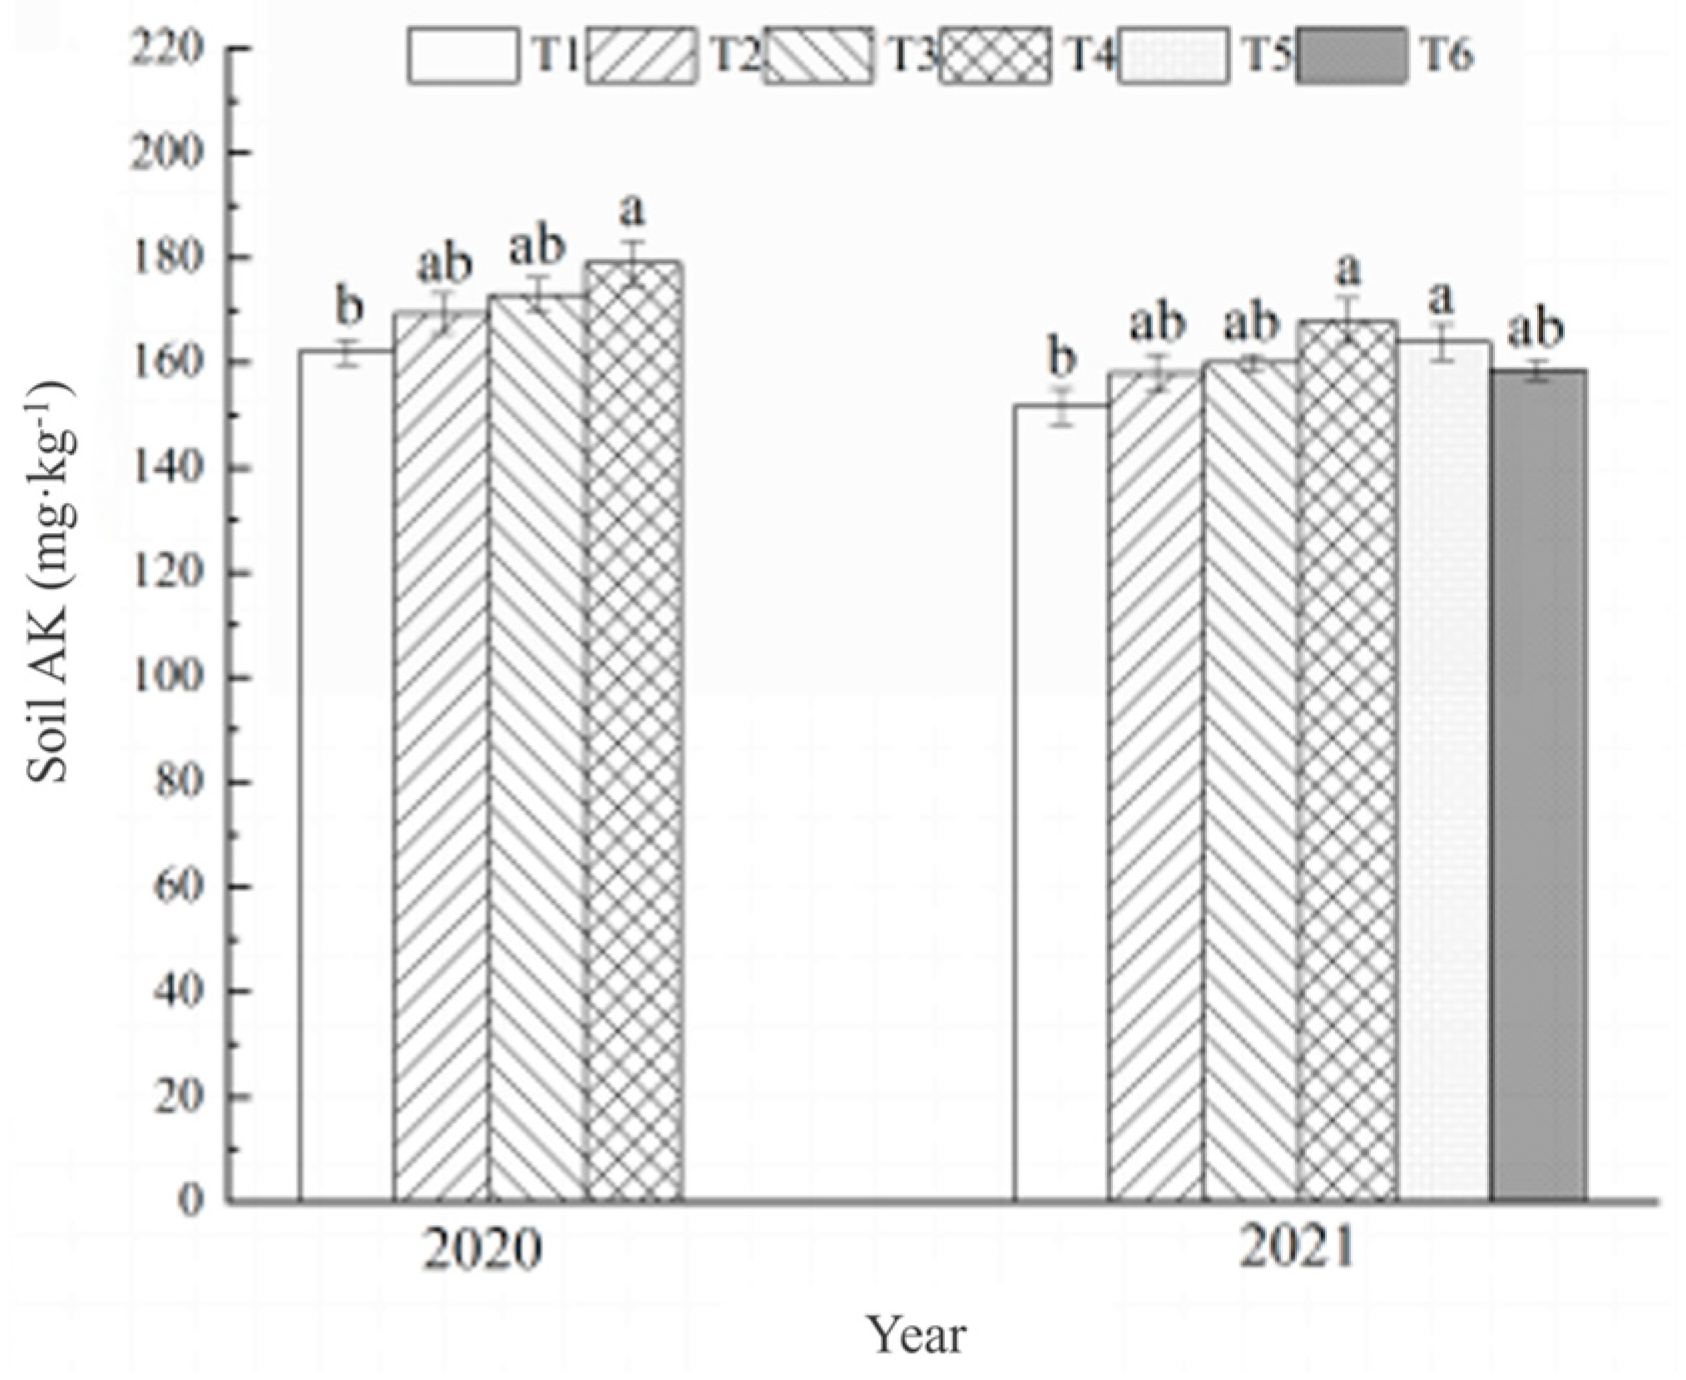
As shown in Figure 7, the available potassium contents of the treatments in 2020 were 162.00 mg·kg−1, 169.00 mg·kg−1, 173.00 mg·kg−1, and 179.00 mg·kg−1, respectively, of which only the T4 treatment resulted in a significant difference from the T1 treatment (p < 0.05). In 2021, the order of available potassium content among the treatments was T4 > T5 > T3 > T6 > T2 > T1, except for the T4 and T5 treatments, whose contents significantly increased by 11.26% and 8.61%, respectively, compared with those in the T1 treatment (p < 0.05). T5 > T3 > T6 > T2 > T1, except for the T4 and T5 treatments, in which the quick-effect potassium content increased significantly by 11.26% and 8.61%, respectively, compared with that of the T1 treatment (p < 0.05). The differences between the other treatments were not significant, indicating that changing the time of intertillage or the depth of intertillage had little effect on the quick-effect potassium content of the soil and that deep tillaging in the period of V4–V5 on the basis of deep tillaging in advance was the key factor for increasing the quick-effect potassium content of the soil. The key factor for the increase in the soil’s available potassium content.
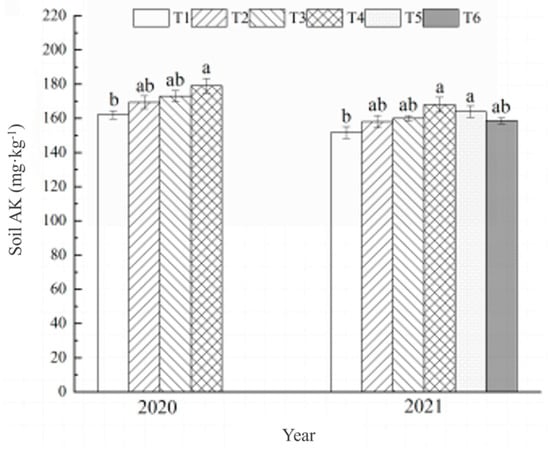
Figure 7.
Effects of different intertillage measures on soil available K. T1: During the V2–V3 stage, little earth is present; during the V4–V5 stage, a medium quantity of earth is present; and during the V6–V7 stage, a considerable quantity of earth is present. T2: During the 4–5 days after the broadcast, a small quantity of earth is present; during the V4–V5 stage, a medium quantity of earth is present; and during the V6–V7 stage, a considerable quantity of earth is present. T3: During the V2–V3 stage, subsoiling was performed at depths of 25–30 cm; during the V4–V5 stage, subsoiling was performed at depths of 30–35 cm, and a moderate quantity of earthing-up occurred; and during the V6–V7 stage, a considerable quantity of earthing-up occurred. T4: During the 4–5 days after broadcast, subsoiling was performed at depths of 25–30 cm; during the V4–V5 stage, subsoiling was performed at depths of 30–35 cm, and a medium quantity of earthing-up occurred; and during the V6–V7 stage, considerable quantities of earthing-up occurred. T5: During the 4–5 days after broadcast, subsoiling was performed at depths of 25–30 cm; during the V4–V5 stage, subsoiling was performed at depths of 30–35 cm; and during the V6–V7 stage, considerable quantities of earthing-up occurred. T6: During the 4–5 days after broadcast, subsoiling is performed at depths of 25–30 cm; during the V4–V5 stage, a medium quantity of earth is present; and during the V6–V7 stage, a considerable quantity of earth is present. Note: Different lowercase letters indicate significant differences between treatments (p < 0.05).
3.2. Effects of Different Intertillage Practices on Soil Microbial Diversity
3.2.1. Clustering Analysis of the OTUs of the Soil Bacterial and Fungal Communities
Figure 8A shows the number of OTUs of each sample obtained by clustering the reads at the 97.0% similarity level. The total number of OTUs of all the intertillage treatments was 1830, among which the highest number of bacterial OTUs was found in the T4 treatment, followed by the T2 treatment. The number of bacterial OTUs in the T3 treatment was slightly smaller than that in the T2 treatment, and the lowest number of bacterial OTUs was found in the T1 treatment. Figure 8B shows the characteristics of all the samples. The number in the middle of the petal diagram represents the number of characteristics common to all the samples, and the number on the petal represents the number of characteristics specific to the samples. The number of characteristics common to the 16 samples was 1031, and the specific performance of the treatments was T4 > T2 > T3 > T1.
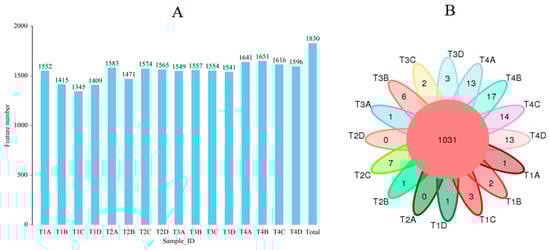
Figure 8.
(A) The number of OTUs per sample obtained by clustering reads at a similarity level of 97.0%; (B) Venn diagram. T1: During the V2–V3 stage, few bacteria are present, while during the V4–V5 stage, medium quantities of bacteria are present, and during the V6–V7 stage, considerable quantities of bacteria are present. T2: During the 4–5 days after the broadcast, a small quantity of earth is present; during the V4–V5 stage, a medium quantity of earth is present; and during the V6–V7 stage, a considerable quantity of earth is present. T3: During the V2–V3 stage, subsoiling was performed at depths of 25–30 cm; during the V4–V5 stage, subsoiling was performed at depths of 30–35 cm, and a moderate quantity of earthing-up occurred; and during the V6–V7 stage, a considerable quantity of earthing-up occurred. T4: During the 4–5 days after the broadcast, subsoiling is performed at depths of 25–30 cm; during the V4–V5 stage, subsoiling occurs at depths of 30–35 cm + medium quantity of earth; and during the V6–V7 stage, a considerable quantity of earth is present.
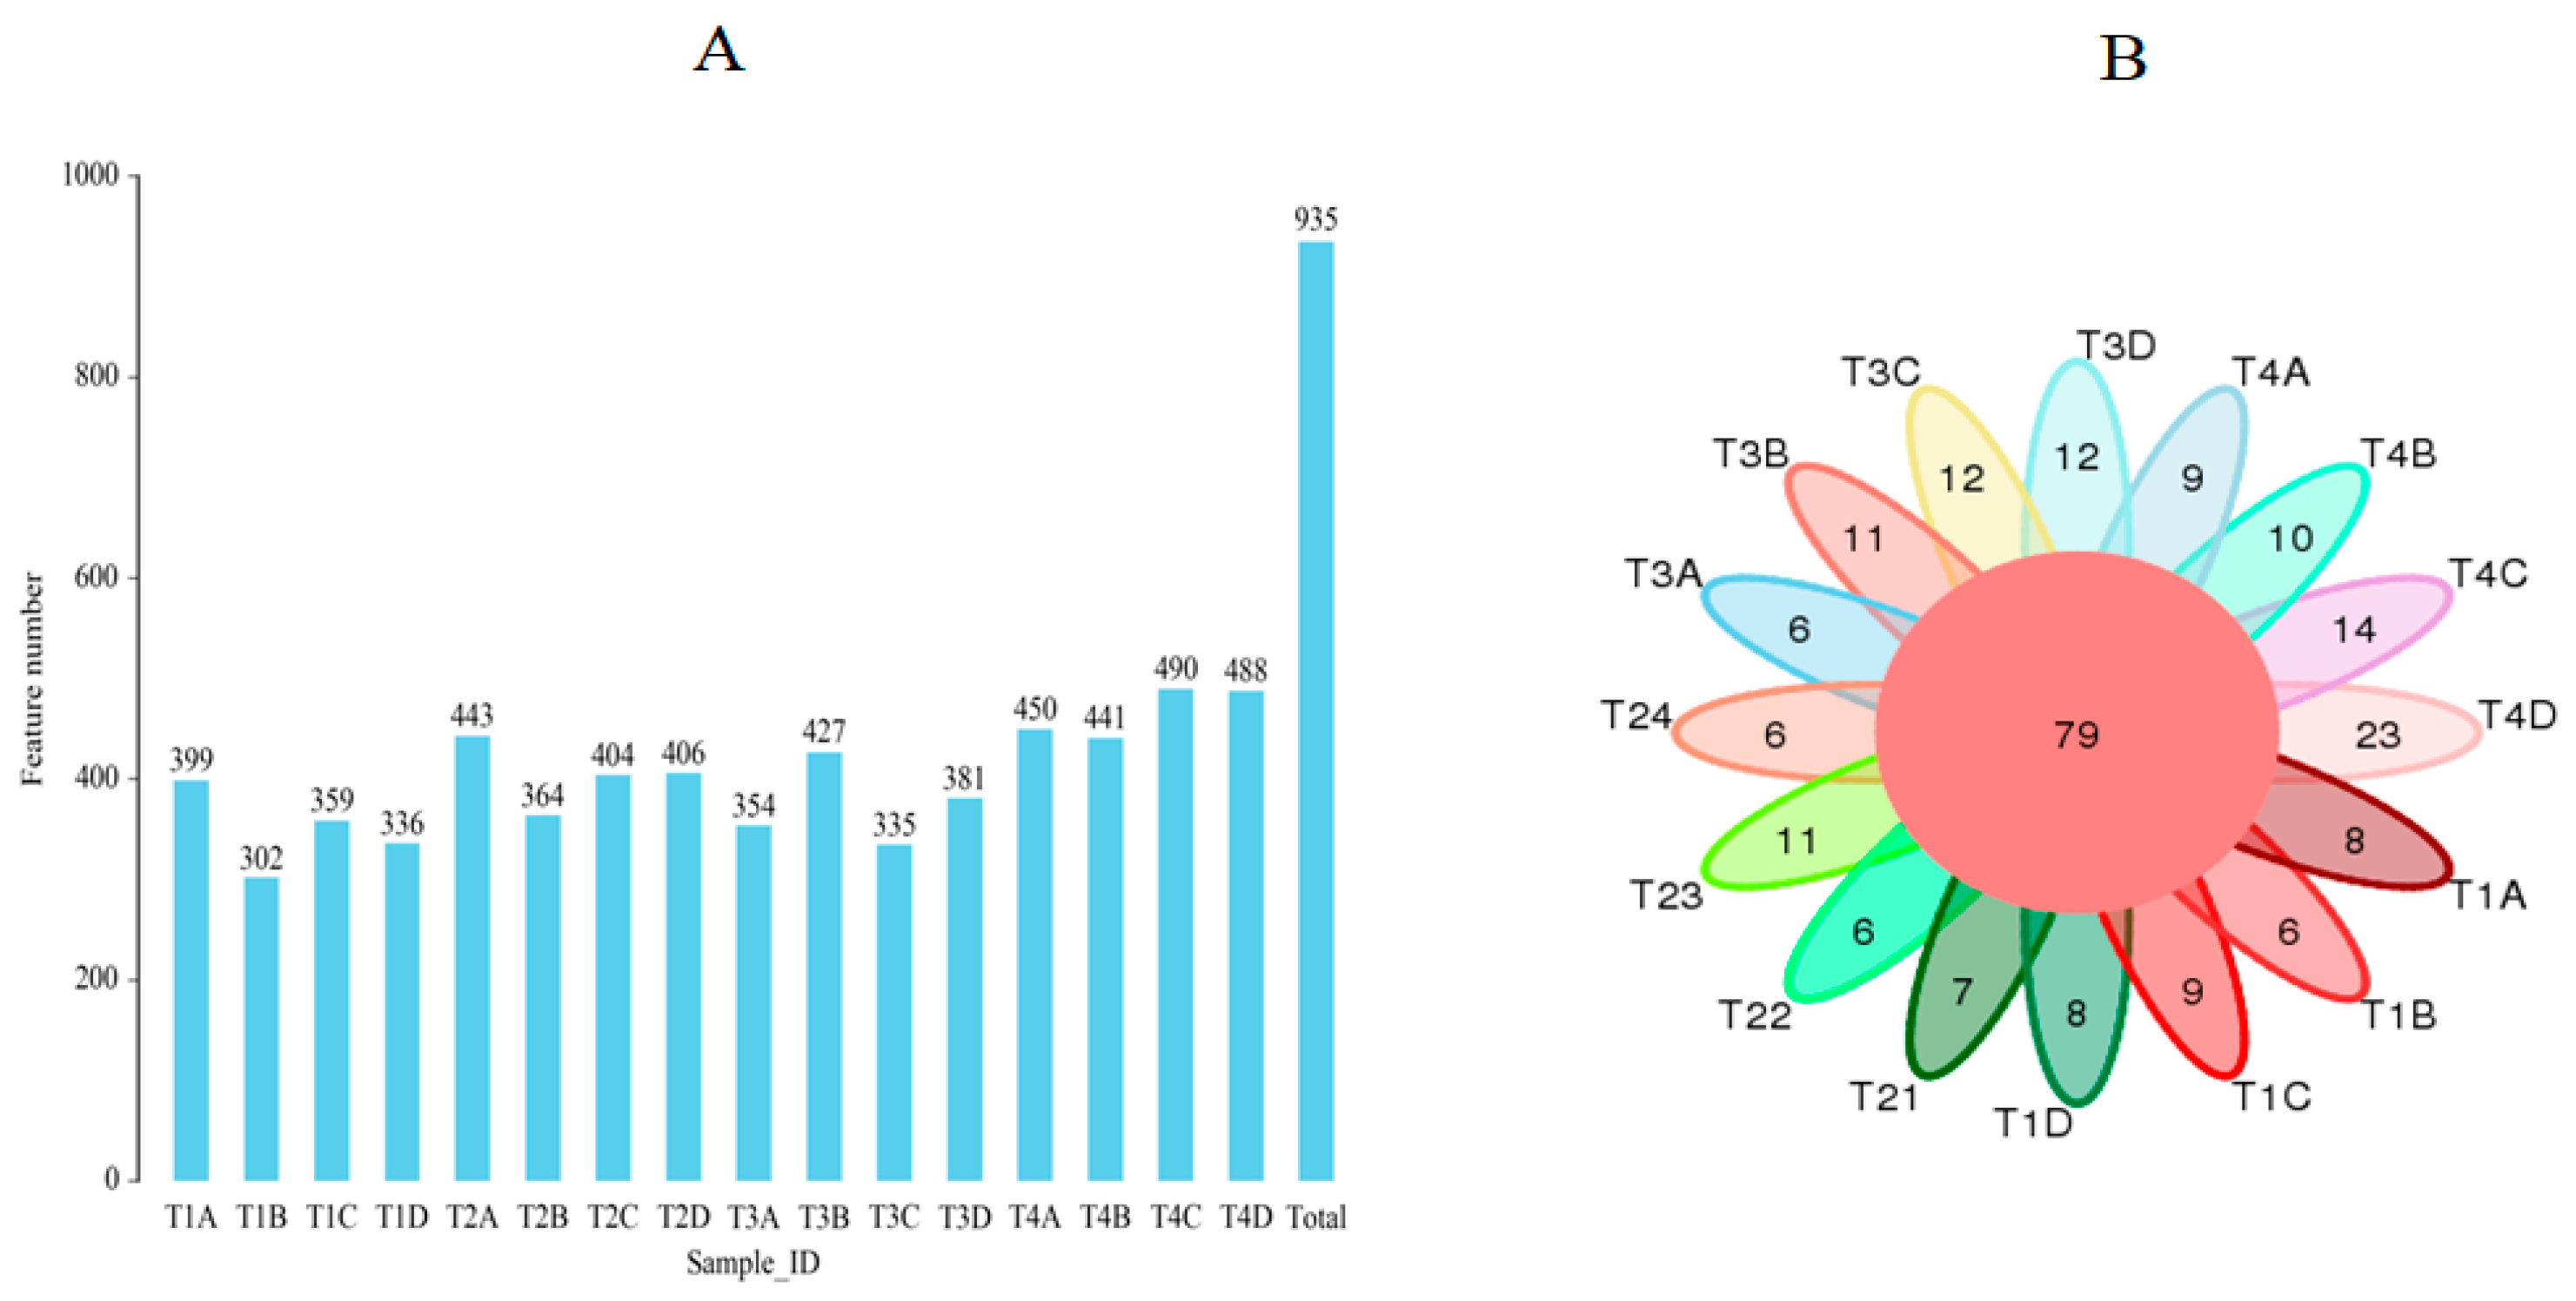
As shown in Figure 9A, the total number of OTUs of fungal communities in all the treatments was 935, of which the number of OTUs in the T1 treatment was less than 400. The number of OTUs in the T2 and T3 treatments was in the range of 335–443, which was closer to each other, and the number of OTUs in the four samples in the T4 treatment was the highest at 490. As shown in Figure 9B, the number of characteristics of the fungal communities shared by all the treatments was 79, of which the number of features unique to the soil cultivation treatments (T1 and T2) was lower than that of the deep loosening treatments (T3 and T4). Among the deep loosening treatments, the number of features unique to the samples in the T3 treatment was 12, whereas the number of features unique to the samples in the T4 treatment reached 23, which was significantly greater than that in the T3 treatment.

Figure 9.
(A) The number of OTUs per sample obtained by clustering reads at a similarity level of 97.0%; (B) Venn diagram. T1: During the V2–V3 stage, little earth is present; during the V4–V5 stage, a medium quantity of earth is present; and during the V6–V7 stage, a considerable quantity of earth is present. T2: During the 4–5 days after the broadcast, a small quantity of earth is present; during the V4–V5 stage, a medium quantity of earth is present; and during the V6–V7 stage, a considerable quantity of earth is present. T3: During the V2–V3 stage, subsoiling was performed at depths of 25–30 cm; during the V4–V5 stage, subsoiling was performed at depths of 30–35 cm, and a moderate quantity of earthing-up occurred; and during the V6–V7 stage, a considerable quantity of earthing-up occurred. T4: During the 4–5 days after the broadcast, subsoiling is performed at depths of 25–30 cm; during the V4–V5 stage, subsoiling occurs at depths of 30–35 cm + medium quantity of earth; and during the V6–V7 stage, a considerable quantity of earth is present.
Overall, under the same intertillage time, the number of OTUs and the number of unique features of bacteria and fungi were greater under subsoiling treatments (T1 and T3); under the same intertillage depth, the effect of increasing the intertillage time on improving the diversity of soil bacteria and fungal communities was obvious; combined with the differences in the number of OTUs and the number of unique features of bacteria in different intertillage treatments, these findings indicated that both increasing the intertillage time and subsoiling was favorable to the enrichment of soil bacterial and fungal communities and that early deep plowing can significantly increase the diversity of soil bacteria and fungi.
3.2.2. Analysis of the Microbial Community Structure
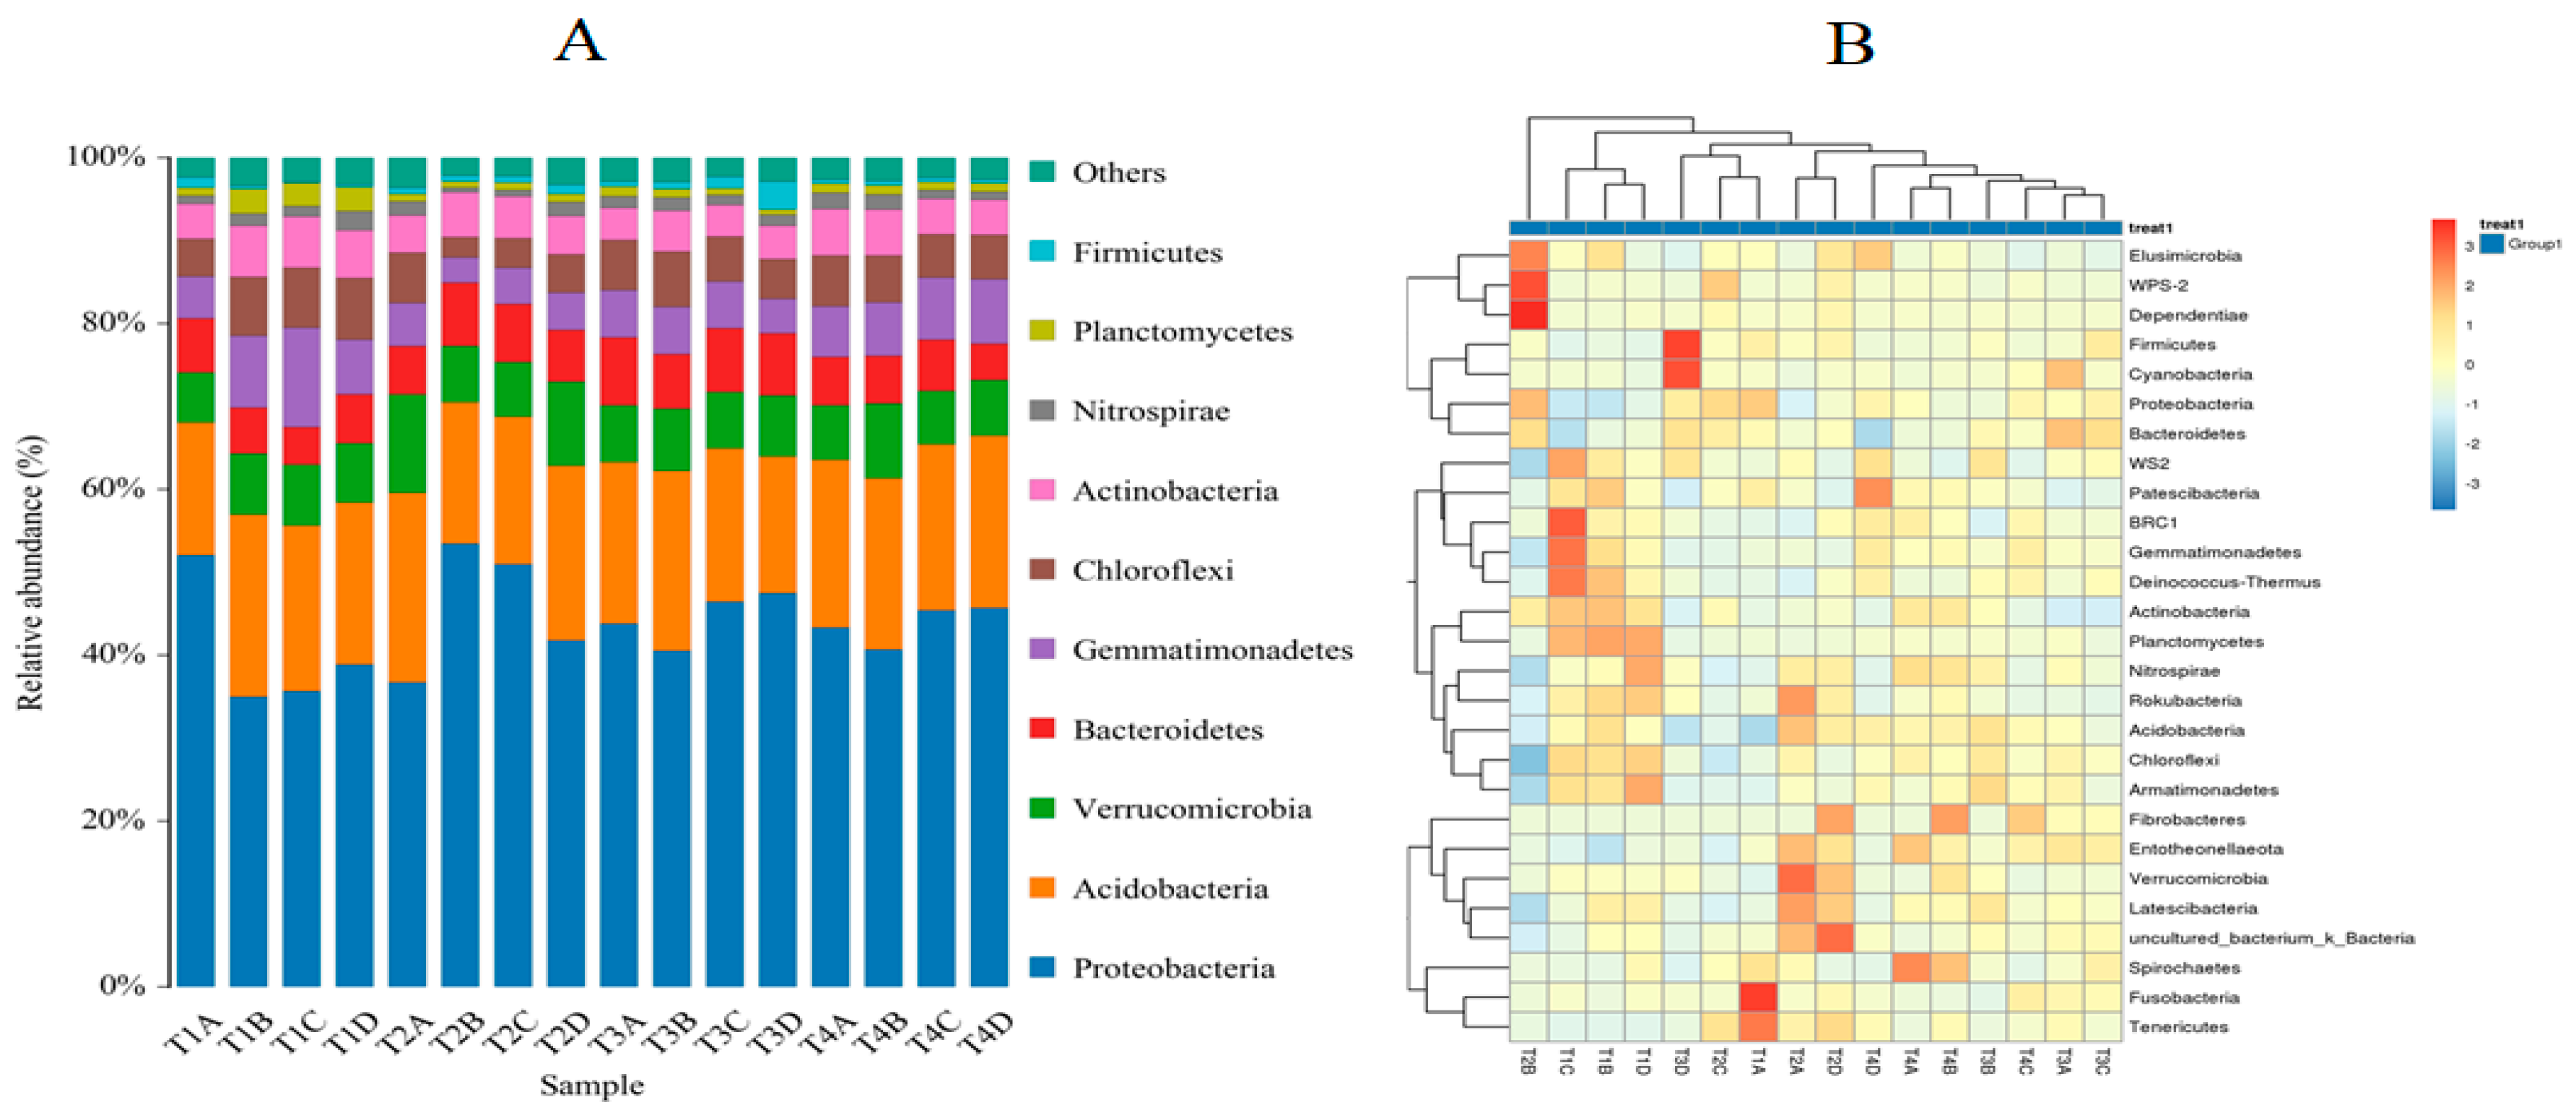
As shown in Figure 10A, among the bacterial communities present in soils subjected to different intertillage treatments, Protepbacteria and Acidobacteria, Verrucomicrobia, Bacteroidetes, Gemmatimonadetes, Chloroflexi, Actinobacteria, Nitrospairae, Plantctomyeetes, and Firmicutes were the major bacterial species, with Protepbacteria and Acidobacteria being the dominant phyla in the bacterial community structure. Bradyrhizobium, Candidatus Udaeobacter, and Sphingomonas were the main dominant genera. Compared with those in the different mesotrophic treatments, except for the T1A samples, the proportions of Protepbacteria in the T1 treatment samples were significantly lower than those in the other treatments, while the highest proportions of Protepbacteria were found in the T2 treatment, and the proportions of Protepbacteria in the T3 treatment were slightly greater than those in the T4 treatment, but there was no significant difference. Compared with that in the soil cultivation treatment (T1, T2), the proportion of slow-growing Bradyrhizobium in the subsoiling treatment (T3, T4) was significantly greater, and the proportions of Candidatus Udaeobacter and Sphingomonas also increased to different degrees. Combining the proportions of the dominant phyla in each treatment, we found that the T2 and T4 treatments presented the highest proportions of Protepbacteria but were not significantly different. We found that the proportions of Protepbacteria and Acidobacteria in the T2, T3, and T4 treatments were greater than those in the T1 treatment, and the proportions of Plantctomyeetes in the T1 and T2 treatments were slightly greater.
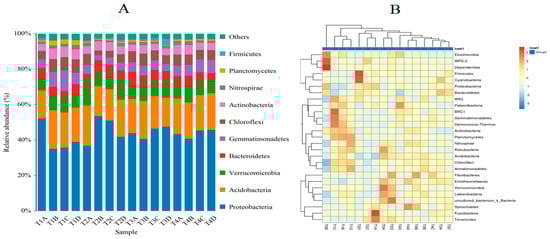
Figure 10.
(A) The top ten bacteria in terms of relative abundance at the door level; (B) Cluster analysis at the level of bacteriophyla. T1: During the V2–V3 stage, little earth is present; during the V4–V5 stage, a medium quantity of earth is present; and during the V6–V7 stage, a considerable quantity of earth is present. T2: During the 4–5 days after the broadcast, a small quantity of earth is present; during the V4–V5 stage, a medium quantity of earth is present; and during the V6–V7 stage, a considerable quantity of earth is present. T3: During the V2–V3 stage, subsoiling was performed at depths of 25–30 cm; during the V4–V5 stage, subsoiling was performed at depths of 30–35 cm, and a moderate quantity of earthing-up occurred; and during the V6–V7 stage, a considerable quantity of earthing-up occurred. T4: During the 4–5 days after the broadcast, subsoiling is performed at depths of 25–30 cm; during the V4–V5 stage, subsoiling occurs at depths of 30–35 cm + medium quantity of earth; and during the V6–V7 stage, a considerable quantity of earth is present.
Figure 10B shows the similarity of the bacterial community and its relative abundance at the phylum level among the samples. Among the treatments, the samples from the T1, T2, and T3 treatments all presented large differences in the relative abundance of some of the phyla, and the abundance of the phyla in the T4 treatment was relatively homogeneous; in addition, there was a similarity in the phylum abundance among the samples in the T1, T2, and T3 treatments, and there was a low similarity in phylum abundance among the samples in the T4 treatment. These findings indicate that, in terms of the soil bacterial community structure, deep loosening and early tillage can increase the proportion of the dominant fungal phyla in the soil, and among the treatments, the abundance of fungal phyla in the T4 treatment was more uniform, and the abundance of fungal phyla was more obvious in terms of the characteristics of the fungal phyla.
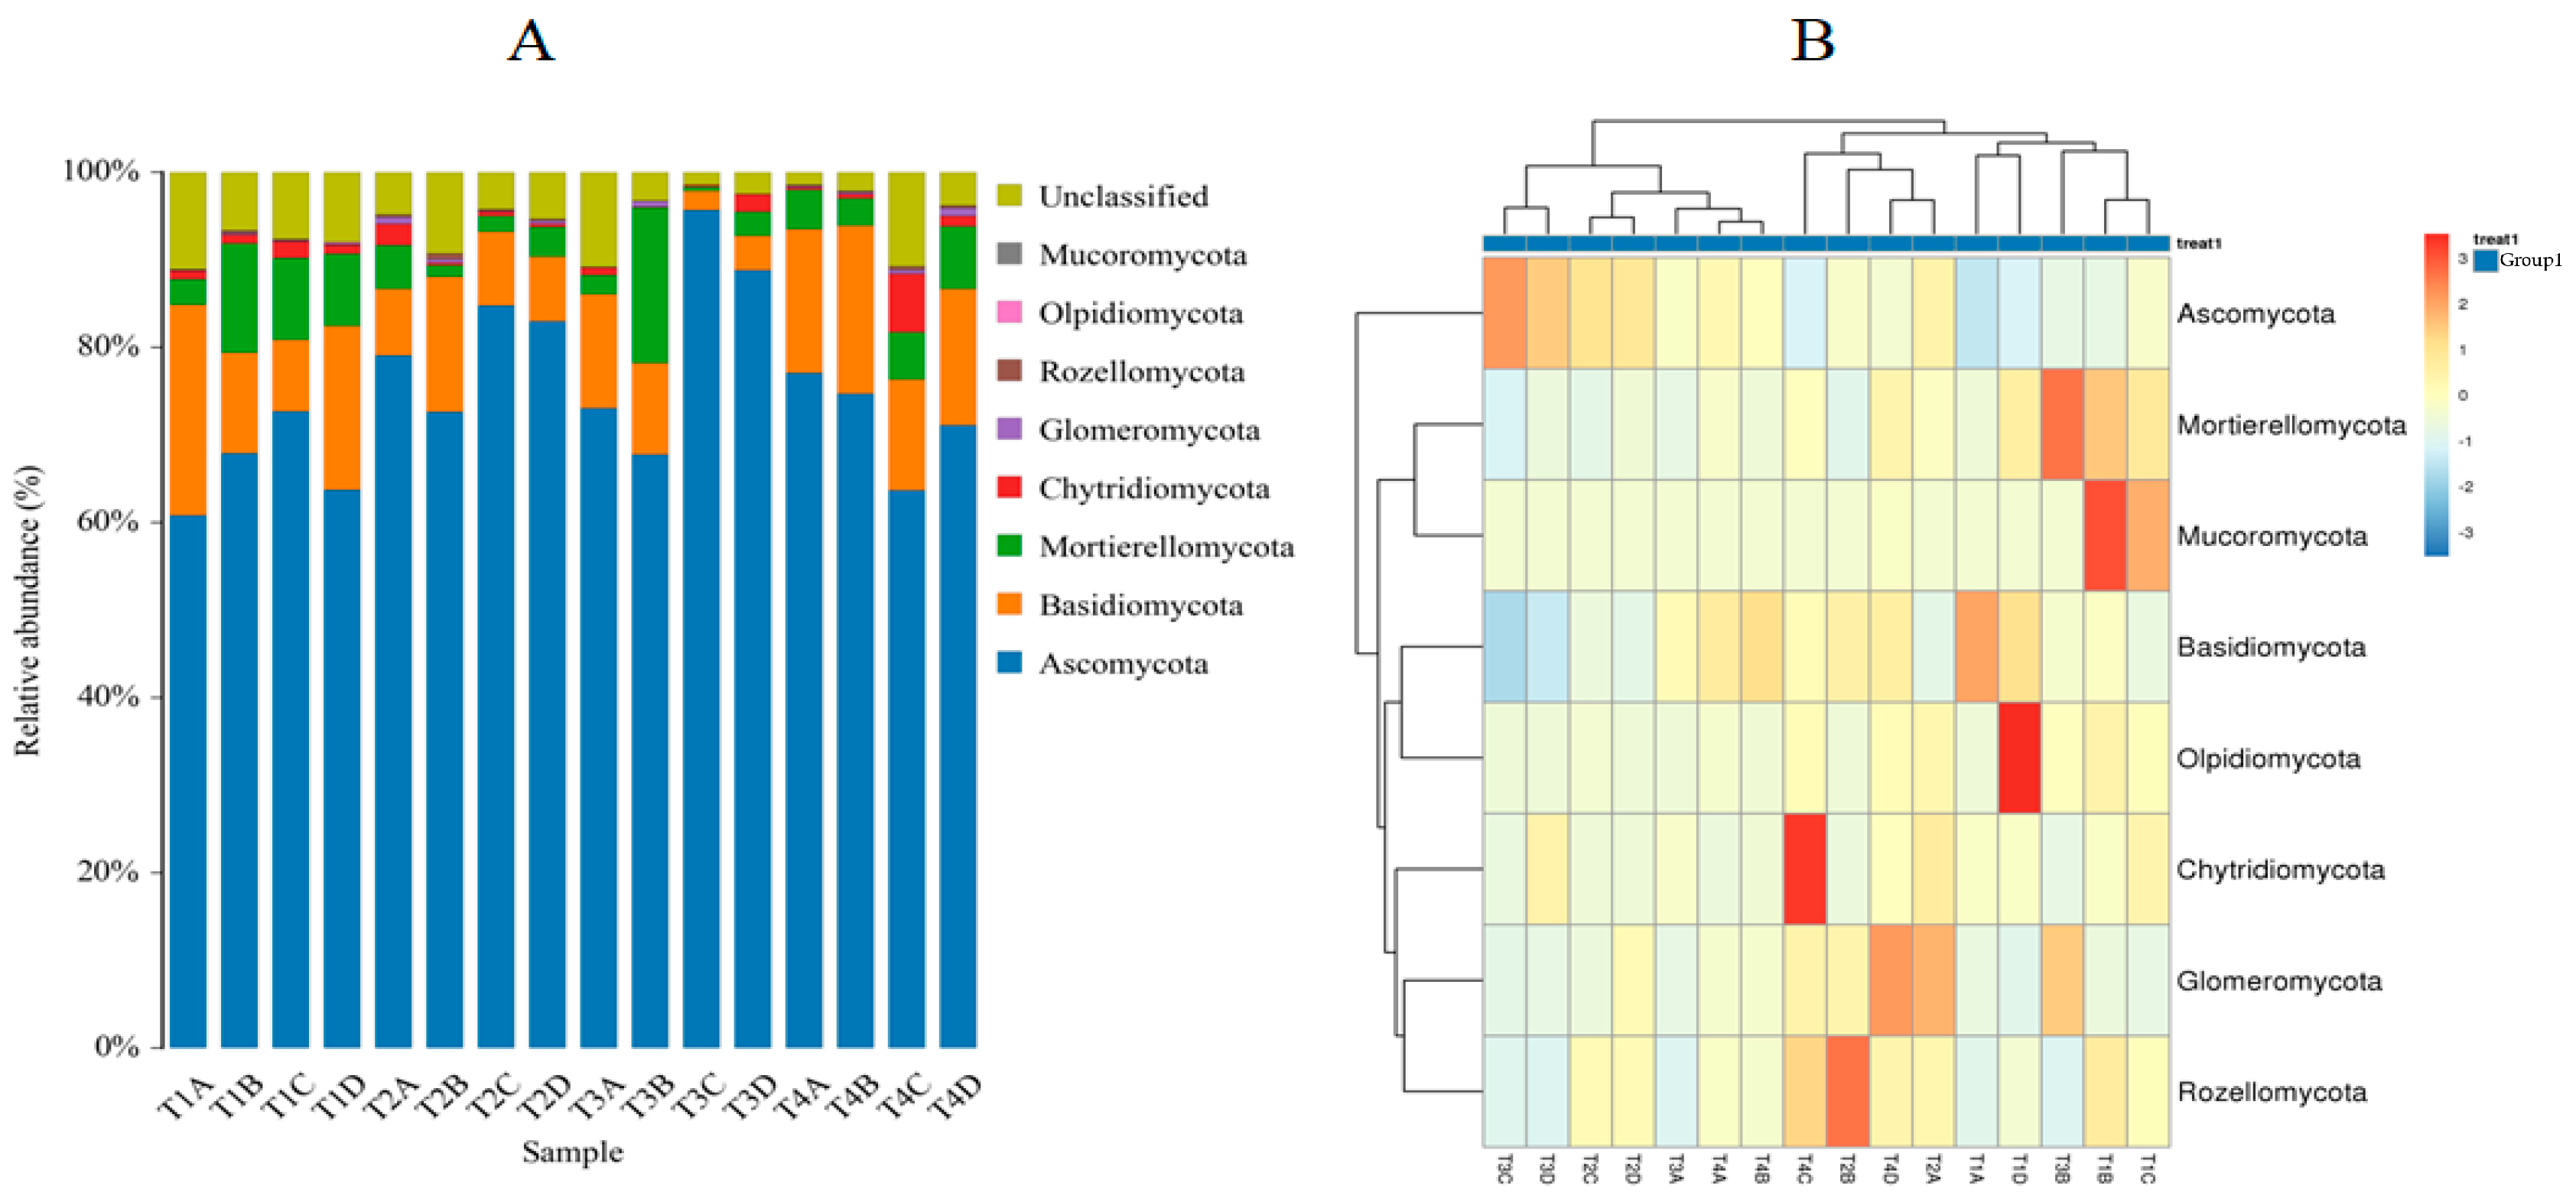
The distribution of the soil fungal communities in the different intertillage treatments (Figure 11A) revealed that Ascomycota, Basidiomycota, and Mortierellomycota were the main dominant phyla. Among the treatments, the T1 treatment showed that Ascomycota and Basidiomycota were the main dominant phyla, and the T4 treatment showed that Ascomycota and Basidiomycota were the main dominant phyla in the soil. Among the treatments, the abundance proportions of Ascomycota and Basidiomycota in the T1 treatment were significantly lower than those in the T2, T3, and T4 treatments, but their taxonomically unannotated phyla were higher than those in the other treatments. The dominant phyla in the T2 and T4 treatments were close to each other, whereas the abundance proportions of Ascomycota in the T3 treatment were the highest among the treatments, but the abundance proportions of Basidiomycota in the T3 treatment were lower. The proportion of Basidiomycota was relatively low. By comparing the distribution of fungal communities at the genus level under different mesotrophic treatments, we found that the proportions of Cadophora were significantly greater in the T1 and T2 treatments than in the T3 and T4 treatments, whereas the proportions of Mortierella and Tausonia were lower than those in the T3 and T4 treatments.

Figure 11.
(A) Top ten fungi with relative abundance at the phylum level; (B) Cluster analysis at the level of fungi. Cluster diagram of the soil fungal community structure and abundance. T1: During the V2–V3 stage, little earth is present; during the V4–V5 stage, a medium quantity of earth is present; and during the V6–V7 stage, a considerable quantity of earth is present. T2: During the 4–5 days after the broadcast, a small quantity of earth is present; during the V4–V5 stage, a medium quantity of earth is present; and during the V6–V7 stage, a considerable quantity of earth is present. T3: During the V2–V3 stage, subsoiling was performed at depths of 25–30 cm; during the V4–V5 stage, subsoiling was performed at depths of 30–35 cm, and a moderate quantity of earthing-up occurred; and during the V6–V7 stage, a considerable quantity of earthing-up occurred. T4: During the 4–5 days after the broadcast, subsoiling is performed at depths of 25–30 cm; during the V4–V5 stage, subsoiling occurs at depths of 30–35 cm + medium quantity of earth; and during the V6–V7 stage, a considerable quantity of earth is present.
In the soil fungal abundance clustering heatmap (Figure 11B), the abundance distributions of Mortierellomycota under T1 and T3 were similar, and the fungal species clustering of the different samples under T1 was significantly different. The clustering abundances of fungal species in the T2-, T3-, and T4-treated samples were similar and evenly distributed. Among them, some samples treated with T2 and T4 presented relatively high relative abundances of Chytridiomycota, Glomeromycota, and Rozellomycota, which were different from those in T3. The results indicated that tillage time had a significant effect on the community structure and species abundance of soil fungi. Moreover, subsoiling effectively increased the relative abundance of dominant bacteria in the soil.
3.2.3. Alpha Diversity Analysis of Soil Microorganisms
The Chao1 and Ace indices measure species abundance, that is, the number of species. For the same species, the greater the uniformity of each species in a community, the greater the diversity of the community. The higher the Shannon index and Simpson index are, the greater the species diversity of the sample. As shown in Table 4, the Chao1 and Ace indices of T2, T3, and T4 were significantly greater than those of the T1 treatment, with the T4 treatment having the highest Chao1 and Ace indices; however, there was no significant difference in the values of the Shannon and Simpson indices among the treatments. Table 5 shows the differences in fungal alpha diversity indices among the different intertillage treatments, with the Chao1 and Ace indices of the T4 treatment being significantly greater than those of the T1, T2, and T3 treatments, whereas the Shannon and Simpson indices of the T3 treatment were significantly lower than those of the T1, T2, and T4 treatments, indicating that early deep polishing increased the abundance of soil microorganisms and increased soil microbial richness.
Table 4.
Alpha diversity indices of the soil samples (bacteria).
Table 5.
Alpha diversity indices (fungi) of the soil samples.
3.2.4. Beta Diversity Analysis of Soil Microorganisms
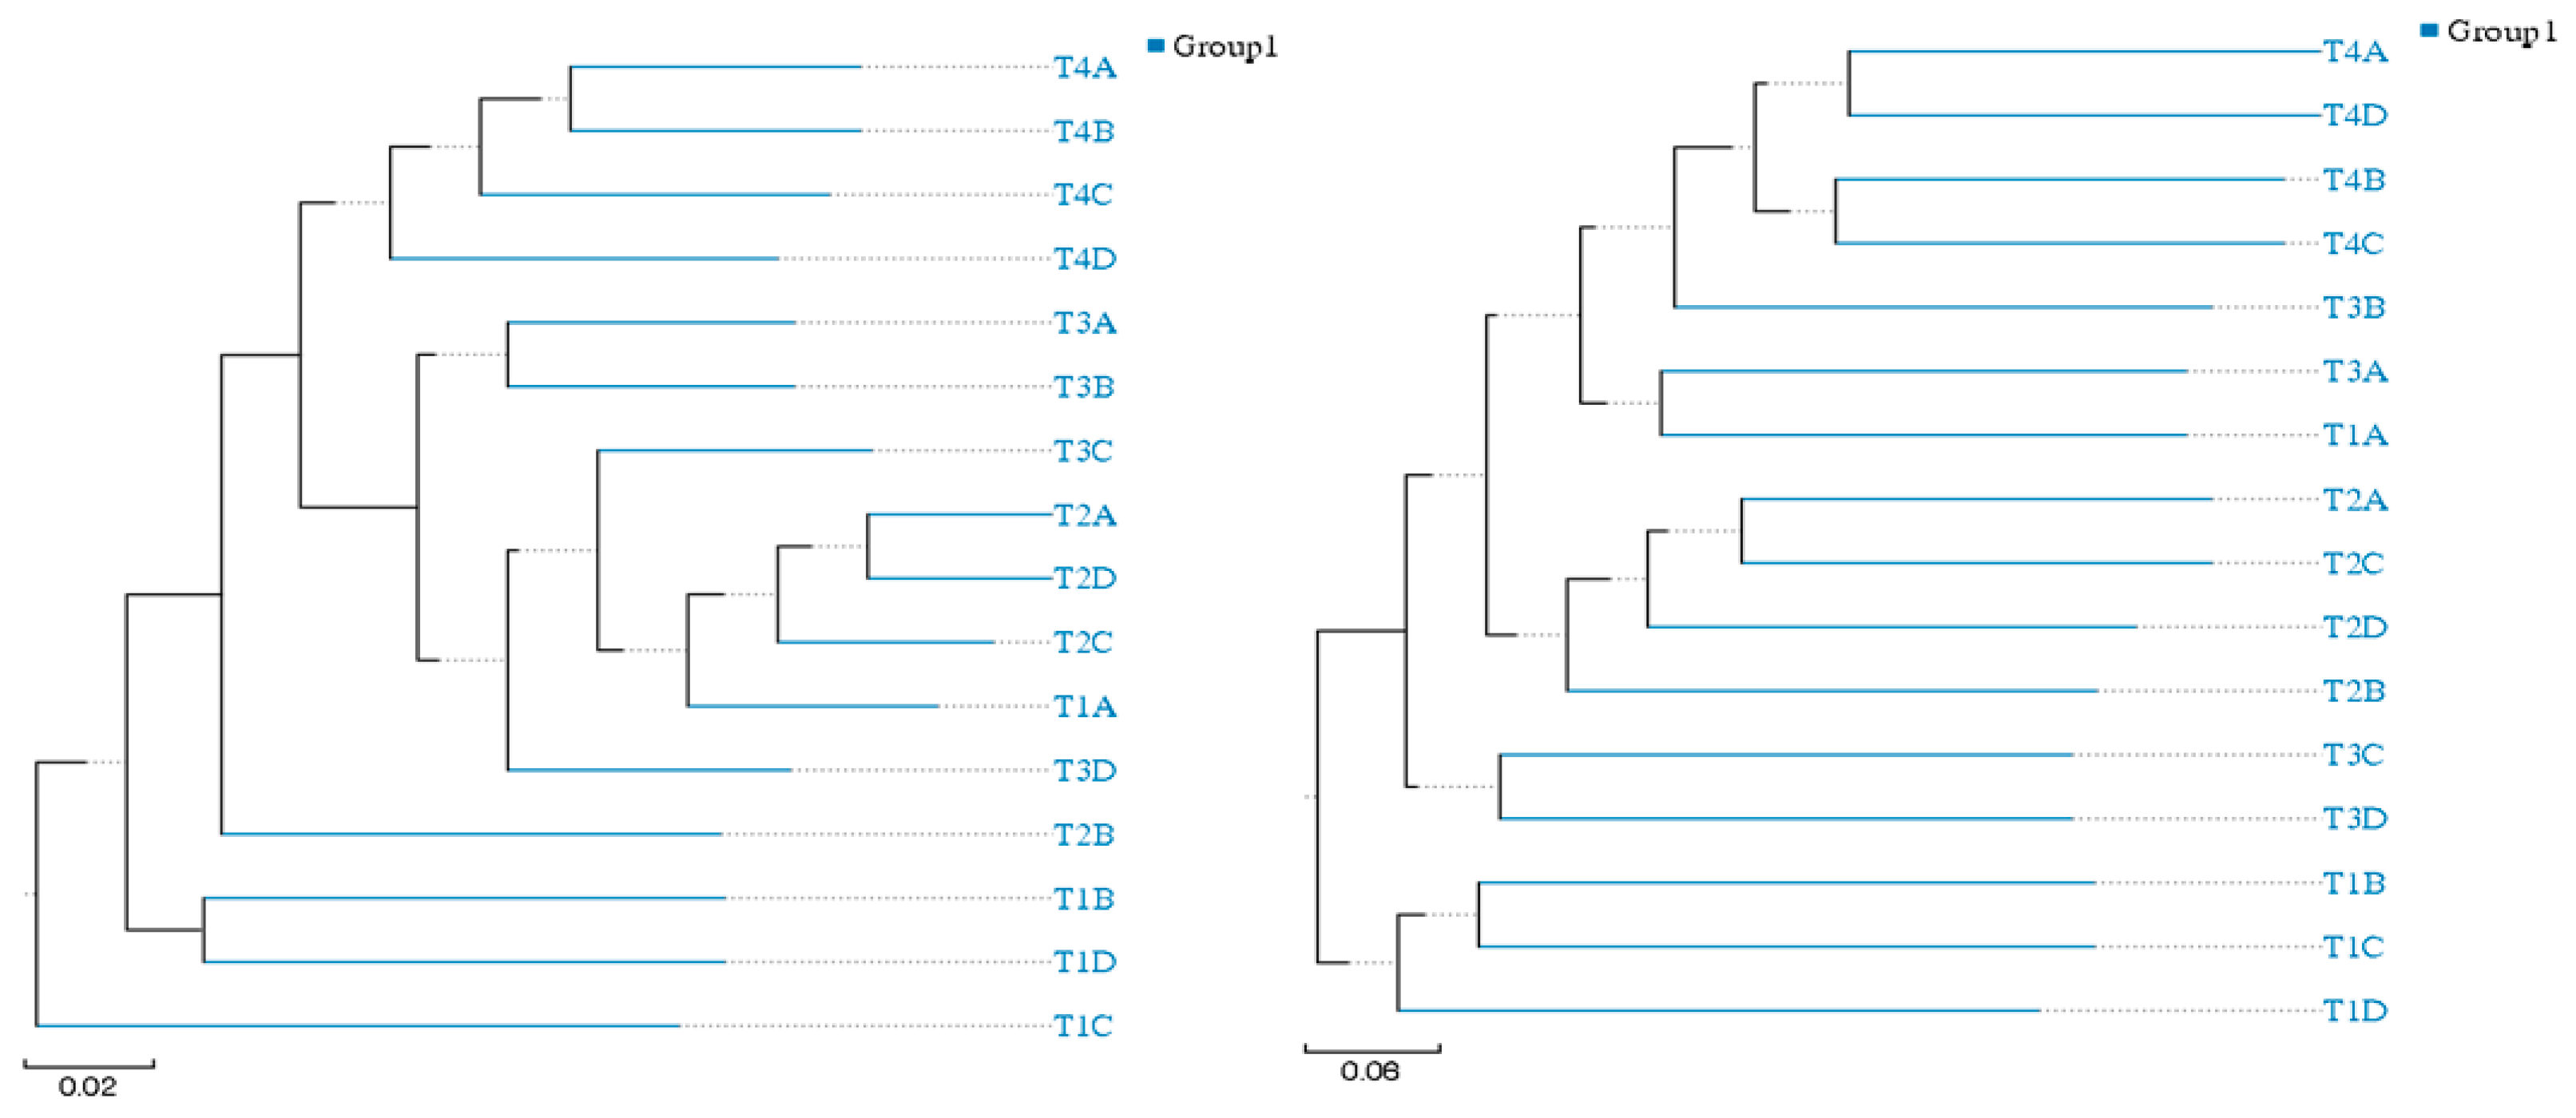
Beta diversity analysis compares the degree of similarity that exists in terms of species diversity among different samples. As shown in Figure 12, the closer the samples are, the shorter the branch length is, indicating that the species compositions of the two samples are more similar. Comparing the differences in species composition among the different mesocosm treatments (Figure 12), the bacterial abundance of the T1C sample was the least similar to that of the other samples, the bacterial abundances of the T1, T2, and T3 treatments were more similar, and the four samples of the T4 treatment were less similar to those of the other treatments. In terms of the species clustering of the fungal community, the evolutionary tree had more branches, indicating that there were more differences in the species communities of the treatments, in which the T1 treatment and the T3 treatment presented the greatest similarity, whereas the samples from the T2 and T4 treatments presented significant differences in species abundance, indicating that increasing the time of intertillage could increase the community differences in soil microorganisms and decrease the similarity of soil microbial abundance.
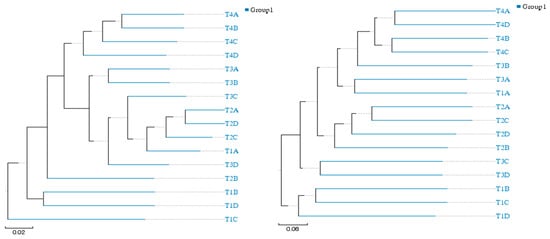
Figure 12.
Cluster tree of oil bacteria and fungi via UPGMA. T1: During the V2–V3 stage, few samples were enriched; during the V4–V5 stage, a medium quantity of samples were enriched; and during the V6–V7 stage, a considerable quantity of samples were enriched. T2: During the 4–5 days after the broadcast, a small quantity of earth is present; during the V4–V5 stage, a medium quantity of earth is present; and during the V6–V7 stage, a considerable quantity of earth is present. T3: During the V2–V3 stage, subsoiling was performed at depths of 25–30 cm; during the V4–V5 stage, subsoiling was performed at depths of 30–35 cm, and a moderate quantity of earthing-up occurred; and during the V6–V7 stage, a considerable quantity of earthing-up occurred. T4: During the 4–5 days after the broadcast, subsoiling is performed at depths of 25–30 cm; during the V4–V5 stage, subsoiling occurs at depths of 30–35 cm + medium quantity of earth; and during the V6–V7 stage, a considerable quantity of earth is present.
3.3. Effects of Different Intertillage Practices on Soybean Yield and Quality
Effects of Different Intertillage Practices on Soybean Yield and Yield Component Factors
The soybean yield data (Table 6) revealed that the yield in 2020 was greater than that in 2021, and the trend was consistent among the treatments, but the upper and lower data differed greatly. In 2020, the yields of the T2, T3, and T4 treatments were significantly greater than that of T1 (p < 0.05), and under the same depth of intertillage, the yield of the T2 treatment was greater than that of the T1 treatment, with an increase of 12.74%. In 2021, the yields among the treatments were ranked from largest to smallest as T4 > T5 > T6 > T3 > T2 > T1, which was consistent with the trend in 2020, in which the T4 treatment had significantly greater yields than the T6 treatment by 11.01% compared with those of the early subsoiling treatments (T4, T5, and T6), suggesting that the T4 treatment could improve the soil environment and favor an increase in soybean yield.
Table 6.
Effects of different intertillage measures on soybean yield and quality.
As shown in Table 6, there was no significant difference in protein content among the treatments in 2020. The determination of soybean quality in 2021 revealed a difference in protein content between different mesocosm treatments, which did not reach a significant level. Compared with that of the T2 treatment, there was no significant difference in protein content among the treatments with the same mesocosm depth.
4. Discussion
4.1. Effects of Different Tillage Practices on Soil Chemical Properties
Intertillage regulates soil hydrothermal conditions by changing the soil’s physical structure, which in turn affects soil chemical properties. A large number of studies have shown that the long-term use of a single cultivation mode and traditional intertillage methods results in a decrease in the soil pH [19], an increase in conductivity [20], and an increase in soluble salt content [21] and other soil quality degradation phenomena, which reduce the content of soil organic matter and destroy the balance of soil nutrients. On the other hand, scientific and reasonable intertillage methods can play a certain role in protecting the soil and increasing the effectiveness of soil nutrients [22,23]. In this study, an analysis of the changes in soil pH under different intertillage measures revealed that the soil pH values under the subsoiling treatments (T3, T4, T5, and T6) were all in the range of 6.3–6.7, which was significantly greater than those under the soil cultivation treatments (T1 and T2), suggesting that the depth of tillage is the main factor affecting soil pH.
Soil nutrients, as a comprehensive manifestation of the basic fertility and physicochemical properties of the soil, are strongly influenced by anthropogenic fertilization and mechanical tillage [24]. Among the soil nutrients, soil organic carbon and nitrogen are important influences on the primary production of crops, and their content and effectiveness are among the main factors affecting crop yield [25]. Moreover, after fertilizers are applied to the soil, various available nutrients (alkali-dissolved nitrogen, available phosphorus, available potassium, etc.) are nutrients that can be directly absorbed by the crop in the current season, the content of which is highly important for evaluating the intensity of the soil nutrient supply [26]. In this study, soil nutrients were measured in the soil at the maturity stage for two consecutive years, and the soil organic carbon, total nitrogen, available potassium, and available phosphorus contents increased after deep polishing. On the basis of early deep polishing, the increase in available nutrients was greater during the deep polishing period of V4–V5, which was attributed mainly to the improved tillage structure of the soil under the deep polishing treatment. This was attributed mainly to the improved tillage structure of the soil under the subsoiling treatment, which significantly improved the retention of soil nutrients. Since high soybean yields require a high nitrogen supply and soil carbon and nitrogen transformation are extremely critical to soybean development, further studies of the trends of soil carbon and nitrogen contents during soybean growth and development with different intertillage measures are needed. The results of the present study revealed that the soil carbon and nitrogen contents in the early stage of soybean fertility were key to the supply of carbon and nitrogen during the whole developmental stage of soybean in the V5–R8 period between treatments and that early deep loosening was the key to the supply of carbon and nitrogen throughout the whole developmental period of soybean. Early subsoiling treatment during the whole developmental period of soybean carbon and nitrogen content is maintained at a high level, possibly because subsoiling occurs 4–5 days after soybean sowing, which combines the virtual and real tillage structures at the same time to improve the interroot soil hydrothermal characteristics and microbial activity, microbes and the soil interact with each other, improve the ability to mineralize the soil, promote the operation of the soil nutrients to the plant, and subsoil the deeper layer of cultivated soil.
4.2. Effects of Different Intertillage Measures on Soil Microbial Properties
As important components of the soil ecosystem, soil microorganisms play important roles in soil structure changes, nutrient regulation, material exchange, energy flow, and the promotion of crop growth [27]. Many studies have shown that reasonable intertillage measures can effectively improve the soil ecosystem, increase soil microbial diversity, promote synergistic mutualistic effects between soil microbes and plants, and improve the self-regulation and retention capacity of farmlands [28]. Under natural conditions, the adaptability of Aspergillus is relatively strong, and this phylum is characterized by the presence of pathogenic bacteria, as well as beneficial genera to inhibit pathogenic bacteria, whereas Acidobacteria has ecological functions such as degradation of plant residues and participation in nutrient cycling and is relatively prone to exist in a weakly acidic soil environment [29]. Among the treatments, the abundance of the dominant bacterial phyla was greater in the early tillage period and during deeper loosening, which indicated that the appropriate adjustment of the time and depth of tillage was conducive to increasing the abundance of microbial-specific fungi in the soil, which in turn enriched the ecological functions of the soil bacterial communities.
The duration of tillage significantly increased the abundance of Ascomycota, etc. The duration of intertillage significantly increased the abundance of Ascomycota, etc. The soil bacterial and fungal communities were further determined at the genus level. As an important genus in the symbiotic nitrogen fixation system of legume crops, Bradyrhizobium improved the nitrogen enhancement effect of symbiotic bacteria through the symbiotic nitrogen fixation mechanism with the soybean root system, effectively improved the effectiveness of soil nitrogen, and was highly important for nitrogen fixation and the growth and development of soybean rhizomes [30]. Pseudomallei utilizes soil antibiotics to absorb harmful elements in the soil and reacts with soil H2 to promote gas exchange and energy release [31]. The synergistic effect of Sphingomonas with exogenous alginate can improve the tolerance of soybean plants to drought stress [32]. The increase in the above three genera in subsoiling-treated soils promotes nitrogen uptake by soybean plants and the root system environment of gas and energy conversion, which also specifically explains why the soil nitrogen content and mineralization capacity of the subsoiling treatment and soybean nitrogen fertilizer bias productivity were greater than those of the soil cultivation treatment in this study, from the perspective of biological factors. The soybean brown stem rot fungus of Cadophora can erode various organs of soybean plants and destroy the morphological characteristics and physiological systems of soybean, leading to wilting of the soybean growth state and impeding yield [33], which also indicates that the proportion of the genus of disease-causing fungi in the soil cultivation treatment was greater than that in the deep loosening treatment, increasing the nitrogen content and mineralization capacity of the soybean and its nitrogen fertilizer bias productivity in this study’s subsoiling treatment, which increased the risk of soybean yield reduction due to disease infestation. In addition, the proportions of the genera Mortierella and Tausonia were greater in subsoiling-treated soils than in control soils, and Mortierella is one of the most important genera that forms symbiotic relationships with the soybean root system and increases nutrient content [34]. Tausonia can adsorb harmful metals in the soil and reduce the negative effects of harmful metals on soybean growth [35], indicating that the advantageous fungal genera of subsoiling treatment can improve the soil structure, facilitate soybean growth, and provide favorable conditions for high soybean yield.
In the alpha and beta diversity analysis of the soil microbial communities, the effects of deep pine on the soil fungal communities were more obvious, and the abundance and uniformity of fungal species were greater under deep pine treatment, which was also enhanced in terms of the Chao1 and Ace indices, which is consistent with the results of a previous study [36]. The increase in intertillage time with increasing species abundance increased the differences in the soil microbial community, and the similarity in the soil microbial abundance decreased. The response of soil microorganisms in soybean fields to intertillage is very sensitive, and it is worthwhile to explore in depth how to regulate and improve soil microbial characteristics in soybean fields by changing intertillage measures. Moreover, further detection and analysis of the functionality of different dominant taxa can play a certain role in guiding the setting of scientific and reasonable intertillage measures.
4.3. Effects of Different Tillage Measures on Soybean Yield
Through the analysis of soybean yield and its constituent factors under different intertillage measures, it was found that, compared with conventional soil cultivation, increasing the time of intertillage and deep polishing and their combined effects were conducive to increasing soybean yield. Combined with the 2-year experimental data, the effects of early deep polishing on soybean yield increase and quality improvement were obvious and promoted an improvement in soybean yield, which was attributed to the fact that the early deep polishing treatment created better soil hydrothermal conditions, improved nutrient absorption efficiency, and then guaranteed the supply of dry matter for grain transfer to increase the yield of soybeans. Moreover, in this study, the protein content of soybeans in 2021 was greater than that in 2020. The soybean varieties in the two-year experiment were the same, and the soil texture was the same; thus, the differences in soybean quality in different years were due mainly to the significant increase in water demand during the flowering stage (mid-to-early July) of soybeans in 2021. There was sufficient rainfall and heat in the local area during that period, and the temperature was suitable (with a low daily maximum temperature) during the reproductive growth stage (late August–early September), both of which are favorable for the formation and accumulation of soybean protein [37,38]. In addition, the critical period of soybean seed completion in 2021 suffered from flooding, while the overall rainfall in 2020 was moderate, with sufficient light energy and heat, which led to an increase in the overall yield of all the treatments in 2020 compared with that in 2021.
5. Conclusions
Compared with the soil cultivation treatments (T1, T2) and the conventional subsoiling treatment (T3), the early subsoiling treatments (T4, T5, and T6) had excellent soil chemical properties, high species diversity and richness, and higher soybean yields. Among the early subsoiling treatments (T4, T5, and T6), the T4 treatment adopted subsoiling and intertillage in the V4–V5 combined mode, which had optimal soil chemical properties, high species diversity and richness, and the highest yield in two consecutive years, and the improvement effect of the T5 treatment was greater than that of the T6 treatment.
Therefore, the intertillage measures of one deep loosening and one medium soil cultivation in the V4–V5 period and one large soil cultivation in the V6–V7 period can be adopted on the basis of early deep loosening 4–5 d after soybean sowing to achieve high soybean yields.
Author Contributions
M.Z. performed conceptualization, methodology, validation, formal analysis, investigation, resources, data curation, writing—original draft preparation, writing—review and editing, visualization, project administration, and funding acquisition; Y.Z. performed the conceptualization, methodology, validation, and formal analysis, conceived and designed the experiments, analyzed the data, prepared the figures and/or tables, authored or reviewed the drafts of the article, and approved the final draft; C.L., C.Y., M.S., Y.F., Z.Y., L.R. and L.C. performed the experiments, prepared figures and/or tables, and approved the final draft; C.W. performed the conceptualization, methodology, validation, formal analysis, and conceived and designed the experiments. All authors have read and agreed to the published version of the manuscript.
Funding
This research was funded by the Natural Science Foundation Project of Heilongjiang Province (LH2022D019), the Postdoctoral Scientific Research Startup Fund Project of Heilongjiang Province (LBH-Q21162), Scientific and Technological Innovation Projects (2023DZD0403106), and the Low-carbon Green Agriculture of Grain Crops Project (LJGXCG2022-107). The funders had no role in the study design, data collection and analysis, decision to publish, or preparation of the manuscript.
Data Availability Statement
Data are contained within the article.
Conflicts of Interest
The authors declare that they have no known competing financial interests or personal relationships that could have influenced the work reported in this paper.
References
- Dar, A.; Zahir, Z.A.; Iqbal, M.; Mehmood, A.; Javed, A.; Hussain, A.; Bushra; Ahmad, M. Efficacy of rhizobacterial exopolysaccharides in improving plant growth, physiology, and soil properties. Environ. Monit. Assess. 2021, 193, 515. [Google Scholar] [CrossRef] [PubMed]
- Alinejadian-Bidabadi, A.; Maleki, A.; Roshaniyan, M. The impact of intertillage systems and crop residues on microbial mass and soil structure stability indices. Span. J. Agric. Res. 2021, 19, e1101. [Google Scholar] [CrossRef]
- Bach, E.M.; Williams, R.J.; Hargreaves, S.K.; Yang, F.; Hofmockel, K.S. Greatest soil microbial diversity found in microhabitats. Soil Biol. Biochem. 2018, 118, 217–226. [Google Scholar] [CrossRef]
- Nannipieri, P.; Ascher-Jenull, J.; Ceccherini, M.T.; Pietramellara, G.; Renella, G.; Schloter, M. Beyond microbial diversity for predicting soil functions: A mini review. Pedosphere 2020, 30, 5–17. [Google Scholar] [CrossRef]
- Hu, J.M.; Chen, S.N.; Wei, X.H.; Xia, X.; Wei, B.H. Effects of Tillage Model on Healthy Plow Layer Structure and Its Development Trends. J. Agric. Resour. Environ. 2018, 35, 95–103. [Google Scholar]
- Zhang, M.C. Effect of Starter-N Plus Topdressing N on Photosynthetic Capacity of Soybean Plants with Different Densities. Ph.D. Thesis, Northeast Agricultural University, Harbin, China, 2013. [Google Scholar]
- Guo, J.H.; Liu, X.J.; Zhang, Y. Significant acidification in major Chinese croplands. Science 2010, 327, 1008–1010. [Google Scholar] [CrossRef]
- Jin, H.Y.; Xie, Y.X.; Li, M.D.; Liu, M.J.; He, D.X.; Feng, W.; Wang, C.Y.; Guo, T.C. Effects of Annual Continuous Tillage on Soil Water Conservation and Crop Yield in Lime Concretion Black Soil Farmland. J. Integr. Agric. 2016, 49, 3239–3250. [Google Scholar]
- Yan, W.P.; Zhang, L.H.; Xu, C.; Zhao, H.X.; Tan, G.B.; Sun, N.; Li, F.; Bian, S.F. Effects of Subsoiling in Alternate Years on Soil Properties, Root Activity and Water Use Efficiency. Acta Agric. Boreali-Sin. 2020, 35 (Suppl. S1), 306–314. [Google Scholar]
- Dong, S.; Zhang, J.; Li, Y.; Liu, S.; Dong, Q.; Zhou, H.; Yeomans, J.; Li, Y.; Li, S.; Gao, X. Effect of grassland degradation on aggregate-associated soil organic carbon of alpine grassland ecosystems in the Qinghai-Tibetan Plateau. Eur. J. Soil Sci. 2020, 71, 69–79. [Google Scholar] [CrossRef]
- Shen, Q.; Wu, M.; Zhang, M. Accumulation and relationship of metals in different soil aggregate fractions along soil profiles. J. Environ. Sci. 2022, 115, 47–54. [Google Scholar] [CrossRef] [PubMed]
- Zhang, Z.Z.; Ma, M.; Zhang, X.L. Effect of subsoiling on soil nutrient and microbe functional diversity of Glycyrrhiza uralensis rhizospheres. Acta Ecol. Sin. 2017, 37, 5137–5145. [Google Scholar]
- Li, J. Long-Term Tillage Impacts on Soil Aggregate Organic Carbon and Microbial Community Diversity. Master’s Thesis, Chinese Academy of Agricultural Sciences, Beijing, China, 2014. [Google Scholar]
- Jahangir, M.M.R.; Jahan, I.; Mumu, N.J. Management of Soil Resources for Sustainable Development under a Changing Climate. J. Environ. Sci. Nat. Resour. 2018, 11, 159–170. [Google Scholar] [CrossRef]
- Guan, H.L.; Fan, J.W.; Zhang, H.Y.; Harris, W. Comparison of drives of soil microbial communities developed in karst ecosystems with shallow and deep soil depths. Agronomy 2021, 11, 173. [Google Scholar] [CrossRef]
- Carter, M.R. Soil Sampling and Methods of Analysis; CRC Press: Boca Raton, FL, USA, 2007. [Google Scholar]
- Bao, S.D. Soil Agrochemical Analysis, 3rd ed.; China Agriculture Press: Beijing, China, 2000. [Google Scholar]
- GB/T 24870-2010; Inspection of Grain and Oils-Crude Protein and Crude Fat Determination in Soybean- Near-Infrared Method. Standards Press of China: Beijing, China, 2010.
- Luo, S.; Gao, H.R.; Tao, Q.; Hu, J.Y.; Yang, Y. Influence of Soil Mechanical Composition on the AtterbergLimits in the Slope Farmland of Central Guizhou. Chin. J. Soil Sci. 2020, 51, 7. [Google Scholar]
- Naeem, M.; Mehboob, N.; Farooq, M.; Farooq, S.; Hussain, S.; Ali, H.M.; Hussain, M. Impact of Different Barley-Based Cropping Systems on Soil Physicochemical Properties and Barley Growth under Conventional and Conservation intertillage Systems. Agronomy 2020, 11, 8. [Google Scholar] [CrossRef]
- Mo, F.; Zhang, Y.Y.; Liu, Y.; Liao, Y.C. Microbial carbon-use efficiency and straw-induced priming effect within soil aggregates are regulated by intertillage history and balanced nutrient supply. Biol. Fertil. Soils 2021, 57, 409–420. [Google Scholar] [CrossRef]
- Wang, X.; Qi, J.Y.; Zhang, X.Z.; Li, S.S.; Virk, A.L.; Zhao, X.; Xiao, X.P.; Zhang, H.L. Effects of intertillage and residue management on soil aggregates and associated carbon storage in a double paddy cropping system. Soil Intertillage Res. 2019, 194, 104339. [Google Scholar] [CrossRef]
- Lei, J.; Lei, X.; Zhou, L.; He, J.; Jia, A.; Yu, J.; Zhang, H.; Lu, F. Effects of tillage measures on soil nutrients distribution and fertilizer use efficiency on gentle slope farmland. Trans. Chin. Soc. Agric. Eng. 2020, 36, 127–134. [Google Scholar]
- Pu, J.; Shi, D.M.; Lou, Y.B.; Duan, T.; Song, G. Effect of Different Tillage Depth on Soil Properties of Plowing Layer in Slope Cultivated Land of Red Soil. J. Soil Water Conserv. 2019, 33, 8–14. [Google Scholar]
- Shen, Y.; Zhang, T.; Cui, J.; Chen, S.; Han, H.; Ning, T. Subsoiling increases aggregate-associated organic carbon, dry matter, and maize yield on the North China Plain. PeerJ 2021, 9, e11099. [Google Scholar] [CrossRef] [PubMed]
- Mahal, N.K.; Osterholz, W.R.; Miguez, F.E.; Poffenbarger, H.J.; Sawyer, J.E.; Olk, D.C.; Archontoulis, S.; Castellano, M.J. Nitrogen fertilizer suppresses mineralization of soil organic matter in maize agroecosystems. Front. Ecol. Evol. 2019, 7, 59. [Google Scholar] [CrossRef]
- Wang, L.F.; Zhang, D.J.; Zhang, T.T. Effects of Tillage Methods on Soil Microbial Community Diversity in Oat Fields. Crop J. 2021, 37, 57–64. [Google Scholar]
- Chen, H.J.; Zhao, S.H.; Zhao, J.M.; Zhang, K.; Jiang, J.; Guan, Z.; Chen, S.; Chen, F.; Fang, W. Deep intertillage combined with biofertilizer following soil fumigation improved chrysanthemum growth by regulating the soil microbiome. Microbiol. Open 2020, 9, e1045. [Google Scholar] [CrossRef] [PubMed]
- Gajda, A.M.; Czyż, E.A.; Dexter, A.R.; Furtak, K.M.; Grządziel, J.; Stanek-Tarkowska, J. Effects of different soil management practices on soil properties and microbial diversity. Int. Agrophys. 2018, 32, 135–145. [Google Scholar] [CrossRef]
- Zhu, J. Desiccation Tolerance of Bradyrhizobium Japonicum5038 and ITS Response Mechanisms to Different Water Stresses. Ph.D. Thesis, Inner Mongolia University, Hohhot, China, 2021. [Google Scholar]
- Willms, M.I.; Rudolph, A.Y.; Gschel, I.; Bolz, S.H.; Schneider, D.; Penone, C.; Poehlein, A.; Schöning, I.; Nacke, H. Globally abundant “Candidatus Udaeobacter” benefits from release of antibiotics in soil and potentially performs trace gas scavenging. mSphere 2020, 5, e00186-20. [Google Scholar] [CrossRef]
- Asaf, S.; Khan, A.L.; Khan, M.A.; Imran, Q.M.; Yun, B.W.; Lee, I.J. Osmoprotective functions conferred to soybean plants via in oculation with Sphingomonas sp. LK11 and exogenous trehalose. Microbiol. Res. 2017, 205, 135. [Google Scholar] [CrossRef] [PubMed]
- Gao, Y.H.; Zheng, Z.H.; Zhang, Y.; Hu, Y.; Wang, X. Mechanism of rhizosphere microecology in controlling soil-borne fungal diseases: A review. J. China Agric. Univ. 2021, 26, 100–113. [Google Scholar]
- Chang, L.; Lu, H.; Chen, H.; Tang, X.; Zhao, J.; Zhang, H.; Chen, Y.Q.; Chen, W. Lipid metabolism research in oleaginous fungus Mortierella alpina: Current progress and future prospects. Biotechnol. Adv. 2021, 54, 107794. [Google Scholar] [CrossRef] [PubMed]
- Wang, Q.; Liang, A.; Chen, X.; Zhang, S.; Zhang, Y.; McLaughlin, N.B.; Gao, Y.; Jia, S. The impact of cropping system, tillage and season on shaping soil fungal community in a long-term field trial. Eur. J. Soil Biol. 2021, 102, 103253. [Google Scholar] [CrossRef]
- Gałązka, A.; Gawryjołek, K.; Frąc, J.G.; Księżak, J. Microbial community diversity and the interacion of soil under maize growth in different cultivation techniques. Plant Soil Environ. 2017, 63, 264–270. [Google Scholar] [CrossRef]
- Wang, H.Z.; Tang, H.Y.; Niu, D.; Lv, M. Study on Meteorological Forecasting Method of Key Quality Components in Soybean. Soybean Sci. 2021, 40, 112–121. [Google Scholar]
- Song, W.W. Studies of Soybean Function Component Distribution Across China and Analysis on the Environmental Influences. Ph.D. Thesis, Chinese Academy of Agricultural Sciences, Beijing, China, 2018. [Google Scholar]

Disclaimer/Publisher’s Note: The statements, opinions and data contained in all publications are solely those of the individual author(s) and contributor(s) and not of MDPI and/or the editor(s). MDPI and/or the editor(s) disclaim responsibility for any injury to people or property resulting from any ideas, methods, instructions or products referred to in the content. |
© 2025 by the authors. Licensee MDPI, Basel, Switzerland. This article is an open access article distributed under the terms and conditions of the Creative Commons Attribution (CC BY) license (https://creativecommons.org/licenses/by/4.0/).