Article

Overexpression of the GmPM35 Gene Significantly Enhances Drought Tolerance in Transgenic Arabidopsis and Soybean

1
College of Agriculture, Jilin Agricultural University, Changchun 130118, China
2
Liaoyuan Academy of Agricultural Sciences, Liaoyuan 136200, China
3
Tianjin Ringpu Bio-Technology Co., Ltd., Tianjin 300308, China
4
Academy of Agricultural Sciences, Yanbian Korean Autonomous Prefecture, Yanbian 133000, China
5
Joint International Research Laboratory of Modern Agricultural Technology, Ministry of Education, Jilin Agricultural University, Changchun 130118, China
6
Soybean Research Institute, Jilin Academy of Agricultural Sciences (Northeast Agricultural Research Center of China)/National Engineering Research Center for Soybean, Changchun 130033, China
*
Authors to whom correspondence should be addressed.
These authors contributed equally to this work.
Agronomy 2025, 15(1), 192; https://doi.org/10.3390/agronomy15010192
Submission received: 18 November 2024 / Revised: 24 December 2024 / Accepted: 8 January 2025 / Published: 15 January 2025
(This article belongs to the Section Crop Breeding and Genetics)

Abstract

:
Drought stress is one of the major adversity stresses affecting soybean (Glycine max [L.] Merr.) yield. Late embryogenesis abundant protein (LEA protein) is a large family of proteins widely distributed in various types of organisms, and this class of proteins plays an important role in protecting proteins, membrane lipids, and lipids inside the cell. The soybean GmPM35 gene is a member of the LEA_6 subfamily. The expression of the GmPM35 gene was significantly increased after drought stress in soybeans. A subcellular localization assay confirmed that the gene acts on the cell membrane. Against wild-type Arabidopsis thaliana, we found that Arabidopsis lines overexpressing the GmPM35 gene were significantly more drought-tolerant at germination and seedling stages under drought stress. To further investigate the drought tolerance function of this gene in soybeans, nine overexpression lines of the T3 generation soybean GmPM35 gene and two editing lines of the T3 generation soybean GmPM35 gene were obtained by Agrobacterium-mediated method using a wild-type soybean strain (JN28) as a receptor. Germination rate, root length, chlorophyll (CHL) content, Proline (Pro) content, malondialdehyde (MDA) content, superoxide anion (O2•−) content, hydrogen peroxide (H2O2) content, (NBT, DAB) staining, and activities of antioxidant enzymes (CAT, SOD, POD), and photosynthetic physiological indexes of the three different types of strains were measured and analyzed before and after drought stress. Combined with the results of rehydration experiments and physiological and biochemical indices, we found that overexpression of the GmPM35 gene protected the activities of antioxidant enzymes under drought stress. The activities of superoxide dismutase (SOD), catalase (CAT), and peroxidase (POD) were increased by an average of 34.28%, 26.12%, and 30.01%, respectively, in soybean plants overexpressing the GmPM35 gene compared with wild-type soybeans. Under drought stress conditions, soybean plants overexpressing the GmPM35 gene showed an average increase of 76.81% in photosynthesis rate (Pn), 39.8% in transpiration rate (Tr), 126% in stomatal conductance (Gs), 47.71% in intercellular CO2 concentration (Ci), and 26.44% in instantaneous water use efficiency (WUEi). The improvement of these indexes helped to reduce the accumulation of reactive oxygen species (ROS) in the plants. In addition, we found that under drought stress, the MDA content was reduced by an average of 18.8%, and the Pro content was increased by an average of 60.14% in soybean plants overexpressing the GmPM35 gene, and the changes in these indexes indicated that the plants had stronger antioxidant and osmoregulatory capacities in response to drought stress. In summary, this experiment demonstrated that the GmPM35 gene plays an important role in soybean tolerance to drought stress, and by overexpressing the GmPM35 gene, soybean plants can better tolerate drought stress and maintain normal physiological functions.

1. Introduction

Soybean (Glycine max (L.) Merr.) is an important food and cash crop. As global climate change and human activities intensify, the adverse effects of arid environments on crop growth are deepening [1,2,3]. Like other crops, soybean growth and yield are threatened by persistent global drought and expected climate change [4]. Drought stress affects soybean growth and yield by influencing plant regulation at morphological, biochemical, and molecular levels [5]. Therefore, it is important to utilize biotechnology to enhance drought tolerance in soybean germplasm.
Late embryonic developmentally enriched (LEA) proteins are a large family of proteins that are widely distributed in higher plants [6,7,8]. LEA proteins play important roles in the protection of plant cells against abiotic stresses and in the regulation of plant growth and development [9,10]. Based on the similarity of amino acid sequences and conserved motifs, LEA proteins have been mainly categorized into eight families: LEA_1, LEA_2, LEA_3, LEA_4, LEA_5, LEA_6, dehydrin (DHN), and seed maturation protein (SMP) [11,12]. Genome-wide identification and analysis of the relevant gene families have now been performed in several plant species, including soybean and maize [13,14,15,16,17,18,19,20,21,22]. The analysis revealed that abiotic stress conditions (e.g., cold, salt, and drought) can result in the induced expression of a large number of related LEA genes in different species [23,24]. When plants are subjected to drought stress, cellular homeostasis is affected, leading to disruption of photosynthesis and increased accumulation of reactive oxygen species (ROS), which triggers oxidative stress [25]. Several studies have found that soybean LEA_4 subfamily members GmPM1 and GmPM9 proteins can scavenge ROS in plants and slow down the oxidative stress response by binding to metal ions. Overexpression of soybean GmDHN9 and GmLEA4_19 genes in Arabidopsis thaliana reduced the accumulation of ROS by enhancing the activity of antioxidant enzymes, which in turn enhanced the drought tolerance of transgenic Arabidopsis thaliana [26,27]. Therefore, relevant studies have shown that soybean LEA proteins have an important role in enhancing drought tolerance in plants.
By further exploring and utilizing the function and expression regulation of soybean LEA proteins, we can gain a more comprehensive understanding of the physiological and biochemical mechanisms of plant response to drought and provide a theoretical basis for expanding the drought-tolerant genetic resources of soybeans and developing new drought-tolerant varieties. In this study, we found that overexpression of the LEA_6 subfamily gene, GmPM35, increased the activity of antioxidant enzymes and photosynthesis in soybean plants, reduced the accumulation of ROS in plants, and resulted in better agronomic traits and drought tolerance in the field. This will lay the foundation for the subsequent application in breeding.

2. Materials and Methods

2.1. Plant Material and Growing Conditions

Columbia Arabidopsis (Arabidopsis thaliana (L.) Heynh.), GmPM35-overexpressing transgenic Arabidopsis thaliana, soybean (Glycine max) cultivar JN28, GmPM35-gene-edited soybean, and GmPM35-overexpressing transgenic soybean were used for analysis. Plants were grown in an artificial climate chamber under light time (light–dark = 16 h:8 h), the indoor temperature of 25 °C during the day and 22 °C at night, relative humidity of 55–65%, and light intensity of 1000 lx [27].
The field test materials were planted in the field of the experimental base of Jilin Agricultural University in Changchun City, Jilin Province, which is at an altitude of 224.14 m above sea level, with a latitude of N43°48′48.98″ N and a longitude of E125°19′1.40″, belongs to temperate continental semi-humid monsoon climate type.

2.2. Preparation of Experimental Materials

2.2.1. Construction of Overexpression and Gene-Edited Vectors

The coding sequence (CDS) of GmPM35 without a stop codon was amplified using recombinant pMD-18T-GmPM35 as a template and specific primers (34xin-UP/LOW). The plant overexpression vector pCAMBIA3301 was linearized using Nco I and BstE II restriction enzymes, ligated with the GmPM35 CDS using T4 DNA ligase, and transformed. Correct clones were verified by PCR and sequencing. The T-DNA structure of the overexpression vector is shown in Supplementary Figure S1.
Based on the nucleotide sequence of the conserved structural domain of the gene, Oligo primers (34CRIb-UP/LOW) were designed for 1 pair of gRNA target sequences, and the individual reagents were added according to Supplementary Table S4 and mixed well, and the incubator was 95 °C for 3 min and then decreased to 20 °C at 0.2 °C per second. The reaction solution from the previous step was added according to Supplementary Table S5, and the incubator was incubated at 20 °C for 1 h and transformed into E. coli. Single colonies were picked into (LB + Kan) culture medium, and PCR detection was carried out using primer Cas9-F/R with bacterial fluid and plasmid as templates, respectively. Plasmids with correct bands detected by PCR were identified and compared by sequencing using primer CRI-ce. The structure of the plant-editing vector pCBSG015-GmPM35 is shown in Supplementary Figure S2, and the sequences of the primers used are shown in Supplementary Table S6.

2.2.2. Transformation and Screening of Transgenic Arabidopsis

The constructed recombinant overexpression pCAMBIA3301-GmPM35 vector plasmid was transferred into Agrobacterium tumefaciens strain EHA105, and wild-type Arabidopsis thaliana was transformed by the flower dip method [28]. After Basta screening and PCR detection, T1-generation transgene-positive plants were obtained and propagated into T2-generation plants. The leaves of T2 generation transgenic Arabidopsis thaliana and wild-type Arabidopsis thaliana grown for about 4 weeks were used as materials. The 11 T2 transgenic Arabidopsis plants were analyzed for gene expression, and three transgenic lines with relatively high expression were selected for drought tolerance identification (see Table S6 for primer sequences).

2.2.3. Induction and Detection of Soybean Hairy Roots

A volume of 100 μL of Agrobacterium suspension containing the overexpression vector pCAMBIA3301-GmPM35 or the editing vector pCBSG015-GmPM35 plasmid was evenly spread onto the corresponding culture medium plates, with Agrobacterium strain K599 serving as the control group. The plates were incubated upright for 30 min, followed by inverted incubation at 28 °C in an incubator. On the second day, “JN28” soybean seeds with full grains and pest-free surfaces were selected and planted in moist vermiculite, with moisture maintained throughout the experiment. After approximately 5 days, when the seeds had sprouted to a height of ~4 cm and the cotyledons were not fully expanded, the seedlings were prepared for Agrobacterium injection. The cultured Agrobacterium was carefully scraped from the plate using a sterile blade, and a 1 mL disposable medical syringe was used to extract the bacterial suspension. A “+”-shaped penetration pathway was created at the soybean cotyledonary nodes, into which the bacterial suspension was injected. The injected soybean plants were placed in a water-retaining chamber. Once hairy roots approximately 2 cm in length were induced, a clear plastic cylinder was placed over the soybean plants, and vermiculite was added until the cotyledonary nodes were completely covered. The plants were cultured further using 1/4 Hoagland nutrient solution. After the hairy roots had grown to a sufficient length along the wall of the cylinder, the leaf tips of the plants were pinched off, and the main roots were removed 3 days later. Following a recovery period of 3–4 days, the plants were prepared for subsequent experiments. The experimental procedure followed the method described by Attila Kereszt et al. [29]. The induction process is illustrated in Supplementary Figure S3.
Genomic DNA of hairy root was extracted, and K599 hairy root was used as a control to detect overexpressed soybean hairy root using primers 35S S/AS, Bar S/AS. Gene-edited soybean hairy roots were detected using primers Cas9-F/R, Bar S/AS. Hair roots induced by the editing vector pCBSG015-GmPM35 were detected line by line and sequenced with primer 34ce-UP/LOW. The target sequence was compared with the sequenced sequence using DNAMAN(8.0)software. The mutation efficiency of the target sequence was counted by comparing the changes in the target sequence.

2.2.4. Transformation and Screening of Transgenic Soybean

Soybean transformation was conducted using Agrobacterium-mediated methods [30]. Plump, pest-free soybeans were sterilized with chlorine for 12 h and germinated in the dark for 3 days at 25 °C. After excision of the embryonic axis and cotyledonary nodes, explants were incubated in a pre-culture medium for 3 days before being infiltrated with Agrobacterium containing the overexpression or editing vector for 30 min. Plants were screened, elongated, and rooted in light conditions before transplanting into soil for further analysis.
Soybean plant leaf DNA was extracted, and overexpressed soybean plants were detected by using primers 35S S/AS and Bar S/AS. T0-generation gene-edited soybean plants were detected using primers Cas9-F/R and Bar S/AS. Meanwhile, primer 34ce-UP/LOW was used to sequence the edited plants. The target sequences were compared by DNAMAN(8.0) software, and the mutation results of the target sequences were counted.

2.3. Experimental Procedures

2.3.1. Subcellular Localization

Recombinant pMD-18T-GmPM35 was used as a template for PCR and electrophoresis using a specific primer 1300-F/R in order to amplify the CDS sequence of the GmPM35 gene without a stop codon. Next, the pCAMBIA1300 vector was linearized using both Bgl II and Spe I endonucleases, and the pCAMBIA1300-GmPM35-eGFP recombinant vector was constructed by seamless cloning. The recombinant vector was transformed into Agrobacterium rhizogenes strain GV3101 and injected into tobacco epidermal cells, which were incubated in a dark room at 25 °C for 12 h, and then restored to the light condition for 48 h. The observation was performed by laser confocal microscopy (Leica, Wetzlar, Germany).

2.3.2. RNA Extraction and qRT-PCR Analysis

Total RNA was isolated from the tissues of plant samples using TRIzol reagent (Transgen, Beijing, China) according to the manufacturer’s protocol, and the detailed extraction procedure is shown in Supplementary Figure S4. cDNA was reverse-transcribed according to the instructions of the Reverse Transcription Kit (Transgen, Beijing, China), and the detailed instructions are shown in Supplementary Table S1. The cDNA obtained was stored in a refrigerator at −20 °C for backup. Using the cDNA obtained by reverse transcription as a template, the fluorescence quantification premix was configured using the SYBR Green dye method fluorescence quantification premix kit (Transgen, Beijing, China), and the system was configured according to Supplementary Table S2. The qRT-PCR was performed using a fluorescence quantitative PCR instrument (Agilent Technologies, Santa Clara, CA, USA) according to the procedure in Supplementary Table S3. Soybean tissue-specific expression analysis was performed using GmActin as the internal reference gene, and the internal reference primers GmActin-F/R, 34q-F/R target gene primer. qRT-PCR was performed. Expression pattern analysis was performed using roots of four abiotic stresses at the three-leaf stage of soybean as samples, in which the untreated (0 h) roots were the control group, GmEF1-α was the internal reference gene, and qRT-PCR was performed using the internal reference primers GmEF1-αF/R, 34q-F/R target gene primers. Arabidopsis gene expression analysis was performed by qRT-PCR using the AtEF1-α gene as the internal reference gene, the AtEF1-αF/R internal reference gene primer, and the 34q-F/R target gene primer. The relative expression of the genes was calculated by the 2−∆∆Ct method. Three biological replicates as well as three technical replicates were performed. ANOVA was performed using GraphPad Prism (10.1.2). Detailed information on primers is provided in Supplementary Table S6.

2.3.3. Analysis of Tissue-Specific Expression and Abiotic Stress Expression Patterns

In the outdoor field, roots, stems, leaves, 5 mm pods, 2 cm pods, 3 mm seeds, and mature seeds of soybeans at V1, R3, R4, R5, and R8 stages were taken as samples for tissue-specific assays. When soybeans grew to the three-leaf stage in the artificial culture chamber, they were treated with 100 μM ABA, 10% PEG6000 (Polyethylene Glycol 6000), and 100 mM NaCl solutions for 0, 3, 6, and 12 h. Three soybeans were used as replicates for each treatment, and the selection of the stress concentration was based on Fan et al. [26]. Upon reaching the treatment time point, the leaves of different soybean lines were picked as samples for abiotic stress expression pattern analysis and detection, respectively. Gene expression was analyzed using qRT-PCR.

2.3.4. Detection of Seedling Germination, Green Seedling Rate, Root Length, and Fresh Weight of Arabidopsis thaliana Seedlings

The T3-generation transgenic Arabidopsis seeds were sterilized and planted in 1/2 MS, 1/2 MS + 200 mmol/L mannitol medium at 4 °C in dark culture for 3 days for germination, and the wild-type Arabidopsis thaliana was used as the control, and there were five sets of replicates in each treatment, and the germination and green seedling rates were counted for 7 days. The germination and green seedling rates of Arabidopsis seedlings in the previous step were determined by the results of the incubation. The Arabidopsis germinated in the previous step was cultured vertically, and the root length, fresh weight, and relative elongation rate of Arabidopsis seedlings were counted after 10 days of culture.

2.3.5. Rehydration Test and Physiological and Biochemical Detection Under Drought Stress in Transgenic Arabidopsis thaliana

T2-generation transgenic Arabidopsis thaliana plants were planted in the soil, and Arabidopsis thaliana with essentially uniform growth was selected for natural drought treatment in an artificial climate chamber to observe the growth of control and experimental groups, followed by rehydration, and the recovery of Arabidopsis thaliana in the experimental and control groups after rehydration was observed.
T2-generation transgenic plants and wild-type plants grown vertically in 1/2 MS medium for 3 weeks were transferred to 1/2 MS liquid medium containing 10% PEG6000, and stress treatments were applied for 0 h and 12 h. Nine plants were taken from each group of treatments, respectively. Mature leaves and roots were taken as samples, respectively. Superoxide dismutase (SOD), peroxidase (POD), and catalase (CAT) activities and malondialdehyde (MDA) content were determined using the kit from Beijing Box Sangon Technology Co., (Beijing, China). The experimental methods were performed according to the instructions of the kits, which are listed in Supplementary Table S7. Instruments used for the assay included an enzyme labeler (BioTeK, Winooski, VT, USA) and a spectrophotometer (SHIMADZU, Kyoto, Japan). Each sample was biologically replicated three times.

2.3.6. Root System Changes and Determination of Physiological and Biochemical Indices of Soybean Hairy Roots Under Drought Stress

According to the study of Chen et al. [31], the stress concentration of PEG6000 was determined to be 10%. Drought stress was carried out with 1/4 Hoagland solution containing 10% PEG6000. The hair roots tested positive, and the control group was placed in the solution for 7 days. The hair roots before and after treatment were photographed respectively to observe the changes in their roots. Another batch of hairy root materials was subjected to stress treatment for 0 h and 12 h, and the hairy roots were taken as samples for physiological and biochemical measurements. Superoxide dismutase (SOD), peroxidase (POD), and catalase (CAT) activities and malondialdehyde (MDA) content were determined using the kit of Beijing Box Sangon Technology Co. The experimental methods were performed according to the kit instructions, see Supplementary Table S7 for links to the relevant instructions. Instruments used for the assay included an enzyme labeling instrument (BioTeK, Winooski, VT, USA) and a spectrophotometer (SHIMADZU, Kyoto, Japan). Each sample was biologically replicated three times.

2.3.7. Determination of Germination Rate and Shoot Length of Transgenic Soybean Plants of T3 Generation

From the selected gene-edited, overexpressed, and wild-type lines, 240 soybean seeds were sampled from each group. Seeds were divided into 10 groups of 40 seeds each and placed in petri dishes of 15 mm diameter. The seeds were sterilized with 2% sodium hypochlorite for 30 min, then rinsed thoroughly, dried, and set aside. The pre-treated seeds were spread evenly in Petri dishes with gauze according to strain, 5 groups were simulated normal water treatment, 5 groups were poured into the same volume of 8% PEG6000 solution to simulate drought treatment, and 10 groups of samples were covered with gauze and put into the incubation room, the gauze was cleaned and changed at the same time every day, and the number of seeds germinated and the germination rate of the seeds were investigated after incubation for 7 days at room temperature. The incubation was continued for 7 days, and the germinated seeds in each group were selected to measure the shoot length index.

2.3.8. Rehydration Experiment of T3-Generation Transgenic Soybean Plants

Seeds of screened gene-edited, overexpressed, and wild-type strains were planted in (9 × 10) cm pots. Each strain was planted with 10 plants for 3 sets of replications. Light illumination for 15 h, dark incubation for 9 h, and a constant temperature of 24 °C incubation room were taken for cultivation. The amount of soil in each pot was consistent and watering was quantified each time. The soil water content was measured, and after the soil water content of the soybean to be tested was 75 ± 3%, natural drought stress was carried out for 10 days. When the soil water content was 45 ± 3%, rewatering was carried out, and after 3 days of rewatering, the phenotypes of plants of different strains and their growth conditions were observed.

2.3.9. Determination of Root Length in T3-Generation Transgenic Soybean Plants

The screened gene-edited strains, overexpression strains, as well as seeds of wild-type strains were planted in 9 × 10 cm pots in the same environment in the culture room. Ten plants of each strain were planted for three sets of replications. After the plants reached the three-leaf stage, the plants were removed from the pots, and the root system was washed with water to keep the root system as intact as possible. Data such as root length, root surface area, and root volume were measured using a root scanner (EPSON, Suwa, Japan). The plants were planted back into the soil again to minimize damage to the root system. The data were measured again after 10 days of natural drought. The changes in root length, root surface area, root volume, and root mean stem were compared before and after drought.

2.3.10. Determination of Photosynthetic Physiological Indexes in T3-Generation Positive Plants

A portable photosynthesis tester (TPYN, Hangzhou, China) was used to measure the photosynthetic physiological indexes of different positive strain plants of T3 generation. At 9:00 a.m., the temperature of the leaf chamber was 25 °C, the CO2 concentration was 350 μmol/mol, and the soil moisture content of the samples to be tested was about 75%; the photosynthesis-related indexes such as the net photosynthetic rate, transpiration rate, stomatal conductance, intercellular carbon dioxide concentration, and instantaneous water use efficiency were measured using the photosynthesis analyzer in the leaves of overexpressed, gene-edited, and non-transgenic soybean strains. The leaves were selected as much as possible from the same part of each plant for photosynthesis measurement. A total of 50 plants were tested, and three leaves were taken from each plant, and the results were averaged and repeated three times. The leaf instantaneous water use efficiency rate (leaf instantaneous water use efficiency rate = net photosynthetic rate/transpiration rate) was calculated. After 7 days of natural drought, the data were collected again for both transgenic and non-transgenic strains.

2.3.11. Determination of Biochemical Parameters in T3-Generation Positive Plants

The wild-type and positive soybean lines without stress treatment were used as the control group, and the transgenic and non-transgenic lines treated with 8% PEG6000 solution simulated drought for 16 h were used as the samples of drought-treated groups of leaf parts, and 10 soybean plants with the same period of fertility were selected from each group for experimental determination. Superoxide dismutase (SOD), peroxidase (POD), catalase (CAT) activities, and malondialdehyde (MDA) and chlorophyll (CHL) contents were determined using a kit from Beijing Box Sangon Technology Co. The experimental methods were performed according to the instructions of the kit, and the instruments used for the assay included an enzyme labeler (BioTeK, Vermont, USA) and a spectrophotometer (SHIMADZU, Kyoto, Japan). Each sample was biologically replicated 3 times. Detailed information on the relevant assay instructions is provided in Supplementary Table S7.

2.3.12. T3-Generation Transgenic Plants Reactive Oxygen Species Assay

Wild-type and positive soybean strains without stress treatment were used as the control group, and transgenic and non-transgenic strains treated with 8% PEG6000 solution simulating drought for 16 h were used as samples for the determination of leaf parts in the drought-treated group. Changes in the accumulation of reactive oxygen species in transgenic and non-transgenic lines before and after drought were detected by staining with nitrotetrazolium blue chloride (NBT) and diaminobenzidine (DAB). Leaves of transgenic and non-transgenic lines with uniform growth were taken from the same position and put into the DAB and NBT solutions for overnight staining at room temperature, and then after successful staining, the leaves were put into anhydrous ethanol solution for decolorization in a water bath at 85 °C. Leaf staining was observed after successful decolorization, and three replications were performed for each group; detailed methods were referred to NBT and DAB instructions (Coolaber, Beijing, China) (Supplementary Table S7). Superoxide anion (O2•−) and hydrogen peroxide (H2O2) contents of the transgenic and non-transgenic strains were measured using the kit of Beijing Box Sangon Technology Co. The experimental methods were performed according to the instructions of the kits. Detailed information on the assay instructions is shown in Supplementary Table S7.

2.3.13. Investigation of Agronomic Traits in T2-Generation Transgenic Soybean Plants

In this experiment, seeds of T1-generation transgenic soybeans were planted in the transgenic experimental site of Jilin Agricultural University in May 2023–2024, and the transgenic lines as well as non-transgenic plants were screened and detected after they had grown to the three-leaf stage. The positive soybean lines were harvested, measured, and data processed in October of the same year. Data were analyzed using IBM SPSS Statistics (27.0.1) software.

2.4. Statistical Analysis

Data are expressed as mean ± SD of values obtained in repeated experiments. Differences between data were determined by one-way ANOVA or multiple comparisons and using IBM SPSS Statistics (27.0.1), statistically analyzed and plotted using GraphPad Prism (10.1.2), and were considered to be statistically significant at p < 0.05 (*) or p < 0.01 (**).

3. Results

3.1. Subcellular Localization

The results of subcellular localization showed that the GmPM35 protein was localized to the cell membrane (Figure 1). The homeostasis of the cell membrane plays an important role in plants’ tolerance to drought stress [32]. GmPM35 proteins aggregated on the cell membrane may play a role in protecting the structure and function of the cell membrane.

3.2. Analysis of Tissue-Specific Expression of GmPM35 Gene in Soybean and Its Expression Pattern Under Abiotic Stresses

The qRT-PCR study showed that there was no tissue specificity in the expression of GmPM35 gene in different tissues during the five developmental periods of soybean, and the expression of different developmental periods and different parts of soybean ranged from high to low: R8 seeds > R5 seeds > R3 pods > R4 pods > roots > leaves > stems (Figure 2B); the expression of GmPM35 gene was differently induced by drought stress, salt stress, and exogenous abscisic acid (ABA). ABA-induced, the expression of gene GmPM35 was the highest at 12 h of drought stress, which was about 16.56 times that of the control (Figure 2C).

3.3. Overexpression of GmPM35 Gene Enhances Germination and Green Shooting in Transgenic Arabidopsis thaliana

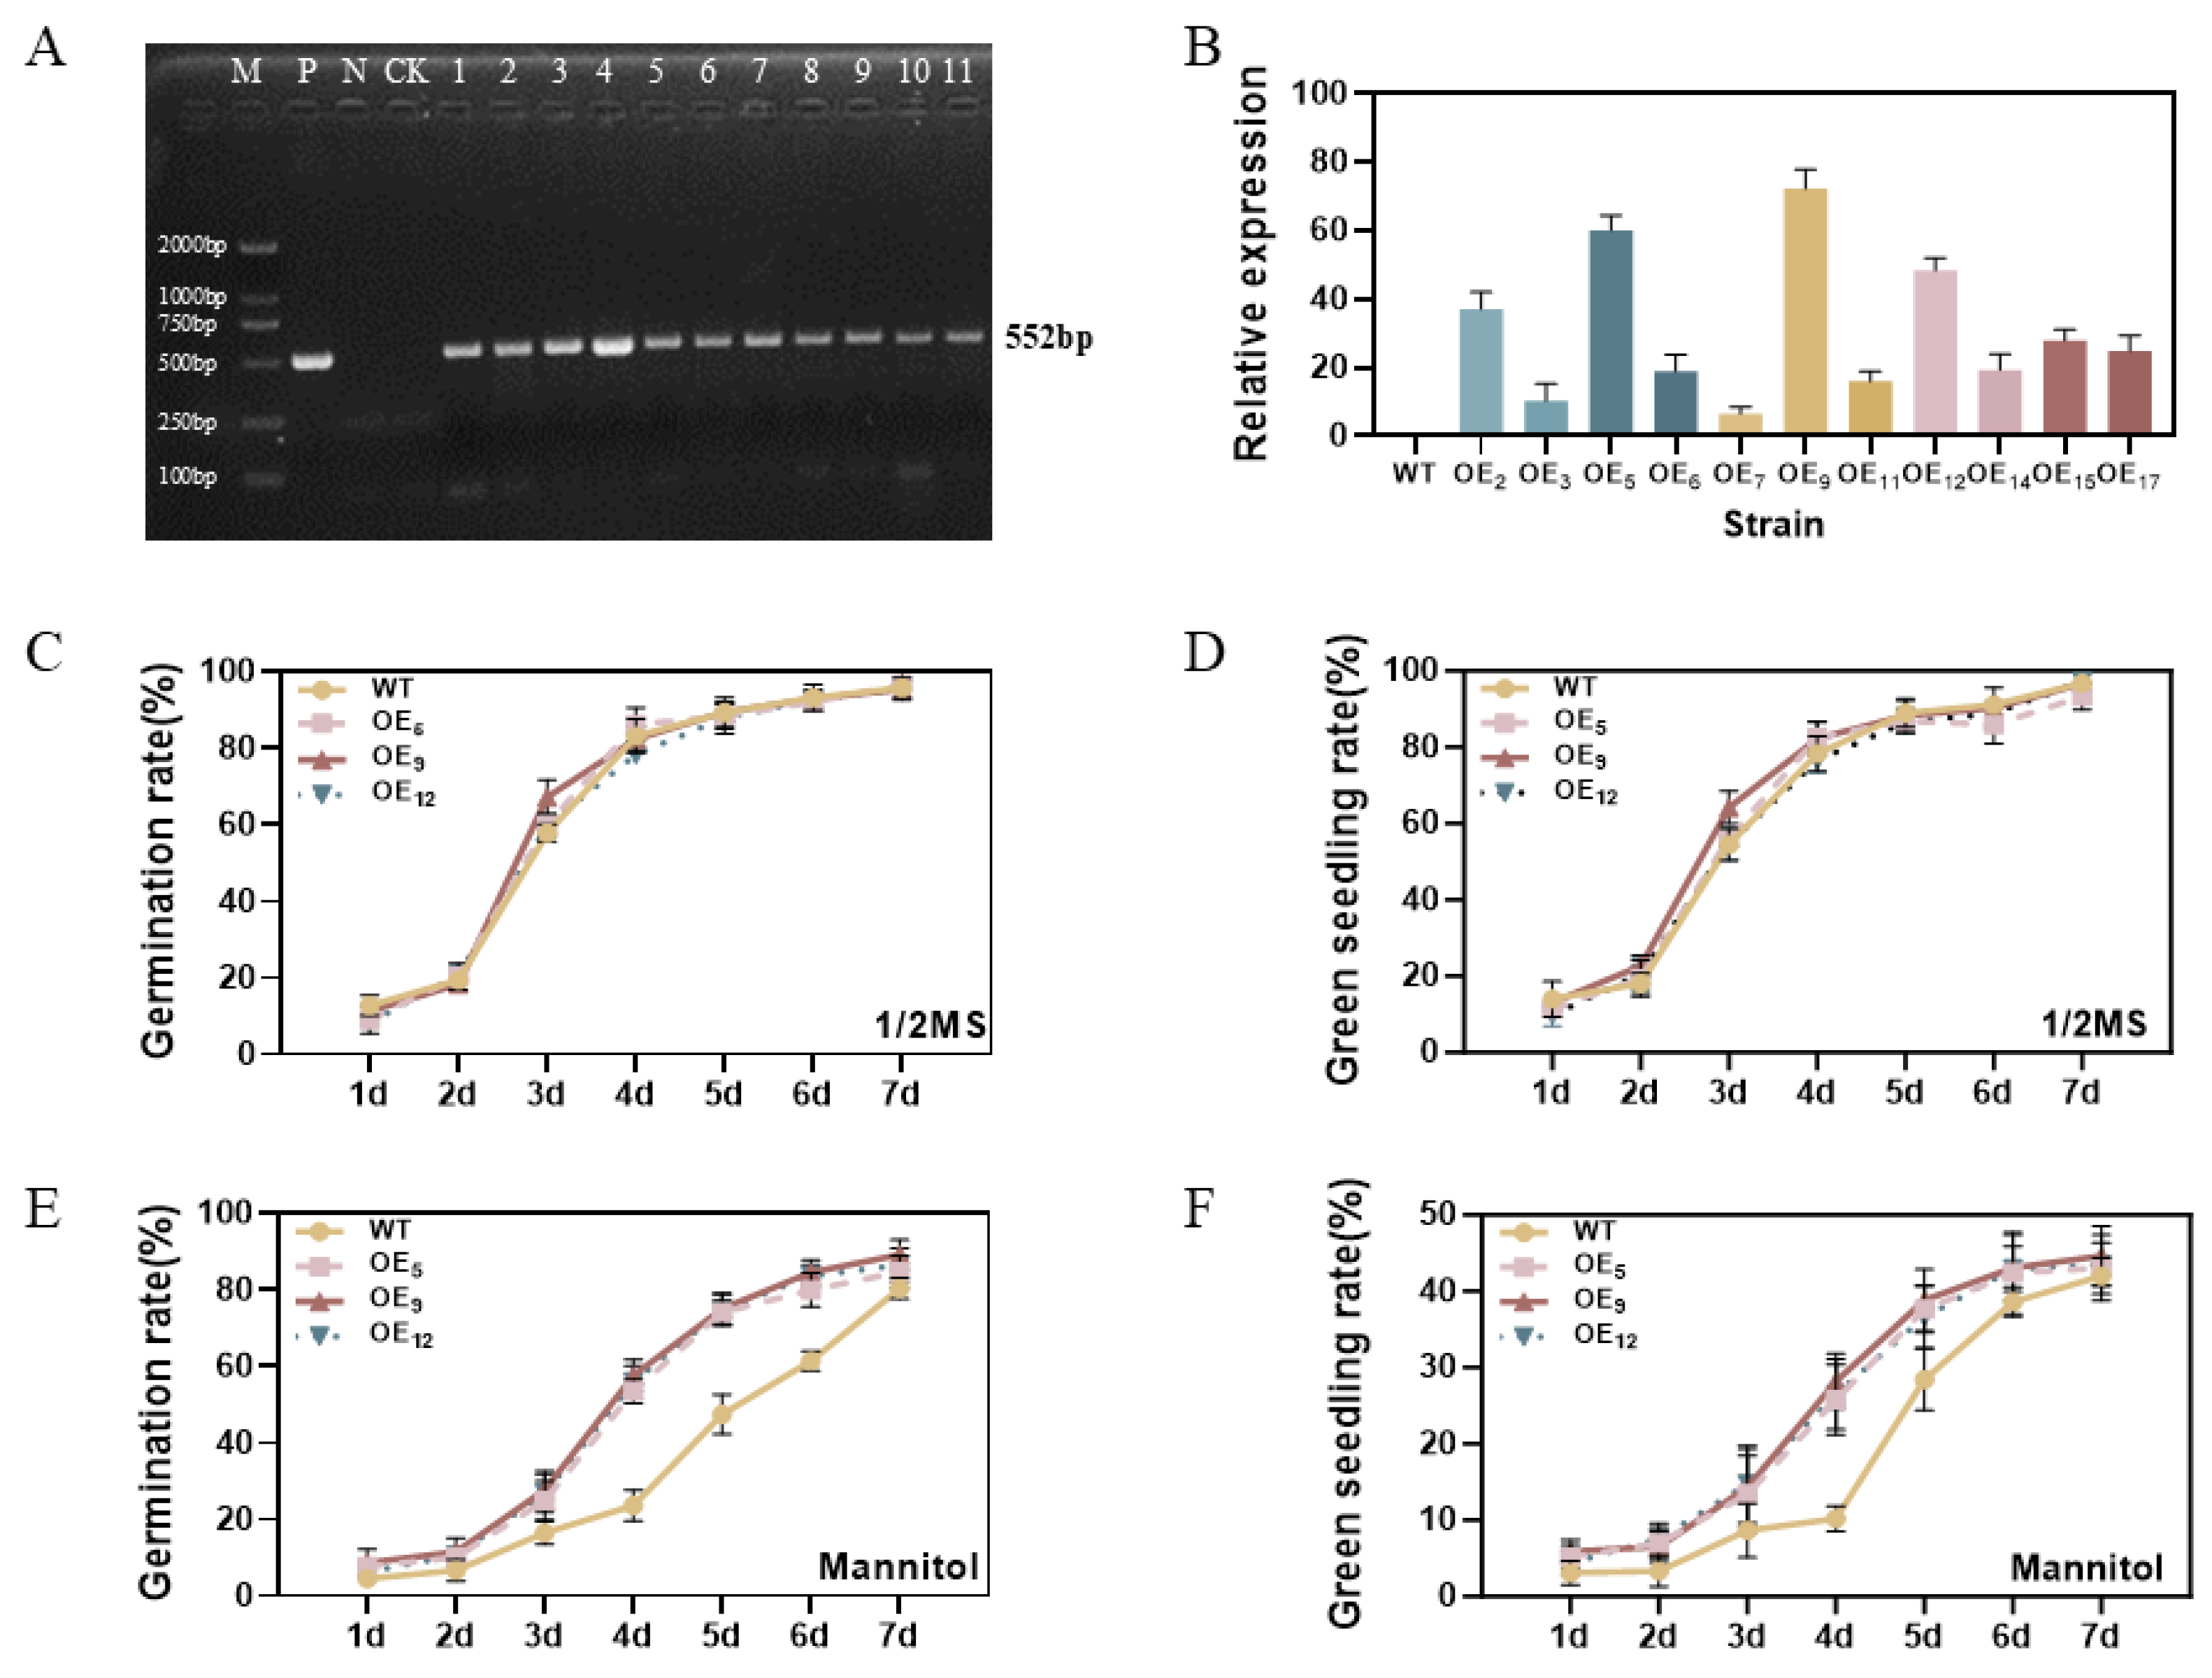
The GmPM35 gene was expressed in all 11 T2-generation overexpressing Arabidopsis strains (OE), but there were differences in the amount of expression, with OE5, OE9, and OE12 strains having high expression relative to the others, and thus, OE5, OE9, and OE12 strains were selected for the subsequent experiments (Figure 3A,B). There was no significant difference between wild-type Arabidopsis thaliana (WT) and OE5, OE9, and OE12 in 1/2 MS medium (Figure 3C,D), whereas the germination rate and green seedling rate of OE5, OE9, and OE12 in medium containing 200 mmol/L mannitol were higher than those of WT, and the germination rate of WT was only 22.93% at the 4th day of germination, while that of OE5, OE9, and OE12 would reach 51.96–54.03% (Figure 3E,F). This indicates that Arabidopsis seeds overexpressing the GmPM35 gene can improve their tolerance at the germination stage under drought stress.

3.4. Overexpression of the GmPM35 Gene Promotes Water Retention and Root Elongation in Transgenic Arabidopsis thaliana Under Drought Stress

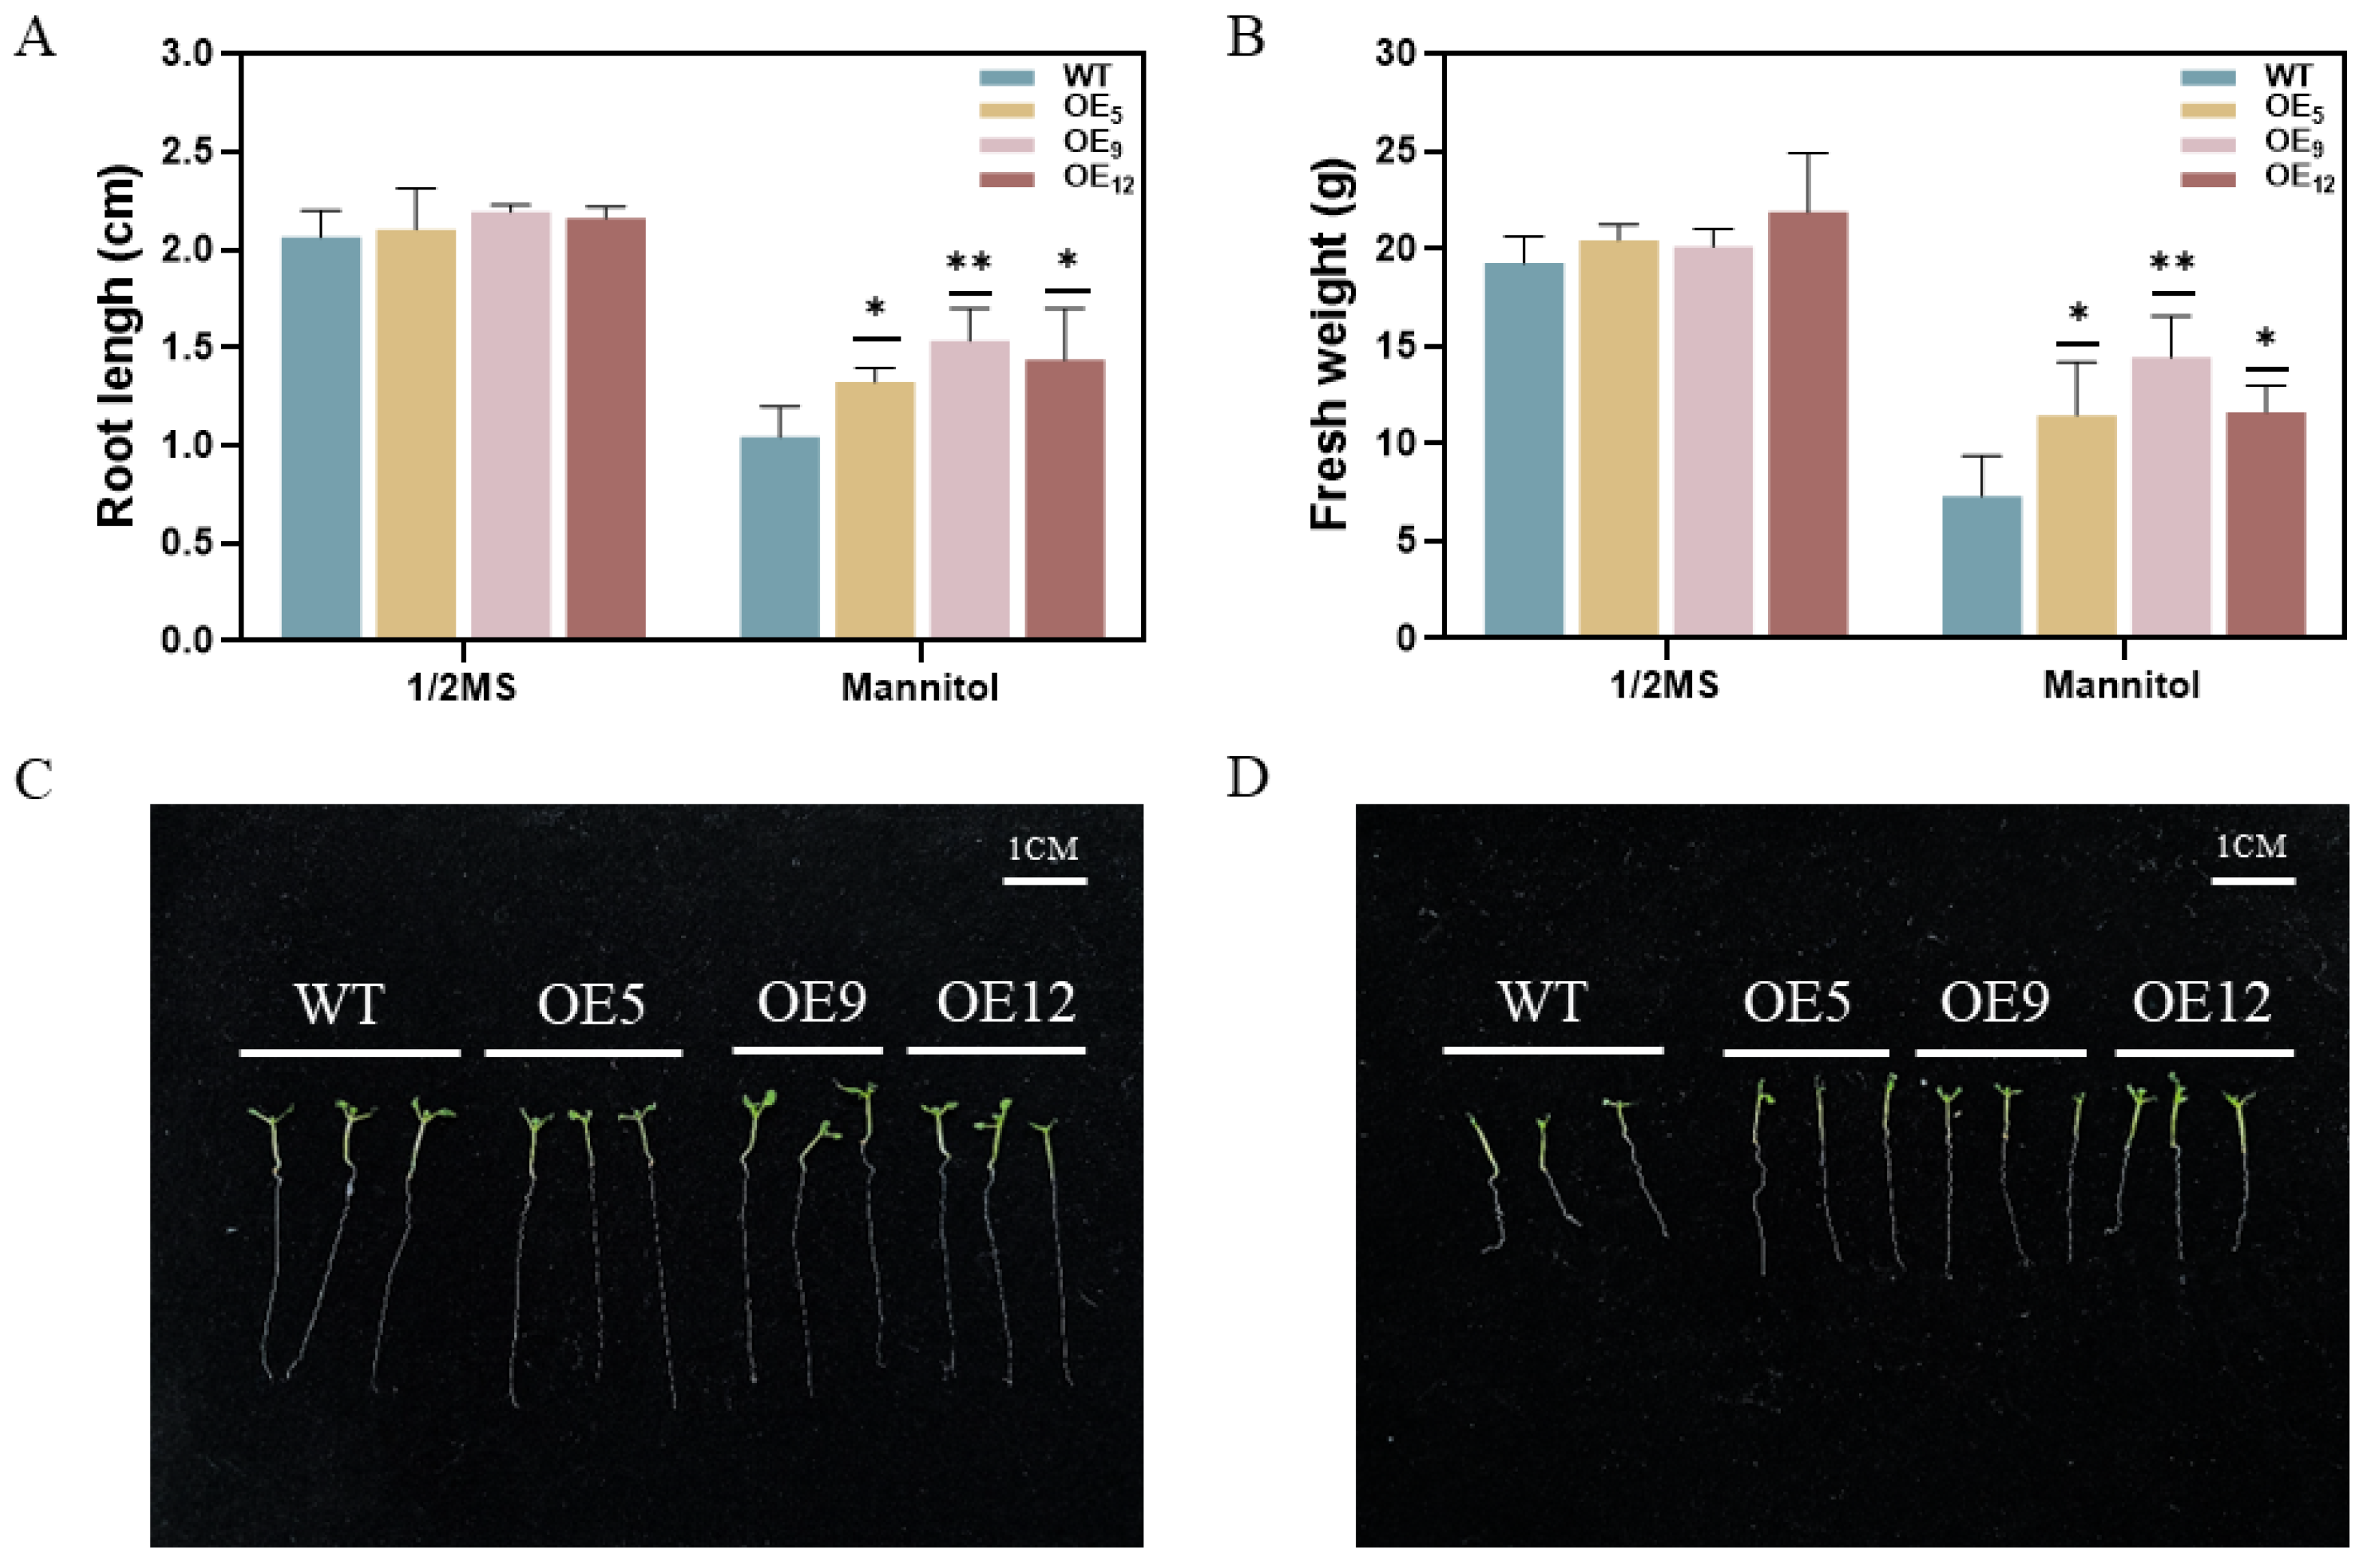
The root length and fresh weight of the above seedlings were measured, and the relative elongation of the roots was calculated after they were transferred to the group culture room for 10 days of vertical culture. The root length and fresh weight of WT and OE5, OE9, and OE12 seedlings did not differ much in 1/2 MS medium; the root length and fresh weight of WT were very significantly lower than those of OE5, OE9, and OE12 in the medium of 200 mmol/L mannitol, and the relative elongation of WT was 48.43%, while that of the OE5, OE9, and OE12 strains was in the range of 61.98% to 68.71% (Figure 4).

3.5. T2-Generation Transgenic Arabidopsis Rehydration Test and Physiological and Biochemical Detection of Transgenic Arabidopsis Under Drought Stress

Natural drought and rehydration tests were performed on the T2 generation of transgenic Arabidopsis. All Arabidopsis wilted to varying degrees after drought, but the degree of wilting was greater in wild-type Arabidopsis compared with transgenic Arabidopsis. As can be seen in Figure 5A, none of the WTs survived, and all of them died on day 6 after restoring their water supply, whereas OE5, OE9, and OE12 survived and could resume normal growth. The survival rates of transgenic Arabidopsis were 48.21–55.17% (Figure 5B). Thus, it can be preliminarily indicated that the expression of the GmPM35 gene in Arabidopsis can improve the drought tolerance of Arabidopsis.
Next, SOD activity, POD activity, MDA content, and Pro content were measured in WT, OE5, OE9, and OE12 after stress treatment. It was found that the MDA content of WT and OE5, OE9, and OE12 increased after stress, but OE5, OE9, and OE12 grew significantly lower than that of WT, indicating that OE5, OE9, and OE12 suffered less damage under drought stress conditions (Figure 5C); after the determination of the POD activity, the activities of OE5, OE9, and OE12 were higher after the stress treatment, indicating that transgenic Arabidopsis could produce more POD under stress conditions to cope with the H2O2 produced under these conditions, which was beneficial for the plants to grow better under the drought conditions (Figure 5D); under the simulated drought stress, there was a significant difference in Pro content between WT and OE5, OE9, and OE12, which indicated that the transgenic Arabidopsis was better able to lock up the cellular water to cope with the effects of drought stress on itself (Figure 5E); the SOD activities of OE5, OE9, and OE12 showed higher activities relative to WT after 12 h of drought stress and reached significant levels, indicating that the transgenic Arabidopsis thaliana was able to eliminate the effects of ROS on the plants in a relatively short period of time under the conditions of drought stress and to improve the drought-tolerance ability of the plants (Figure 5F).

3.6. PCR Detection of Soybean Hairy Roots Overexpressing GmPM35 Gene and Expression Analysis of Overexpressed Soybean Hairy Roots Under Drought Stress

After induction, a total of 140 plants of overexpressed hairy roots were obtained, and PCR assay was performed using Bar S/AS; 136 transformed hairy roots were positive after the assay, with a transformation rate of 97%. Part of the PCR assay is shown in Figure 6A. The results of stress treatment of overexpressed soybean positive hairy roots (OE) and K599 control hairy roots (CK) in 10% PEG6000 for 0 h, 3 h, 6 h, 12 h, 24 h, and 48 h showed that the relative expression of OE was highest in drought stress for 12 h, which was 1.97 times higher than that of the control group. It indicated that the overexpressed soybean hairy roots were differentially and significantly expressed under drought stress and showed better drought tolerance (Figure 6B).

3.7. Root Changes in Overexpressed Soybean Hairy Roots Under Drought Stress

The induced soybean hairy roots differed under untreated conditions, with the overexpressed hairy root control K599 hairy root having a more developed root system and a significant increase in the length of the primary root (Figure 7A). There was no significant difference in the thickness of the two types of hairy roots before stress; after 7 days of stress with 10% PEG6000 solution, the overexpressed hairy roots showed significant growth in root length, a significant reduction in root diameter, and a significant increase in the number of root tips compared with the K599 hairy root control (Figure 7B).

3.8. Physiological and Biochemical Assay of Overexpressed Soybean Hairy Roots Under Drought Stress

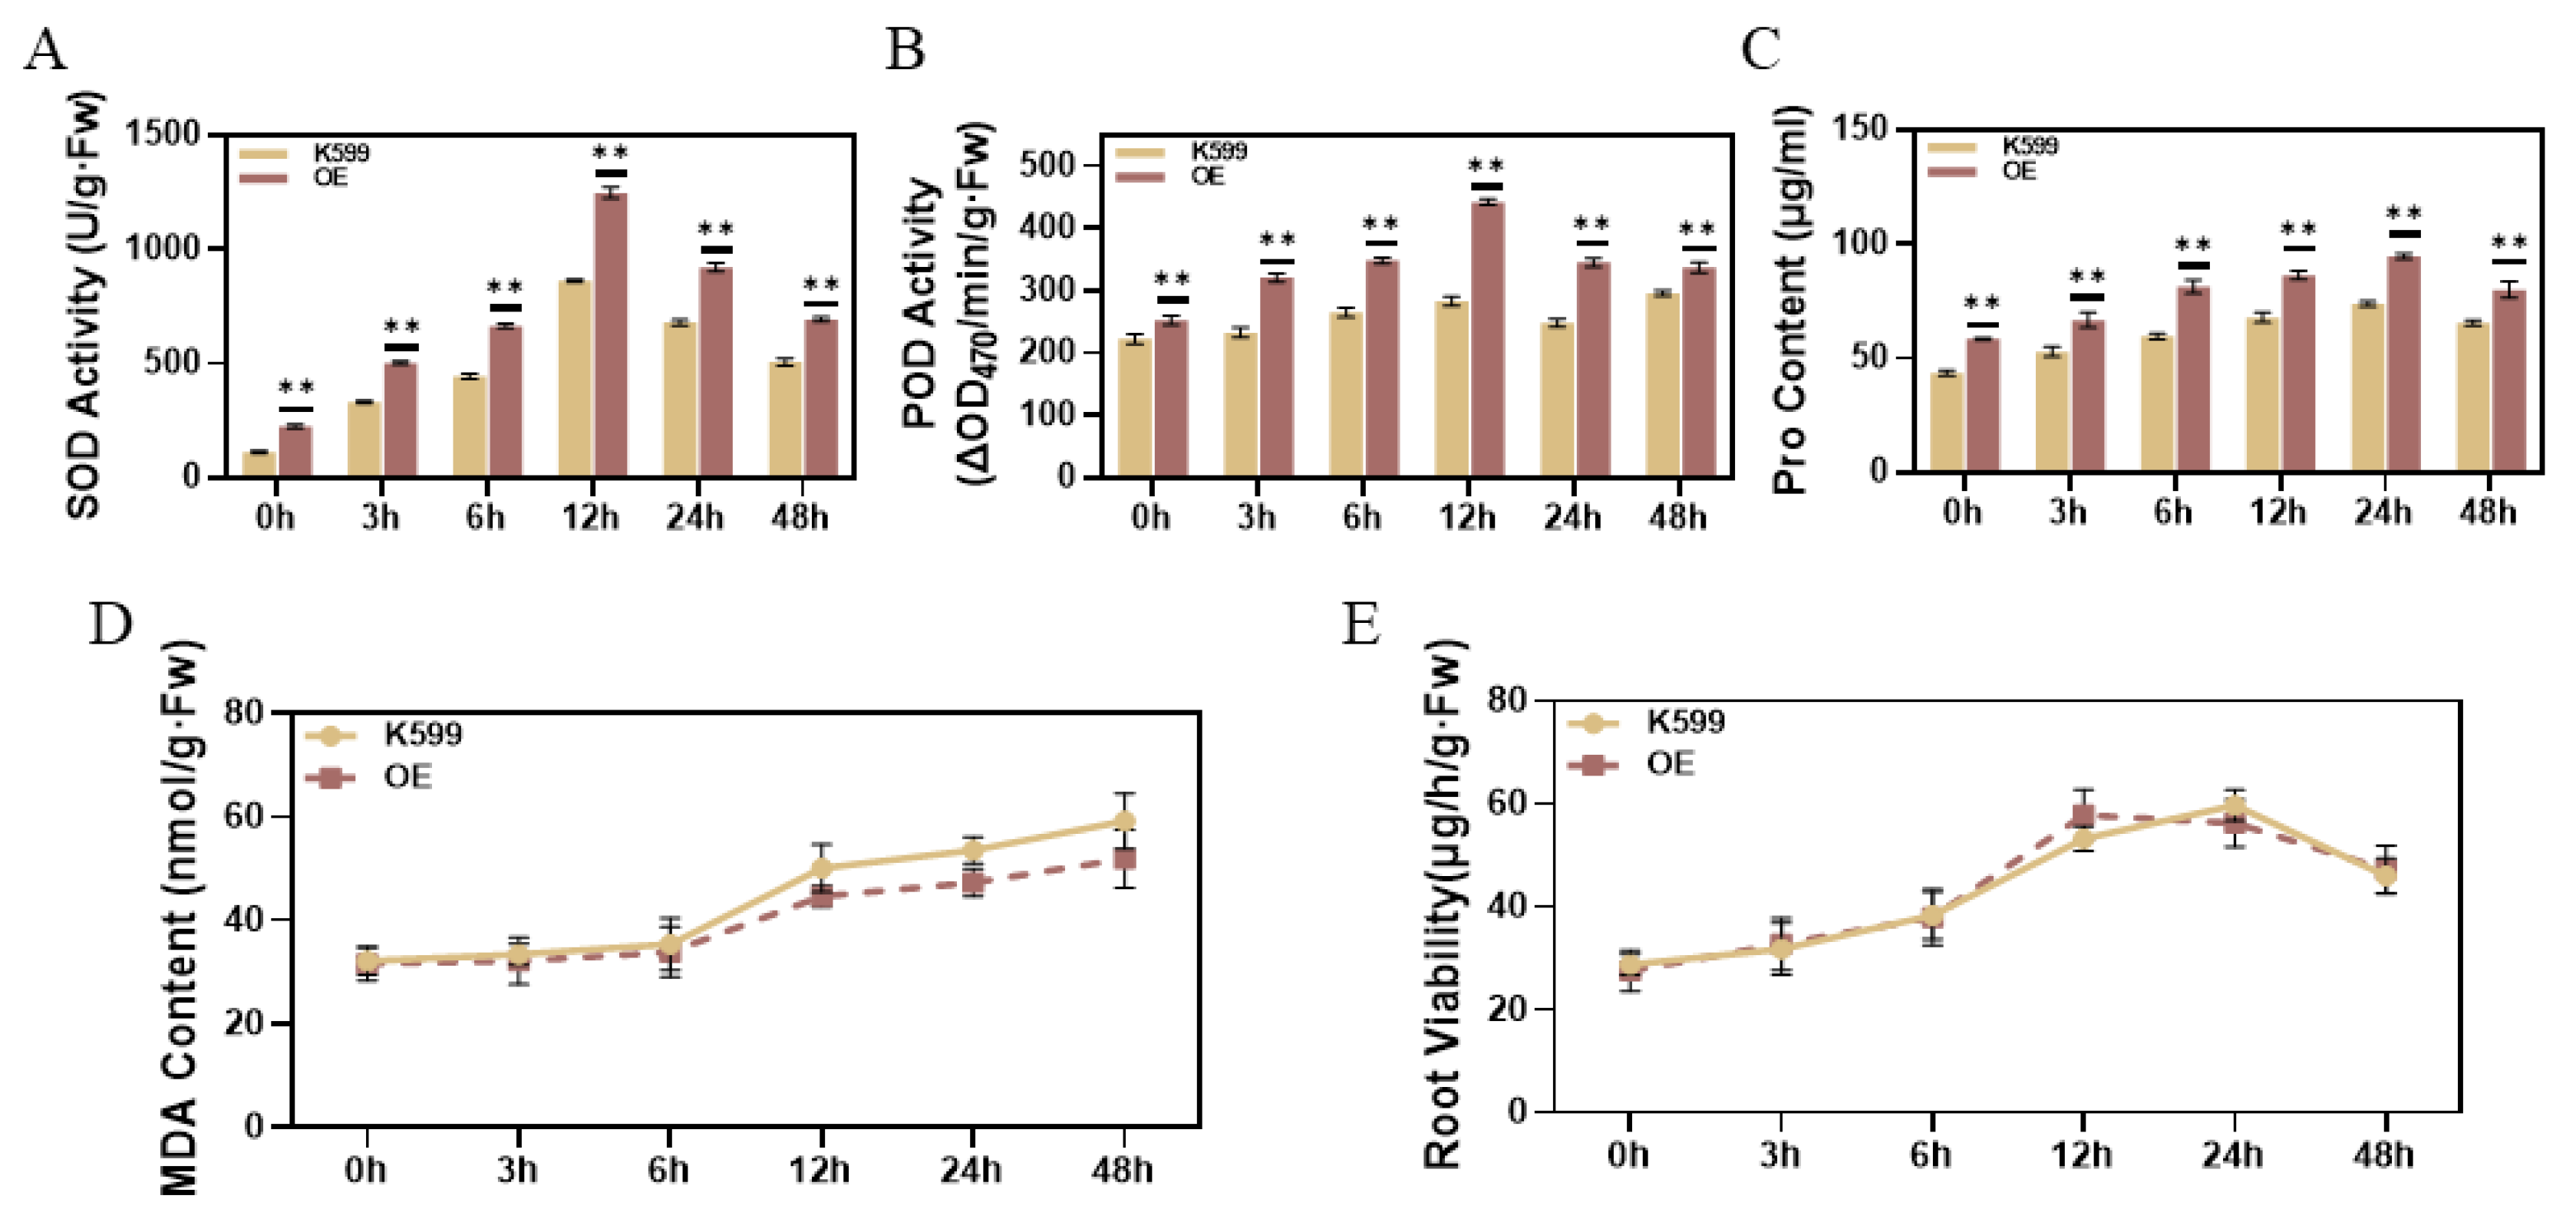
The osmoregulation, damage indexes, and antioxidant enzymes of hairy roots were examined in K599 soybean hairy roots (CK) and overexpressed soybean hairy roots (OE) after treatment with 10% PEG6000. After the stress, the SOD activity of OE compared with that of CK showed more obvious changes, with the highest activity at 12 h of stress, reaching a peak, and the activity of OE remained at a higher level during the period of 6–48 h of stress (Figure 8A); after 48 h of stress, the POD activity of OE was always at a higher level during the period, and the activity was relatively the highest at 12 h, which showed the most drastic increase in activity compared with that of CK and was always higher than the POD activity of CK (Figure 8B); with the stress time up to 24 h, the Pro of OE accumulated the most and increased significantly, which was 1.77 times higher than that before the stress (Figure 8C); the MDA content of OE was always at a low level under the drought stress conditions, and only appeared to rise steeply from 6 h to 12 h (Figure 8D); the drought stress would cause hairy root damage, the root vigor of the two groups of hairy roots did not differ much at 0 h–6 h, and the vigor of OE reached the highest at 12 h, and then declined slowly (Figure 8E). Under drought stress conditions, the drought tolerance of OE was significantly higher than that of CK.

3.9. Mutation Efficiency Statistics for Editing Vectors

The target location was designed according to the main functional structural domains and PAM on exon, and the GmPM35 gene target was located at exon 160–179 bp, and the PAM was AGG (Figure 9A). We selected 18 positive hairy roots that were successfully transformed into the editing vector, extracted the genomes of different hairy roots to sequence the region where the target site was located, and compared them with the target site sequences. The results showed that the editing efficiency of the recombinant editing vector pCBSG015-GmPM35 designed and obtained in soybean hairy roots was 55.56%, and its main type of editing was base deletion, which verified the reliability of the designed target site (Figure 9B).

3.10. Gene Expression and Editing in Different Strains of Soybean

Two T3-generation edited soybean lines and nine T3-generation overexpression soybean lines were successfully obtained by Agrobacterium-mediated genetic transformation (Figure 10A) and identification screening (Figure 10B) of the recipient soybean JINONG28 (JN28), respectively. Next, we analyzed the GmPM35 gene expression of the T3-edited lines and the T3 overexpression lines (Figure 10C), and based on the results, we selected the two soybean lines with relatively low GmPM35 gene expression, KO1 and KO2, as well as the two soybean lines with relatively high GmPM35 gene expression, OE1 and OE2, for the subsequent experiments. The editing of the KO1 and KO2 soybean gene editing lines is shown in Figure 10D.

3.11. Determination of Germination Rate and Shoot Length of T3-Generation Positive Soybean Plants Under Drought Stress

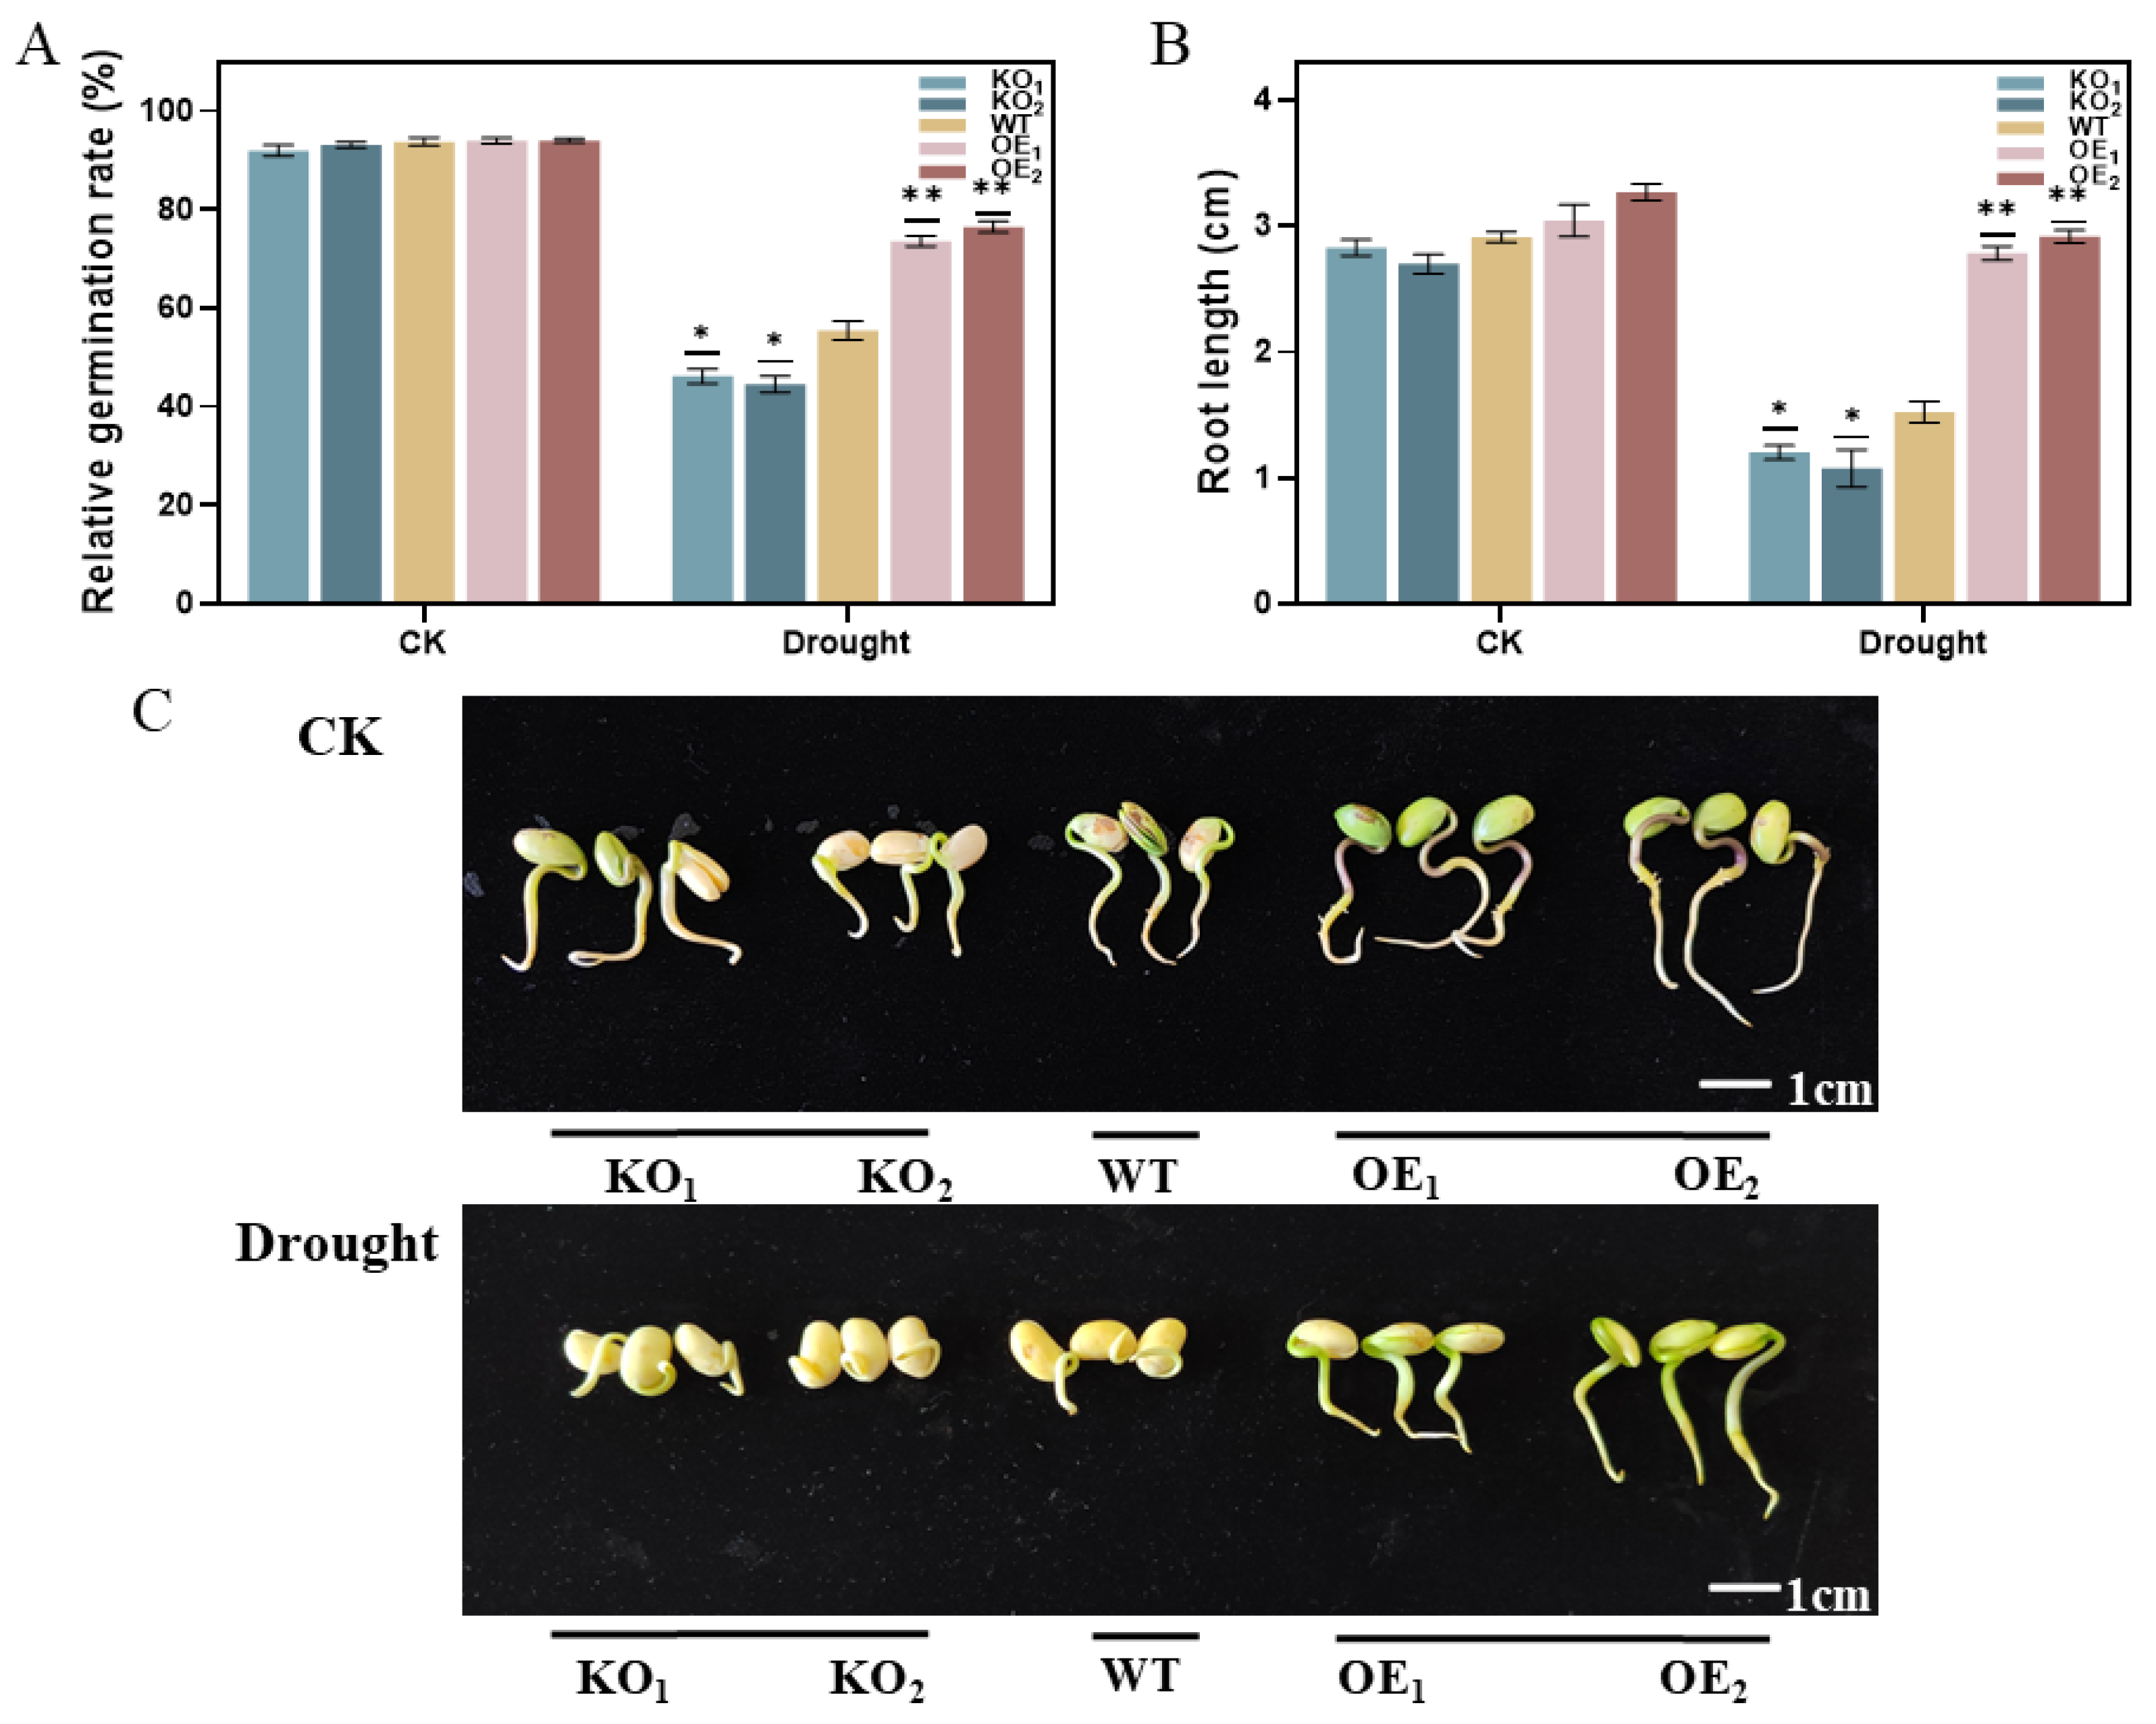
Under a normal moisture treatment environment, the germination status of transgenic and non-transgenic strains was basically the same, and the germination rate was around 95%. Under simulated drought stress treatment conditions, the germination rates of OE1 and OE2 were 73.65% and 76.5%, respectively. The germination rate of the non-transgenic strain (WT) was reduced to 51.45%, and the germination rates of KO1 and KO2 were reduced to 46.15% and 44.55%, respectively. The results indicated that the gene-edited lines showed a more significant inhibition of seed germination under 8% PEG6000 stress. The relative germination percentage of gene-edited strain and non-transgenic was significantly reduced under drought stress (Figure 11A). Measurements of shoot length of the different groups showed that under normal moisture treatment, the average shoot lengths of KO1 and KO2 were 2.83 cm and 2.69 cm, and the average shoot length of WT was 2.91 cm; 3.04 cm and 3.27 cm were observed for OE1 and OE2, respectively, and 1.20 cm and 0.93 cm were observed for KO1 and KO2, and 0.93 cm for WT, respectively, under the drought stress treatment of 8% PEG6000. The average shoot lengths of KO1 and KO2 were 1.20 cm and 0.93 cm, and the average shoot length of WT was 1.42 cm. The significant decrease in shoot lengths before drought in the gene-edited and non-transgenic comparisons indicated that drought stress resulted in the inhibition of growth of the gene-edited and non-transgenic lines. The average shoot lengths of the OE1 and OE2 stress treatments were 2.78 cm and 2.92 cm, respectively, which indicated that growth of the shoot lengths of overexpression strains was inhibited after drought stress, but the changes were not significant. The shoot length of OE1 and OE2 was significantly longer than that of WT, KO1, and KO2. The results indicated that the overexpression strains of the soybean were more drought-tolerant than the gene-edited strains at the shoot stage under 8% PEG6000 drought simulation treatment (Figure 11B,C).

3.12. Rehydration Test and Root Phenotyping of T3-Generation Positive Soybean Plants Under Drought Stress

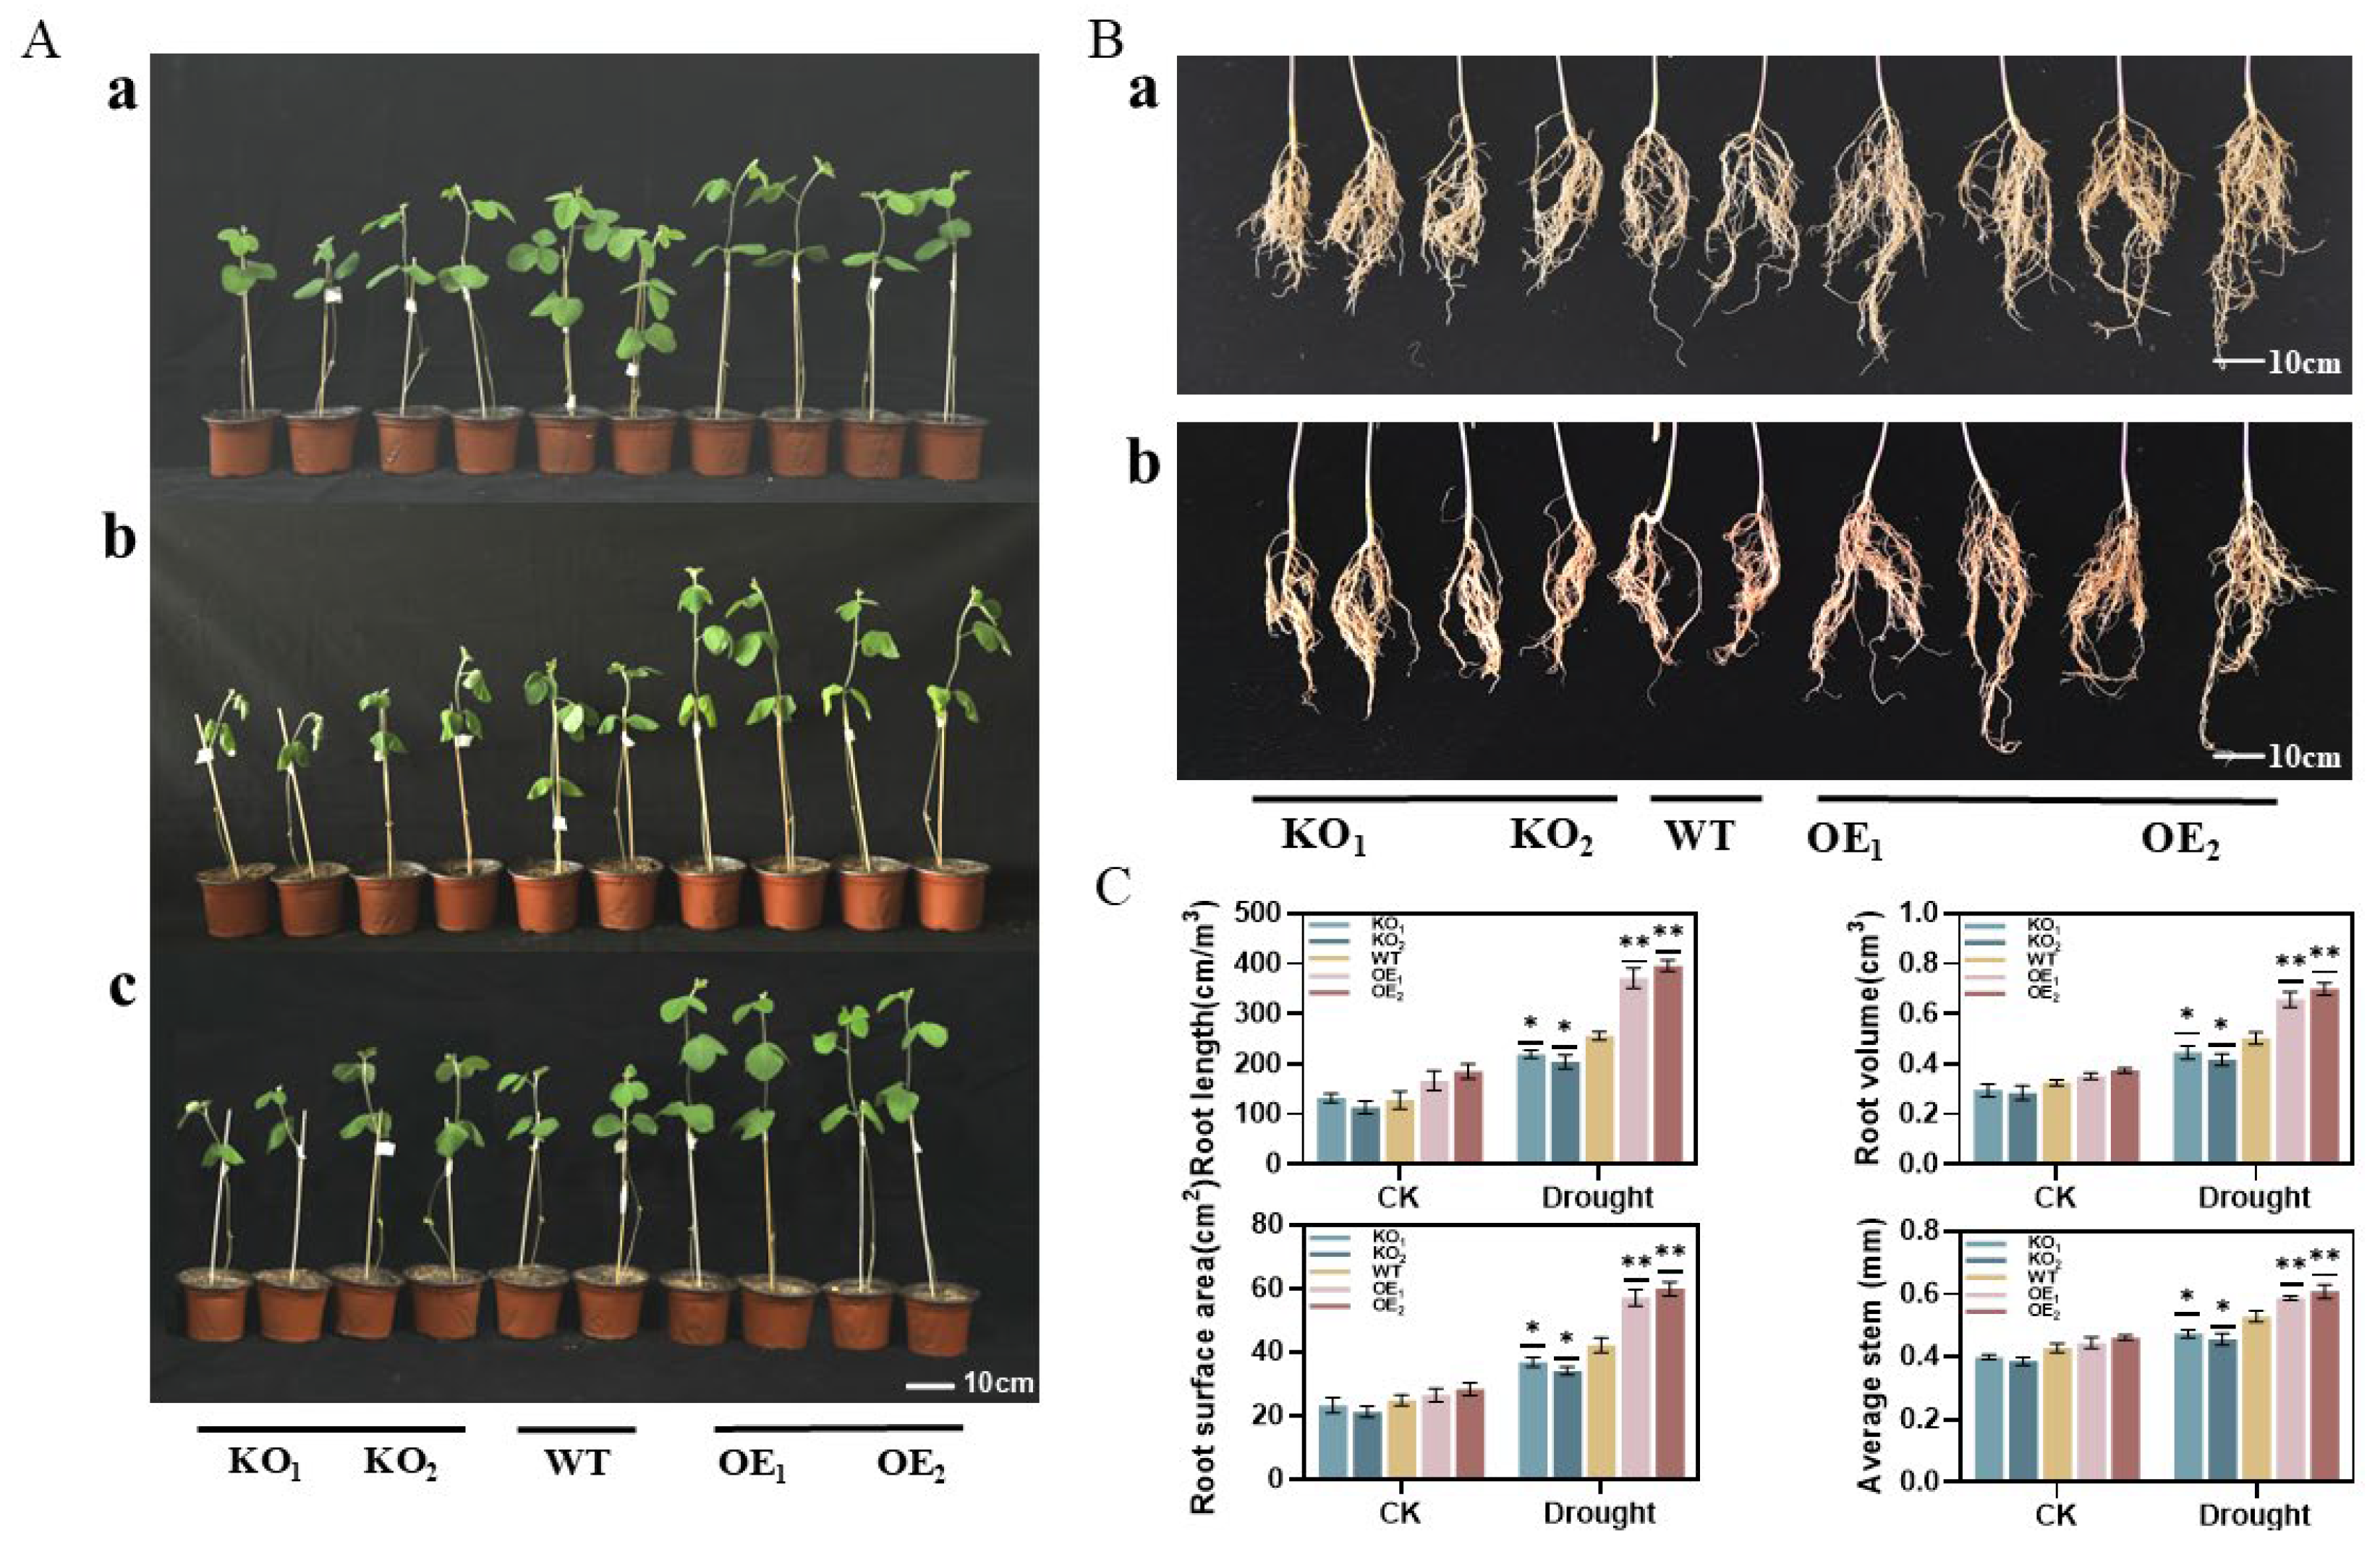
To further verify whether the GmPM35 gene could enhance drought tolerance in soybean plants, we conducted a rehydration test. As shown in Figure 12(Aa), there was no obvious change in the growth status of each strain under normal conditions before drought stress. Figure 12(Ab) shows the drought treatment for 10 days. It can be clearly seen that the wilting degree of the gene-edited lines KO1 and KO2 was more obvious than that of the overexpression lines OE1 and OE2, and the wilting degree of OE1 and OE2 was less. Figure 12(Ac) shows the growth recovery of the plants after 3 days of rewatering, from which it can be seen that the wilting degree of each strain was alleviated, and the height of OE1 and OE2 was significantly higher than that of KO1, KO2, and WT, indicating that drought stress did not have a significant effect on the growth of overexpression strains, but caused significant inhibition of the growth of the gene-edited strains. Then we measured their root length, root volume, root surface area, and other related data. As shown in Figure 12B,C, there was no significant difference between the root length and other related indexes of OE1 and OE2 and KO1, KO2, and WT before drought stress. After 10 days of drought stress, the overexpression lines grew more significantly in various indicators such as root length, root surface area, root volume, and average root diameter.

3.13. Determination of Photosynthetic Physiological Indexes in T3-Generation Transgenic Soybean Plants Under Drought Stress

As shown in Table 1, under normal growth conditions, the photosynthetic rate (Pn), transpiration rate (Tr), stomatal conductance (Gs), intercellular CO2 concentration (Ci), and instantaneous water use efficiency (WUEi) of OE1 and OE2 were significantly higher than those of WT. After drought stress, the photosynthetic physiological indicators of all lines decreased. However, compared with WT, the photosynthetic rate (Pn) of soybean plants overexpressing the GmPM35 gene increased by an average of 76.81%, the transpiration rate (Tr) increased by an average of 39.8%, the stomatal conductance (Gs) increased by an average of 126%, the intercellular CO2 concentration (Ci) increased by an average of 47.71%, and the instantaneous water use efficiency (WUEi) increased by an average of 26.44%.

3.14. Determination of Biochemical Indexes in T3-Generation Transgenic Soybean Plants Under Drought Stress

Under normal moisture treatment, there was no significant difference in chlorophyll content among the strains. After drought stress treatment, the chlorophyll contents of KO1, KO2, and WT were significantly lower than those of OE1 and OE2 (Figure 13A); the results of proline (Pro) and malondialdehyde (MDA) contents showed that the Pro contents of OE1 and OE2 were significantly increased under drought stress conditions, with the contents of 390.26 μg/g and 410.74 μg/g, respectively (Figure 13B). The MDA content was significantly lower compared to WT, KO1, and KO2, 104.36 μmol/g FW and 97.53 μmol/g FW, respectively (Figure 13C); the results of peroxidase (POD), superoxide dismutase (SOD), and catalase (CAT) activity measurements showed that there was no significant difference among the lines before drought treatment. After drought treatment, the antioxidant enzyme activities of SOD, POD, and CAT were significantly increased in OE1 and OE2 compared with WT, KO1, and KO2. The overexpression strains showed an average increase of 34.28%, 30.01%, and 26.12% in the activities of SOD, POD, and CAT, respectively, compared with the non-transgenic strains (Figure 13D–F).

3.15. Determination of Reactive Oxygen Species in T3-Generation Transgenic Soybean Plants Under Drought Stress

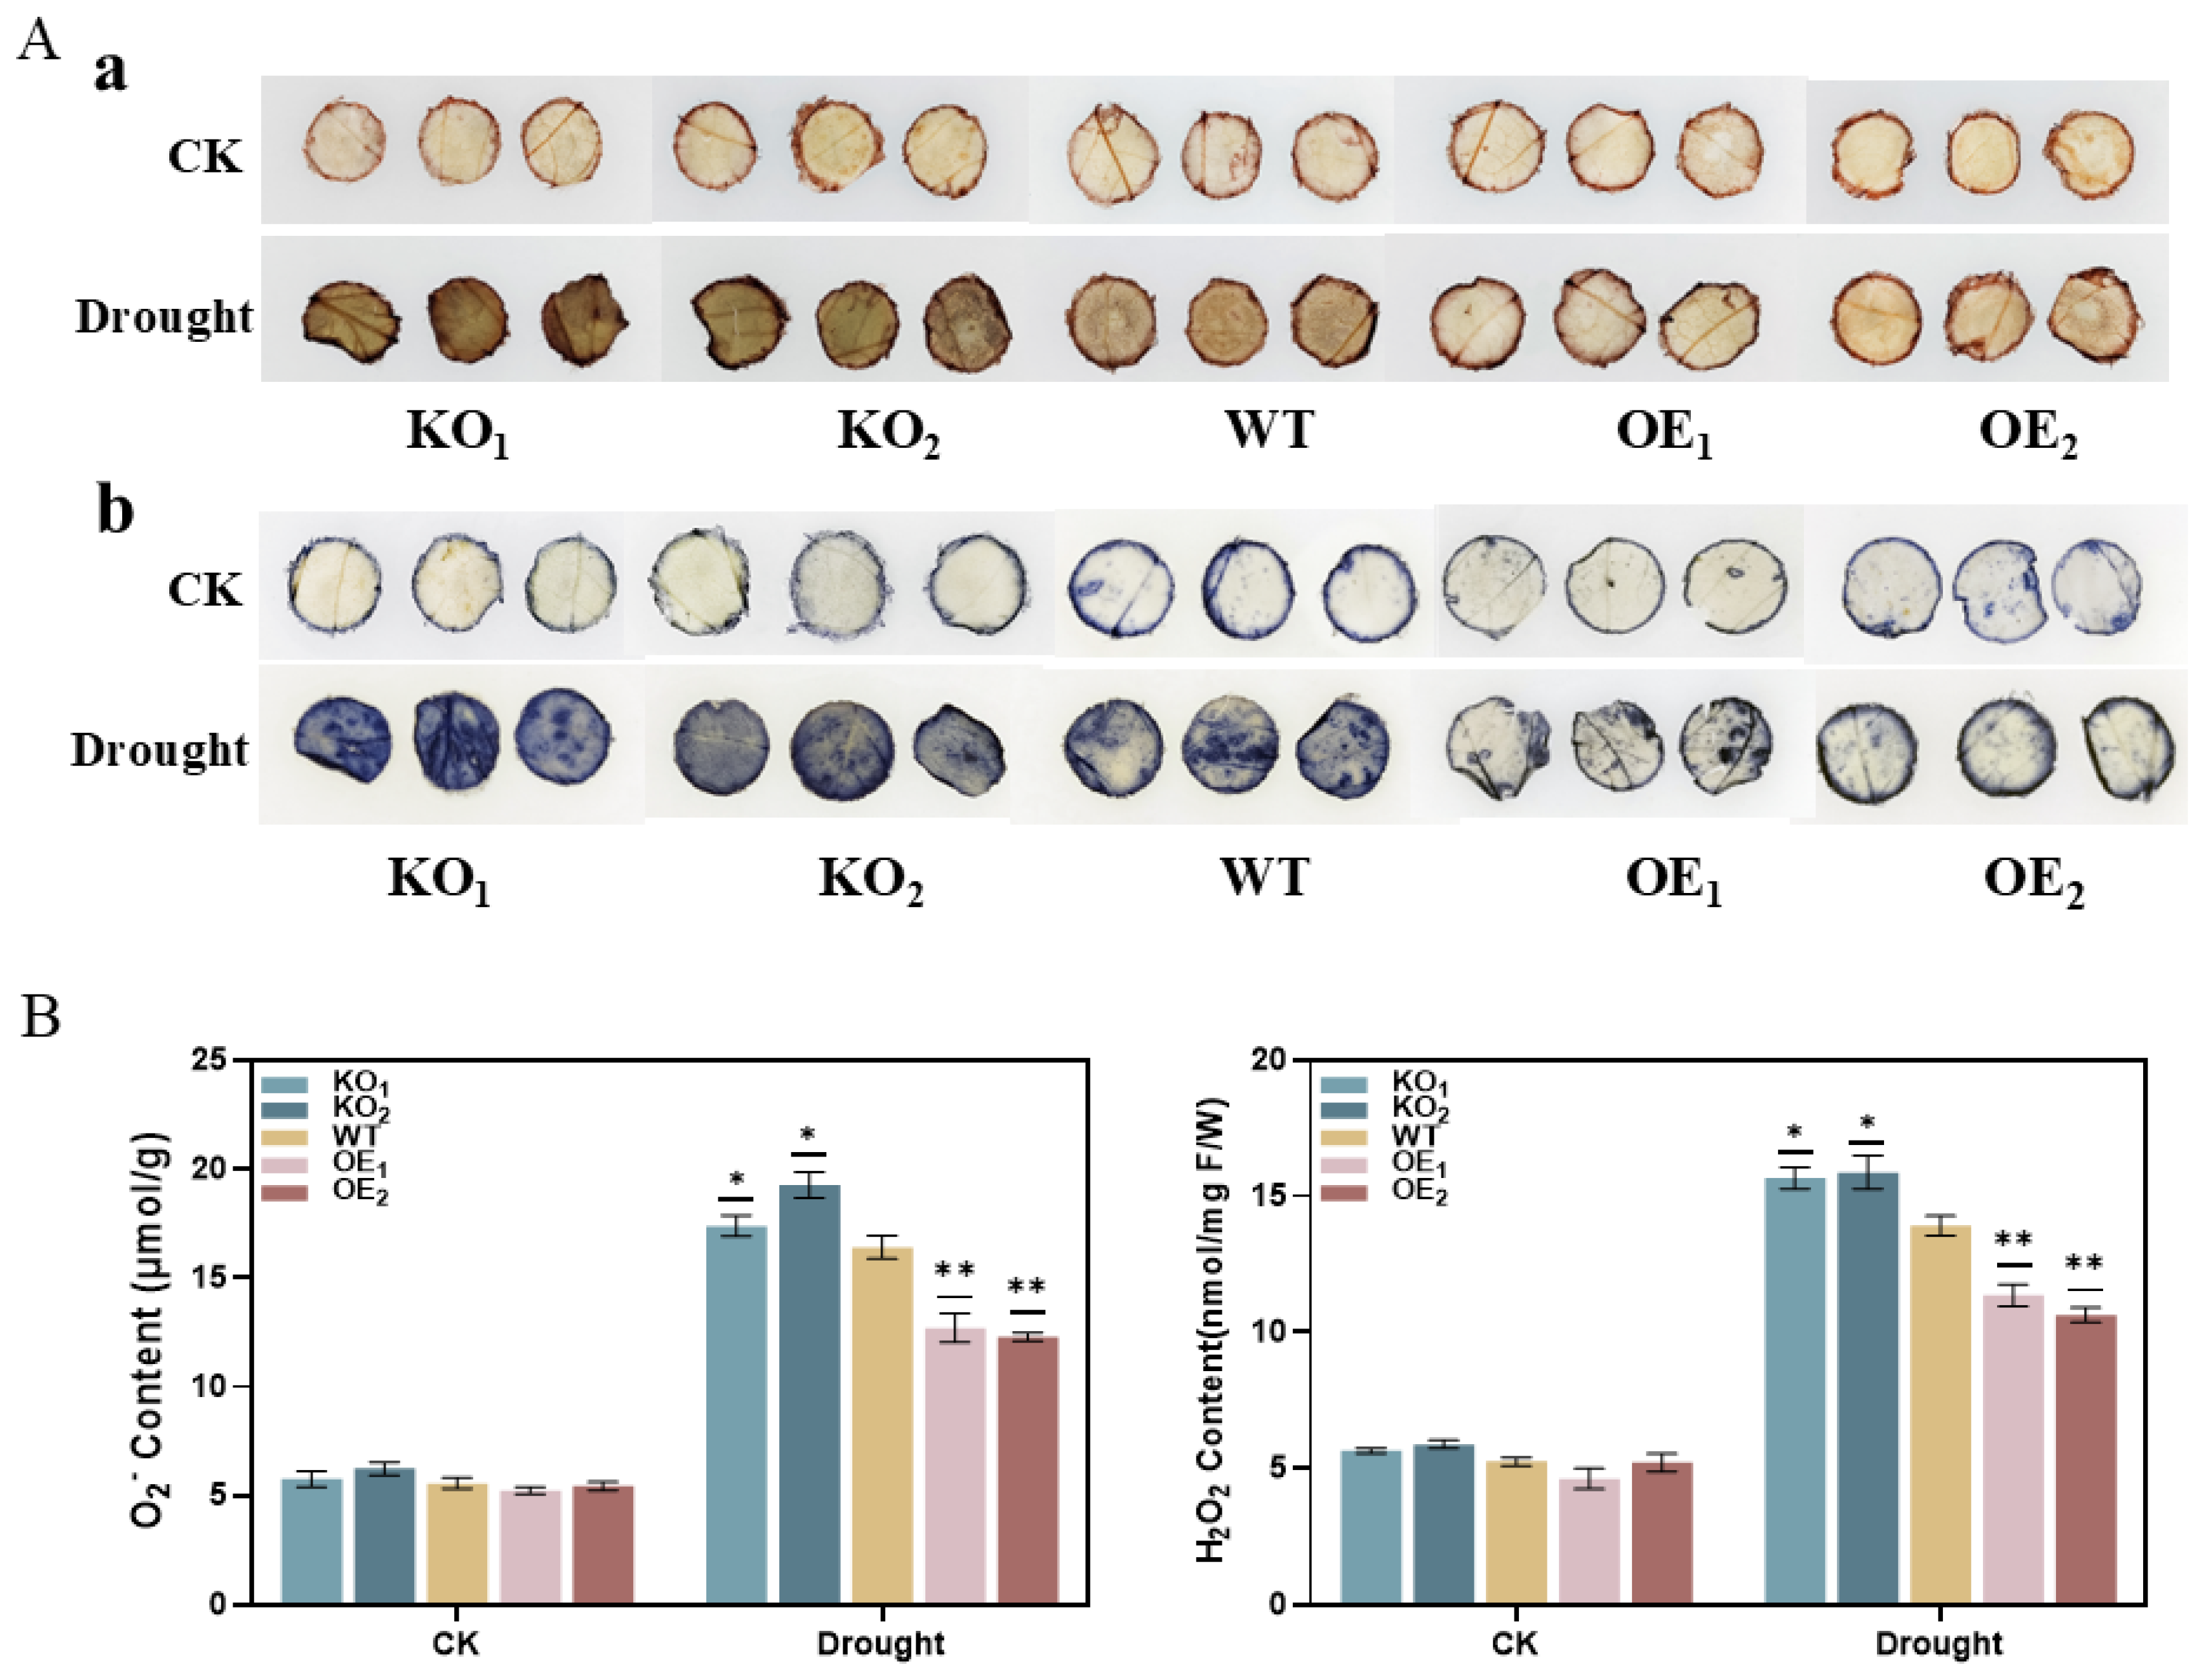
The results of diaminobenzidine (DAB) staining are shown in Figure 14(Aa). After drought stress, the color of the leaves of the gene-edited lines KO1 and KO2 was darker than that of the overexpression lines OE1 and OE2. This indicates that the gene-edited lines had increased hydrogen peroxide in the leaves under drought stress, and the leaves were more damaged. The results of nitroblue tetrazolium (NBT) staining are shown in Figure 14(Ab). This indicates that the overexpression lines had fewer superoxide anions and lower ROS content in the leaves under drought stress. The superoxide anion (O2•−) and hydrogen peroxide (H2O2) contents in soybean leaves were subsequently measured. The results, as shown in Figure 14B, showed that there was not much difference in the O2•− and H2O2 contents in plant leaves before drought stress. After drought stress, the O2•− and H2O2 contents of WT, KO1, and KO2 were significantly elevated compared with OE1 and OE2. The increase in O2•− and H2O2 led to an increase in ROS content in plant leaves, which made the plants more damaged, and the content measurements were consistent with the results of DAB and NBT staining methods. This indicates that soybean plants overexpressing the T3-generation GmPM35 gene have lower ROS content.

3.16. Investigation of Agronomic Traits in T2-Generation Positive Soybean Plants

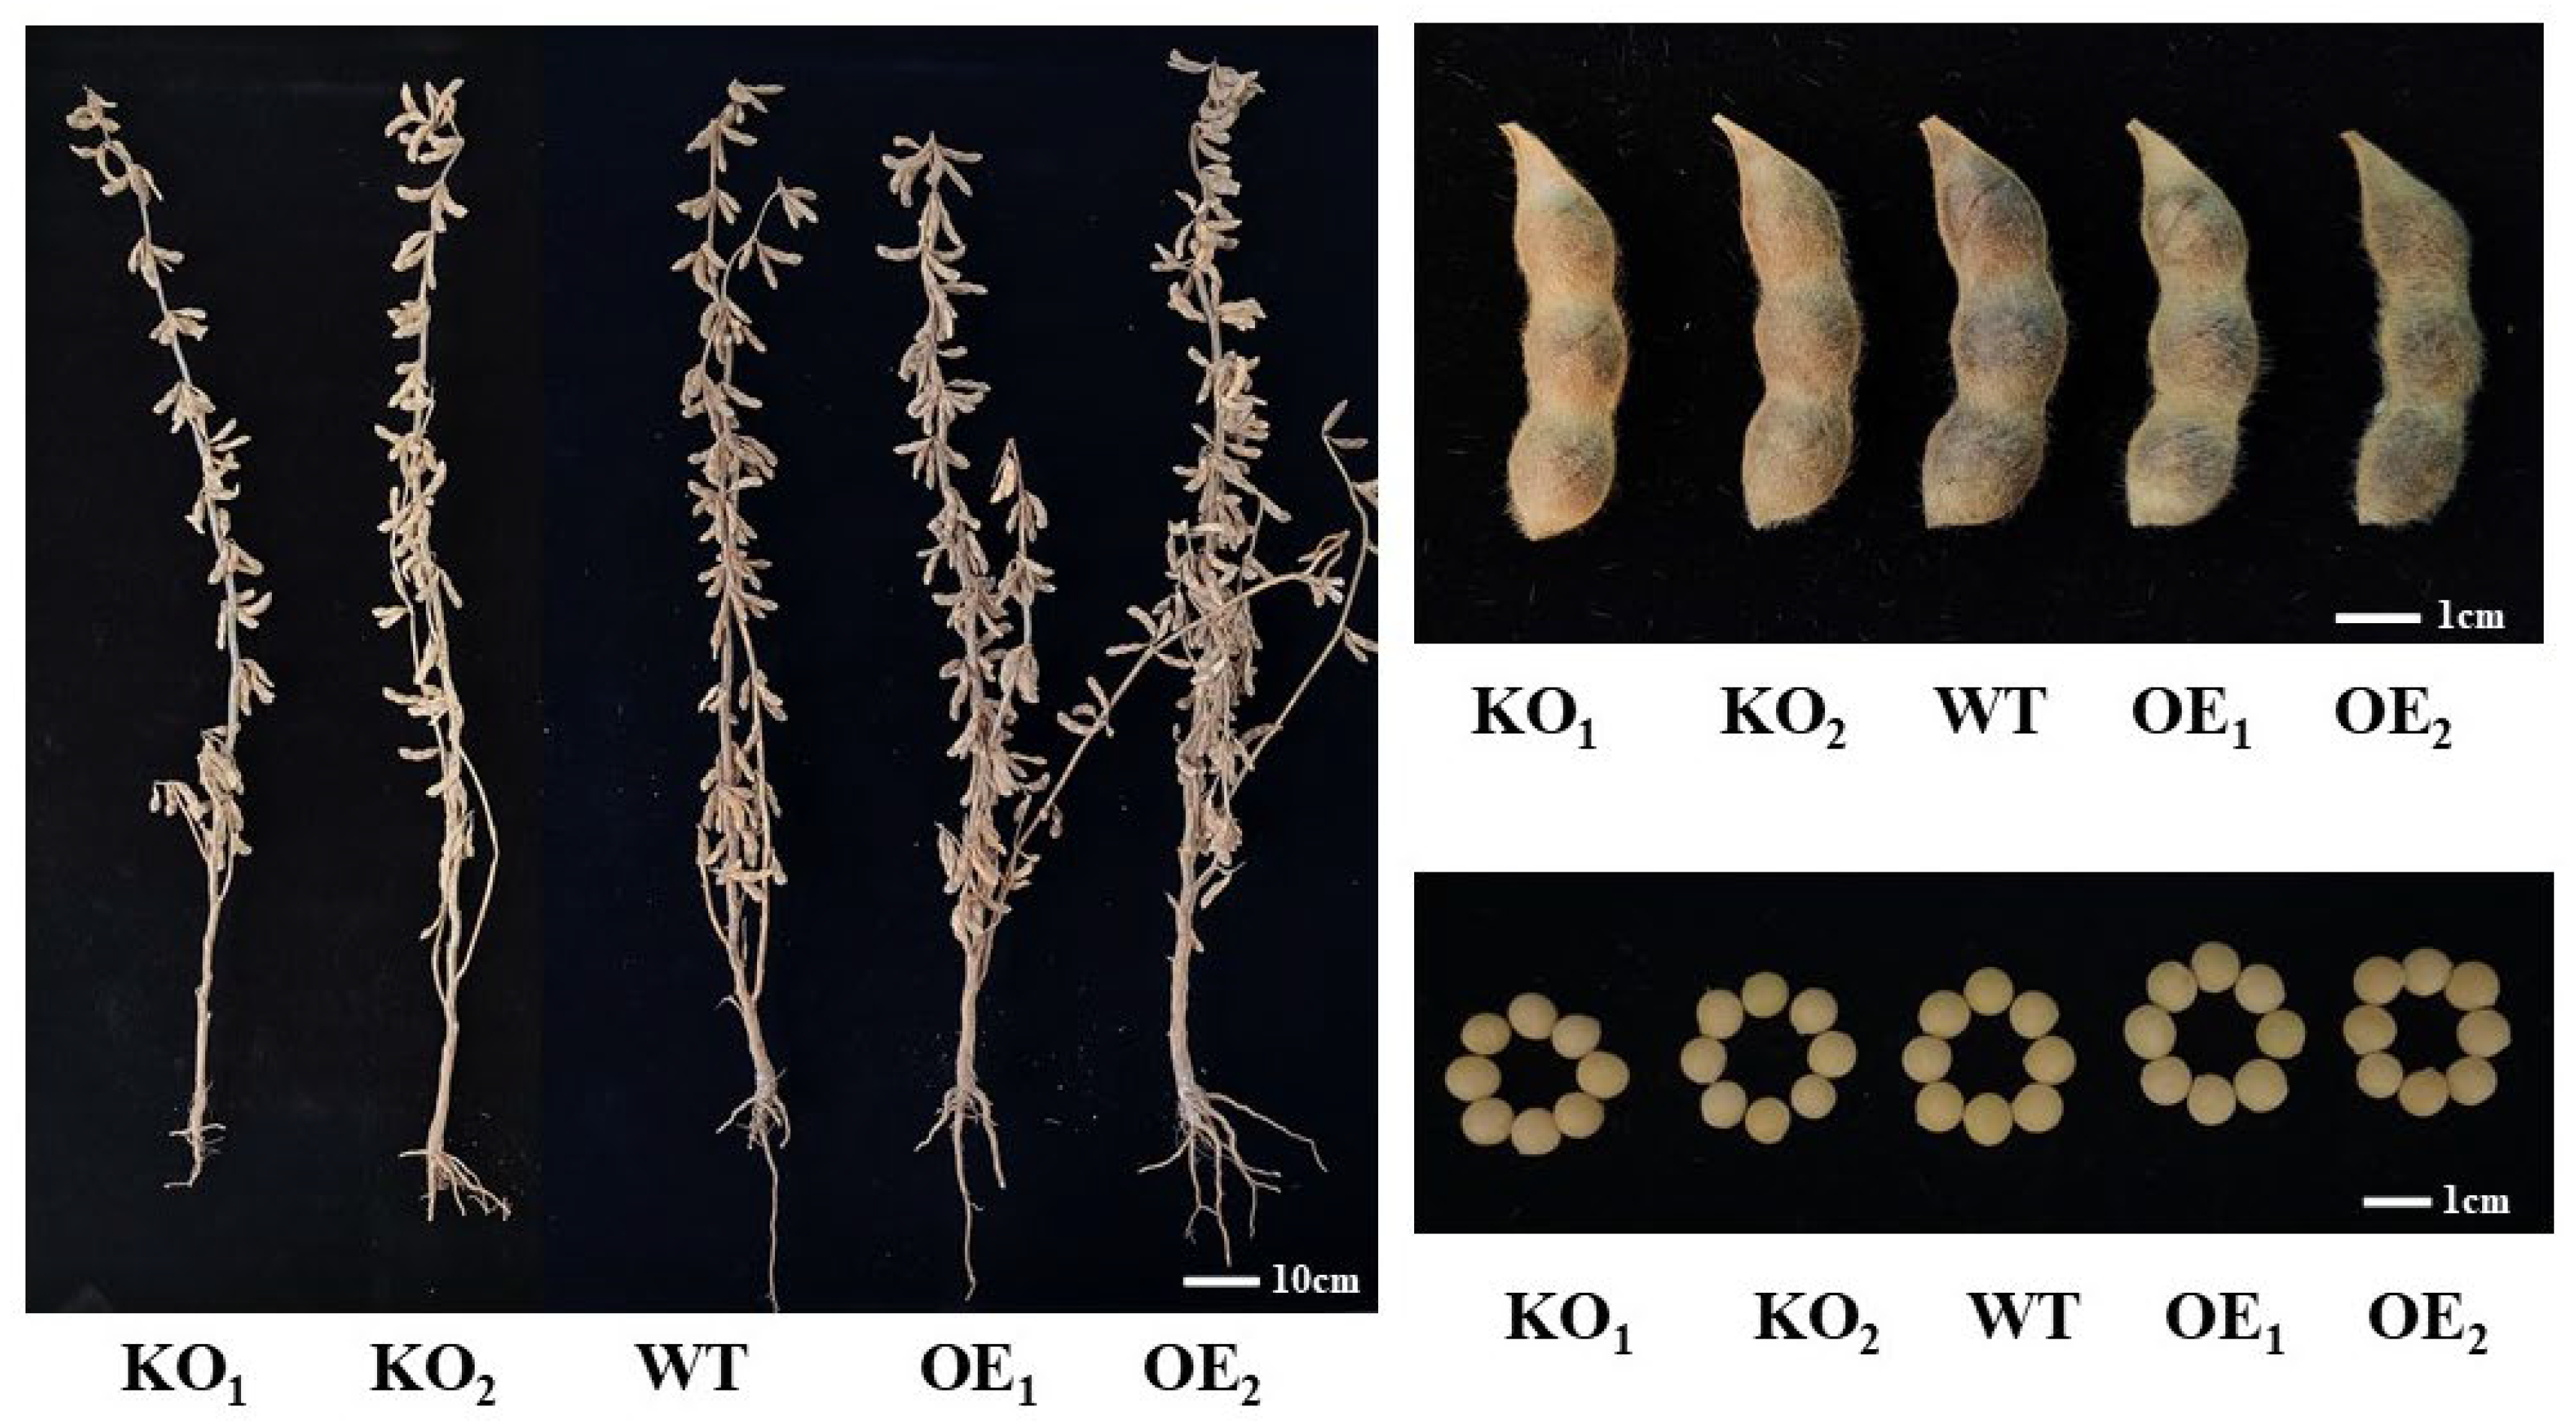
Investigating the agronomic traits of T2 transgenic lines, gene-edited lines, and non-transgenic soybean lines grown in the field, the statistical results are shown in Table 2 and Figure 15. OE1 and OE2 had significantly higher main stem node numbers, pod numbers per plant, and yields per plant than WT, KO1, and KO2. There was no significant difference in plant height, branching, and seed weight between OE1 and OE2 and WT, KO1, and KO2. This indicates that overexpression of the GmPM35 gene has improved some agronomic traits of soybeans.

4. Discussion

Drought stress leads to a loss of plant cellular homeostasis, limited CO2 uptake, and disruption of photosynthesis, which in turn leads to increased accumulation of reactive oxygen species (ROS) [33,34,35]. Under normal environment, the production and scavenging of intracellular ROS secondary products such as superoxide radical (O2•−) and hydrogen peroxide (H2O2) are in dynamic balance. When plants are subjected to drought stress, the dynamic equilibrium is broken, and a large amount of ROS is produced and released in organelles such as mitochondria, chloroplasts, and plasma membranes, leading to oxidative stress in cells and causing oxidative stress [36,37,38]. Oxidative stress disrupts the spatial configuration of membrane proteins and enzymes, increases increased membrane permeability and ion leakage, and affects the normal physiological and biochemical functions of plants [39]. To avoid cellular damage from excessive ROS, plants form a complex series of enzymatic and non-enzymatic antioxidant defense systems to maintain intracellular redox homeostasis. Antioxidant enzymes include superoxide dismutase (SOD), catalase (CAT), and peroxidase (POD) [40,41]. Non-enzymatic components include proline (Pro), etc., which mitigate oxidative damage by reducing ROS activity and synergizing with antioxidant enzymes [42]. In addition to this, ROS generated by disruption of respiratory metabolic pathways caused by dehydration in plants in the face of prolonged drought stress can also lead to a state of oxidative stress [43,44,45]. Plants have dehydration tolerance mechanisms that enable them to maintain membrane integrity and cellular homeostasis and to resume physiological activities after stress cessation [46,47]. These mechanisms are controlled by ABA-dependent and non-dependent pathways, including the synthesis of protective proteins (LEA proteins, dehydrins, and chaperonins) [48,49,50,51]. In this study, Arabidopsis and soybean lines overexpressing the GmPM35 gene, as well as gene-edited soybean lines, were obtained by genetic transformation. By subjecting these lines to drought stress treatment, we found that soybean lines overexpressing the GmPM35 gene showed more significant drought tolerance in terms of germination rate, root length, and rehydration experiments.
Drought stress can also have serious negative effects on plant growth and development, including growth arrest, reduced photosynthesis, and membrane lipid peroxidation. In response to drought stress, plants activate a variety of regulatory mechanisms such as antioxidant enzyme systems, osmoregulation, and signaling pathways. Among them, the antioxidant enzyme system plays a key role in scavenging reactive oxygen species (ROS) and protecting cells from oxidative damage. Superoxide dismutase (SOD), catalase (CAT), and peroxidase (POD) are important antioxidant enzymes in plants, and they play important roles in regulating ROS levels and maintaining cellular redox balance. In this study, we found that soybean lines overexpressing the GmPM35 gene showed significantly higher SOD, CAT, and POD activities under drought conditions. These results suggest that the GmPM35 gene may improve plant tolerance to drought stress by up-regulating antioxidant enzyme activities. In addition, we found that soybean lines overexpressing the GmPM35 gene exhibited lower levels of malondialdehyde (MDA) content, hydrogen peroxide (H2O2), and superoxide anion (O2•−) content. MDA is one of the important products of membrane lipid peroxidation, and its content reflects the degree of cell membrane damage. However, per-H2O2 and O2•− belong to ROS, and their content reflects the level of intracellular oxidative stress. Combined with the results of subcellular localization, the GmPM35 gene may improve the drought tolerance of plants by reducing the level of ROS and alleviating membrane lipid peroxidation damage. Similar to GmLEA4_19 and GmDHN9, which also mitigate oxidative stress in soybeans, GmPM35 enhances drought tolerance by reducing ROS levels. This highlights its potential as a candidate gene for molecular breeding.
Roots are the main organs for plants to absorb water from the soil, and root morphology and development have important effects on plant drought tolerance [52]. In this study, we found that Arabidopsis thaliana and soybean lines overexpressing the GmPM35 gene showed better performance in root morphology and vigor. Specifically, soybean lines overexpressing the GmPM35 gene had more lateral roots and a longer root length under drought conditions. These results suggest that the GmPM35 gene may improve drought tolerance in plants by regulating root morphology and development.
Photosynthesis is an important factor affecting crop yield, which is mainly influenced by CO2 concentration in stomata, water exchange, and photosynthesis in chloroplasts. Under drought stress, plants maintaining higher chlorophyll content can utilize light energy more efficiently, thus improving drought tolerance [53,54,55]. In this study, we measured the photosynthetic physiological indexes and chlorophyll content of transgenic soybean plants, and the results showed that the net photosynthetic rate, transpiration rate, stomatal conductance, intercellular carbon dioxide concentration, and instantaneous water use efficiency were more significantly reduced in the gene-edited and wild-type plants than in the overexpression plants under drought stress. The chlorophyll content of the gene-edited lines was significantly lower than that of the overexpression lines. Then we analyzed the agronomic traits such as plant height, number of main stem nodes, number of effective branches, number of pods per plant, and 100-grain weight per plant of T3-generation GmPM35 overexpression, gene editing, and wild-type soybean lines in the field, and found that T3-generation overexpression lines had significant differences in the number of nodes, number of pods per plant, number of pods per plant, and 100-grain weight per plant, and that the overexpression soybean lines had a higher yield per plant than wild-type strains. The overexpression soybean strain had a higher yield per plant. The actual phenotypes in the field also showed significant correlations with the previously measured photosynthetic physiological indexes, indicating that overexpression of the GmPM35 gene in soybeans can improve the growth and development of soybeans under natural conditions by promoting photosynthesis, increasing the accumulation of dry matter, and improving the efficiency of water utilization in soybeans.
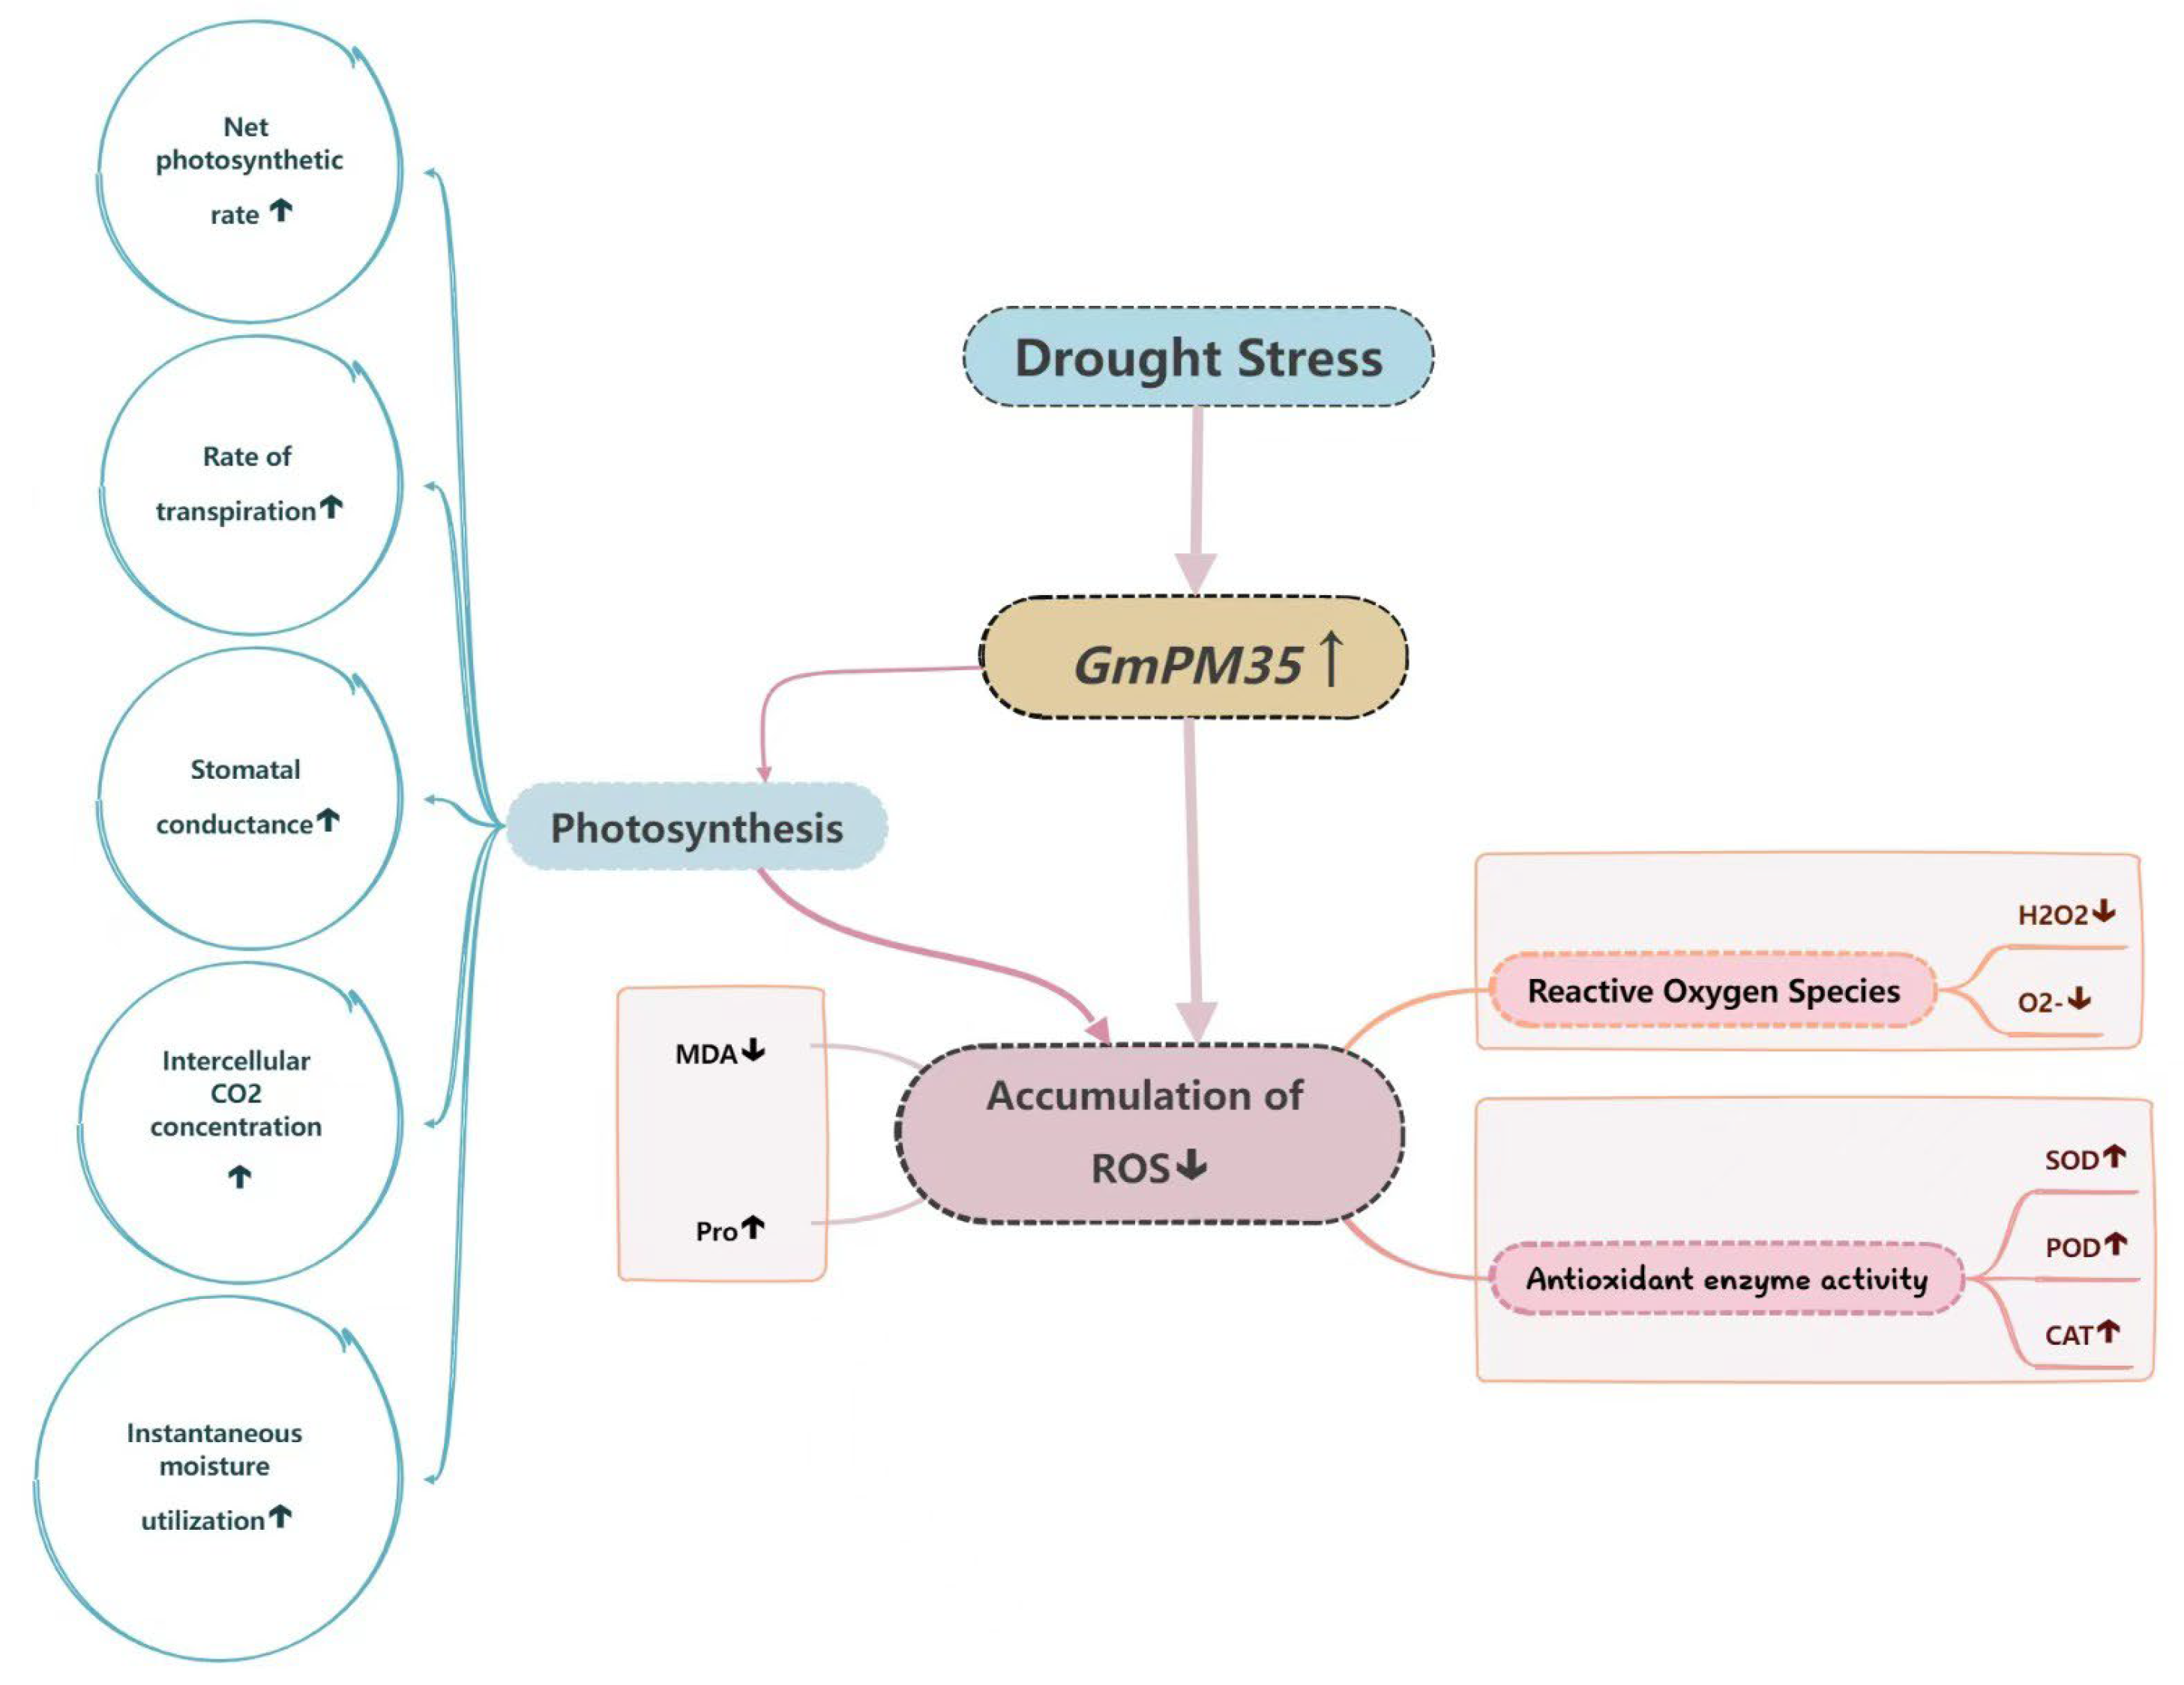
In summary, this study revealed the key role of the GmPM35 gene in the drought tolerance mechanism of soybeans and provided strong support for overexpression of the GmPM35 gene to enhance plant drought tolerance (soybean GmPM35 gene-mediated drought tolerance mechanism is demonstrated in Figure 16). However, this study mainly focused on the effect of drought stress on plant seedlings and did not involve functional validation under long-term drought stress. Therefore, further plot experiments in arid regions are needed in the future to verify the drought tolerance performance of the GmPM35 gene under long-term arid climatic conditions. In-depth studies on the spatiotemporal expression regulatory network of the GmPM35 gene under different drought stress conditions and its molecular mechanism are also needed. The above studies will lay a solid foundation for further confirming the drought-resistant function of the GmPM35 gene and provide more theoretical support for agricultural production applications.

5. Conclusions

In this study, we demonstrated that overexpression of the GmPM35 gene significantly enhances drought tolerance in soybean plants through multiple mechanisms. These mechanisms include improved photosynthetic efficiency, enhanced root vigor, increased proline (Pro) content, decreased malondialdehyde (MDA) content, and protection of antioxidant enzyme activities, all of which contribute to the reduction in reactive oxygen species (ROS) accumulation and attenuation of oxidative damage under drought stress. These physiological and biochemical improvements significantly altered the agronomic traits of soybeans, such as an increased number of pods and higher yield per plant under field conditions, highlighting the potential and practical value of the GmPM35 gene in soybean breeding. These findings lay a solid foundation for utilizing GmPM35 as a key candidate gene for molecular breeding to breed drought-tolerant soybean varieties. Meanwhile, in order to further validate its application, future studies should conduct long-term field trials under different drought conditions to better evaluate the stability and reliability of the drought-tolerant traits conferred by the GmPM35 gene in soybeans.

Supplementary Materials

The following supporting information can be downloaded at https://www.mdpi.com/article/10.3390/agronomy15010192/s1. Figure S1. T-DNA structure of the plant overexpression vector pCAMBIA3301-GmPM35. Figure S2. Structure of recombinant gene editing vector pCAMBIA3301-GmPM35. Figure S3. Diagram of the process of inducing soybean hairy roots. a: sprouting. b-d: induction of hairy roots. Figure S4. Detailed procedure of RNA extraction by Trizol method. Table S1. Reverse Transcription and Fluorescence Quantification Premix Kit Instructions Search for item numbers and URLs. Table S2. The qRT- PCR amplification system. Table S3. The qRT- PCR reaction procedure. Table S4. Construction of Oligo dimer CRISPR/Cas9 plant editing carrier. Table S5. Construction of CRISPR/Cas9 plant editing vector system. Table S6. Primer sequences used in the experiments. Table S7. Physiology and Biochemistry Assay Kit Instruction Manual Search Item No. and URL.

Author Contributions

X.W., S.L. and X.F. conceived and designed the experiments; X.W., Y.S., R.W., X.L., Y.L. (Yongyi Li), T.W., Z.G., Y.L. (Yan Li), W.Q., Q.Z. and M.L. performed the experiments; Y.S. and R.W. analyzed the data; S.G., P.W., S.L. and X.F. contributed reagents/materials/analysis tools; X.W., Y.S. and R.W. wrote the paper. All authors have read and agreed to the published version of the manuscript.

Funding

This study was financially supported by grants from the Biological Breeding—National Science and Technology Major Project (2023ZD0403203-03), the National College Students’ Innovation, and Entrepreneurship Training Program Project (2024).

Institutional Review Board Statement

Not applicable.

Informed Consent Statement

Not applicable.

Data Availability Statement

The datasets used and/or analyzed in this study are available on reasonable request from the corresponding author.

Conflicts of Interest

Author Rui Wang was employed by the company Tianjin Ringpu Bio-Technology Co., Ltd. The remaining authors declare that the research was conducted in the absence of any commercial or financial relationships that could be construed as a potential conflict of interest.

References

  1. Nogrady, B. How to address agriculture’s water woes. Nature 2024, 630, S26–S27. [Google Scholar] [CrossRef]
  2. Tariq, A.; Sardans, J.; Zeng, F.; Graciano, C.; Hughes, A.C.; Farré-Armengol, G.; Peñuelas, J. Impact of aridity rise and arid lands expansion on carbon-storing capacity, biodiversity loss, and ecosystem services. Glob. Chang. Biol. 2024, 30, e17292. [Google Scholar] [CrossRef] [PubMed]
  3. Yimer, E.A.; De Trift, L.; Dondeyne, S.; Speijer, L.; Huysmans, M.; Cools, J.; Nossent, J.; van Griensven, A. Framework for mapping large-scale nature-based solutions for drought mitigation: Regional application in Flanders. Water Res. 2024, 261, 122003. [Google Scholar] [CrossRef] [PubMed]
  4. Foyer, C.H.; Lam, H.-M.; Nguyen, H.T.; Siddique, K.H.M.; Varshney, R.K.; Colmer, T.D.; Cowling, W.; Bramley, H.; Mori, T.A.; Hodgson, J.M.; et al. Neglecting legumes has compromised human health and sustainable food production. Nat. Plants 2016, 2, 16112. [Google Scholar] [CrossRef] [PubMed]
  5. Wang, X.; Zhao, W.; Wei, X.; Sun, Y.; Dong, S. Molecular mechanism of drought resistance in soybean roots revealed using physiological and multi-omics analyses. Plant Physiol. Biochem. 2024, 208, 108451. [Google Scholar] [CrossRef]
  6. Xu, M.; Tong, Q.; Wang, Y.; Wang, Z.; Xu, G.; Elias, G.K.; Li, S.; Liang, Z. Transcriptomic Analysis of the Grapevine LEA Gene Family in Response to Osmotic and Cold Stress Reveals a Key Role for VamDHN3. Plant Cell Physiol. 2020, 61, 775–786. [Google Scholar] [CrossRef] [PubMed]
  7. Cheng, Z.; Zhang, X.; Yao, W.; Zhao, K.; Liu, L.; Fan, G.; Zhou, B.; Jiang, T. Genome-wide search and structural and functional analyses for late embryogenesis-abundant (LEA) gene family in poplar. BMC Plant Biol. 2021, 21, 110. [Google Scholar] [CrossRef] [PubMed]
  8. Jin, X.; Cao, D.; Wang, Z.; Ma, L.; Tian, K.; Liu, Y.; Gong, Z.; Zhu, X.; Jiang, C.; Li, Y. Genome-wide identification and expression analyses of the LEA protein gene family in tea plant reveal their involvement in seed development and abiotic stress responses. Sci. Rep. 2019, 9, 14123. [Google Scholar] [CrossRef]
  9. Borovskii, G.B.; Stupnikova, I.V.; Antipina, A.I.; Vladimirova, S.V.; Voinikov, V.K. Accumulation of dehydrin-like proteins in the mitochondria of cereals in response to cold, freezing, drought and ABA treatment. BMC Plant Biol. 2002, 2, 795–803. [Google Scholar] [CrossRef] [PubMed]
  10. Ma, L.; Zhu, T.; Wang, H.; Zhou, H.; Shao, L.; Ding, Q.; Zhang, D.; Ma, L. Genome-wide identification, phylogenetic analysis and expression profiling of the late embryogene-sis-abundant (LEA) gene family in Brachypodium distachyon. Funct. Plant Biol. 2021, 48, 386–401. [Google Scholar] [CrossRef] [PubMed]
  11. Hundertmark, M.; Hincha, D.K. LEA (Late embryogenesis abundant) proteins and their encoding genes in Arabidopsis thaliana. BioMed Central 2008, 9, 118. [Google Scholar] [CrossRef]
  12. Mowla, S.B.; Cuypers, A.; Driscoll, S.P.; Kiddle, G.; Thomson, J.; Foyer, C.H.; Theodoulou, F.L. Yeast complementation reveals a role for an Arabidopsis thaliana late embryogenesis abundant (LEA)-like protein in oxidative stress tolerance. Plant J. 2006, 48, 743–756. [Google Scholar] [CrossRef]
  13. Zhang, Y.; Zhang, X.; Zhu, L.; Wang, L.; Zhang, H.; Zhang, X.; Xu, S.; Xue, J. Identification of the Maize LEA Gene Family and Its Relationship with Kernel Dehydration. Plants 2023, 12, 3674. [Google Scholar] [CrossRef]
  14. Bies-Ethève, N.; Gaubier-Comella, P.; Debures, A.; Lasserre, E.; Jobet, E.; Raynal, M.; Cooke, R.; Delseny, M. Inventory, evolution and expression profiling diversity of the LEA (late embryogenesis abundant) protein gene family in Arabidopsis thaliana. Plant Mol. Biol. 2008, 67, 107–124. [Google Scholar] [CrossRef] [PubMed]
  15. Wang, W.; Liu, Y.; Kang, Y.; Liu, W.; Li, S.; Wang, Z.; He, X. Genome-wide characterization of LEA gene family reveals a positive role of BnaA.LEA6.a in freezing tolerance in rapeseed (Brassica napus L.). BMC Plant Biol. 2024, 24, 433. [Google Scholar] [CrossRef]
  16. Huang, R.; Xiao, D.; Wang, X.; Zhan, J.; Wang, A.; He, L. Genome-wide identification, evolutionary and expression analyses of LEA gene family in peanut (Arachis hypogaea L.). BMC Plant Biol. 2022, 22, 155. [Google Scholar] [CrossRef]
  17. Muvunyi, B.P.; Yan, Q.; Wu, F.; Min, X.; Yan, Z.Z.; Kanzana, G.; Zhang, J. Mining Late Embryogenesis Abundant (LEA) Family Genes in Cleistogenes songorica, a Xerophyte Perennial Desert Plant. Int. J. Mol. Sci. 2018, 19, 3430. [Google Scholar] [CrossRef] [PubMed]
  18. Zhao, Y.; Hao, Y.; Dong, Z.; Tang, W.; Wang, X.; Li, J.; Zhang, Z. Identification and expression analysis of LEA gene family members in pepper (Capsicum annuum L.). FEBS Open Bio 2023, 13, 2246–2262. [Google Scholar] [CrossRef] [PubMed]
  19. Jia, J.-S.; Ge, N.; Wang, Q.-Y.; Zhao, L.-T.; Chen, C.; Chen, J.-W. Genome-wide identification and characterization of members of the LEA gene family in Panax notoginseng and their transcriptional responses to dehydration of recalcitrant seeds. BMC Genom. 2023, 24, 126. [Google Scholar] [CrossRef] [PubMed]
  20. Chen, J.; Li, N.; Wang, X.; Meng, X.; Cui, X.; Chen, Z.; Liu, H. Late embryogenesis abundant (LEA) gene family in Salvia miltiorrhiza: Identification, expression analysis, and response to drought stress. Plant Signal Behav. 2021, 16, 1891769. [Google Scholar] [CrossRef] [PubMed]
  21. Wang, Q.; Lei, X.; Wang, Y.; Di, P.; Meng, X.; Peng, W.; Rong, J.; Wang, Y. Genome-wide identification of the LEA gene family in Panax ginseng: Evidence for the role of PgLEA2-50 in plant abiotic stress response. Plant Physiol. Biochem. 2024, 212, 108742. [Google Scholar] [CrossRef] [PubMed]
  22. Cuevas-Velazquez, C.L.; Saab-Rincón, G.; Reyes, J.L.; Covarrubias, A.A. The unstructured N-terminal region of Arabidops is group 4 late embryogenesis abundant proteins (LEA) is required for folding and for chaperone-like activity under water deficit. J. Biol. Chem. 2016, 291, 10893–10903. [Google Scholar] [CrossRef] [PubMed]
  23. Wang, Z.; Zhang, Q.; Qin, J.; Xiao, G.; Zhu, S.; Hu, T. OsLEA1a overexpression enhances tolerance to diverse abiotic stresses by inhibiting cell membrane damage and enhancing ROS scavenging capacity in transgenic rice. Funct Plant Biol. 2021, 48, 860–870. [Google Scholar] [CrossRef]
  24. Luo, D.; Hou, X.; Zhang, Y.; Meng, Y.; Zhang, H.; Liu, S.; Wang, X.; Chen, R. CaDHN5, a Dehydrin Gene from Pepper, Plays an Important Role in Salt and Osmotic Stress Responses. Int. J. Mol. Sci. 2019, 20, 1989. [Google Scholar] [CrossRef] [PubMed]
  25. Liu, Y.; Liang, J.; Sun, L.; Yang, X.; Li, D. Group 3 LEA Protein, ZmLEA3, Is Involved in Protection from Low Temperature Stress. Front. Plant Sci. 2016, 7, 1011. [Google Scholar] [CrossRef] [PubMed]
  26. Fan, J.; Zhang, Y.; Sun, H.; Duan, R.; Jiang, Y.; Wang, X.; Sun, Y.; Luo, Z.; Wang, P.; Guan, S.; et al. Overexpression of soybean GmDHN9 gene enhances drought resistance of transgenic Arabidopsis. GM Crops Food 2024, 15, 118–129. [Google Scholar] [CrossRef]
  27. Guo, B.; Zhang, J.; Yang, C.; Dong, L.; Ye, H.; Valliyodan, B.; Nguyen, H.T.; Song, L. The Late Embryogenesis Abundant Proteins in Soybean: Identification, Expression Analysis, and the Roles of GmLEA4_19 in Drought Stress. Int. J. Mol. Sci. 2023, 24, 14834. [Google Scholar] [CrossRef]
  28. Zhang, X.; Henriques, R.; Lin, S.-S.; Niu, Q.-W.; Chua, N.-H. Agrobacterium-mediated transformation of Arabidopsis thaliana using the floral dip method. Nat. Protoc. 2006, 1, 641–646. [Google Scholar] [CrossRef]
  29. Kereszt, A.; Li, D.; Indrasumunar, A.; Nguyen, C.D.; Nontachaiyapoom, S.; Kinkema, M.; Gresshoff, P.M. Agrobacterium rhizogenes-mediated transformation of soybean to study root biology. Nat. Protoc. 2007, 2, 948–952. [Google Scholar] [CrossRef]
  30. Freitas-Alves, N.S.; Moreira-Pinto, C.E.; Távora, F.T.; Paes-de-Melo, B.; Arraes, F.B.; Lourenço-Tessutti, I.T.; Grossi-de-Sa, M.F. CRISPR/Cas genome editing in soybean: Challenges and new insights to overcome existing bottle-necks. J. Adv. Res. 2024. [Google Scholar] [CrossRef] [PubMed]
  31. Chen, Z.; Fang, X.; Yuan, X.; Zhang, Y.; Li, H.; Zhou, Y.; Cui, X. Overexpression of Transcription Factor GmTGA15 Enhances Drought Tolerance in Transgenic Soybean Hairy Roots and Arabidopsis Plants. Agronomy 2021, 11, 170. [Google Scholar] [CrossRef]
  32. Kumar, M.S.; Mawlong, I.; Ali, K.; Tyagi, A. Regulation of phytosterol biosynthetic pathway during drought stress in rice. Plant Physiol. Biochem. 2018, 129, 11–20. [Google Scholar] [CrossRef] [PubMed]
  33. Tanveer, M.; Shahzad, B.; Sharma, A.; Khan, E.A. 24-Epibrassinolide application in plants: An implication for improving drought stress tolerance in plants. Plant Physiol. Biochem. 2018, 135, 295–303. [Google Scholar] [CrossRef] [PubMed]
  34. Nadarajah, K.K. ROS Homeostasis in Abiotic Stress Tolerance in Plants. Int. J. Mol. Sci. 2020, 21, 5208. [Google Scholar] [CrossRef] [PubMed]
  35. Mishra, N.; Jiang, C.; Chen, L.; Paul, A.; Chatterjee, A.; Shen, G. Achieving abiotic stress tolerance in plants through antioxidative defense mechanisms. Front. Plant Sci. 2023, 14, 1110622. [Google Scholar] [CrossRef] [PubMed]
  36. Noctor, G.; Reichheld, J.P.; Foyer, C.H. Accepted manuscript title: ROS-related redox regulation and signaling in plants. Semin. Cell Dev. Biol. 2019, 15, 4–18. [Google Scholar]
  37. Zandalinas, S.I.; Mittler, R. ROS-induced ROS release in plant and animal cells. Free. Radic. Biol. Med. 2018, 122, 21–27. [Google Scholar] [CrossRef]
  38. Huang, H.; Ullah, F.; Zhou, D.-X.; Yi, M.; Zhao, Y. Mechanisms of ROS Regulation of Plant Development and Stress Responses. Front. Plant Sci. 2019, 10, 800. [Google Scholar] [CrossRef]
  39. Ogura, T.; Goeschl, C.; Filiault, D.; Mirea, M.; Slovak, R.; Wolhrab, B.; Satbhai, S.B.; Busch, W. Root System Depth in Arabidopsis Is Shaped by EXOCYST70A3 via the Dynamic Modulation of Auxin Transport. Cell 2019, 178, 400–412.e16. [Google Scholar] [CrossRef]
  40. Fàbregas, N.; Lozano-Elena, F.; Blasco-Escámez, D.; Tohge, T.; Martínez-Andújar, C.; Albacete, A.; Osorio, S.; Bustamante, M.; Riechmann, J.L.; Nomura, T.; et al. Overexpression of the vascular brassinosteroid receptor BRL3 confers drought resistance without penalizing plant growth. Nat. Commun. 2018, 9, 4680. [Google Scholar] [CrossRef] [PubMed]
  41. Thompson, A.J.; Andrews, J.; Mulholland, B.J.; McKee, J.M.; Hilton, H.W.; Horridge, J.S.; Taylor, I.B. Overproduction of abscisic acid in tomato increases transpiration efficiency and root hydraulic con-ductivity and influences leaf expansion. Plant Physiol. 2007, 143, 1905–1917. [Google Scholar] [CrossRef] [PubMed]
  42. Meena, M.; Divyanshu, K.; Kumar, S.; Swapnil, P.; Zehra, A.; Shukla, V.; Yadav, M.; Upadhyay, R.S. Regulation of L-proline biosynthesis, signal transduction, transport, accumulation and its vital role in plants during variable environmental conditions. Heliyon 2019, 5, e02952. [Google Scholar] [CrossRef] [PubMed]
  43. Samtani, H.; Sharma, A.; Khurana, P. Overexpression of HVA1 Enhances Drought and Heat Stress Tolerance in Triticum aestivum Doubled Haploid Plants. Cells 2022, 11, 912. [Google Scholar] [CrossRef] [PubMed]
  44. Molinari, M.D.C.; Fuganti-Pagliarini, R.; Marin, S.R.R.; Ferreira, L.C.; Barbosa, D.D.A.; Marcolino-Gomes, J.; Nepomuceno, A.L. Overexpression of AtNCED3 gene improved drought tolerance in soybean in greenhouse and field conditions. Genet Mol. Biol. 2020, 43, e20190292. [Google Scholar] [CrossRef] [PubMed]
  45. Wang, N.; Zhang, W.; Qin, M.; Li, S.; Qiao, M.; Liu, Z.; Xiang, F. Drought Tolerance Conferred in Soybean (Glycine max. L) by GmMYB84, a Novel R2R3-MYB Transcription Factor. Plant Cell Physiol. 2017, 58, 1764–1776. [Google Scholar] [CrossRef]
  46. Qiao, M.; Hong, C.; Jiao, Y.; Hou, S.; Gao, H. Impacts of Drought on Photosynthesis in Major Food Crops and the Related Mechanisms of Plant Responses to Drought. Plants 2024, 13, 1808. [Google Scholar] [CrossRef]
  47. Wahab, A.; Abdi, G.; Saleem, M.H.; Ali, B.; Ullah, S.; Shah, W.; Mumtaz, S.; Yasin, G.; Muresan, C.C.; Marc, R.A. Plants’ Physio-Biochemical and Phyto-Hormonal Responses to Alleviate the Adverse Effects of Drought Stress: A Comprehensive Review. Plants 2022, 11, 1620. [Google Scholar] [CrossRef] [PubMed]
  48. Shi, H.; He, X.; Zhao, Y.; Lu, S.; Guo, Z. Constitutive expression of a group 3 LEA protein from Medicago falcata (MfLEA3) increases cold and drought tolerance in transgenic tobacco. Plant Cell Rep. 2020, 39, 851–860. [Google Scholar] [CrossRef] [PubMed]
  49. Fiorillo, A.; Mattei, M.; Aducci, P.; Visconti, S.; Camoni, L. The Salt Tolerance Related Protein (STRP) Mediates Cold Stress Responses and Abscisic Acid Signalling in Arabidopsis thaliana. Front. Plant Sci. 2020, 11, 1251. [Google Scholar] [CrossRef] [PubMed]
  50. Su, M.; Huang, G.; Zhang, Q.; Wang, X.; Li, C.; Tao, Y.; Zhang, S.; Lai, J.; Yang, C.; Wang, Y. The LEA protein, ABR, is regulated by ABI5 and involved in dark-induced leaf senescence in Arabidopsis thaliana. Plant Sci. 2016, 247, 93–103. [Google Scholar] [CrossRef]
  51. He, L.; Bian, J.; Xu, J.; Yang, K. Novel Maize NAC Transcriptional Repressor ZmNAC071 Confers Enhanced Sensitivity to ABA and Osmotic Stress by Downregulating Stress-Responsive Genes in Transgenic Arabidopsis. J. Agric. Food Chem. 2019, 67, 8905–8918. [Google Scholar] [CrossRef]
  52. Xiaoqin, L.; Yue, L.; Shangwei, Z. Interplay between Light and Plant Hormones in the Control of Arabidopsis Seedling Chlo-rophyll Biosynthesis. Front. Plant Sci. 2017, 8, 1433–1454. [Google Scholar]
  53. Li, W.; Zheng, X.; Cheng, R.; Zhong, C.; Zhao, J.; Liu, T.H.; Liu, S. Soybean ZINC FINGER PROTEIN03 targets two SUPEROXIDE DISMUTASE1s and confers resistance to Phytophthora sojae. Plant Physiol. 2023, 192, 633–647. [Google Scholar] [CrossRef]
  54. Sharma, A.; Wang, J.; Xu, D.; Tao, S.; Chong, S.; Yan, D.; Li, Z.; Yuan, H.; Zheng, B. Melatonin regulates the functional components of photosynthesis, antioxidant system, gene expression, and metabolic pathways to induce drought resistance in grafted Carya cathayensis plants. Sci. Total Environ. 2020, 713, 136675. [Google Scholar] [CrossRef]
  55. Yao, T.; Ding, C.; Che, Y.; Zhang, Z.; Cui, C.; Ji, G.; Song, J.; Zhang, H.; Ao, H.; Zhang, H. Heterologous expression of Zygophyllum xanthoxylon zinc finger protein gene (ZxZF) enhances the tolerance of poplar photosynthetic function to drought stress. Plant Physiol. Biochem. 2023, 199, 107748. [Google Scholar] [CrossRef]
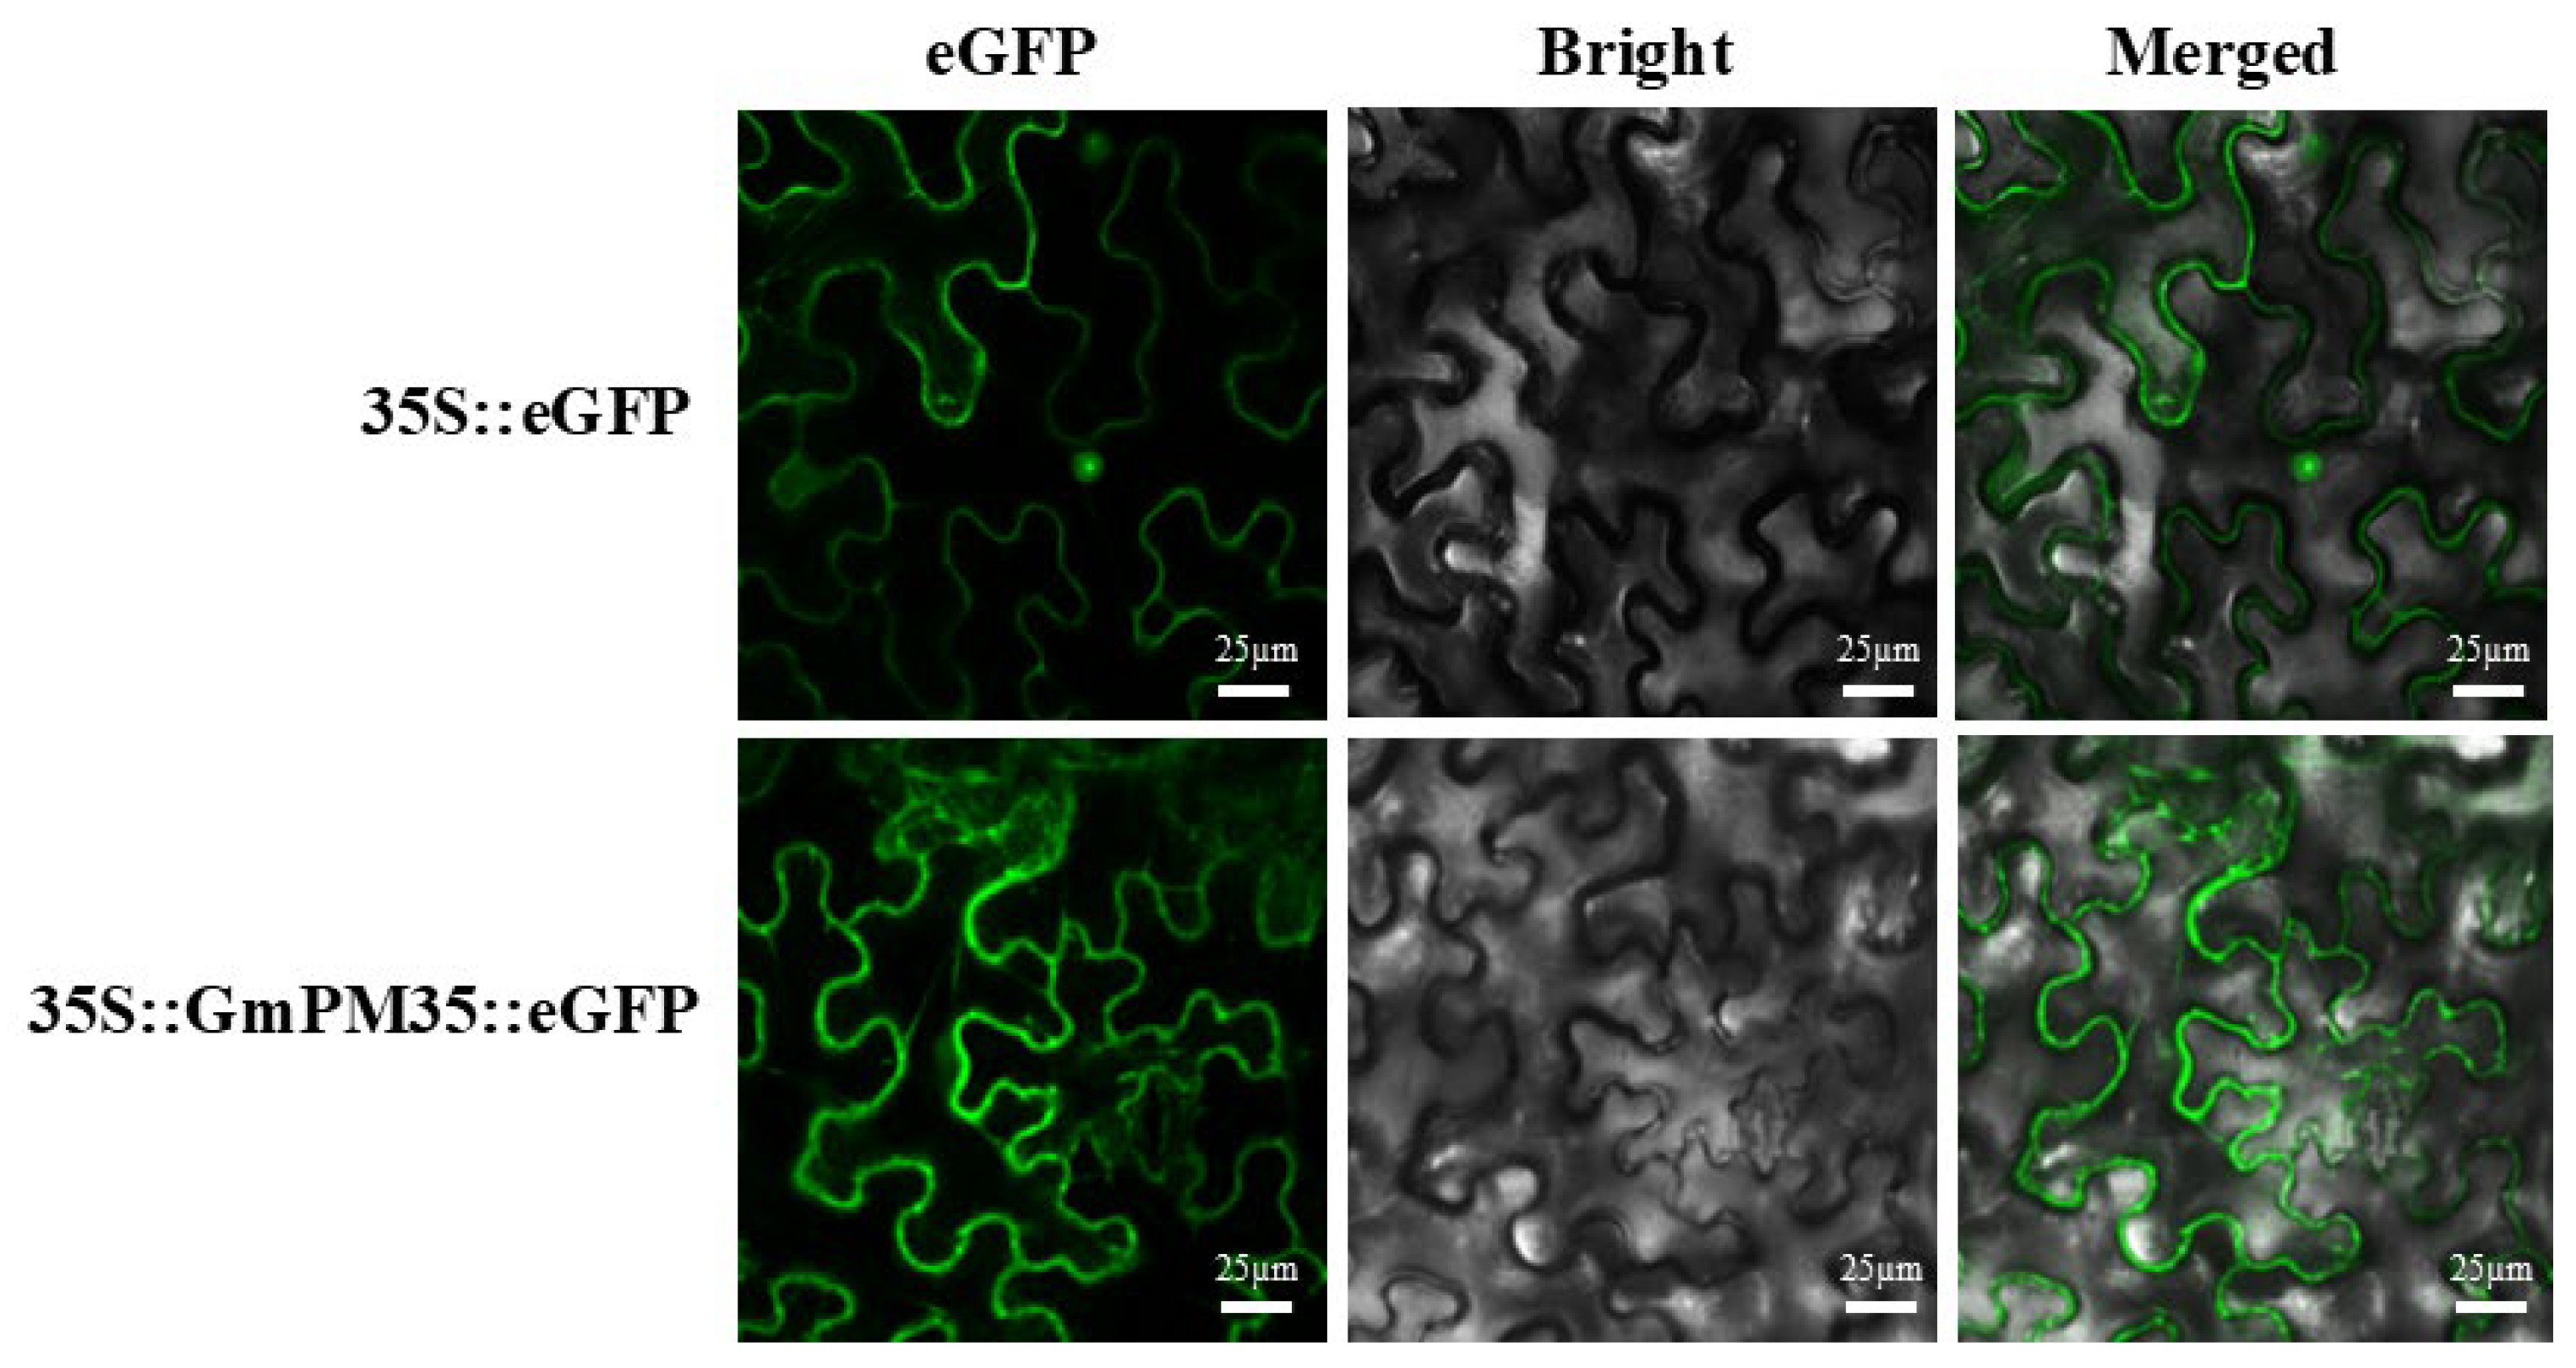
Figure 1. Subcellular localization of GmPM35 protein in the lower epidermal cells of Nicotiana benthamiana. Enhanced green fluorescent protein (eGFP), bright field images, and merged images are shown from left to right. Fluorescence was observed with a confocal microscope. Scale bar = 25 µm.
Agronomy 15 00192 g001
Figure 2. Tissue-specific expression of GmPM35 gene in soybean and analysis of GmPM35 gene expression under abiotic stress: (A) Electropherogram of total RNA extracted from soybean. (B) Analysis of GmPM35 gene expression in different tissues at different developmental stages; n = 3. Error line indicates standard deviation. (C) Analysis of GmPM35 gene expression under abiotic stress; n = 3. Error lines indicate standard deviation.
Agronomy 15 00192 g002
Figure 3. Correlation statistical analysis of gene expression, germination rate, and green shoot rate in transgenic Arabidopsis overexpressing lines. (A) PCR detection of transgenic Arabidopsis in T2 generation. m: DL2000 marker; P: positive control; N: negative control; CK: wild-type control; 1–11: PCR products; n = 3. (B) qRT-PCR to detect the expression of different strains of T3-generation transgenic Arabidopsis thaliana; n = 3. (C) Germination rate statistics of wild type (WT) and transgenic Arabidopsis thaliana (OE) inoculated in 1/2 MS solid medium. Error lines indicate standard deviation. (D) Statistics of green seedling rate in wild-type (WT) and transgenic Arabidopsis (OE) inoculated in 1/2 MS solid medium. Error lines indicate standard deviation. (E) Germination rate statistics of wild-type (WT) and transgenic Arabidopsis thaliana (OE) inoculated in 1/2 MS + 200 mmol/L mannitol solid medium. Error lines indicate standard deviation. (F) Statistics of green seedling rate in wild-type (WT) and transgenic Arabidopsis (OE) inoculated in 1/2 MS + 200 mmol/L mannitol solid medium. Error lines indicate standard deviations.
Agronomy 15 00192 g003
Figure 4. Root length and fresh weight statistics of wild-type (WT) and transgenic Arabidopsis thaliana (OE) under mannitol-modeled drought stress. (A) Root length statistics of each strain under 1/2 MS and mannitol treatment conditions; n ≥ 3. Error lines indicate standard deviation. (*) p < 0.05 and (**) p < 0.01. (B) Statistics of fresh weight of each strain under 1/2 MS and mannitol treatment conditions; n ≥ 3. Error lines indicate standard deviation. (*) p < 0.05 and (**) p < 0.01. (C) Root length phenotypes of each strain under 1/2 MS conditions. (D) Root length phenotypes of each strain under mannitol treatment conditions.
Agronomy 15 00192 g004
Figure 5. Rehydration test of T2-generation transgenic Arabidopsis thaliana and its biochemical index analysis under drought stress. (A) T2-generation transgenic Arabidopsis thaliana drought and rehydration assays, the front panel is after drought treatment, and the back panel is after rehydration. (B) Survival rate of each Arabidopsis strain after rehydration; the error line indicates the standard deviation. (C) Analysis of MDA content determination of Arabidopsis lines before and after drought stress; n = 3. (**) p < 0.01. The error line indicates the standard deviation. (D) Analysis of POD activity of Arabidopsis strains before and after drought stress; n = 3. (**) p < 0.01. Error lines indicate standard deviation. (E) Determination and analysis of Pro content in each Arabidopsis strain before and after drought stress; n = 3. (**) p < 0.01. The error line indicates the standard deviation. (F) Determination and analysis of SOD content in each Arabidopsis strain before and after drought stress; n = 3. (**) p < 0.01. Error lines indicate standard deviation.
Agronomy 15 00192 g005
Figure 6. Bar gene detection in soybean hairy roots and qRT-PCR under drought stress. (A) Bar gene assay of transformed overexpression vector pCAMBIA3301-GmPM35 soybean hairy root. M: DL2000 marker; P: positive control; N: negative control; CK: K599 hairy root control; 1–9: PCR products. (B) Expression analysis of overexpression of soybean hairy root under drought stress; n = 3. (*) p < 0.05 and (**) p < 0.01. The error line represents the standard deviation.
Agronomy 15 00192 g006
Figure 7. Phenograms of the root system phenotypes of overexpressed soybean hairy roots under drought stress. (A) Comparison of the root system of soybean hairy roots without stress. (B) Root system changes of overexpressed soybean hairy roots under drought stress: (a,c,e,g) unstressed hairy roots, (b,d,f,h) hairy roots after 7 days of drought stress, (a,b) K599 hairy roots, and (ch) overexpressed hairy roots.
Agronomy 15 00192 g007
Figure 8. Analysis of physiological and biochemical indicators of drought tolerance in overexpressed soybean hairy roots under drought stress. (A) Measurement and analysis of SOD activity in K599 hairy roots and overexpressed hairy roots before and after drought stress; n = 3. (**) p < 0.01. Error lines indicate standard deviation. (B) Analysis of POD activity in K599 and overexpressed roots before and after drought stress; n = 3. (**) p < 0.01. Error lines indicate standard deviation. (C) Analysis of Pro content in K599 and overexpressed roots before and after drought stress; n = 3. (**) p < 0.01. Error lines indicate standard deviation. (D) analysis of MDA content in K599 and overexpressed roots before and after drought stress; n = 3. Error line indicates standard deviation. (E) Analysis of root activity in K599 and overexpressed roots before and after drought stress; n = 3. Error lines indicate standard deviations.
Agronomy 15 00192 g008
Figure 9. Analysis of GmPM35 gene target design and editing in soybean hairy roots: (A) GmPM35 gene target design. (B) Analysis of editing in soybean hairy roots transfected with pCBSG015-GmPM35 vector.
Agronomy 15 00192 g009
Figure 10. Identification and gene expression analysis of soybean overexpression and gene editing plants with GmPM35 gene in T3 generation. (A) Diagram of soybean genetic transformation process by Agrobacterium-mediated method. a: germination diagram, b: pre-cultivation diagram, c, d: first sieve and second sieve diagrams, e: elongation diagram, f: rooting diagram, and g: seedling refining and transplanting diagram. (B) PCR assay of T3-generation overexpression plants. m: DL5000 Marker, n: negative control, 1–9: PCR products. (C) GmPM35 gene expression assay in different soybean lines; n = 3. Error lines indicate standard deviation; (*) denotes p < 0.01 and (**) denotes p < 0.05. (D) Analysis of editing in soybean KO1 and KO2 lines transformed with the pCBSG015-GmPM35 vector.
Agronomy 15 00192 g010
Figure 11. Determination of germination rate and shoot length of T3-generation positive soybean plants under drought stress. (A) Relative germination rates of different soybean lines under drought stress; n ≥ 3. Error lines indicate standard deviations; (*) denotes p < 0.01 and (**) denotes p < 0.05. (B) Determination of shoot length of different soybean lines; n = 3. Error lines denote standard deviation; (*) denotes p < 0.01 and (**) denotes p < 0.05. (C) Comparison of shoot length of different soybean lines under drought stress.
Agronomy 15 00192 g011
Figure 12. Root phenotypes of T3-generation positive soybean plants in rehydration test and drought stress. (A) Comparison of drought and rehydration phenotypes of different soybean lines: (a) before drought, (b) 10 days of drought, and (c) 3 days of rehydration. (B) Comparison of root length phenotypes of different soybean lines in natural drought: (a) before drought and (b) 10 days of drought. (C) Determination of root length and other indexes of different soybean lines; n ≥ 3. Error lines indicate standard deviation. (*) p < 0.05, (**) p < 0.01.
Agronomy 15 00192 g012
Figure 13. Determination of biochemical indexes in T3-generation transgenic soybean plants. (A) Chlorophyll content of different soybean lines before and after drought stress; n ≥ 3. Error lines indicate standard deviations. (*) p < 0.05, (**) p < 0.01. (B) Determination of proline in different soybean lines before and after drought stress; n ≥ 3. Error lines indicate standard deviation. (*) p < 0.05, (**) p < 0.01. (C) Comparison of malondialdehyde content in different soybean strains before and after drought stress; n ≥ 3. Error lines indicate standard deviation. (*) p < 0.05, (**) p < 0.01. (D) Measurement of SOD activity in different soybean lines before and after drought stress; n ≥ 3. Error lines indicate standard deviation. (*) p < 0.05, (**) p < 0.01; n ≥ 3. Error lines indicate standard deviation. (*) p < 0.05, (**) p < 0.01. (E) Determination of POD activity in different soybean lines before and after drought stress; n ≥ 3. Error lines indicate standard deviation. (*) p < 0.05, (**) p < 0.01. (F) Measurement of CAT activity in different soybean lines before and after drought stress; n ≥ 3. Error lines indicate standard deviation. (*) p < 0.05, (**) p < 0.01.
Agronomy 15 00192 g013
Figure 14. T3-generation transgenic soybean plants’ biochemical indexes were determined. (A) DAB staining and NBT staining of different soybean lines before and after drought stress: (a) DAB staining and (b) NBT staining. (B) Determination of O2•− and H2O2 content in different soybean lines before and after drought stress; a: O2•− content and b: H2O2 content CAT activity in different soybean lines before and after drought stress; n ≥ 3. Error lines indicate standard deviation. (*) p < 0.05, (**) p < 0.01.
Agronomy 15 00192 g014
Figure 15. Comparison of agronomic traits of different soybean strains.
Agronomy 15 00192 g015
Figure 16. Soybean GmPM35 gene − mediated drought tolerance mechanism is demonstrated.
Agronomy 15 00192 g016
Table 1. Determination of photosynthetic physiological indexes in transgenic soybean plants.
Photosynthetic IndexesLineNormal7 Days of Drought
Net photosynthetic rate (Pn) μmol/(m2·s)KO16.564 ± 0.48 b3.51 ± 0.51 c
KO27.481 ± 0.42 b3.847 ± 0.43 b
WT6.860 ± 0.38 b3.715 ± 0.47 b
OE18.981 ± 0.44 a6.494 ± 0.50 a
OE28.893 ± 0.41 a6.679 ± 0.44 a
Rate of transpiration (Tr) mol/(m2·s)KO12.458 ± 0.01 c1.886 ± 0.64 b
KO22.679 ± 0.05 b1.652 ± 0.66 c
WT2.697 ± 0.07 b1.942 ± 0.08 b
OE12.971 ± 0.11 a2.680 ± 0.11 a
OE23.028 ± 0.08 a2.745 ± 0.15 a
Stomatal conductance (Gs) mmol/(m2·s)KO11.208 ± 0.06 c0.203 ± 0.05 c
KO20.954 ± 0.03 d0.198 ± 0.08 c
WT1.348 ± 0.07 c0.234 ± 0.05 c
OE11.697 ± 0.04 a0.491 ± 0.06 a
OE21.801 ± 0.04 a0.572 ± 0.07 a
Intercellular CO2 concentration (Ci) μmol/molKO1370.294 ± 16.28 b272.588 ± 15.85 c
KO2367.912 ± 15.46 b264.568 ± 16.11 bc
WT378.128 ± 13.85 b248.716 ± 14.67 bc
OE1394.295 ± 18.78 a358.191 ± 12.49 a
OE2400.344 ± 13.66 a376.564 ± 15.72 a
Instantaneous water use efficiency (WUEi) Pn/TrKO12.668 ± 0.03 c1.861 ± 0.02 c
KO22.791 ± 0.05 b2.328 ± 0.03 b
WT2.543 ± 0.04 c1.913 ± 0.04 c
OE13.023 ± 0.05 a2.423 ± 0.04 a
OE22.937 ± 0.02 a2.433 ± 0.05 a
Note: Analysis of variance (ANOVA) was performed using Duncan’s new multiple range test (MRT), with different lowercase letters indicating significant differences (p < 0.05).
Table 2. Comparison of yields of different soybean strains.
LinePlant Height (cm)Number of Main Stem SegmentsEffective Branch NumberNumber of Pods per PlantNumber of Main Stem PodsYield per Plant (g)Hundred-Grain Weight (g)
KO199.38 ± 6.22 a20.11 ± 1.9 b2.11 ± 1.93 a107.11 ± 34.84 bc78.33 ± 15.07 b34.76 ± 2.38 b17.57 ± 1.59 a
KO297.36 ± 5.25 a19.81 ± 1.16 ab3.25 ± 1.53 a115.42 ± 41.81 c81.21 ± 10.36 b36.56 ± 2.95 b17.79 ± 0.78 a
WT100.15 ± 3.87 a19.48 ± 1.03 ab2.14 ± 0.51 a81.67 ± 13.53 d54.16 ± 7.96 c28.19 ± 1.76 c17.76 ± 1.51 a
OE1102.36 ± 5.52 a20.86 ± 1.48 a5.11 ± 1.07 a132.44 ± 23.98 a72.5 ± 7.07 a42.58 ± 3.17 a17.79 ± 1.85 a
OE2106.19 ± 5.05 a21.22 ± 1.28 a5.54 ± 1.72 a135.5 ± 47.92 a82.11 ± 8.48 a38.78 ± 2.85 a18.66 ± 1.84 a
Note: Analysis of variance (ANOVA) was performed using Duncan’s new multiple range test (MRT), with different lowercase letters indicating significant differences (p < 0.05).
Disclaimer/Publisher’s Note: The statements, opinions and data contained in all publications are solely those of the individual author(s) and contributor(s) and not of MDPI and/or the editor(s). MDPI and/or the editor(s) disclaim responsibility for any injury to people or property resulting from any ideas, methods, instructions or products referred to in the content.