Article

Population Dynamics of Cypripedium macranthos Sw. and Its Interactions with Environmental Factors in the Changbai Mountains

1
College of Horticulture, Jilin Agricultural University, 2888 Xincheng Street, Changchun 130118, China
2
College of Forestry and Grassland, Jilin Agricultural University, 2888 Xincheng Street, Changchun 130118, China
*
Authors to whom correspondence should be addressed.
Agronomy 2025, 15(1), 68; https://doi.org/10.3390/agronomy15010068
Submission received: 18 November 2024 / Revised: 23 December 2024 / Accepted: 27 December 2024 / Published: 30 December 2024

Abstract

:
The growth and development of Cypripedium macranthos Sw. are affected by environmental factors, such as temperature, humidity, soil type, and its crown density. In this study, its morphological attributes, physiological traits, and interactions with environmental factors were analysed. The results indicate that the growth of C. macranthos was limited by elevated crown density, soil alkaline-hydrolysed nitrogen, and available soil potassium concentration. Moreover, the physiological attributes of C. macranthos were variably suppressed by high crown density and elevated soil alkaline-hydrolysed nitrogen concentration, whereas enhanced available soil potassium concentration promoted these physiological characteristics. At lower crown density, C. macranthos had greater photosynthetic capacity and higher δ13C, C, and N, which were more favourable for organic matter accumulation and plant growth and development. Conversely, at higher crown densities, plants relied more heavily on mycorrhizal fungi for nutrient acquisition. In conclusion, crown density, soil alkali-hydrolysed nitrogen, and available soil potassium concentration were the main environmental factors influencing the morphological and functional form of C. macranthos. Optimal growth conditions were identified at a crown density of 0.5–0.7, soil alkali-hydrolysed nitrogen concentration of 155.06–246.98 mg/kg, and available potassium concentration of 432.53–502.87 mg/kg. The results of this study provide a theoretical understanding for developing conservation strategies for C. macranthos to ensure the stability of the wild population and the health of its habitats.

1. Introduction

Cypripedium macranthos Sw. is a perennial herb belonging to the Orchidaceae, which is one of the largest families of angiosperms, with >28,000 species in 763 genera of five subfamilies, accounting for about 8% of the total number of angiosperms species [1]. China is home to 187 genera of Orchidaceae including 1447 species, of which 601 are endemic in China. The genus Cypripedium comprises plants with a distinctive floral morphology and vibrant pigmentation. These characteristics are attributed to the specialisation of the floral labellum, which assumes a cucullate, ladle, or slipper shape [2]. Cypripedium macranthos is characterised by the presence of 3–7 cauline leaves, a labellum that is purple, red or pink in colour, with an occasional white specimen, measuring 3.5 to 6.0 cm in length, a middle sepal that is broadly ovate in shape, lateral petals that are ovate-lanceolate or broadly lanceolate in form, a glabrous fruit. It is typically found in humus-rich, well-drained areas within the understory, forest margins, or grassy slopes at elevations ranging from 400 to 2400 masl. Cypripedium macranthos is widely distributed in the temperate zone, occurring in regions extending from Russia and Mongolia to Japan, Korea, and China [3]. In northeast China, C. macranthos is most widely distributed in the eastern mountainous areas of Jilin Province and the Changbai Mountains. However, because of poor reproduction and population fragmentation caused by anthropogenic digging, mining, and other disturbances [4], the number of wild C. macranthos populations have decreased and their distribution has been sporadic. Cypripedium macranthos has high ornamental value, however, due to the destruction of its natural habitats by overexploitation and anthropogenic damage, many valuable orchid resources, including the genus Cypripedium, are seriously endangered [5,6]. All wild orchids, including C. macranthos, are listed under the Convention on International Trade in Endangered Species of Wild Fauna and Flora (CITES) [7].
Plant functional traits are influenced by a complex interplay between internal genetic factors and external environmental conditions and serve as crucial indicators of plant adaptation to diverse growth habitats [8]. Elevation is an overaching ecological factor influencing many other environmental factors [9]. Changes in climate, soil and other conditions along an elevational gradient affect the functional characteristics and nutrient composition of plants [10]. Slope, slope aspect and slope position are important factors affecting plant growth and ecosystem structure [11]. The topographic conditions of different slopes, slope aspects and slope positions can lead to significant differences in environmental factors such as light, temperature and humidity to which plants are exposed, thus affecting their growth and development [12]. Insufficient or excess water triggers a range of physiological and biochemical stress responses, including altering plant root architecture, regulating plant hormone levels, and affecting plant gene expression [13]. Different plants adapt differently to crown density, and, to varying degrees, make plastic changes in morphology and/or anatomy to adapt to different light regimens [14]. Soil types are another key factor, with soil nutrient conditions significantly affecting plant growth and development, as well as geographic distribution [15,16]. Carbon, nitrogen, and phosphorus play important roles in plant growth, through various metabolic pathways [17]. Therefore, plant growth and development are subject to the combined effects of multiple environmental factors. In recent years, most studies on C. macranthos have focused on seed germination [5,18,19,20], genetic diversity [20,21,22,23], and pollination [24,25,26,27]. However, a few studies have reported on the relationship between the morphological characteristics and physiological properties of C. macranthos and its environment [28].
This study investigated the distribution of population characteristics and community features of C. macranthos resources in the Changbai Mountains, analysed morphological and physiological characteristics, and their relationship with environmental factors, thereby exploring the influence of environmental factors on C. macranthos populations. These findings can provide a scientific basis for the long-term conservation and use of C. macranthos, as well as for its efficient cultivation.

2. Materials and Methods
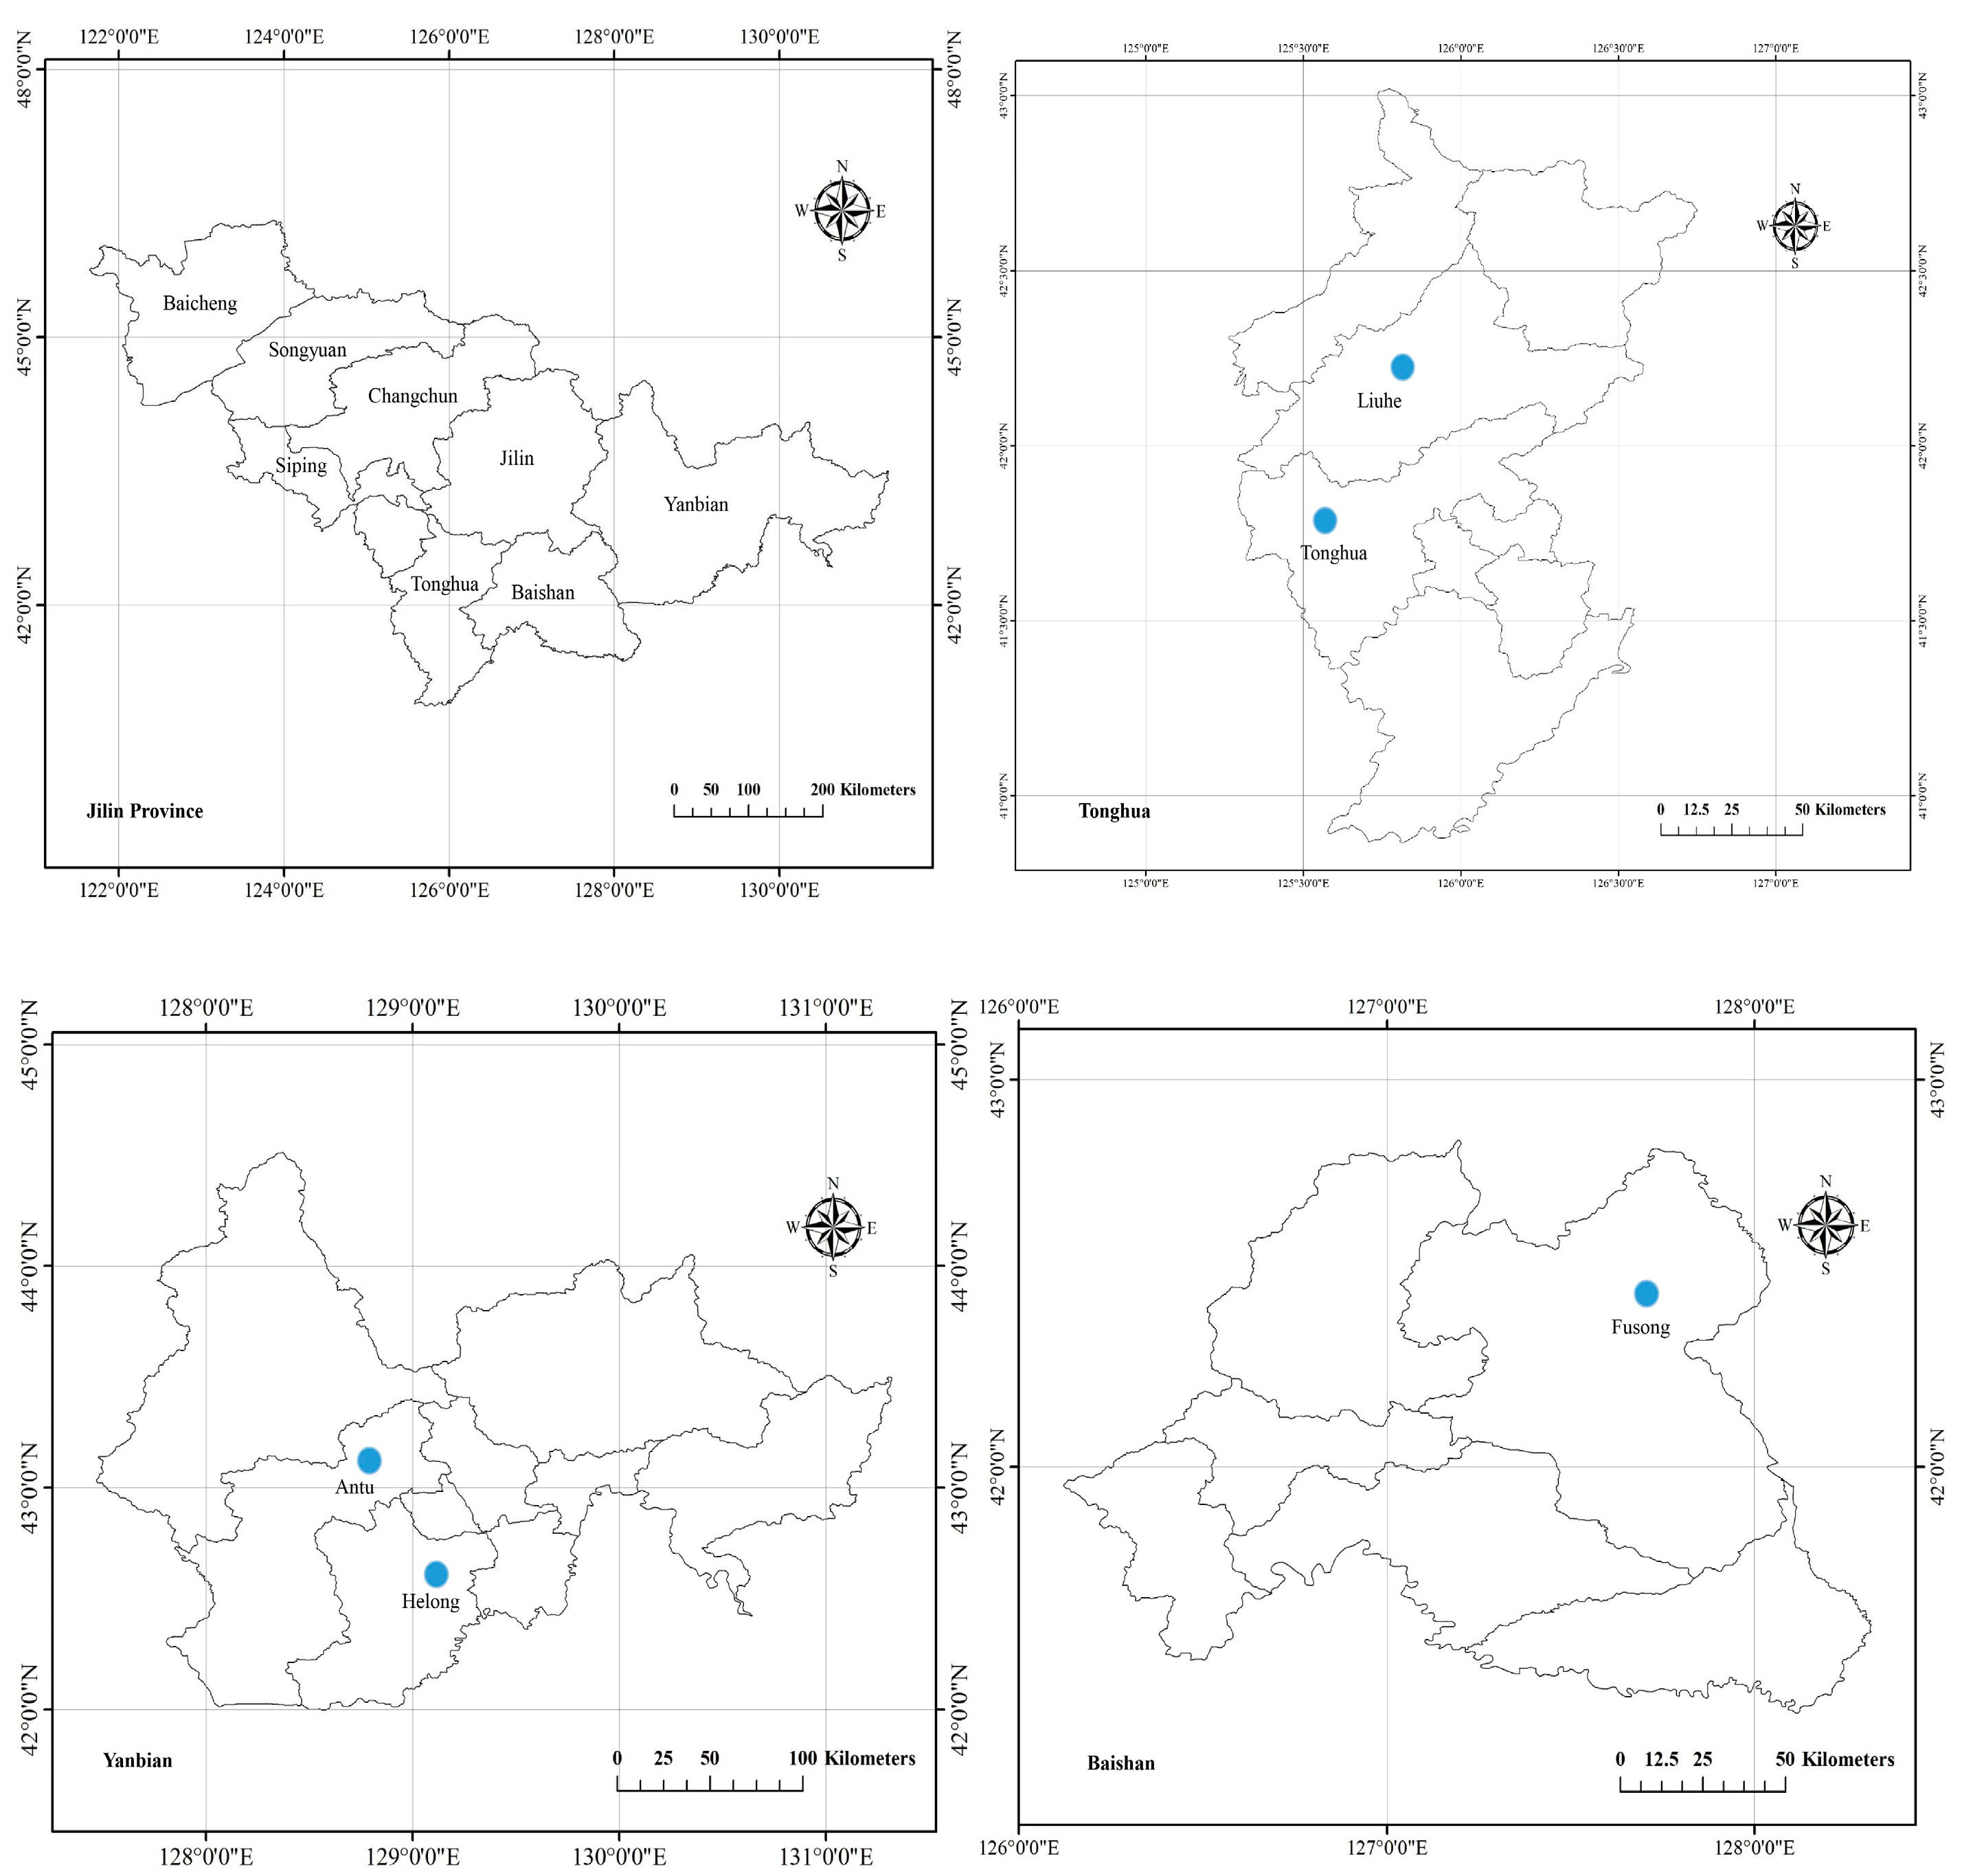
2.1. Study Site

The Changbai Mountains (127°40′ E–128°16′ E, 41°35′ N–42°25′ N) are situated in the southeastern region of Jilin Province, China, spanning the eastern edge of the Asia–Europe continent with a mesothermal continental monsoon climate. Influenced by East Asian monsoons, the area has cold, dry winters and warm, humid summers. Precipitation is concentrated during June to September, with relative humidity levels ranging from 72% to 75%. The average annual temperature is between −7 °C and −4 °C, and the annual precipitation ranges from 700 mm to 1400 mm. Dark brown forest soils dominate the Changbai Mountains and exhibit variation in soil moisture and soil depth [29]. It is classified as a temperate coniferous broadleaf mixed forest belt and represents one of the largest forested areas in China, boasting a rich diversity of plant resources [30].
Field surveys were carried out in five areas belonging within the Yanbian Chaoxianzu Autonomous Prefecture, Tonghua City, and Baishan City in the Changbai Mountains for C. macranthos (Figure 1).
Our study areas were integrated with data on elevation, topography, and other factors, and nine sampling plots were established with the C. macranthos population as the central point of investigation. Each plot was 20 m × 20 m, and GPS was used to record their precise locations (Table 1). Environmental data, including sample plot elevation, slope, slope direction, slope position, crown density, temperature and humidity, were recorded with meticulous detail. Crown density is measured using the canopy projection method [31].
Within each plot, a sample area of 1 m × 1 m was established with C. macranthos clumps as the central point of reference. This area was utilized to determine of soil physicochemical properties, morphological and physiological indices.

2.2. Experimental Materials

Three robust plants were selected from each plot for the measurement of morphological parameters, followed by the determination of photosynthetic and chlorophyll-fluorescence parameters in the second functional leaf from the stem apex. Leaves from the same plants were taken for chlorophyll concentration, antioxidant enzyme activity, osmoregulation substance concentration, and δ13C, δ15N, C and N concentration experiments. Three sets of replicates were used for each experiment.

2.3. Determination of Soil Physicochemical Properties

Three replicates of 0–20 cm soil samples were taken from the center and four corners of each of the nine sample plots by using an earth auger.
A potentiometer was employed for the purpose of measuring pH. Soil organic matter was analyzed by using the potassium dichromate-H2SO4 oxidation method with external heating. Total nitrogen was determined with a Kjeldahl nitrogen analyzer. Total potassium was determined with the NaOH melting-flame photometric method. Total phosphorus was determined by using the HClO4-H2SO4 method. Alkali-hydrolysed nitrogen was quantified using the alkali-diffusion method. The 0.5 mol·L−1 NaHCO3 solution leaching method was utilized for available phosphorus. Available potassium was quanitified by ammonium acetate leaching-flame photometry [32,33].

2.4. Morphological Index Determination

2.4.1. Determination of Plant Growth Index

The plant height, stem thickness (at the middle of the first and second nodes), leaf length and width (on the second functional leaf from top to bottom), and leaf number of C. macranthos were measured using a vernier calliper and a scale [34,35,36]. The formula for leaf area is as follows:
leaf area (cm2) = leaf length × leaf width × π/4

2.4.2. Microstructure of Root

Three robust plants were selected from each plot, and 5–10 disease-free root segments were collected at random. Subsequent to the conventional paraffin sectioning technique, the tissue sections were observed under a fluorescence microscope (DM2500, Leica, Wetzlar, Germany) and photographed and recorded for subsequent analysis. The root diameter, root coat thickness, cortex thickness, and number of mycelial clusters were measured or counted, and the average mycorrhizal infestation rate was calculated.
One hundred fields of view were randomly selected from each resident root system, and the degree of root segment infestation was categorized into four classes, C0, C1, C2 and C3, where C0 indicated no mycelial mass in cortical cells, and C1, C2 and C3 indicated mycelial mass in 1–30%, 31–60% and >60% of cortical cells, respectively. The mycorrhizal infestation rate was calculated as follows:
Average mycorrhizal infestation rate(%) = (15% × NC1 + 45% × NC2 + 80% × NC3)/Total number of fields of view observed
Where NC1, NC2 and NC3 denote the number of fields of view that are at the C1, C2 and C3 levels, respectively.

2.5. Physiological Index Determination

2.5.1. Determination of Chlorophyll Concentration, Antioxidant Enzyme Activities, and Osmoregulation Substance Concentration

The chlorophyll concentration was determined by extraction following the methodology outlined by Zhang et al. [37]. The method described by Wang et al. [38] was employed for the activity of superoxide dismutase (SOD), peroxidase (POD) and catalase (CAT). Soluble sugar and soluble protein concentrations were determined by the anthrone sulfate and Caumas Brilliant Blue-G250 staining methods, respectively [39].

2.5.2. Determination of Photosynthetic Parameters

A portable photosynthetic apparatus (CIRAS-2, PP system, Lincoln, NE, USA) was used to measure photosynthetic parameters, which included the net photosynthetic rate (Pn), transpiration rate (E), stomatal conductance (Gs), and intercellular CO2 concentration (Ci), and the water use efficiency (WUE) [40].

2.5.3. Determination of Chlorophyll-Fluorescence Parameters

Chlorophyll-fluorescence parameters were measured with a chlorophyll fluorescence imaging system (Li-6800, LI-COR, Lincoln, NE, USA). Measurements included initial fluorescence of photosynthesis (F0), maximum fluorescence (Fm), variable fluorescence (Fv), potential photochemical efficiency of PSII (Fv/F0), maximum photochemical efficiency of PSII (Fv/Fm), variable fluorescence (Fm’), actual photochemical efficiency (ΦPSII) and variable fluorescence (Fv’). Additionally, photochemical quenching coefficient (qP) and non-photochemical quenching coefficient (qN) were calculated [40].

2.5.4. Determination of δ13C, δ15N and C and N Concentrations of Leaves

Leaf δ13C, δ15N, and C and N concentrations were determined with a Flash 2000 EA-HT elemental analyzer (Thermo Fisher Scientific, Inc., Waltham, MA, USA) and DELTA V Advantage stable isotope ratio mass spectrometer (Thermo Fisher Scientific, Inc.) [41].

2.6. Statistical Analyses

Data were collated using Excel; one-way analysis of variance (ANOVA) was performed using SPSS 29.0 software (Version: 29.0, Chicago, IL, USA). The one-way analysis of variance (ANOVA), Pearson correlation analysis and partial correlation analysis were performed on the data of plant habitat characteristics, morphological indices and physiological indices of C. macranthos. All measured data were expressed as means ± standard deviation. The statistical significance of differences was assessed using one-way ANOVA followed by Least Significant Difference (LSD) post-hoc test. Before that, the normality distribution was checked using Kolmogorov-Smirnov test and and Levene’ s test was used to verify the homogeneity of variances. Differences were considered significant at p < 0.05 and highly significant at p < 0.01; and R language was used for redundancy analysis (RDA) and Pearson’s correlation analysis.

3. Results

3.1. Habitat Characteristics

Environmental characteristics of the nine screened C. macranthos populations are illustrated in Figure 2. P2 and P3 are situated in the understory of high crown density in Fusong County, Baishan City, which is located at the highest elevation. The crown density exceeded 90% in all the P1–P4 sites, indicative of low understory light. In contrast, P9 displayed the lowest crown density and the highest understory transmittance relative to the other populations. Temperatures at P2 and P3 were higher than those at the other seven populations. Humidity levels exhibited minimal variation across the diverse C. macranthos populations.
These nine populations of C. macranthos were predominantly distributed in humus-rich, fertile, and loose dark brown loam or brown loam soils with pH 4.25–5.99, which were slightly acidic (Table 2). The soil organic matter concentration of other native population of C. macranthos was lower than the mean values observed in P1 and P3. The total nitrogen concentration was significantly higher in P3 than in the other populations. In contrast, total phosphorus and potassium concentrations were the highest in P4 and P7, respectively. The mean values of alkali-hydrolysed nitrogen, and available soil phosphorus and potassium concentration exceeded the concentration of these elements at P3. P3 contained the highest levels of active soil components and nutrients.

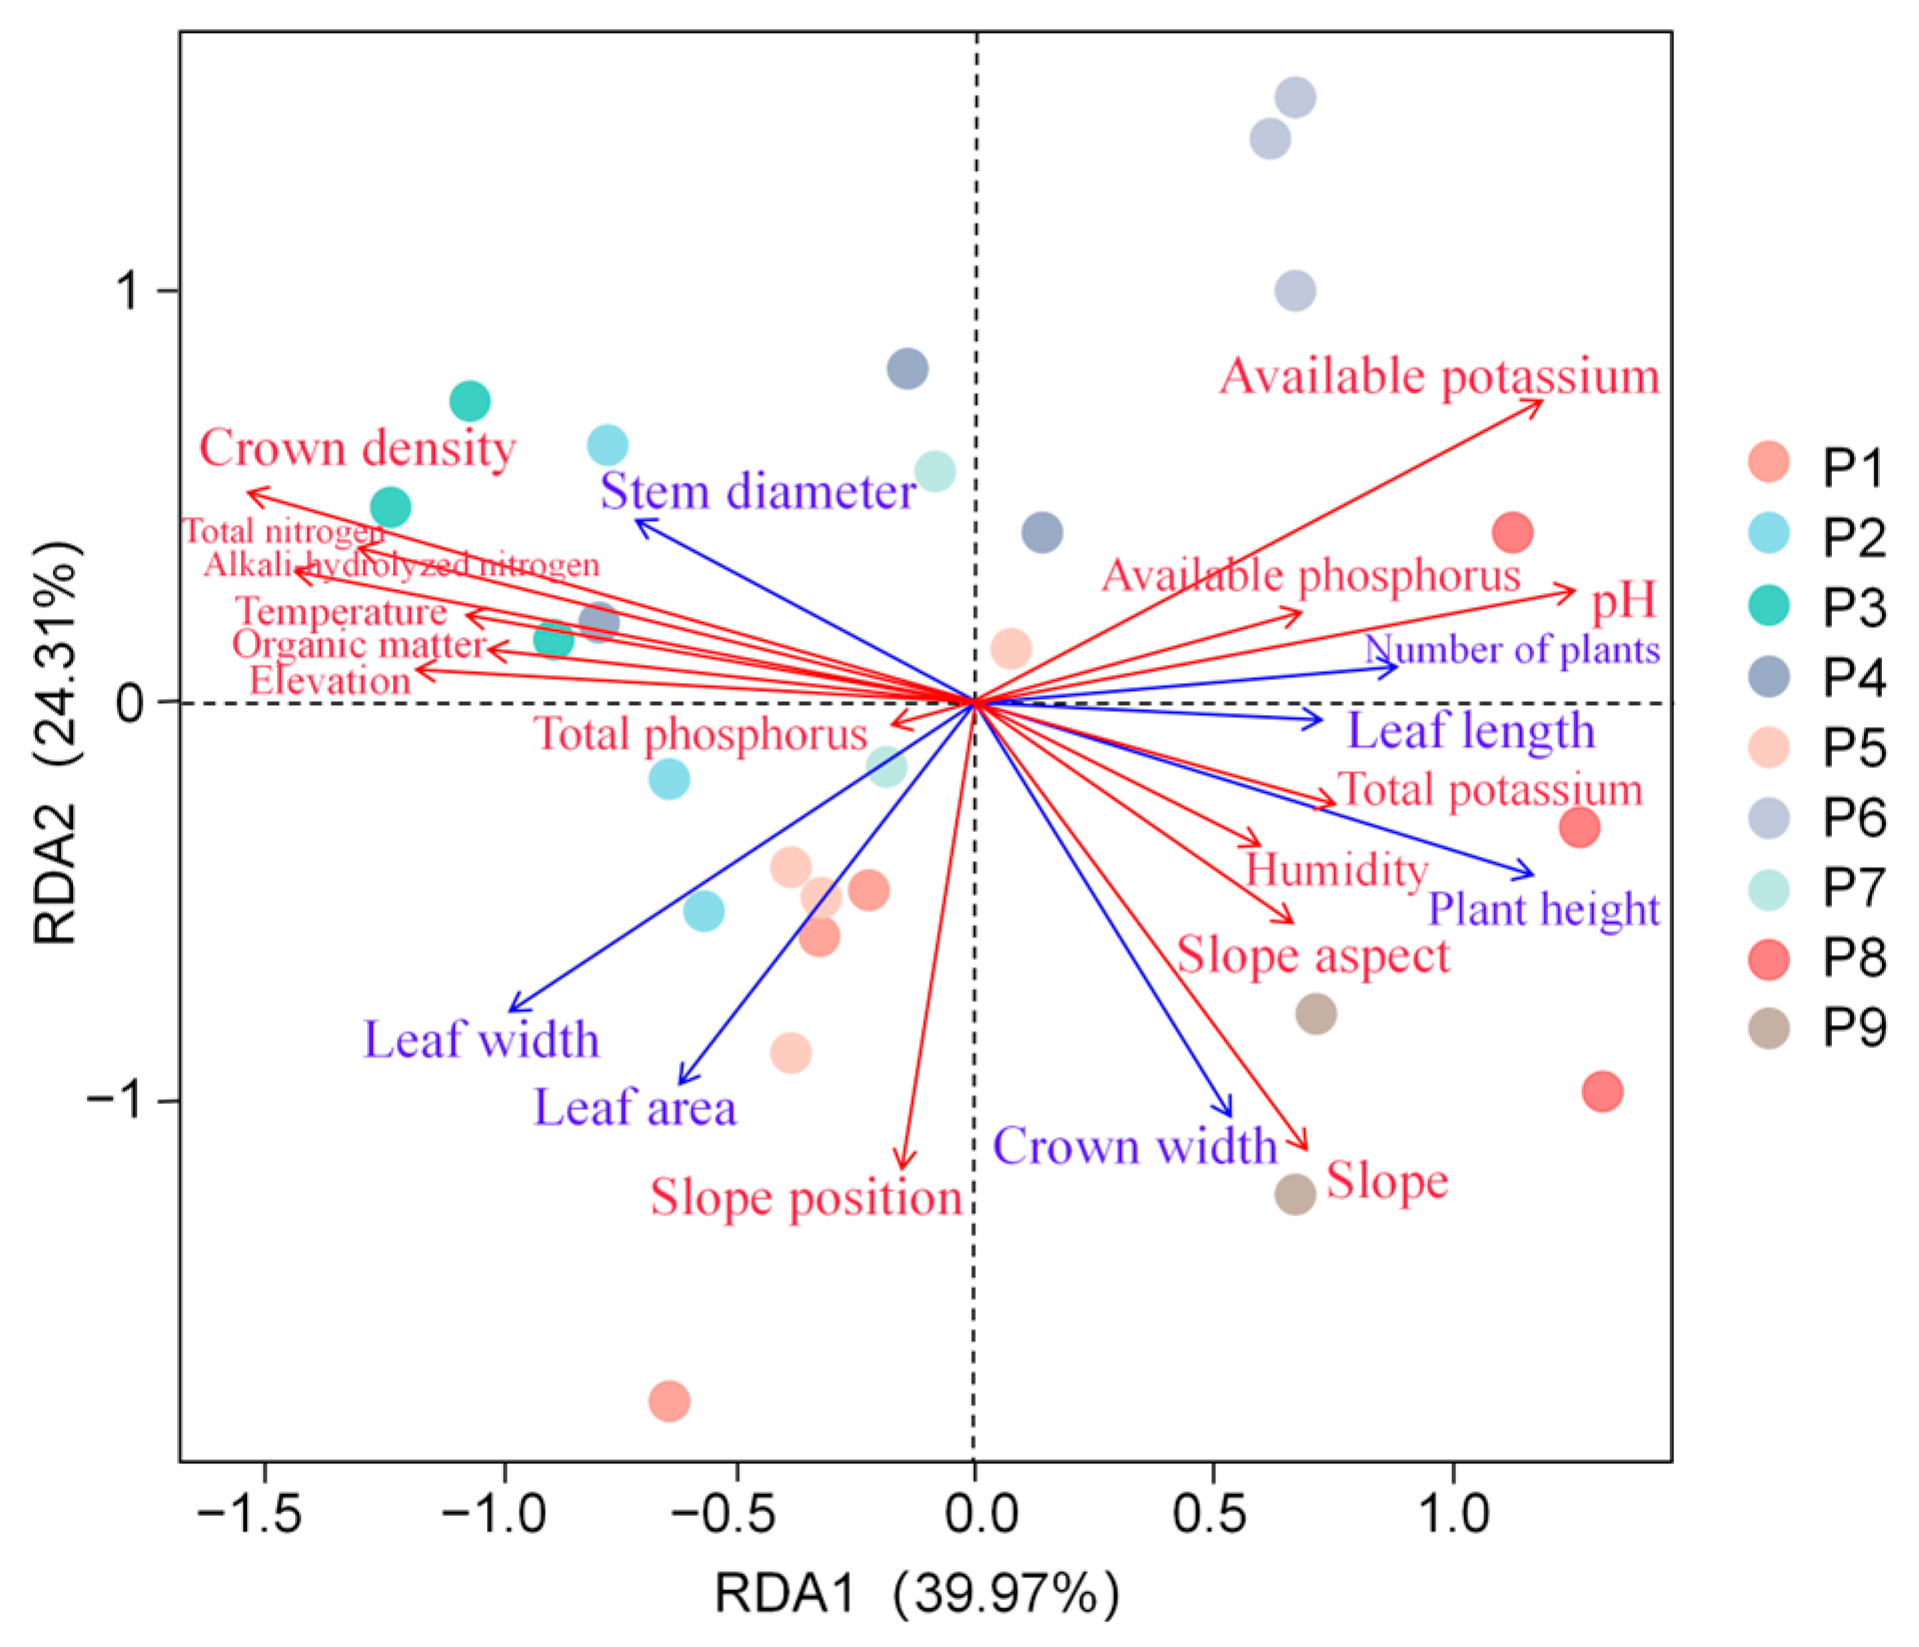
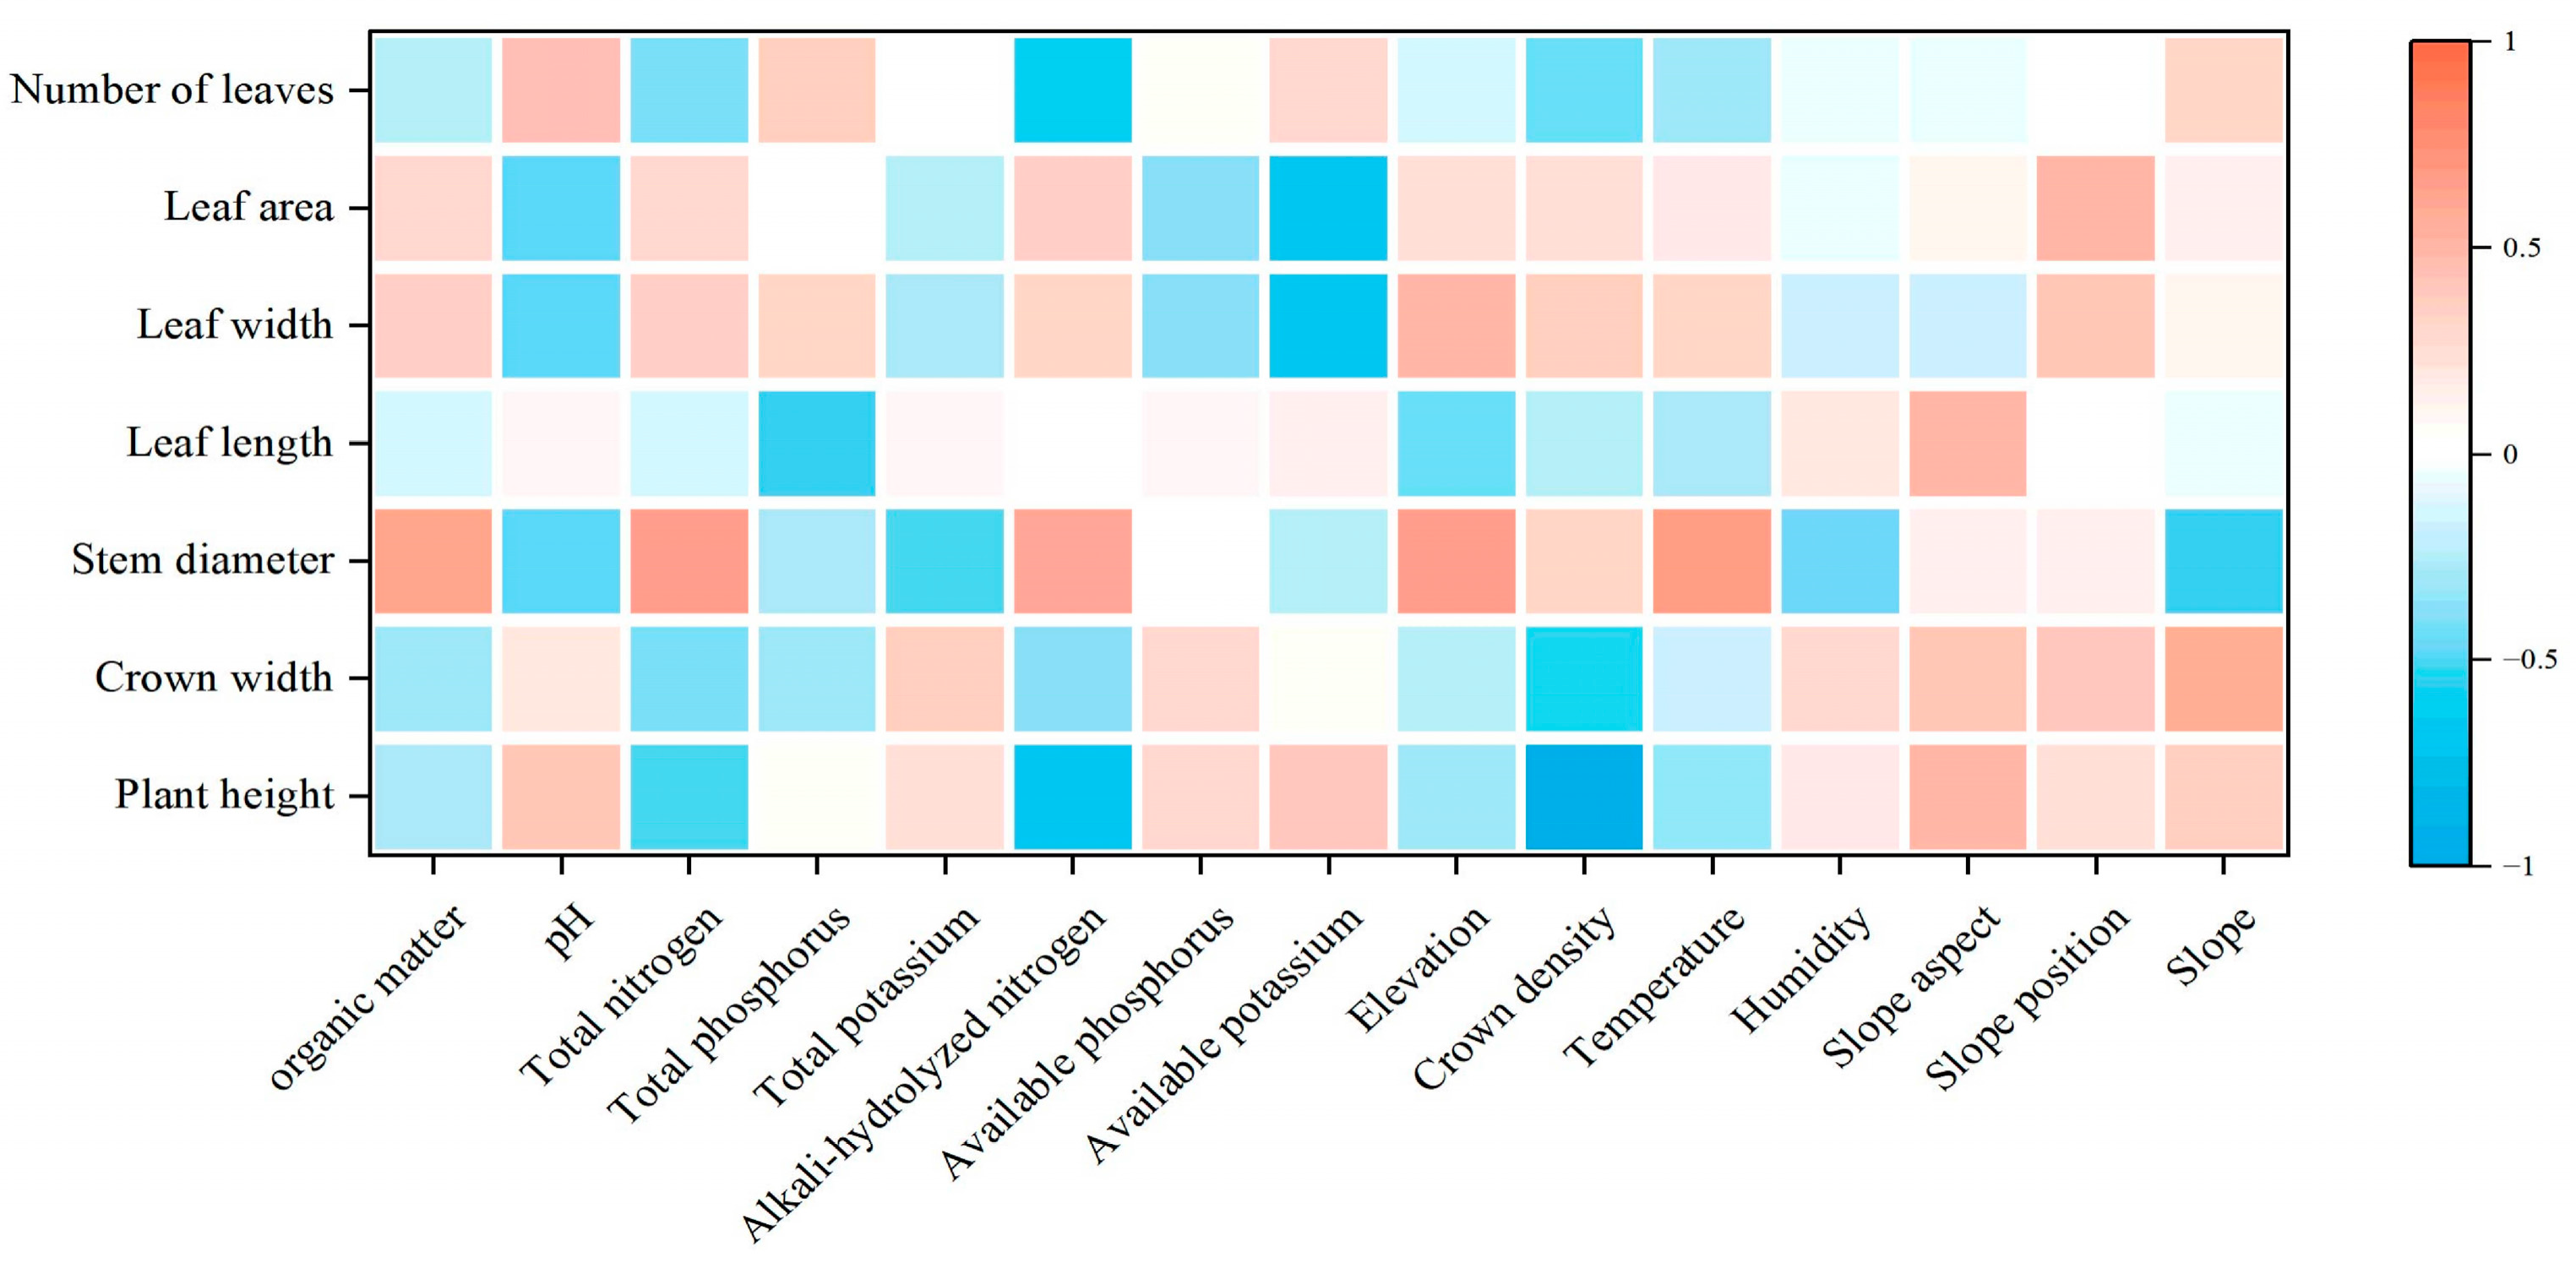
3.2. Morphological Characters of C. macranthos and Their Correlation with Environmental Factors

3.2.1. Plant Growth Metrics of C. macranthos and Their Correlation with Environmental Factors

Analysis of morphological data from the nine populations revealed significant differences in the morphological characteristics among the populations (Table 3). Plant heights of P8 and P9 were significantly taller than those of the other populations. In contrast, the shortest plants were recorded in P3. The widest crowns were observed at P9, whereas the narrowest were observed at P4. Stems were thickest in P3 and thinnest in P1. Cypripedium macranthos from P6 had the longest leaves, followed by P1. In contrast, C. macranthos from P1 displayed the widest leaves and largest leaf area. Additionally, the number of leaves in C. macranthos varied between five and six in different populations.
The RDA ranking of the morphological characteristics and environmental factors of C. macranthos (Figure 3) revealed that the first two RDA axes explained 39.97% and 24.31% of total variation, respectively. Axis RDA1 predominantly reflected alterations in slope position and slope, whereas axis RDA2 primarily depicted changes in crown density, available potassium, pH, and alkali-hydrolysed nitrogen concentrations.
Figure 4 displays relationships (in the form of a heat map) between morphological characteristics of C. macranthos and and environmental factors.
The degree of explanatory and level of significance attributed to each environmental factor in the RDA in relation to morphological characteristics were evaluated with multiple Monte Carlo permutations. Table 4 illustrates the order of importance of the environmental factors affecting the morphological characteristics of C. macranthos. The factors were ranked in the following order: crown density > alkali-hydrolyzed nitrogen > available potassium > total nitrogen > pH > slope > elevation > slope position > temperature. Furthermore, a significant (p < 0.05) correlation was identified between all the environmental factors. Five variables: total phosphorus, humidity, available phosphorus, total potassium, and slope aspect did not meet the 5% significance (p < 0.05) level in the statistical analysis. The results demonstrated that Monte Carlo permutation test yielded a p-value of 0.001, with the initial two sorting axes reaching a highly significant level (p < 0.005). This indicated that the sorting effect was optimal and that these results could be accepted as an adequate explanation of the morphological responses to environmental factors.

3.2.2. Root Microstructure and Fungal Infestation

Examination C. macranthos roots from disparate populations focused on three sections from the outermost to the innermost: the root peridium, cortex, and mesostyle (Figure 5).
Root diameter, root cover thickness, and cortical thickness of C. macranthos all tended to increase with decreasing crown density, but there were no significant differences (Table 5). The number of mycelial pellets and the fungal infestation rate of C. macranthos exhibited some degree of variation among populations. The number of mycelial pellets and infestation rate was significantly higher in P1, P2, and P3 than in the other populations. The highest mycorrhizal fungal infestation rate was observed in P2; whereas, the lowest was recorded in P8, where the number of mycelial pellets was significantly lower than that in any other population, and only a few hyphae were present.

3.3. Physiological Characteristics of C. macranthos and Their Correlation with Environmental Factors

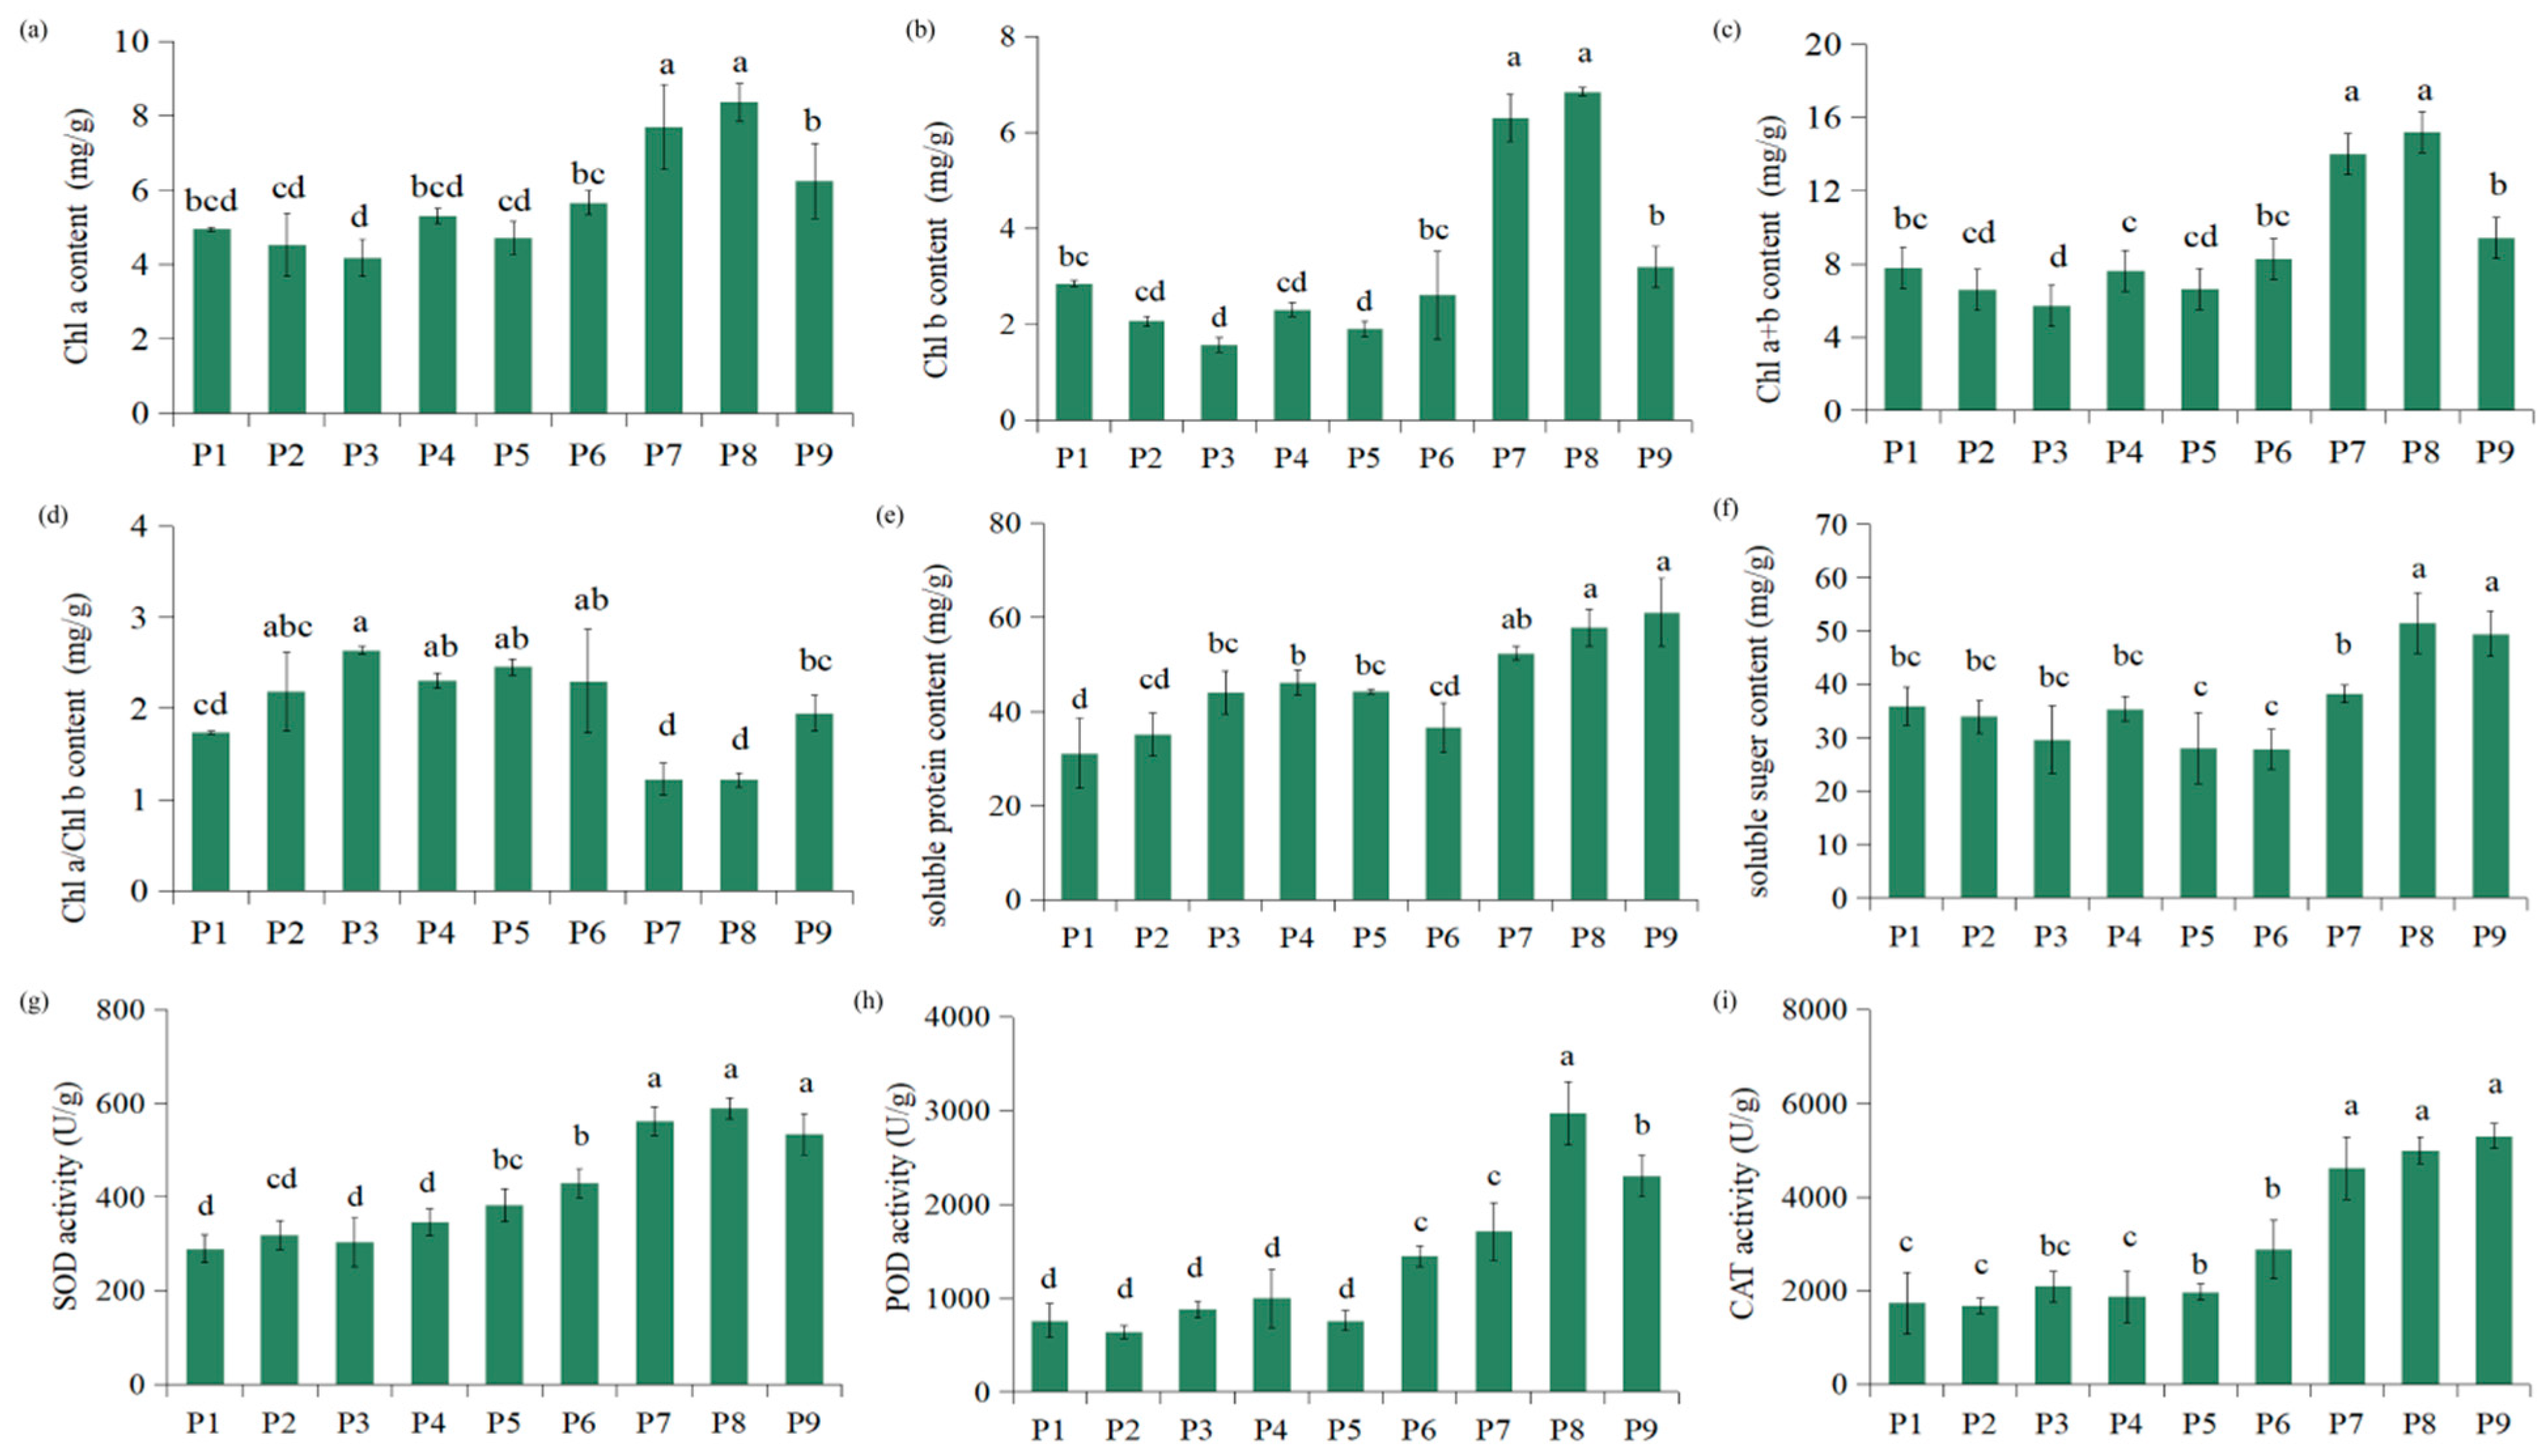
3.3.1. Effects of Different Environments on the Chlorophyll Concentration, Antioxidant Enzyme Activities, and Osmoregulation Substance Concentration of C. macranthos

As illustrated in Figure 6, the physiological characteristics of C. macranthos exhibited variability across different populations. The chlorophyll concentration, antioxidant enzyme activities, and osmoregulation substance concentration of C. macranthos varied across populations. Chlorophyll concentration was significantly higher in P7 and P8, with the lowest value observed in P3. The chlorophyll a/b ratio was also significantly lower in the P7 and P8 populations than in the other populations, with the highest ratio observed in P3. P9 exhibited the highest soluble protein concentration, and P1 exhibited the lowest. The soluble sugar concentration of P8 and P9 was significantly higher than that of the other seven populations. In contrast, the lowest soluble sugar concentration was observed in P6. SOD and CAT activities were significantly higher in P7, P8, and P9; whereas, the lowest values were observed in P1 and P2. POD activity was markedly elevated in P8 above that in the other populations, with P9 and P7 exhibiting intermediate levels of enzyme activity. Conversely, P2 exhibited the lowest POD activity.
The physiological characteristics of C. macranthos and the environmental factors were ranked by RDA (Figure 7), with the first two axes accounting for 83.14% and 6.1% of the total variation, respectively. The interpretation of the lines with arrows in Figure 7 conforms with the note given after the caption for Figure 3. Axis RDA1 predominantly reflected variation in slope; whereas, axis RDA2 primarily reflects variation in crown density, available potassium, and alkali-hydrolysed nitrogen concentrations. Figure 8 displays relationship (in the form of a heat map) between the physiological characteristics of C. macranthos and environmental factors.
The degree of explanatory effect and level of significance attributed to each environmental factor in the RDA for physiological characteristics were evaluated with multiple Monte Carlo permutations. Table 6 demonstrates the influence of environmental factors on the physiological characteristics of C. macranthos. The factors were ranked in the following order of importance: crown density, alkali-hydrolyzed nitrogen, available potassium, slope, pH, elevation, total nitrogen, total potassium, available phosphorus. Moreover, a statistically significant correlation was identified between all environmental factors (p < 0.05). This analysis revealed that slope aspect, slope position, temperature, organic matter, total phosphorus, and humidity were not statistically significant at the 0.05 level. The results demonstrated that the Monte Carlo permutation test yielded a p-value of 0.001, whereas the initial two sorting axes reached a highly significant level (p < 0.005), indicating that sorting was optimal and that these results have strong explanatory power for understanding the influence of environmental factors on the physiology of C. macranthos.

3.3.2. Effects of Different Environments on the Photosynthetic Properties of C. macranthos

Table 7 revealed significant discrepancies in the gas exchange parameters of C. macranthos leaves. The data indicated a gradual increase in Pn, E, Gs, and WUE with decreasing crown density, with population P8 significantly higher for these parameters than observed in populations P4 and P6. In contrast, Ci demonstrated a gradual, statistically significant decline with decreasing crown density, suggesting that Ci is significantly influenced by crown density.
Chlorophyll fluorescence parameters of C. macranthos leaves are presented in Table 8. The Fv/Fm and Fv/Fo values of C. macranthos did not differ significantly under different crown densities, with the maximum values occurring at a crown density of 61%. The highest ΦPSII, qN, and ETR values were observed in C. macranthos at a crown density of 61%. In addition, qP tended to increase and subsequently decrease with less crown density. The lowest values of Fv/Fm, Fv/Fo, ΦPSII, qN, and ETR were observed in C. macranthos at a high crown density of 90%.

3.3.3. Effects of Different Environments on δ13C, δ15N, C and N Concentrations of C. macranthos

Table 9 presents δ13C, δ15N, and C and N concentrations of C. macranthos at different crown densities. Notably, δ13C of the leaves of C. macranthos under the three different crown density was the lowest in P6, exhibiting a significant decline compared to P4 and P8. No notable differences were evident between the δ13C values of P4 and P8. δ15N was positive in P6 and negative in the remainder, with the highest value observed in P6, followed by P4 and the lowest in P8. No significant difference in δ15N values was evident among the three populations. The C contencentration in the leaves was the highest in P8, exhibiting a significant difference (4.96%) from the lowest concentration observed in P6. The N concentration was the lowest in P4, exhibiting a statistically significant difference compared with P6 and P8. However, no statistically significant difference was observed between the N level in P6 and P8.

3.3.4. Correlation Analysis of Photosynthetic Indices with δ13C, δ15N and C and N Concentrations

Table 10 presents correlation coefficients between photosynthetic indices and a range of other variables, including δ13C, δ15N and C and N concentrations. N concentration exhibited a significant positive correlation with Pn, E and Fv/Fm and an extremely significant positive correlation with ΦPSII. δ13C was significantly negatively correlated with δ15N, and significantly positively correlated with C.

4. Discussion

4.1. Distribution Population Characteristics of C. macranthos in Changbai Mountains

The growth of C. macranthos is significantly influenced by environmental factors. The crown density of C. macranthos ranges from 50% to 91%, indicating that C. macranthos is not typically found at low crown densities (<50%). Orchids species richness and density highest at mid-elevations and decreases with increasing elevation. They are abundant and clustered at middle and higher elevations [42], prefer shady and humid habitats, with higher levels of crown density [43], which can slow plant water loss.
In the present study, the number of plants in C. macranthos increased and then decreased with increasing elevation. The majority of the population is concentrated on the western and southwestern slopes, which receive minimal light. Notably, the high crown density of the forest understory enables plants to grow on semi-sunny slopes, thereby compensating for their light requirements. In a forest environment with a certain degree of crown density, the understory temperature is low and evaporation of water is slow, which allows for an adequate supply of water necessary for orchid growth. The results indicated that C. macranthos was capable of growing in acidic dark brown loam or brown loam soils with high organic matter concentration, which is consistent with the results reported by Hussain et al. [44].

4.2. Morphological Characteristics of Different Populations of C. macranthos and Their Relationship with Environmental Factors

4.2.1. Relationship Between Plant Growth and Environmental Factors in C. macranthos

Plants undergo alterations in their internal microstructure, external morphological features, and functional plant traits to adapt to their surroundings. The leaf is a crucial site for plant photosynthesis, and plant leaf traits can reflect the ecological adaptive strategies that plants have developed [45]. Plant growth is not only genetically regulated internally but is also affected by external environmental factors [46,47]. Furthermore, plant growth is affected not only by a single factor but by combinations of multiple environmental factors [48]. Perez and Kliwer [49] concluded that shade treatments resulted in increased plant height, stem thickness and leaf area in Vitis. This may be because shading ensures that light is sufficient and not too intense, and from lower ambient temperatures and higher relative air humidity and CO2 concentrations, which may lead to faster plant growth.
In the present study, the results of RDA combined with Pearson’s correlation analysis revealed that the main environmental factors affecting growth included crown density, alkali-hydrolysed nitrogen, and available potassium. Varying degrees of negative correlations were observed between crown density, alkali-hydrolysed nitrogen, and available potassium and the morphological characteristics of C. macranthos, suggesting that environments with higher levels of crown density, soil alkali-hydrolysed nitrogen, and available potassium may limit plant growth and distribution.

4.2.2. Relationships Between Root Microstructure and Fungal Infestation in C. macranthos and Environmental Factors

Roots play a primary role in nutrient uptake [50]. It has been reported that soil factors exert various regulatory effects, including those related to leaf traits [51]. The presence of endophytic mycorrhizal fungi in orchids is associated with both the host plant and the growth environment [52,53]. And endophytic mycorrhizal fungi play an important role in the growth of orchids. Mature strains of Rhizoctonia spp. fungi have a better germination-promoting effect on the germination of seeds of Cypripedium [54]. Mycelial morphology of C. macranthos exhibited variation under different crown densities. The number of mycelial pellets and infection rate decreased with decreasing crown density. This may be attributed to the fact that the photosynthetic capacity of the plant is weaker under low-light conditions, necessitating reliance on mycorrhizal fungi for nutrient provision.

4.3. Physiological Characteristics of Different Populations of C. macranthos and Their Relationship with Environmental Factors

4.3.1. Relationships Between Chlorophyll Concentration, Antioxidant Enzyme Activities, and Osmoregulation Substance Concentration in C. macranthos and Environmental Factors

The antioxidant enzyme system, osmoregulatory functions, and nutrients vary in plant species when subjected to different environmental conditions. The measurement of chlorophyll concentration in plant leaves is a crucial aspect of plant health assessment [55]. Plants often increase capture of light energy in low light conditions by increasing their chlorophyll concentration [56], as documented in maize (Zea mays) leaves under low and strong light conditions [57]. The concentration and chlorophyll a/b in leaves can effectively reflect the growth status, physiological characteristics, and capacity of the plant to utilise light energy. Light conditions affect the physiological characteristics of Cypripedium plants [34]. Soluble sugars and soluble proteins play crucial roles in osmoregulation within plant cells, and their mass fractions are positively correlated with plant resistance to salt and cold stresses [58,59,60]. The scavenging of reactive oxygen species is facilitated by defence enzymes, such as SOD, POD, and CAT [61]. SOD facilitates the disproportionate reaction of superoxide ions to produce H2O2, which is scavenged by POD and CAT [62]. The combined action of these three enzymes prevents the oxidation of membrane lipids and reduces the degree of damage to plants [63]. In rice (Oryza sativa), SOD activity was positively correlated with the degree of that seedlings could adapt to adverse conditions [64].
In the present study, RDA ranking of physiological indicators and environmental factors of C. macranthos combined with Pearson’s correlation analysis, revealed that the main environmental factors affecting its growth included crown density, alkali-hydrolysed nitrogen, and available potassium. Chlorophyll, soluble protein, soluble sugar, SOD, POD, and CAT were all significantly negatively correlated with alkali-hydrolysed nitrogen and crown density. This suggests that C. macranthos may exhibit reduced physiological activity when grown in an environment with a high crown density and high soil alkali-hydrolysed nitrogen levels. Therefore, crown density that is either too high or too low affects the growth and development of C. macranthos, which is consistent with the findings of Zhang et al. [28]. In contrast, available potassium in the soil was positively correlated with the physiological characteristics of C. macranthos to different degrees, indicating that it had a promoting effect.

4.3.2. Relationships Between Photosynthetic Properties of C. macranthos and Environmental Factors

Plant photosynthesis is a physiological process that is affected by changing environmental conditions. Plants adapt to their environment in a direction that favours photosynthesis, but excessive or insufficient light can affect normal photosynthesis [65]. Pn reflects the photosynthetic capacity and ecological environmental response of plants under adverse conditions. Gs reflects the degree of stomatal opening, is most affected by water, increases with light intensity, is positively correlated with net photosynthetic rate, is a significant indicator of plant survival strategies [28], and is a crucial parameter of both carbon and water cycles [66]. This reflects the efficiency of CO2 utilisation by plants consuming the same amount of water in different crown densities. Plants growing under low light intensities usually have lower photosynthetic efficiency and biomass [67,68,69]. In this study, the Pn, E, and WUE of C. macranthos at a high crown density of 90% were lowest; however, Ci increased and Gs decreased, indicating that photoinhibition at a high crown density caused a decrease in photosynthetic capacity, potentially damaging the photosynthetic structure of the leaves, resulting in an imbalance in leaf transpiration rate and water utilisation, which ultimately led to a decrease in the Pn value. Pn, E, Gs, and WUE of C. macranthos were highest at 61% crown density, with the highest photosynthetic capacity and most efficient use of water.
Chlorophyll fluorescence is a key indicator of photosynthesis and stress in plants [70]. Fv/Fm is commonly used as a measure of the potential activity of PSII, the light reaction center of plant leaves. High levels of PSII indicate strong electron transfer capacity in photosynthetic organs, allowing more absorbed light energy to be used for photochemical reactions, thus increasing the photosynthetic capacity of chloroplasts [71]. The true state of the plant’s capture and use of primary light energy can be reflected by ΦPSII, indicating the ratio of photosynthetic electron transfer energy to absorbed light energy, when some PSII reaction centers are closed [72]. Rascher et al. [73] found that low light led to higher chlorophyll levels, increased Fv/Fm, and earlier onset of non-photochemical burst (NPQ), which increased light-trapping capacity. Similar results were obtained for seedlings of cabbage (Brassica campestris) [74] and pepper (Capsicum annuum) [75]. Sun et al. [76] reported that cucumber (Cucumis sativus) leaf Fv/Fm also increased significantly with light intensity decay, as evidenced by a decrease in the degree of photoinhibition and an increase in PSII openness and electron transfer efficiency. Previous studies indicate that the Fv/Fm ratio in Cypripedium guttatum decreases under high light intensity [77], and that PSII activity in Cypripedium species is negatively impacted by both excessively strong and weak light conditions [78]. In our study, C. macranthos exhibited the lowest Fv/Fm values at a high crown density. Cypripedium macranthos had significantly higher ΦPSII values than the other populations at 61% crown density, and the leaves at this density had excellent electron transfer capacity with a high ratio of photosynthetic electron transfer energy to absorbed light energy, consistent with the findings of Zhang et al. [28].

4.3.3. Relationships Between δ13C, δ15N and C and N Concentrations of C. macranthos Leaves and Environmental Factors

δ13C and δ15N have been used in several studies to explore plant responses to changes in climate and environmental gradients [79,80]. δ13C is an important indicator of long-term water use efficiency in plants; δ15N is associated with the terrestrial nitrogen cycle [81]. Typically, δ13C values of C3 plants fall within the range of −35‰ to −20‰ [82]. δ13C values of C. macranthos observed in the present study align with this range. In this study, the highest δ13C value was observed at 61% crown density, indicating that under favourable light conditions, the duration of photosynthesis was relatively longer and the rate of photosynthetic CO2 assimilation increased, resulting in relatively lower concentrations of intercellular CO2 and a higher δ13C values. The positive correlation observed between leaf δ13C values and leaf C and N concentrations indicates that leaf δ13C values can be used to predict levels of organic matter and nutrients in the plant’s leaves. δ15N values of C. macranthos leaves exhibited a range from −1.13‰ to 0.09‰, suggesting that the species may possess adaptations that enhance its resilience to cold and wet environments, consistent with the observations of Swarts and Dixon [43], who noted that the majority of C. macranthos plants prefer shady, wet sites. Plant C and N concentration are of significant ecological importance and serve as robust indicators of species composition, distribution, and adaptation to environmental conditions [83]. Changes in the light environment can affect plant morphogenesis, photosynthetic physiology, storage, and accumulation of nutrients [84,85,86].Previous studies have shown that shading stress can reduce the yield of various crops, including soybean [87], spring maize [88] and wheat [89]. In the present study, the C and N concentrations were highest at 61% crown density, which may be due to the fact that photosynthesis is impeded by low light, resulting in the synthesis of fewer organic substances. The N concentration was highly significantly positively correlated with ΦPSII and significantly positively correlated with Pn, E and Fv/Fm. This indicates that leaf N concentration of C. macranthos was affected by light, with N increasing under conditions of strong photosynthetic capacity [90].

5. Conclusions

Environmental factors play important roles in the morphological and functional traits of C. macranthos. In this study, crown density, soil alkali-hydrolysed nitrogen, and available potassium were important factors affecting the morphological characteristics and chlorophyll concentration, antioxidant enzyme activities, and osmoregulation substance concentration of C. macranthos. Growing in an environment with high crown density and high soil alkali-hydrolysed nitrogen concentration inhibited morphological characteristics and chlorophyll concentration, antioxidant enzyme activities, and osmoregulation substance concentration to varying degrees, whereas soil available potassium concentration, while promoting these physiological indices of C. macranthos, may also limit plant growth and development. At lower crown density, plants were more photosynthetically active, with higher δ13C values, C and N concentrations, which was more favourable for the accumulation of organic matter and plant growth and development; whereas at higher crown density, plants were more dependent on nutrients supplied by mycorrhizal fungi. Crown density plays an influential role in all morphological and physiological indices and is the most important environmental factor for C. macranthos. Therefore, growth in C. macranthos is optimized with a crown density of 0.5–0.7, soil alkali-hydrolysed nitrogen concentration of 155.06–246.98 mg/kg, and available potassium concentration of 432.53–502.87 mg/kg. Any in situ and/or relocation conservation of C. macranthos should be conducted with the above factors in mind. In the future, it will be necessary to continue to collect data on environmental factors influencing C. macranthos populations and conduct research on the growth, development, and physiological characteristics of C. macranthos under a variety of growing conditions to provide a scientific basis for the conservation, development, and utilisation of C. macranthos, as well as for other Orchidaceae taxa.

Author Contributions

L.C. and W.L. conducted the experiments and wrote the first draft of the paper. N.J. and Y.X. validated and organized the data. Y.S., S.W. (Shizhuo Wang) and S.W. (Sulei Wu) conceptualized the experimental plan. Q.W., J.Y. and Y.Z. analyzed the data. L.C., X.L. and H.Q. edited and reviewed the manuscript, provided laboratory, instrumentation and equipment and technical support, designed the experimental protocols, and contacted and involved all authors in major decisions regarding publication together. All authors have read and agreed to the published version of this manuscript.

Funding

This work was supported by National Natural Science Foundation of China (32171866); Natural Science Foundation Project of Jilin Provincial Science and Technology Department (2024010119JC).

Data Availability Statement

The original contributions presented in the study are included in the article, further inquiries can be directed to the corresponding authors.

Conflicts of Interest

The authors declare that the research was conducted in the absence of any commercial or financial relationships that could be construed as a potential conflict of interest.

References

  1. Christenhusz, M.J.; Byng, J.W. The number of known plants species in the world and its annual increase. Phytotaxa 2016, 261, 201–217. [Google Scholar] [CrossRef]
  2. Moreno-Camarena, M.; Ortega-Larrocea, M.P. Mesoamerican Cypripedium: Mycorrhizal contributions to promote their conservation as critically endangered species. Plants 2022, 11, 1554. [Google Scholar] [CrossRef]
  3. Chang, J.T.; Zhang, Y.; Andronova, E.; Averyanov, L.V.; Filippov, E.G.; Kawahara, T.; Shefferson, R.; Kim, J.H.; Hsu, R.C.C.; Cho, Y.H.; et al. Middle pleistocene climate change influenced northward divergence and cold adaptation in an Asian lady’s slipper orchid, Cypripedium macranthos Sw.(Orchidaceae). Bot. J. Linn. Soc. 2024, 205, 150–160. [Google Scholar] [CrossRef]
  4. Liu, H.; Jacquemyn, H.; He, X.; Chen, W.; Huang, Y.; Yu, S.; Lu, Y.; Zhang, Y. The impact of human pressure and climate change on the habitat availability and protection of Cypripedium (Orchidaceae) in Northeast China. Plants 2021, 10, 84. [Google Scholar] [CrossRef] [PubMed]
  5. Zhang, Y.; Lee, Y.I.; Deng, L.; Zhao, S. Asymbiotic germination of immature seeds and the seedling development of Cypripedium macranthos Sw., an endangered lady’s slipper orchid. Sci. Hortic. 2013, 164, 130–136. [Google Scholar] [CrossRef]
  6. Fay, M.F. Orchid conservation: Further links. Ann. Bot. 2016, 118, 89–91. [Google Scholar] [CrossRef] [PubMed]
  7. Zhou, Z.; Shi, R.; Zhang, Y.; Xing, X.; Jin, X. Orchid conservation in China from 2000 to 2020: Achievements and perspectives. Plant Divers. 2021, 43, 343–349. [Google Scholar] [CrossRef] [PubMed]
  8. Moreno-Sotomayor, A.; Weiss, A.; Paparozzi, E.T.; Arkebauer, T.J. Stability of leaf anatomy and light response curves of field grown maize as a function of age and nitrogen status. J. Plant Physiol. 2002, 159, 819–826. [Google Scholar] [CrossRef]
  9. Sim-Sim, M.; Lopes, T.; Ruas, S.; Stech, M. Does altitude shape molecular diversity and richness of bryophytes in Madeira’s natural forest? A case study with four bryophyte species at two altitudinal levels. Plant Ecol. Evol. 2015, 148, 171–180. [Google Scholar] [CrossRef]
  10. Sundqvist, M.K.; Sanders, N.J.; Wardle, D.A. Community and ecosystem responses to elevational gradients: Processes, mechanisms, and insights for global change. Annu. Rev. Ecol. Evol. Syst. 2013, 44, 261–280. [Google Scholar] [CrossRef]
  11. Yang, J.; El-Kassaby, Y.A.; Guan, W. The effect of slope aspect on vegetation attributes in a mountainous dry valley, Southwest China. Sci. Rep. 2020, 10, 16465. [Google Scholar] [CrossRef]
  12. Auslander, M.; Nevo, E.; Inbar, M. The effects of slope orientation on plant growth, developmental instability and susceptibility to herbivores. J. Arid Environ. 2003, 55, 405–416. [Google Scholar] [CrossRef]
  13. Khan, R.; Ma, X.; Hussain, Q.; Chen, K.; Farooq, S.; Asim, M.; Ren, X.; Shah, S.; Shi, Y. Transcriptome and anatomical studies reveal alterations in leaf thickness under long-term drought stress in tobacco. J. Plant Physiol. 2023, 281, 153920. [Google Scholar] [CrossRef]
  14. Terashima, I.; Hanba, Y.T.; Tholen, D.; Niinemets, Ü. Leaf functional anatomy in relation to photosynthesis. Plant Physiol. 2011, 155, 108–116. [Google Scholar] [CrossRef] [PubMed]
  15. Dai, X.; Fu, X.; Kou, L.; Wang, H.; Shock, C.C. C: N: P stoichiometry of rhizosphere soils differed significantly among overstory trees and understory shrubs in plantations in subtropical China. Can. J. For. Res. 2018, 48, 1398–1405. [Google Scholar] [CrossRef]
  16. in’t Zandt, D.; van den Brink, A.; de Kroon, H.; Visser, E.J. Plant-soil feedback is shut down when nutrients come to town. Plant Soil. 2019, 439, 541–551. [Google Scholar] [CrossRef]
  17. Reich, P.B.; Tjoelker, M.G.; Machado, J.L.; Oleksyn, J. Universal scaling of respiratory metabolism, size and nitrogen in plants. Nature 2006, 439, 457–461. [Google Scholar] [CrossRef] [PubMed]
  18. Shimura, H.; Koda, Y. Micropropagation of Cypripedium macranthos var. rebunense through protocorm-like bodies derived from mature seeds. Plant Cell, Tissue Organ Cult. 2004, 78, 273–276. [Google Scholar] [CrossRef]
  19. Shimura, H.; Koda, Y. Enhanced symbiotic seed germination of Cypripedium macranthos var. rebunense following inoculation after cold treatment. Physiol. Plant. 2005, 123, 281–287. [Google Scholar] [CrossRef]
  20. Taniguchi, H.; Katsumi, M.; Yamamoto, Y.; Tatsumi, Y.; Sano, C.M.; Choi, Y.E.; Sano, H. In vitro proliferation and genetic diversity of Cypripedium macranthos var. rebunense. Plant Biotechnol. 2008, 25, 341–346. [Google Scholar] [CrossRef]
  21. Chung, J.M.; Park, K.W.; Park, C.S.; Lee, S.H.; Chung, M.G.; Chung, M.Y. Contrasting levels of genetic diversity between the historically rare orchid Cypripedium japonicum and the historically common orchid Cypripedium macranthos in South Korea. Bot. J. Linn. Soc. 2009, 160, 119–129. [Google Scholar] [CrossRef]
  22. Izawa, T.; Kawahara, T.; Takahashi, H. Genetic diversity of an endangered plant, Cypripedium macranthos var. rebunense (Orchidaceae): Background genetic research for future conservation. Conserv. Genet. 2007, 8, 1369–1376. [Google Scholar] [CrossRef]
  23. Wu, Q.; Dong, S.; Zhao, Y.; Yang, L.; Qi, X.; Ren, Z.; Dong, S.; Cheng, J. Genetic diversity, population genetic structure and gene flow in the rare and endangered wild plant Cypripedium macranthos revealed by genotyping-by-sequencing. BMC Plant Biol. 2023, 23, 254. [Google Scholar] [CrossRef] [PubMed]
  24. Bernhardt, P.; Edens-Meier, R. What we think we know vs. what we need to know about orchid pollination and conservation: Cypripedium L. as a model lineage. Bot. Rev. 2010, 76, 204–219. [Google Scholar] [CrossRef]
  25. Li, P.; Luo, Y.B.; Bernhardt, P.; Yang, X.Q.; Kou, Y. Deceptive pollination of the Lady’s Slipper Cypripedium tibeticum (Orchidaceae). Plant Syst. Evol. 2006, 262, 53–63. [Google Scholar] [CrossRef]
  26. Sugiura, N.; Fujie, T.; Inoue, K.; Kitamura, K. Flowering phenology, pollination, and fruit set of Cypripedium macranthos var. rebunense, a threatened lady’s slipper (Orchidaceae). J. Plant Res. 2001, 114, 171–178. [Google Scholar] [CrossRef]
  27. Sugiura, N. Consistent pollination services to Cypripedium macranthos var. rebunense (Orchidaceae) by Bombus pseudobaicalensis. Plant Species Biol. 2019, 34, 38–42. [Google Scholar] [CrossRef]
  28. Zhang, Y.; Liu, W.; Lu, X.; Li, S.; Li, Y.; Shan, Y.; Wang, S.; Zhou, Y.; Chen, L. Effects of different light conditions on morphological, anatomical, photosynthetic and biochemical parameters of Cypripedium macranthos Sw. Photosynth. Res. 2024, 160, 97–109. [Google Scholar] [CrossRef] [PubMed]
  29. Qi, L.; Zhao, F.; Sun, J. An integrated multi-scale approach to restoring a degraded secondary forest ecosystem: A case study in the Changbai Mountains, northeastern China. Ecol. Eng. 2018, 125, 98–105. [Google Scholar] [CrossRef]
  30. Dai, L.; Qi, L.; Wang, Q.; Su, D.; Yu, D.; Wang, Y.; Ye, Y.; Jiang, S.; Zhao, W. Changes in forest structure and composition on Changbai Mountain in Northeast China. Ann. For. Sci. 2011, 68, 889–897. [Google Scholar] [CrossRef]
  31. Fiala, A.C.; Garman, S.L.; Gray, A.N. Comparison of five canopy cover estimation techniques in the western Oregon Cascades. For. Ecol. Manage. 2006, 232, 188–197. [Google Scholar] [CrossRef]
  32. Zhang, Z.; Ai, N.; Liu, G.; Liu, C.; Qiang, F. Soil quality evaluation of various microtopography types at different restoration modes in the loess area of Northern Shaanxi. Catena 2021, 207, 105633. [Google Scholar] [CrossRef]
  33. Bao, S.D. Soil Agrochemical Analysis; China Agriculture Press: Beijing, China, 2000. [Google Scholar]
  34. Chen, L.; Li, S.; Li, Y.; Zhang, Y.; Bai, Y.; Cong, H.; Liu, W.; Zhou, Y. Comparative study of Cypripedium plant photosynthetic characteristics from Changbai Mountain. Horticulturae 2023, 9, 358. [Google Scholar] [CrossRef]
  35. Schrader, J.; Shi, P.; Royer, D.L.; Peppe, D.J.; Gallagher, R.V.; Li, Y.; Wang, R.; Wright, I.J. Leaf size estimation based on leaf length, width and shape. Ann. Bot. 2021, 128, 395–406. [Google Scholar] [CrossRef]
  36. Shi, P.; Liu, M.; Yu, X.; Gielis, J.; Ratkowsky, D.A. Proportional relationship between leaf area and the product of leaf length and width of four types of special leaf shapes. Forests 2019, 10, 178. [Google Scholar] [CrossRef]
  37. Zhang, Y.; Chen, C.; Jin, Z.; Yang, Z.; Li, Y. Leaf anatomy, photosynthesis, and chloroplast ultrastructure of Heptacodium miconioides seedlings reveal adaptation to light environment. Environ. Exp. Bot. 2022, 195, 104780. [Google Scholar] [CrossRef]
  38. Wang, L.; Jia, X.; Zhao, Y.; Zhang, C.; Zhao, J. Effect of arbuscular mycorrhizal fungi in roots on antioxidant enzyme activity in leaves of Robinia pseudoacacia L. seedlings under elevated CO2 and Cd exposure. Environ. Pollut. 2022, 294, 118652. [Google Scholar] [CrossRef] [PubMed]
  39. Wang, T.; Li, L.; Qin, Y.; Lu, B.; Xu, D.; Zhuang, W.; Shu, X.; Zhang, F.; Wang, N.; Wang, Z. Effects of seasonal changes on chlorophyll fluorescence and physiological characteristics in the two Taxus species. Plants 2023, 12, 2636. [Google Scholar] [CrossRef] [PubMed]
  40. Chen, L.; Yu, J.; Lu, X.; Wang, Q.; Wang, S.; Shan, Y.; Liu, Y.; Meng, Y.; Zhou, Y. Iris typhifolia responses to saline–alkali stress: Germination, antioxidant activity, hormones, and photosynthetic performance. Horticulturae 2024, 10, 588. [Google Scholar] [CrossRef]
  41. Song, W.; Zhou, Y. Linking leaf δ15N and δ13C with soil fungal biodiversity, ectomycorrhizal and plant pathogenic abundance in forest ecosystems of China. Catena 2021, 200, 105176. [Google Scholar] [CrossRef]
  42. Djordjević, V.; Tsiftsis, S.; Kindlmann, P.; Stevanović, V. Orchid diversity along an altitudinal gradient in the central Balkans. Front. Ecol. Evol. 2022, 10, 929266. [Google Scholar] [CrossRef]
  43. Swarts, N.D.; Dixon, K.W. Terrestrial orchid conservation in the age of extinction. Ann. Bot. 2009, 104, 543–556. [Google Scholar] [CrossRef] [PubMed]
  44. Hussain, K.; Dar, M.E.U.I.; Khan, A.M.; Iqbal, T.; Mehmood, A.; Habib, T.; Moussa, I.M.; Casini, F.; Elansary, H.O. Temperature, topography, woody vegetation cover and anthropogenic disturbance shape the orchids distribution in the western Himalaya. S. Afr. J. Bot. 2024, 166, 344–359. [Google Scholar] [CrossRef]
  45. Wang, H.; Wang, R.; Harrison, S.P.; Prentice, I.C. Leaf morphological traits as adaptations to multiple climate gradients. J. Ecol. 2022, 110, 1344–1355. [Google Scholar] [CrossRef]
  46. Brelsford, C.C.; Nybakken, L.; Kotilainen, T.K.; Robson, T.M. The influence of spectral composition on spring and autumn phenology in trees. Tree Physiol. 2019, 39, 925–950. [Google Scholar] [CrossRef] [PubMed]
  47. Tan, X.; Gao, L.; Wang, W.; Zhang, W.; Wei, J.; Wang, J.; Li, L.; Zhou, Q.; Liang, H.; Liu, Y. Modelling alteration of leaf coloration peak date in cotinus coggygria in a high-elevation karst region. Agric. For. Meteorol. 2022, 323, 109044. [Google Scholar] [CrossRef]
  48. Chapin, F.S.; Bloom, A.J.; Field, C.B.; Waring, R.H. Plant responses to multiple environmental factors. BioScience 1987, 37, 49–57. [Google Scholar] [CrossRef]
  49. Perez, J.; Kliewer, W.M. Effect of shading on bud necrosis and bud fruitfulness of Thompson Seedless grapevines. Am. J. Enol. Vitic. 1990, 41, 168–175. [Google Scholar] [CrossRef]
  50. Mahanta, D.; Rai, R.K.; Dhar, S.; Varghese, E.; Raja, A.; Purakayastha, T.J. Modification of root properties with phosphate solubilizing bacteria and arbuscular mycorrhiza to reduce rock phosphate application in soybean-wheat cropping system. Ecol. Eng. 2018, 111, 31–43. [Google Scholar] [CrossRef]
  51. Jin, Y.; Liao, M.; Hou, Y.; Wang, H.; Xia, H.; Xia, J.; Wu, K.; Zhou, B.; Li, K.; Ni, J. Spatial patterns and variations in leaf traits of alpine plants on the interior Tibetan Plateau. Glob. Ecol. Conserv. 2024, 53, e03037. [Google Scholar] [CrossRef]
  52. McCormick, M.K.; Whigham, D.F.; Canchani-Viruet, A. Mycorrhizal fungi affect orchid distribution and population dynamics. New Phytol. 2018, 219, 1207–1215. [Google Scholar] [CrossRef]
  53. Mujica, M.I.; Saez, N.; Cisternas, M.; Manzano, M.; Armesto, J.J.; Pérez, F. Relationship between soil nutrients and mycorrhizal associations of two Bipinnula species (Orchidaceae) from central Chile. Ann. Bot. 2016, 118, 149–158. [Google Scholar] [CrossRef] [PubMed]
  54. Shimura, H.; Matsuura, M.; Takada, N.; Koda, Y. An antifungal compound involved in symbiotic germination of Cypripedium macranthos var. rebunense (Orchidaceae). Phytochemistry 2007, 68, 1442–1447. [Google Scholar] [CrossRef]
  55. Varela-Stasinopoulou, D.S.; Nektarios, P.A.; Tsanakas, G.F.; Ntoulas, N.; Roukounakis, G.I.; Economou, A.S. Impact of substrate depth and irrigation regime on growth, flowering and physiological indices of Greek sage (Salvia fruticosa Mill.) grown on urban extensive green roof systems. Ecol. Eng. 2023, 186, 106816. [Google Scholar] [CrossRef]
  56. Lichtenthaler, H.K.; Babani, F.; Langsdorf, G. Chlorophyll fluorescence imaging of photosynthetic activity in sun and shade leaves of trees. Photosynth Res. 2007, 93, 235–244. [Google Scholar] [CrossRef] [PubMed]
  57. Ren, B.Z.; Cui, H.Y.; Camberato, J.J.; Dong, S.T.; Liu, P.; Zhao, B.; Zhang, J.W. Effects of shading on the photosynthetic characteristics and mesophyll cell ultrastructure of summer maize. Sci. Nat. 2016, 103, 67. [Google Scholar] [CrossRef] [PubMed]
  58. Li, X.; Liu, D.; Wang, J.; Jian, S. Morphological, biochemical and physiological responses of a tropical coastal plant Guettarda speciosa to salt stress. Glob. Ecol. Conserv. 2021, 32, e01887. [Google Scholar] [CrossRef]
  59. Pociecha, E.; Dziurka, M. Trichoderma interferes with cold acclimation by lowering soluble sugars accumulation resulting in reduced pink snow mould (Microdochium nivale) resistance of winter rye. Environ. Exp. Bot. 2015, 109, 193–200. [Google Scholar] [CrossRef]
  60. Yadav, S.K. Cold stress tolerance mechanisms in plants. A review. Agron. Sustainable Dev. 2010, 30, 515–527. [Google Scholar] [CrossRef]
  61. Sadeghpour, N.; Asadi-Gharneh, H.A.; Nasr-Esfahani, M.; Khankahdani, H.H.; Golabadi, M. Antioxidant enzymes associated with resistance to Fusarium oxysporum f. sp. melonis race 1.2 in melon. Physiol. Mol. Plant Pathol. 2022, 121, 101880. [Google Scholar] [CrossRef]
  62. You, J.; Chan, Z. ROS regulation during abiotic stress responses in crop plants. Front. Plant Sci. 2015, 6, 165102. [Google Scholar] [CrossRef]
  63. Huang, W.; Reddy, G.V.; Shi, P.; Huang, J.; Hu, H.; Hu, T. Allelopathic effects of Cinnamomum septentrionale leaf litter on Eucalyptus grandis saplings. Glob. Ecol. Conserv. 2020, 21, e00872. [Google Scholar] [CrossRef]
  64. Pyngrope, S.; Bhoomika, K.; Dubey, R. Reactive oxygen species, ascorbate–glutathione pool, and enzymes of their metabolism in drought-sensitive and tolerant indica rice (Oryza sativa L.) seedlings subjected to progressing levels of water deficit. Protoplasma 2013, 250, 585–600. [Google Scholar] [CrossRef]
  65. Meravi, N.; Kumar Prajapati, S. Effect street light pollution on the photosynthetic efficiency of different plants. Biol. Rhythm Res. 2020, 51, 67–75. [Google Scholar] [CrossRef]
  66. Lu, C.; Cao, J.; Guo, S.; Yao, C.; Wang, Z.; Tong, X.; Wu, F. Water use efficiency and its influencing factors following plantations restoration with Caragana korshinskii and Robinia pseudoacacia in the loess hilly region. Ecol. Eng. 2024, 202, 107229. [Google Scholar] [CrossRef]
  67. da Silva Branco, M.C.; de Almeida, A.A.F.; Dalmolin, Â.C.; Ahnert, D.; Baligar, V.C. Influence of low light intensity and soil flooding on cacao physiology. Sci. Hortic. 2017, 217, 243–257. [Google Scholar] [CrossRef]
  68. Fu, W.; Li, P.; Wu, Y. Effects of different light intensities on chlorophyll fluorescence characteristics and yield in lettuce. Sci. Hortic. 2012, 135, 45–51. [Google Scholar] [CrossRef]
  69. Pires, M.V.; Almeida, A.A.F.; Figueiredo, A.L.; Gomes, F.P.; Souza, M.M. Photosynthetic characteristics of ornamental passion flowers grown under different light intensities. Photosynthetica 2011, 49, 593–602. [Google Scholar] [CrossRef]
  70. Zou, T.; Zhang, J. A new fluorescence quantum yield efficiency retrieval method to simulate chlorophyll fluorescence under natural conditions. Remote Sens. 2020, 12, 4053. [Google Scholar] [CrossRef]
  71. Liu, Y.C.; Tseng, K.M.; Chen, C.C.; Tsai, Y.T.; Liu, C.H.; Chen, W.H.; Wang, H.L. Warm-night temperature delays spike emergence and alters carbon pool metabolism in the stem and leaves of Phalaenopsis aphroide. Sci. Hortic. 2013, 161, 198–203. [Google Scholar] [CrossRef]
  72. Baker, N.R. Chlorophyll fluorescence: A probe of photosynthesis in vivo. Annu. Rev. Plant Biol. 2008, 59, 89–113. [Google Scholar] [CrossRef] [PubMed]
  73. Rascher, U.; Liebig, M.; Lüttge, U. Evaluation of instant light-response curves of chlorophyll fluorescence parameters obtained with a portable chlorophyll fluorometer on site in the field. Plant Cell Environ. 2010, 23, 1397–1405. [Google Scholar] [CrossRef]
  74. Hu, L.L.; Liao, W.B.; Dawuda, M.M.; Yu, J.H.; Lv, J. Appropriate NH4+: NO3 ratio improves low light tolerance of mini Chinese cabbage seedlings. BMC Plant Biol. 2017, 17, 22. [Google Scholar] [CrossRef] [PubMed]
  75. Sui, X.L.; Mao, S.L.; Wang, L.H.; Zhang, B.X.; Zhang, Z.X. Effect of low light on the characteristics of photosynthesis and chlorophyll a fluorescence during leaf development of sweet pepper. J. Integr. Agric. 2012, 11, 1633–1643. [Google Scholar] [CrossRef]
  76. Sun, J.L.; Sui, X.L.; Huang, H.Y.; Wang, S.X.; Wei, Y.X.; Zhang, Z.X. Low light stress down-regulated Rubisco gene expression and photosynthetic capacity during cucumber (Cucumis sativus L.) leaf development. J. Integr. Agric. 2014, 13, 997–1007. [Google Scholar] [CrossRef]
  77. Smallwood, P.A.; Trapnell, D.W. Species distribution modeling reveals recent shifts in suitable habitat for six North American Cypripedium spp.(Orchidaceae). Diversity 2022, 14, 694. [Google Scholar] [CrossRef]
  78. Yang, Z.H.; Huang, W.; Yang, Q.Y.; Chang, W.; Zhang, S.B. Anatomical and diffusional determinants inside leaves explain the difference in photosynthetic capacity between Cypripedium and Paphiopedilum, Orchidaceae. Photosynth. Res. 2018, 136, 315–328. [Google Scholar] [CrossRef]
  79. Adams, M.A.; Grierson, P.F. Stable isotopes at natural abundance in terrestrial plant ecology and ecophysiology: An update. Plant Biol. 2001, 3, 299–310. [Google Scholar] [CrossRef]
  80. Dawson, T.E.; Mambelli, S.; Plamboeck, A.H.; Templer, P.H.; Tu, K.P. Stable isotopes in plant ecology. Annu. Rev. Ecol. Syst. 2002, 33, 507–559. [Google Scholar] [CrossRef]
  81. Chen, L.; Flynn, D.F.; Zhang, X.; Gao, X.; Lin, L.; Luo, J.; Zhao, C. Divergent patterns of foliar δ13C and δ15N in Quercus aquifolioides with an altitudinal transect on the Tibetan Plateau: An integrated study based on multiple key leaf functional traits. J. Plant Ecol. 2015, 8, 303–312. [Google Scholar] [CrossRef]
  82. Dearnaley, J.D.W.; Bougoure, J.J. Isotopic and molecular evidence for saprotrophic Marasmiaceae mycobionts in rhizomes of Gastrodia sesamoides. Fungal Ecol. 2010, 3, 288–294. [Google Scholar] [CrossRef]
  83. Sun, L.; Liu, W.; Liu, G.; Chen, T.; Zhang, W.; Wu, X.; Zhang, G.; Zhang, Y.; Li, L.; Zhang, B.; et al. Temporal and spatial variations in the stable carbon isotope composition and carbon and nitrogen concentrations in current-season twigs of Tamarix chinensis Lour. and their relationships to environmental factors in the Laizhou Bay wetland in China. Ecol. Eng. 2016, 90, 417–426. [Google Scholar] [CrossRef]
  84. Fan, Y.; Chen, J.; Cheng, Y.; Raza, M.A.; Wu, X.; Wang, Z.; Liu, Q.; Wang, R.; Wang, X.; Yong, T.; et al. Effect of shading and light recovery on the growth, leaf structure, and photosynthetic performance of soybean in a maize-soybean relay-strip intercropping system. PloS ONE 2018, 13, e0198159. [Google Scholar] [CrossRef]
  85. Chen, H.; Li, Q.P.; Zeng, Y.L.; Deng, F.; Ren, W.J. Effect of different shading materials on grain yield and quality of rice. Sci. Rep. 2019, 9, 9992. [Google Scholar] [CrossRef] [PubMed]
  86. Wang, Y.B.; Huang, R.D.; Zhou, Y.F. Effects of shading stress during the reproductive stages on photosynthetic physiology and yield characteristics of peanut (Arachis hypogaea Linn.). J. Integr. Agric. 2021; 20, 1250–1265. [Google Scholar] [CrossRef]
  87. Wang, X.; Wu, X.; Ding, G.; Yang, F.; Yong, T.; Wang, X.; Yang, W. Analysis of grain yield differences among soybean cultivars under maize–Soybean intercropping. Agronomy 2020, 10, 110. [Google Scholar] [CrossRef]
  88. Wang, J.; Shi, K.; Lu, W.; Lu, D. Post-silking shading stress affects leaf nitrogen metabolism of spring maize in southern China. Plants 2020, 9, 210. [Google Scholar] [CrossRef]
  89. Wang, Y.; Zhang, Z.; Liang, Y.; Han, Y.; Han, Y.; Tan, J. High potassium application rate increased grain yield of shading-stressed winter wheat by improving photosynthesis and photosynthate translocation. Front. Plant Sci. 2020, 11, 134. [Google Scholar] [CrossRef] [PubMed]
  90. Zhang, S.B.; Hu, H.; Xu, K.; Li, Z.R. Gas exchanges of three co-occurring species of Cypripedium in a scrubland in the Hengduan Mountains. Photosynthetica 2006, 44, 241–247. [Google Scholar] [CrossRef]
Figure 1. Study areas for C. macranthos in the Changbai Mountains.
Agronomy 15 00068 g001
Figure 2. The environmental characteristics of C. macranthos populations. Note: (a): Elevation; (b): Crown density; (c): Temperature; (d): Humidity. The lowercase letters indicate a significant difference at the 0.05 level (p < 0.05).
Agronomy 15 00068 g002
Figure 3. RDA of morphological characteristics of C. macranthos and environmental factors. Note: The blue arrows in the map indicate the explanatory variables, the red arrows indicate the distribution of environmental variables, the length of the line segment with the arrows indicates the relationship between the environmental factors, the longer the arrows indicate the greater the degree of interpretation of diversity, the angle of the arrows indicates the correlation between the variables, the acute angle indicates a positive correlation, the right angle is not related, and the obtuse angle is negatively correlated.
Agronomy 15 00068 g003
Figure 4. Heat map of correlation analysis between morphological characteristics and environmental factors for C. macranthos.
Agronomy 15 00068 g004
Figure 5. Root cross section structure of different populations of C. macranthos. Note: (ai) represent the root transverse section of P1–P9, respectively. VE: Velamen; EX: Exodermis; CO: Cortex; EN: Endodermis; ST: Stele; PH: Phloem; XY: Xylem; H: Hyoha: P: Peloton; AC: Acicular crystal; ST: Starch grain.
Agronomy 15 00068 g005
Figure 6. Physiological indices of C. macranthos leaves in different populations. Note: (a): Chlorophyll a; (b): Chlorophyll b; (c): Total chlorophyll; (d): Chlorophyll a/b; (e): Soluble protein; (f): Soluble suger; (g): Superoxide dismutase (SOD); (h): Peroxidase (POD); (i): Catalase (CAT). The lowercase letters indicate a significant difference at the 0.05 level (p < 0.05).
Agronomy 15 00068 g006
Figure 7. RDA of physiological characteristics of C. macranthos and environmental factors. Note: Interpretation arrow configuration follows that detailed in the note following the caption for Figure 3.
Agronomy 15 00068 g007
Figure 8. Heat map of correlation analysis between physiological characteristics of C. macranthos and environmental factors. Note: * represents significant difference (p < 0.05); ** represents extremely significant difference (p < 0.01).
Agronomy 15 00068 g008
Table 1. Basic information of C. macranthos population plots.
No.PlotDistribution
Place
Number
of Plants
(Piece)
Elevation
(m)
Crown
Density
(%)
Temperature
(°C)
Humidity
(%)
Slope
(°)
Slope
Aspect
Slope
Position
LongitudeLatitude
P1Tonghua County, Tonghua City75869117.56535westtopE125°50′N41°36′
P2Fusong County, Baishan City814219127.560.815westtopE127°55′N41°57′
P3Fusong County, Baishan City714189026.256.515westtopE127°55′N41°57′
P4Antu County, Yanbian Prefecture126799016.768.745northwestbottomE128°55′N43°07′
P5Liuhe County, Tonghua City6588892066.645southwestmiddleE125°20′N41°51′
P6Fusong County, Baishan City94358218.565.610westbottomE127°47′N42°48′
P7Fusong County, Baishan City84357018.565.610westbottomE127°47′N42°48′
P8Helong City, Yanbian Prefecture176916118.86242northwesttopE128°48′N42°20′
P9Helong City, Yanbian Prefecture96855018.769.251northwesttopE128°48′N42°20′
Table 2. Soil nutrient concentration of nine sampling plots of C. macranthos population.
No.pHOrganic
Matter
(g/kg)
Total
Nitrogen
(g/kg)
Total
Phosphorus
(g/kg)
Total
Potassium
(g/kg)
Alkali-Hydrolyzed
Nitrogen
(mg/kg)
Available
Phosphorus
(mg/kg)
Available
Potassium
(mg/kg)
P14.40 ± 0.05 ef154.63 ± 10.09 b3.11 ± 0.12 b0.88 ± 0.03 ac27.92 ± 0.29 f407.44 ± 8.17 b10.03 ± 0.50 de287.84 ± 15.6 d
P24.43 ± 0.02 e135.56 ± 1.52 c2.93 ± 0.05 c0.85 ± 0.02 c26.00 ± 1.13 f386.76 ± 2.29 b7.07 ± 1.27 e273.97 ± 0.58 d
P34.25 ± 0.04 f193.73 ± 14.28 a3.53 ± 0.02 a0.85 ± 0.02 c23.48 ± 0.29 f476.79 ± 20.41 a15.48 ± 1.86 b353.97 ± 2.89 c
P45.94 ± 0.05 ab116.92 ± 2.68 de2.67 ± 0.02 d1.31 ± 0.50 a32.19 ± 0.72 cd167.17 ± 2.14 e14.85 ± 1.41 bc426.20 ± 4.36 b
P55.72 ± 0.18 c108.57 ± 2.55 e2.67 ± 0.01 d0.40 ± 0.07 d34.81 ± 2.23 b268.72 ± 1.04 d15.18 ± 0.91 bc405.53 ± 2.52 c
P65.56 ± 0.05 d134.70 ± 1.90 c2.92 ± 0.01 c0.41 ± 0.06 d30.71 ± 0.53 de332.97 ± 1.79 c15.54 ± 1.28 b473.2 ± 2.00 a
P75.99 ± 0.09 a133.19 ± 2.73 c2.85 ± 0.02 c1.16 ± 0.04 ac38.08 ± 0.64 a246.98 ± 2.04 d12.00 ± 0.69 cd502.87 ± 2.52 a
P85.82 ± 0.05 bc127.14 ± 1.92 cd2.68 ± 0.02 d0.97 ± 0.05 ac29.66 ± 0.72 ef155.57 ± 0.63 e13.35 ± 3.37 bc432.53 ± 1.53 b
P95.51 ± 0.06 d126.18 ± 0.76 cd2.60 ± 0.00 d0.77 ± 0.02 bc33.06 ± 0.52 bc155.06 ± 3.59 e18.96 ± 0.87 a435.20 ± 1.73 b
Note: The lowercase letters in the same column indicate a significant difference at the 0.05 level (p < 0.05). There is no significant difference between the same letters, but there are significant differences between different letters.
Table 3. Morphological parameters of C. macranthos plants sampled from nine populations.
No.Plant Height
(cm)
Crown Width
(cm)
Stem Diameter
(cm)
Leaf Length
(cm)
Leaf Width
(cm)
Leaf Area
(cm2)
Number of Leaves
(Piece)
P135.33 ± 0.58 cd24.07 ± 0.98 cd0.32 ± 0.03 c16.40 ± 0.35 b6.93 ± 0.49 a89.35 ± 8.31 a5.00 ± 0.00 b
P234.50 ± 2.18 cde21.33 ± 2.02 de0.47 ± 0.06 ab15.63 ± 0.06 bcd6.80 ± 0.26 a83.46 ± 3.46 abc5.33 ± 0.58 ab
P331.90 ± 1.82 e20.50 ± 2.29 de0.57 ± 0.06 a14.97 ± 0.25 d6.80 ± 0.10 a79.90 ± 2.24 abc5.33 ± 0.58 ab
P433.73 ± 1.14 de19.50 ± 2.29 e0.34 ± 0.13 c14.80 ± 0.26 d6.57 ± 0.38 ab76.30 ± 4.88 bc6.00 ± 0.00 a
P533.03 ± 0.61 de27.17 ± 0.29 ab0.35 ± 0.05 bc15.83 ± 0.61 bc6.40 ± 0.36 ab79.65 ± 7.37 abc5.00 ± 0.00 b
P637.27 ± 0.96 bc20.00 ± 1.00 de0.43 ± 0.02 bc17.40 ± 0.10 a5.17 ± 0.12 c70.58 ± 1.94 c5.33 ± 0.58 ab
P738.40 ± 0.92 b22.83 ± 2.36 cde0.37 ± 0.02 bc15.47 ± 0.25 cd6.33 ± 0.32 ab76.86 ± 2.89 bc5.00 ± 0.00 b
P848.70 ± 1.41 a25.67 ± 3.01 ab0.34 ± 0.02 c16.30 ± 0.72 bc6.03 ± 0.15 b77.25 ± 5.25 bc5.00 ± 0.00 b
P946.83 ± 1.76 a28.73 ± 2.54 a0.33 ± 0.06 c16.17 ± 0.61 bc6.13 ± 0.31 b77.91 ± 6.37 bc5.33 ± 0.58 ab
Note: The lowercase letters in the same column indicate a significant difference at the 0.05 level (p < 0.05). There is no significant difference between the same letters, but there are significant differences between different letters.
Table 4. The determination coefficient and significance level of environmental factors on morphological characteristics.
Environmental Factorp-Valuer2
organic matter0.0340.057
pH0.0060.087
total nitrogen0.0020.096
total phosphorus0.9170.002
total potassium0.1520.034
alkali-hydrolyzed nitrogen0.0020.113
available phosphorus0.2130.027
available potassium0.0010.100
elevation0.0060.074
crown density0.0010.137
temperature0.0170.063
humidity0.2360.025
slope aspect0.1160.037
slope position0.0190.065
slope0.0040.083
Table 5. Root structure of C. macranthos in different populations.
No.Root Diameter
(mm)
Root Cover Thickness
(μm)
Cortical Thickness
(μm)
Mycelial Pellets
(Piece)
Infection Rate
(%)
P11.19 ± 0.12 a47.78 ± 8.54 a450.15 ± 58.63 a60 ± 9 a28.78 ± 1.51 a
P21.15 ± 0.18 a46.90 ± 5.51 a455.96 ± 35.32 a56 ± 7 a33.81 ± 1.57 a
P31.19 ± 0.17 a47.97 ± 7.55 a449.42 ± 30.96 a60 ± 9 a29.02 ± 1.67 a
P41.01 ± 0.13 a35.64 ± 6.16 a440.00 ± 15.90 a55 ± 5 a11.80 ± 0.25 b
P51.10 ± 0.16 a35.36 ± 5.80 a415.99 ± 30.21 a50 ± 6 a7.30 ± 1.10 b
P61.13 ± 0.18 a32.54 ± 8.76 a436.25 ± 42.99 a18 ± 3 b2.83 ± 0.56 c
P71.08 ± 0.18 a33.13 ± 7.43 a408.13 ± 36.68 a17 ± 3 b2.77 ± 0.56 c
P80.99 ± 0.13 a33.80 ± 7.47 a345.59 ± 28.24 a10 ± 4 bc2.06 ± 0.17 c
P90.95 ± 0.17 a32.86 ± 8.13 a344.21 ± 33.86 a9 ± 1 c2.37 ± 0.09 c
Note: The lowercase letters in the same column indicate a significant difference at the 0.05 level (p < 0.05). The difference between the same letters is not significant, and the difference between different letters is significant.
Table 6. The determination coefficient and significance level of each environmental factor.
Environmental Factorp-Valuer2
organic matter0.3620.019
pH0.0070.086
total nitrogen0.0290.059
total phosphorus0.4560.014
total potassium0.0470.054
alkali-hydrolyzed nitrogen0.0010.125
available phosphorus0.0350.054
available potassium0.0010.104
elevation0.0210.061
crown density0.0010.199
temperature0.1050.036
humidity0.580.01
slope aspect0.0690.044
slope position0.0830.043
slope0.0060.091
Table 7. Gas exchange parameters of C. macranthos for three different populations.
No.Crown DensityPnECiGsWUE
P490%1.70 ± 0.22 b1.54 ± 0.22 b384.71 ± 1.09 a0.02 ± 0.01 b1.11 ± 0.1 b
P682%2.08 ± 0.19 b1.87 ± 0.17 b329.31 ± 7.61 b0.03 ± 0.01 b1.12 ± 0.16 b
P861%3.39 ± 0.51 a2.38 ± 0.17 a314.45 ± 8.53 c0.05 ± 0.01 a1.42 ± 0.12 a
Note: Pn: Net photosynthetic rate; E: Transpiration rate; Ci: Intercellular CO2 concentration; Gs: Stomatal conductance; WUE: Water use efficiency. The lowercase letters indicate a significant difference at the 0.05 level (p < 0.05).
Table 8. Chlorophyll fluorescence parameters of C. macranthos for three different populations.
No.Crown DensityFv/FmFv/FoΦPSIIqPqNETR
P490%0.76 ± 0.08 a2.01 ± 0.16 a0.19 ± 0.07 b0.86 ± 0.08 ab0.37 ± 0.06 b94.80 ± 10.15 a
P682%0.78 ± 0.11 a2.16 ± 0.19 a0.26 ± 0.05 b0.88 ± 0.01 a0.50 ± 0.04 a108.86 ± 23.18 a
P861%0.81 ± 0.04 a2.49 ± 0.45 a0.39 ± 0.04 a0.65 ± 0.15 b0.50 ± 0.04 a120.54 ± 35.38 a
Note: Fv/Fm: Maximum photochemical efficiency of PSII; Fv/Fo: Potential photochemical efficiency of PSII; ΦPSII: Actual photochemical efficiency; qP: Photochemical quenching coefficient; qN: Non-photochemical quenching coefficient; ETR: Electron transfer rate. The lowercase letters indicate a significant difference at the 0.05 level (p < 0.05).
Table 9. δ13C, δ15N and C and N concentrations of C. macranthos for three different populations.
No.Crown
Density
δ13C (‰)δ15N (‰)C (%)N (%)
P490%−30.83 ± 0.47 a−0.97 ± 2.01 a41.44 ± 2.06 ab2.33 ± 0.27 b
P682%−33.12 ± 0.80 b0.09 ± 0.81 a38.68 ± 0.70 b3.09 ± 0.18 a
P861%−30.23 ± 0.30 a−1.33 ± 0.42 a43.64 ± 0.31 a3.48 ± 0.05 a
Note: δ13C: δ13C concentration; δ15N: δ15N concentration; C: Carbon concentration; N: Nitrogen concentration. The lowercase letters indicate a significant difference at the 0.05 level (p < 0.05).
Table 10. Correlation analysis between photosynthetic indices and δ13C, δ15N, C and N concentrations.
IndexE
(mmol m−2 s−1)
Ci
(µmol mol−1)
Gs
(mmol m−2 s−1)
WUE
(µmol mmol−1)
Fv/FmFv/FoΦPSIIqPqNETR
(umol.mol−1)
δ13C
(‰)
δ15N
(‰)
C
(%)
N
(%)
Pn
(µmol m2 s1)
0.925 **−0.696−0.7060.885 **0.4600.4390.871 **−0.602−0.6660.5270.446−0.2480.6250.743 *
E
(mmol m2 s1)
1.000−0.774−0.714 *0.6480.719 *0.4470.749 *−0.505−0.6300.675 *0.2570.0150.4890.761 *
Ci
(µmol mol1)
1.0000.947 **−0.493−0.726 *−0.604−0.761 *0.4850.567−0.3970.149−0.098−0.141−0.944 **
Gs
(mmol m−2 s−1)
1.000−0.593−0.563−0.625−0.866 **0.4880.558−0.371−0.0170.107−0.132−0.920 **
WUE
(µmol mmol1)
1.0000.0410.4020.872 **−0.619−0.5690.2150.550−0.5010.6520.580
Fv/Fm 1.0000.4070.301−0.340−0.5530.498−0.1170.3350.0840.672 *
Fv/Fo 1.0000.498−0.709 *−0.578−0.1600.1950.0450.3580.444
ΦPSII 1.000−0.616−0.6480.4110.378−0.4450.4790.828 **
qP 1.0000.932 **0.157−0.4970.487−0.635−0.542
qN 1.000−0.093−0.5150.494−0.577−0.680 *
ETR
(umol.mol−1)
1.0000.1140.1420.2080.432
δ13C
(‰)
1.000−0.669 *0.728 *0.009
δ15N
(‰)
1.000−0.331−0.166
C(%) 1.0000.211
Note: ** At the 0.01 level, the correlation is extremely significant; * At the 0.05 level, the correlation is significant.
Disclaimer/Publisher’s Note: The statements, opinions and data contained in all publications are solely those of the individual author(s) and contributor(s) and not of MDPI and/or the editor(s). MDPI and/or the editor(s) disclaim responsibility for any injury to people or property resulting from any ideas, methods, instructions or products referred to in the content.

