Abstract
This study examines the impact of daily light integral (DLI) from artificial lighting on tomato seedlings cultivated in plant factories. By adjusting the light intensity and photoperiod of LED, the research explored the effects of varying DLIs on the morphology, growth, physiological characteristics, photosynthetic pigment content, and chlorophyll fluorescence of tomato seedlings. The optimal DLI enhanced seedling growth, biomass, root vitality, antioxidant enzyme activity, and photosynthetic pigment synthesis. Excessively high DLI or light intensity inhibited photosynthesis, potentially leading to photoinhibition. This study identified the optimal DLI of 13.2 mol·m−2·d−1 through varying DLI gradients in Exp 1 and Exp 2. Based on these findings, Exp 3 established the optimal growth conditions by setting different light intensities and photoperiods under the most suitable DLI, which were a light intensity of 200 μmol·m−2·s−1 and a photoperiod of 18 h. These results provide significant guidance for optimizing the light environment in the cultivation of tomato seedlings in plant factories, helping to improve the light energy utilization efficiency.
1. Introduction
High-efficient seedling production is a crucial component of modern agriculture, overcoming seasonal constraints to enable year-round cultivation [1]. However, insufficient natural light and the complexity of environmental control pose significant challenges. Particularly during the spring and winter seasons, artificial lighting becomes a crucial measure to promote seedling growth [2,3,4]. Vertical indoor farms (plant factories), offer significant advantages over greenhouse and open-air cultivation methods by providing controlled environments that can lead to increased yields through shortened growing cycles and optimized planting densities [5]. Greenhouses are the predominant method for seedling production, but they have limited efficiency due to varying climate conditions, while plant factories have precise control of light, temperature, and humidity [6,7]. This controlled environment mitigates the impact of external weather fluctuations, ensuring a stable and efficient growth process for vegetable seedlings [8]. However, the operational energy consumption of plant factories is relatively high, with the lighting system accounting for the majority of the energy expenditure [9,10]. To achieve year-round high-yield crop production indoors, it is crucial to maximize plant growth under artificial lighting and to manage costs effectively [11,12]. LED lighting was more popularly used due to its energy efficiency, longevity, and ability to provide a customizable light spectrum tailored to the specific needs of different plant species [4]. Additionally, the application of LED lighting technology makes it possible to regulate the quality of light, thereby promoting plant growth and physiological activities [13]. Notably, the efficiency of blue LEDs can reach 93%, while that of red LEDs stands at 81% [14], optimizing energy efficiency while providing precise spectral control, which is critical for optimizing plant growth in controlled environments [15,16]. In plant factories, by maintaining a stable and consistent light environment, researchers can better understand how different light qualities, durations, and intensities affect plant growth and development.
The daily light integral (DLI) is the total photosynthetically active radiation (PAR) of a plant receives in a 24 h period [17], which has a significant impact on the growth and development of plants. There are different DLIs for different greenhouse crop species in different families and genera [18]. In the previous literature, studies on DLI have primarily focused on ornamental flowering plants. At DLIs ranging from about 12 to 14 mol·m−2·d−1, Celosia, Impatiens, Salvia, and Viola showed increases in plant dry weight and internode mass, as well as an advance in flowering time of 10 to 12 days, respectively, whereas Tagetes showed an advance in flowering time of only 4 days at the same DLIs [19]. For photoperiod-sensitive plants, such as long-day and short-day plants, DLI variations directly influence flowering times. At an 8.1 mol·m−2·d−1 DLI, flowering times for Veronica rotunda and V. longifolia were shorted by 46 days and 29 days, respectively, compared to the 3.6 mol·m−2·d−1 DLI [20]. At a high DLI of 13.4 mol·m−2·d−1, plants, such as tickseed (Coreopsis grandiflora), echinacea (Echinacea × hybrida), lavender (Lavandula angustifolia), lobelia (Lobelia × speciosa), and salvia (Salvia longispicata × farinacea), could flower even under short-day conditions [21]. The increased DLI also significantly promoted Phalaenopsis growth and flowering [22]. Numerous studies have shown that increased DLI significantly boosted vegetable crops growth and biomass accumulation. Appropriate increases in DLI significantly increased the fresh dry weight of lettuce and kale [23,24,25], as well as the fresh weight, total anthocyanin, phenolic, and flavonoid contents of sweet basil [26]. When the DLI increases from 6.5 mol·m−2·d−1 to 13 mol·m−2·d−1, the stem diameter and fresh dry weight of tomato seedlings both increase [27]. Within a certain range, increasing DLI promotes biomass accumulation, vascular tissue connectivity, and endogenous hormone biosynthesis during the healing process in tomato-grafted seedlings [28]. Our previous research found that as DLI increased from 5.41 to 11.26 mol·m−2·d−1, the root biomass, root-to-shoot ratio, seedling index, and dry matter content of cucumber increased, while the aboveground part biomass and leaf area decreased [29]. Under identical DLI conditions, different light intensities and photoperiods have different effects on plant growth. At the same DLI, lettuce, and Mizuna, under lower photosynthetic photon flux density (PPFD) and a longer photoperiod, exhibited greater fresh, dry weights, and chlorophyll content than those under higher PPFD and a shorter photoperiod [23,30,31]. At a DLI of 17.28 mol·m−2·d−1, with lower light intensity, extended photoperiod reduced the abaxial stomatal density and light-saturated stomatal conductance of Chinese cabbage leaves while increasing the thickness of cell walls and chlorophyll content [32]. An extended photoperiod promotes tomato fruit ripening and increases fruit number and yield at the same DLI [33].
Photosynthetic efficiency refers to the conversion of light energy into chemical energy during photosynthesis. Specifically, it describes the ratio between the amount of light energy that plants absorb through photosynthesis and the amount of biomass energy they produce [34,35]. Increased DLI led to a greater allocation of nitrogen to photosynthetic pathways in plants, notably enhancing Rubisco carboxylase synthesis and, consequently, the rate of CO2 fixation, thus improving photosynthetic efficiency [32]. Photoinhibition is a phenomenon where the photosynthesis efficiency declines due to overexposure to light [36,37,38]. At a light intensity of 240 μmol·m−2·s−1, tomato seedlings achieved optimal root, shoot, and stem diameter, and dry weights; however, at higher intensities, (such as 330 μmol·m−2·s−1), they did not experience further enhancements in growth but, instead, the higher intensities caused a decline [39].
Light spectral optimization exerts a significant influence on the growth and development of crops. Red light plays a crucial role in the reproductive growth and chloroplast functions of plants, while blue light affects plant development, leaf expansion, photomorphogenesis, stomatal opening, photosynthesis, and pigment accumulation [40,41]. Varying ratios of red light (R) to blue light (B) can regulate photosynthesis and growth patterns in plants. The ratio of red to blue light can significantly affect the photomorphogenesis and photosynthesis of sweet pepper (Capsicum annuum L.) seedlings, particularly by influencing leaf anatomy, photosystem II (PSII) electron transport, and the expression and activity of key enzymes in the Calvin cycle [42]. In the meta-analysis conducted by Ma et al., the combined application of red and blue light-emitting diodes (LEDs) at a 1:1 ratio was found to significantly enhance the dry weight of plants by 161%, as compared to white fluorescent lamps [15]. Under the DLI of 17.3 mol·m−2·d−1 with a red-to-blue (R:B) ratio of 1.2, hydroponic spinach demonstrated increased biomass, nutritional quality, and energy efficiency compared to other light treatments [43]. Green light can regulate plant photomorphogenesis, affecting stem elongation and chlorophyll synthesis [44]. However, the effects of green light on plant growth are relatively scarce and contradictory. Green light negatively affects the biomass of tomatoes and basil, but positively impacts the growth of lettuce and microgreens [45]. The addition of green light significantly increased the biomass and yield of tomatoes [46], which also mitigated the inhibitory effects of drought on plant growth and photosynthetic capacity, and induced a decrease in stomatal aperture and an increase in abscisic acid accumulation in tomato leaves [47]. Far-red light (FR) and ultraviolet light (UV) also play a regulatory role in plant growth and development. Our previous meta-analysis revealed that FR can significantly increase the biomass of vegetables and enhance height and stem diameter, but it reduces the contents of chlorophyll, soluble protein, and vitamin C [48]. At low R/FR, plant height, stem diameter, and biomass of tomato seedlings increased, while chlorophyll content decreased [49]. Adding far-red light also accelerated flowering and increased the number of flowers per truss in tomato plants [50]. And, FR can inhibit the growth of lateral roots by regulating the transport of gibberellins [51]. Ultraviolet (UV) radiation plays a role in the synthesis of anthocyanins, enhances the levels of protein and vitamin C, and stimulates the production of secondary metabolites such as flavonoids, but inhibits plant growth [52,53]. Appropriate supplementation of UV-A radiation can increase the biomass of tomato seedlings, mainly by increasing leaf area to promote photosynthesis [54].
Tomato (Lycopersicon esculentum) is a globally year-round cultivated crop, usually transplanted with plug seedlings. Cultivating tomato seedlings is essential for sustainable agriculture, particularly in controlled environments, such as greenhouses. Some studies have explored the effects of different DLI on tomatoes. Cruz et al. investigated the effects of different DLI and photoperiods on the growth, physiological responses, fruit yield, and quality of various tomato plants. They found that for the majority of tomato varieties, the fresh fruit weight increased in correlation with the rise in DLI, culminating in a peak at 18.4 mol·m−2·d−1 [33]. However, this study lacked detailed data for the seedling stage. Xu et al. investigated the impact of different DLI on the growth of tomato seedlings and selected suitable DLI based on the seedling index and photosynthetic efficiency [55]. Nevertheless, the growth environment during the seedling stage of tomato can affect bud differentiation, subsequently impacting early flowering and fruiting post-transplantation. Therefore, DLIs that disregard post-transplant flowering and fruiting might be unsuitable. Moreover, there are few research studies about the optimal combinations of light intensity and photoperiod under the most suitable DLI.
In this study, different DLI gradients (Experiment 1 and Experiment 2) were set up, and growth parameters, chlorophyll content, physiological characteristics, and indices related to the flowering period of tomato seedlings were analyzed to confirm the most suitable DLI. Then, under the same most suitable DLI, different light intensity (200–300 μmol·m−2·s−1) and photoperiod (12–18 h) combinations (Experiment 3) were set to evaluate the best combination. This will contribute to optimizing the light environment in plant factories for the cultivation of tomato seedlings.
2. Materials and Methods
2.1. Plant Material, Growth Conditions
This study was conducted at South China Agricultural University. The seeds of the “Xin Xing 101” tomato, a widespread cultivated tomato cultivar in South China, were placed in an incubator for 2 days, with the temperature and relative humidity set at 24–26 °C and 75–85%, respectively. Germinated seeds were sown into a 72-cell tray filled with a substrate composed of peat, coconut coir, and perlite in a 6:3:1 ratio, and then placed in the growth chamber. There were 4 treatments per experiment, with 3 replicates each. Before the full expansion of the cotyledons after sowing, 800 ± 50 mL of tap water was added to each tray every other day. After the cotyledons fully expanded, 800 ± 50 mL of one-quarter strength modified Hoagland and Arnon nutrient solution was added to each tray every other day. Upon emergence of the second true leaf, a half-strength Hoagland and Arnon nutrient solution was added to each tray every other day, 800 ± 50 mL every time, until the time of sampling.
2.2. Light Treatments
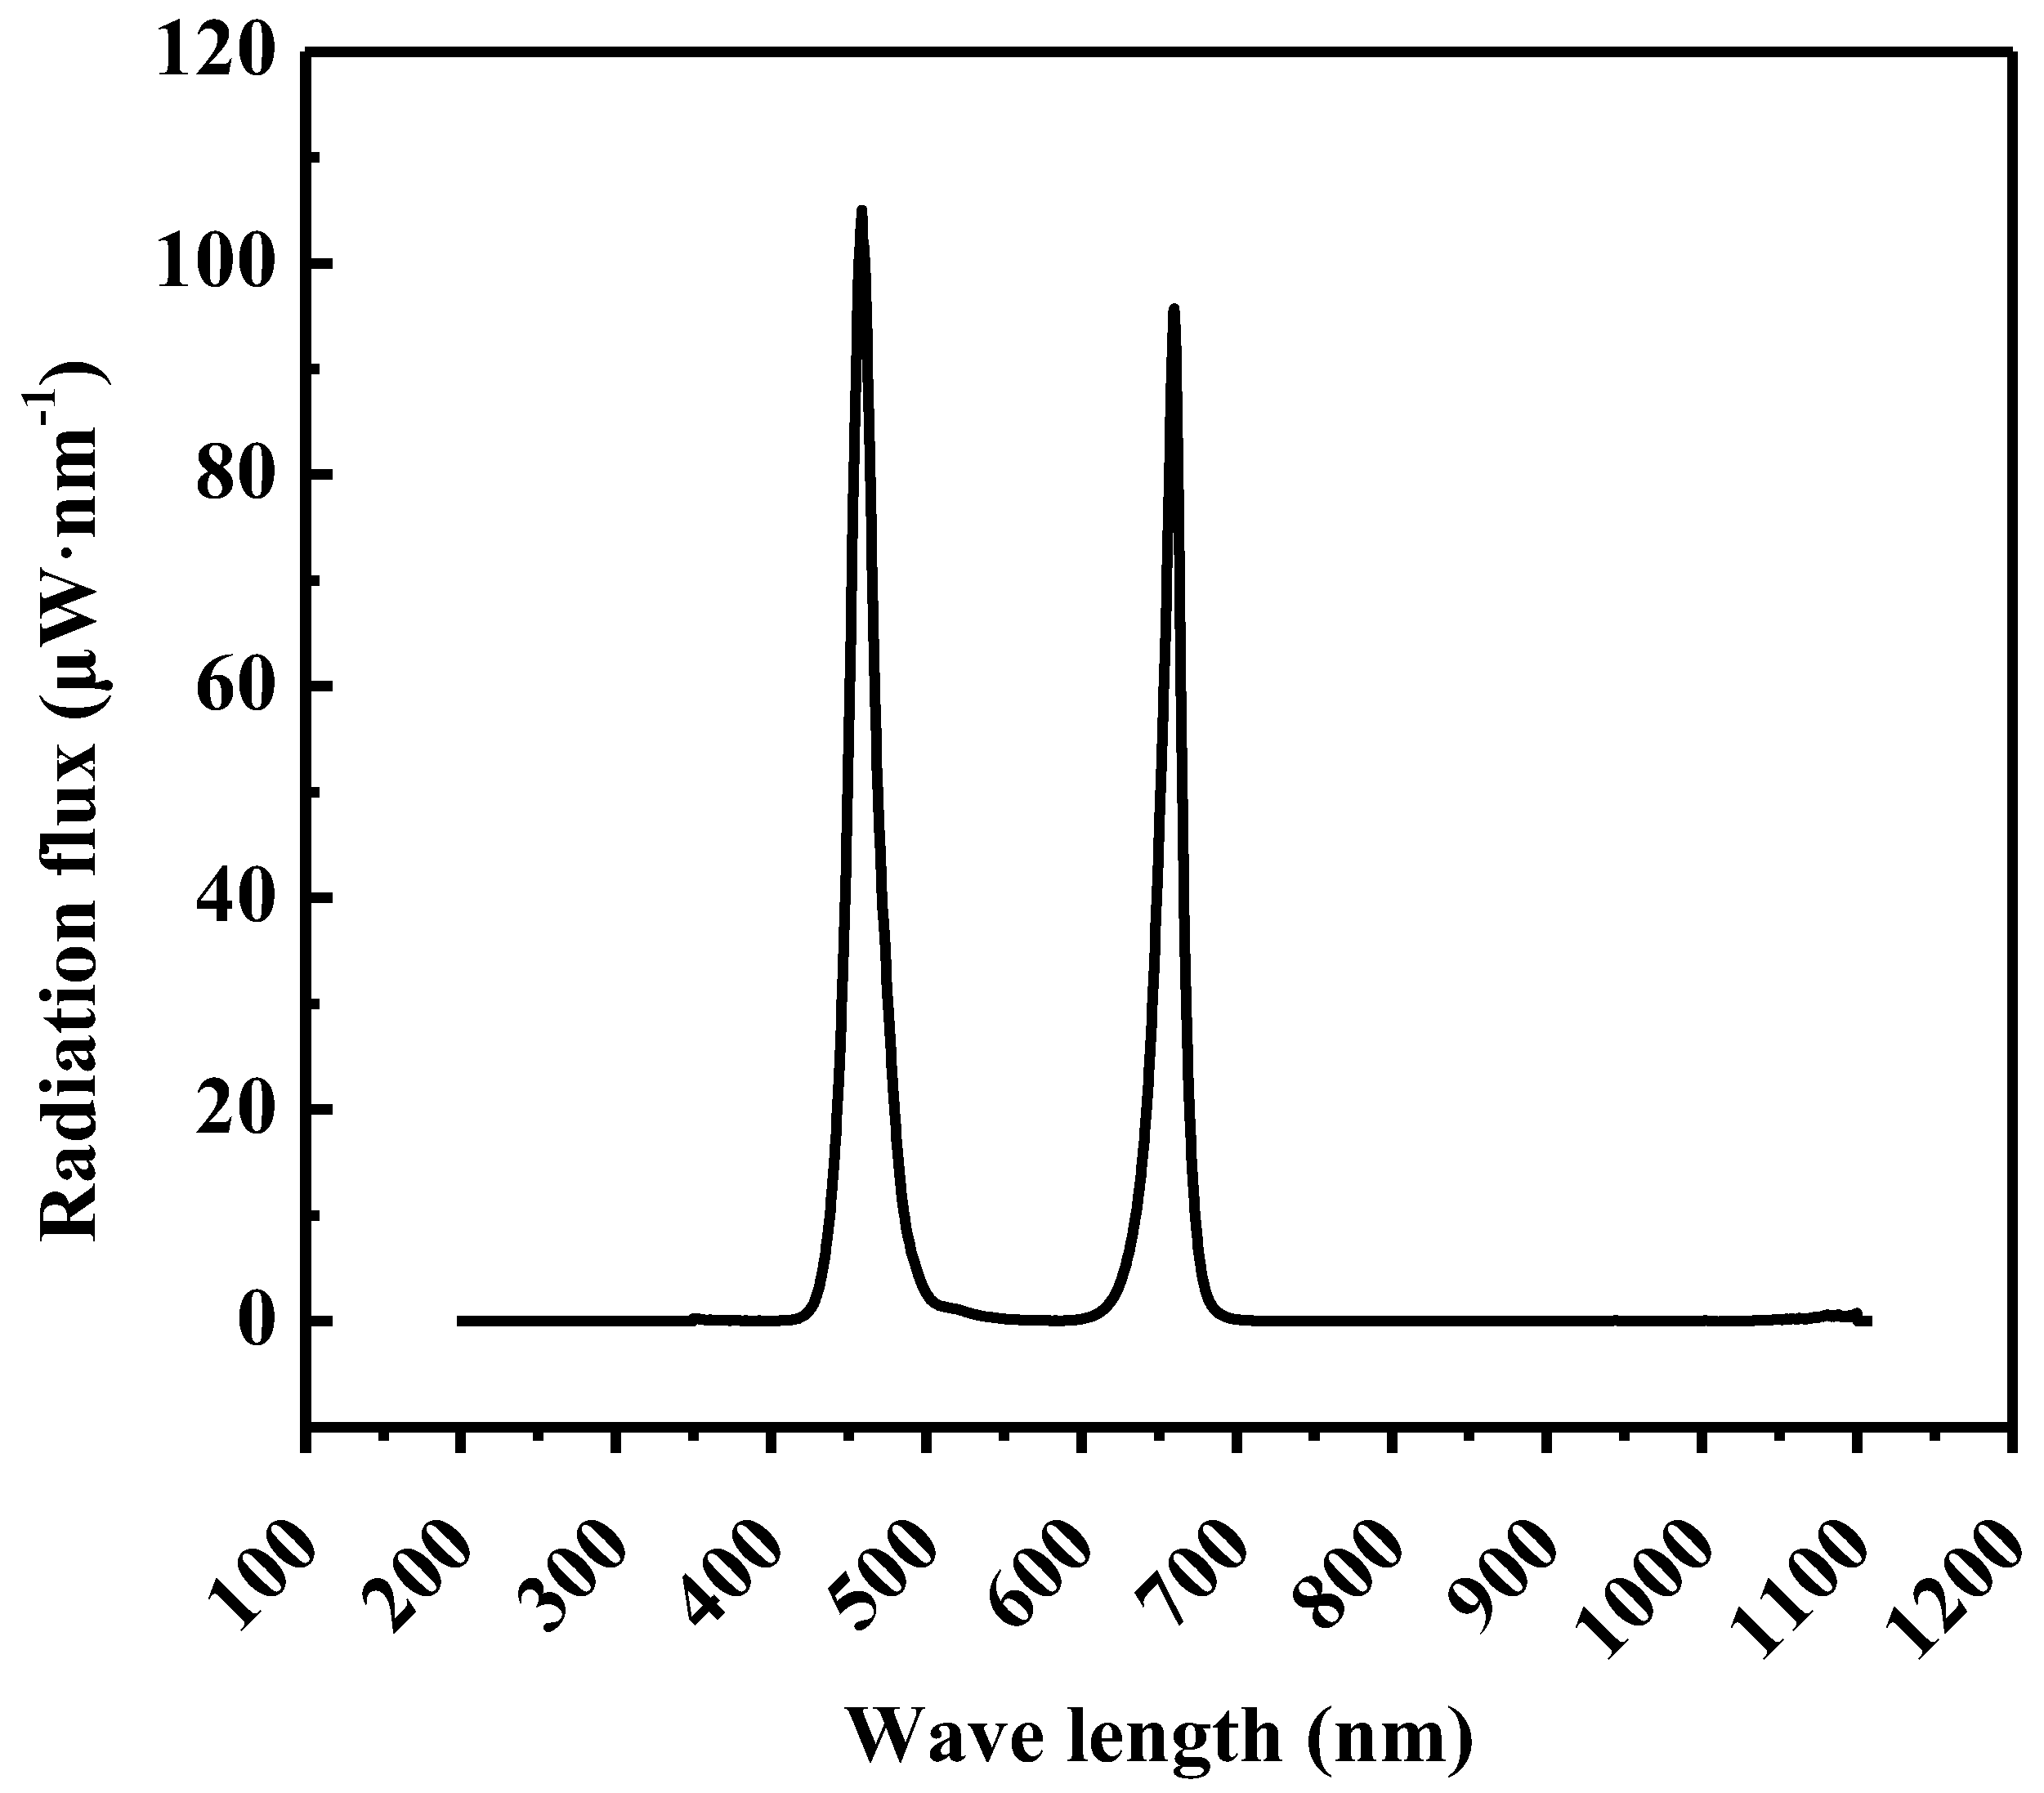
The adjustable LED lamps (Unihero Technology Co., Ltd., Huizhou, China) comprising red light (655–660 nm) and blue light (455–460 nm) with R:B = 1:1 was employed to varying photosynthetic photon flux densities (PPFDs) and photoperiods. Figure 1 illustrates the spectral distribution at a PPFD of 200 μmol·m−2·s−1.
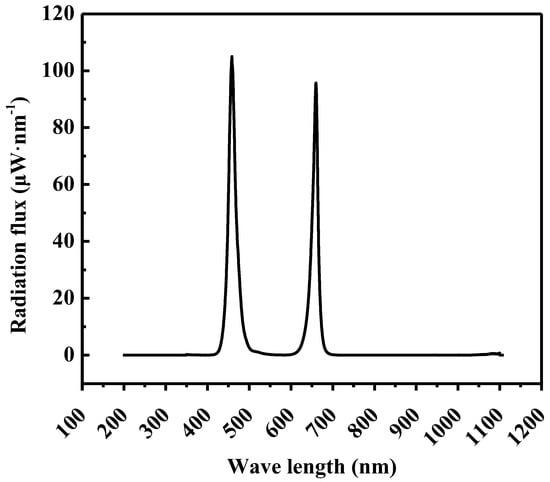
Figure 1.
Spectral distribution of 200 μmol·m−2·s−1 from LEDs with light ratios (%) of R:B = 1:1.
The experimental design incorporated two distinct light treatments:
Experiment 1 (Exp 1) and Experiment 2 (Exp 2) LED with R:B = 1:1, light intensities ranging from 150 to 250 μmol·m−2·s−1, and photoperiods of 14 h to 16 h. Four gradients of daily light integrals (DLIs) were established, with the Exp 1 from 7.52 to 11.54 mol·m−2·d−1 and the Exp 2 from 10.12 to 14.33 mol·m−2·d−1 (Table 1).

Table 1.
Illumination parameters of different treatments in Exp 1 and Exp 2.
Experiment 3 (Exp 3) maintained the same red-to-blue light ratio as Exp 1 and Exp 2, but the light intensities ranged from 200 to 300 μmol·m−2·s−1, with photoperiods from 12 h to 18 h. All four light treatments in this experiment at a DLI of 13.12 mol·m−2·d−1, which were the optimal conditions identified in Exp 1 and Exp 2 For comprehensive details (Table 2).
Table 2.
Illumination parameters of different treatments in Exp. 3.
2.3. Biometric Measurements
On the 25th day after sown, the morphological and growth characteristics of tomato seedlings from Exp 1 and Exp 2 were measured. From each treatment, six seedlings were randomly selected for determining parameters including hypocotyl length, stem diameter, leaf area, and both fresh and dry weights of shoot and root. Fresh weights were recorded using an electronic scale. The seedlings were heat-treated at 105 °C to inactivate enzymes, then dried at 80 °C to a constant weight for dry weight recording.
The seedling index was calculated as (stem diameter/hypocotyl length + root dry weight/shoot dry weight) × total dry weight × 10 [56], the root-to-shoot ratio as root dry weight/shoot dry weight, specific leaf area (SLA) as total leaf area/leaf dry weight, and shoot/total plant dry matter rate as shoot/total plant dry weight/shoot/total plant fresh weight [57,58].
2.4. Phytochemical Determination
2.4.1. Chlorophyll (Chl) and Carotenoid Contents
The determination of photosynthetic pigments in leaf was performed with the acetone–ethanol extraction method. A 0.2 g sample of vein-free leaf tissue was submerged in a 20 mL acetone-ethanol (1:1, v/v) mixture in the dark until the leaves turned blanched. Subsequently, absorbance at the wavelengths of 663 nm, 645 nm, and 440 nm was captured by the UV-spectrophotometer (Shimadzu UV-16A, Shimadzu, Corporation, Kyoto, Japan). The calculation formula is as follows [59]:
Chl a content (mg/g FW) = (12.70 × A663 − 2.69 × A645) × 8 mL/(1000 × 0.2 g);
Chl b content (mg/g FW) = (22.90 × A645 − 4.86 × A663) × 8 mL/(1000 × 0.2 g);
Chl a + Chl b content (mg/g FW) = (8.02 × A663 + 20.2 × A645) × 8 mL/(1000 × 0.2 g);
Carotenoid content (mg/g FW) = (4.7 × A440 − 2.17 × A663 − 5.45 × A645) × 8 mL/(1000 × 0.2 g).
2.4.2. Soluble Sugar Content
The anthrone colorimetric method was used to determine soluble sugar content in the leaf. The 0.5 g fresh leaf samples were put in 10 m of distilled water, and the mixture was extracted twice for 30 min in a boiling water bath. The extract was filtered and made up to 25 mL in a volumetric flask. Subsequently, 0.1 mL of the extract was pipetted into a 20 mL graduated test tube, followed by the addition of 1.9 mL of distilled water, 0.5 mL of anthrone reagent in acetic acid, and 5 mL of concentrated sulfuric acid. After thorough shaking, the mixture was kept warm for 1 minute and then allowed to cool to ambient temperature. The absorbance was measured by the UV-spectrophotometer at 630 nm, and the soluble sugar content in the sample was calculated through a standard curve [60].
2.4.3. Soluble Protein Content
The determination of soluble protein levels was performed by employing the Coomassie Brilliant Blue assay. The 0.5 g of fresh leaf samples were grounded and homogenated with 5 mL of distilled water. The centrifuge was at 10,000 rpm for 10 min, and then 0.3 mL of the supernatant was added into a test tube containing 0.7 mL of distilled water. After thorough mixing, 5 mL of a Coomassie Brilliant Blue G-250 solution was added, shaken, and then stood still for 2 min. The absorbance was measured via a UV-spectrophotometer at 595 nm, and the soluble protein content was determined by referring to the standard curve [60].
2.4.4. Root Vitalitymin
The root vitality was determined using the TTC (2,3,5-triphenyltetrazolium chloride) method. The 0.5 g fresh root tip from tomato seedlings was placed into a 10 mL beaker, 10 mL of a solution mixed equally with a phosphate buffer, and a 0.4% TTC solution was added, ensuring that the roots were fully submerged. The samples were kept in the dark at 37 °C for 1 h to 3 h, after which 2 mL of a 1 mol·L−1 sulfuric acid solution was added to terminate the reaction. Blank controls were prepared by first adding sulfuric acid, then the fresh root samples, and keeping them in the dark at 37 °C without adding sulfuric acid afterward; the solution concentration and procedural steps were the same as for the samples. The roots were then removed and placed into a 20 mL test tube, 10 mL of methanol was added to completely submerge the root tips, and the tubes were sealed and left to stand at 30 to 40 °C until they turned white. The absorbance was measured using a UV-spectrophotometer at 485 nm [60].
2.4.5. Enzyme Activities
Fresh samples (0.5 g) were ground with phosphate buffer in an ice bath, and after centrifugation, the supernatant was used for the enzymes (SOD, POD, and CAT) activities assay. The activity of Superoxide Dismutase (SOD) was determined using the Nitro Blue Tetrazolium (NBT) method [61]. A series of chemical reagents with specific concentrations, including methionine, NBT, EDTA-Na2, and riboflavin, were added during the assay process, followed by light exposure and dark treatment. The absorbance was measured using a UV-spectrophotometer at 560 nm.
The activity of Peroxidase (POD) was determined using a method adapted from Amako et al. (1994) [62]; in a 3 mL reaction mixture, which contained 0.9 mL of a 0.2% guaiacol solution, 2.0 mL of a 0.1% hydrogen peroxide solution, and 0.1 mL of an enzyme solution. The control group used a 0.05 mol·L−1 phosphate-buffer solution at a pH of 7.8 to replace the enzyme solution. After the addition of the enzyme solution, the change in absorbance at 470 nm is monitored using a UV-spectrophotometer. A change of 0.01 in absorbance per minute was defined as one unit of enzyme activity.
The activity of Catalase (CAT) was determined using a method modified by PATRA et al. (1978) [63]; in a 3 mL reaction mixture containing 1 mL of 0.2% hydrogen peroxide, 1.9 mL of distilled water, and 0.1 mL of an enzyme solution (with distilled water used in the control). CAT activity was assessed by measuring changes in absorbance at 240 nm using a UV-spectrophotometer. A change of 0.1 in absorbance value per gram of fresh sample per minute is defined as one unit of enzyme activity.
2.5. Chlorophyll Fluorescence
Chlorophyll fluorescence was assessed using a MINI-PAM-II (WALZ company, Germany), and the actinic light intensity was calibrated to 286 μmol·m−2·s−1. For each experimental set, a random selection of six seedlings was made, focusing on the second true leaf for the assessment. The analysis encompassed various fluorescence parameters: the photochemical quenching indices (qP and qL), indices of non-photochemical quenching (qN and NPQ), the non-photochemical quenching quantum yield attributed to photic injury (Y(NO)), the quantum yield of non-photochemical quenching linked to photoprotection mechanisms (Y(NPQ)), the efficiency with which PSII converts light energy (ΦPSII), and maximal photochemical efficiency of PSII in the dark (Fv/Fm).
2.6. Flowering in Tomato Plant After Transplant
The bloom of the seedlings in Exp 2. 24 h after sampling was conducted, nine seedlings with uniform growth from each treatment were transplanted into non-woven fabric cultivation bags. The seedlings were watered daily with half-strength Hoagland’s solution, then switched to full strength after the first flower bloomed. During the statistical period, no pruning or topping was applied to the seedlings. The flowering within 40 days post-transplantation was recorded, including the number of days required for the first flower to bloom after transplanting, the nodal positions of the first and second inflorescences, the number of lateral branches, and the total number of flowers at 33- and 40-days post-transplantation.
2.7. Statistical Analysis
Data processing and analysis for the experiment were conducted using SPSS 18.0 (SPSS Inc., Chicago, IL, USA), and Excel was used for data statistics and analysis. Analyses of variance (ANOVA) were performed using the “Duncan” and “Tamhane’s T2” methods. The figures were made by Origin 2021 (Origin Lab, Northampton, MA, USA).
3. Results
3.1. Experiment 1 and Experiment 2
3.1.1. Morphology and Growth of Tomato Plug Seedlings
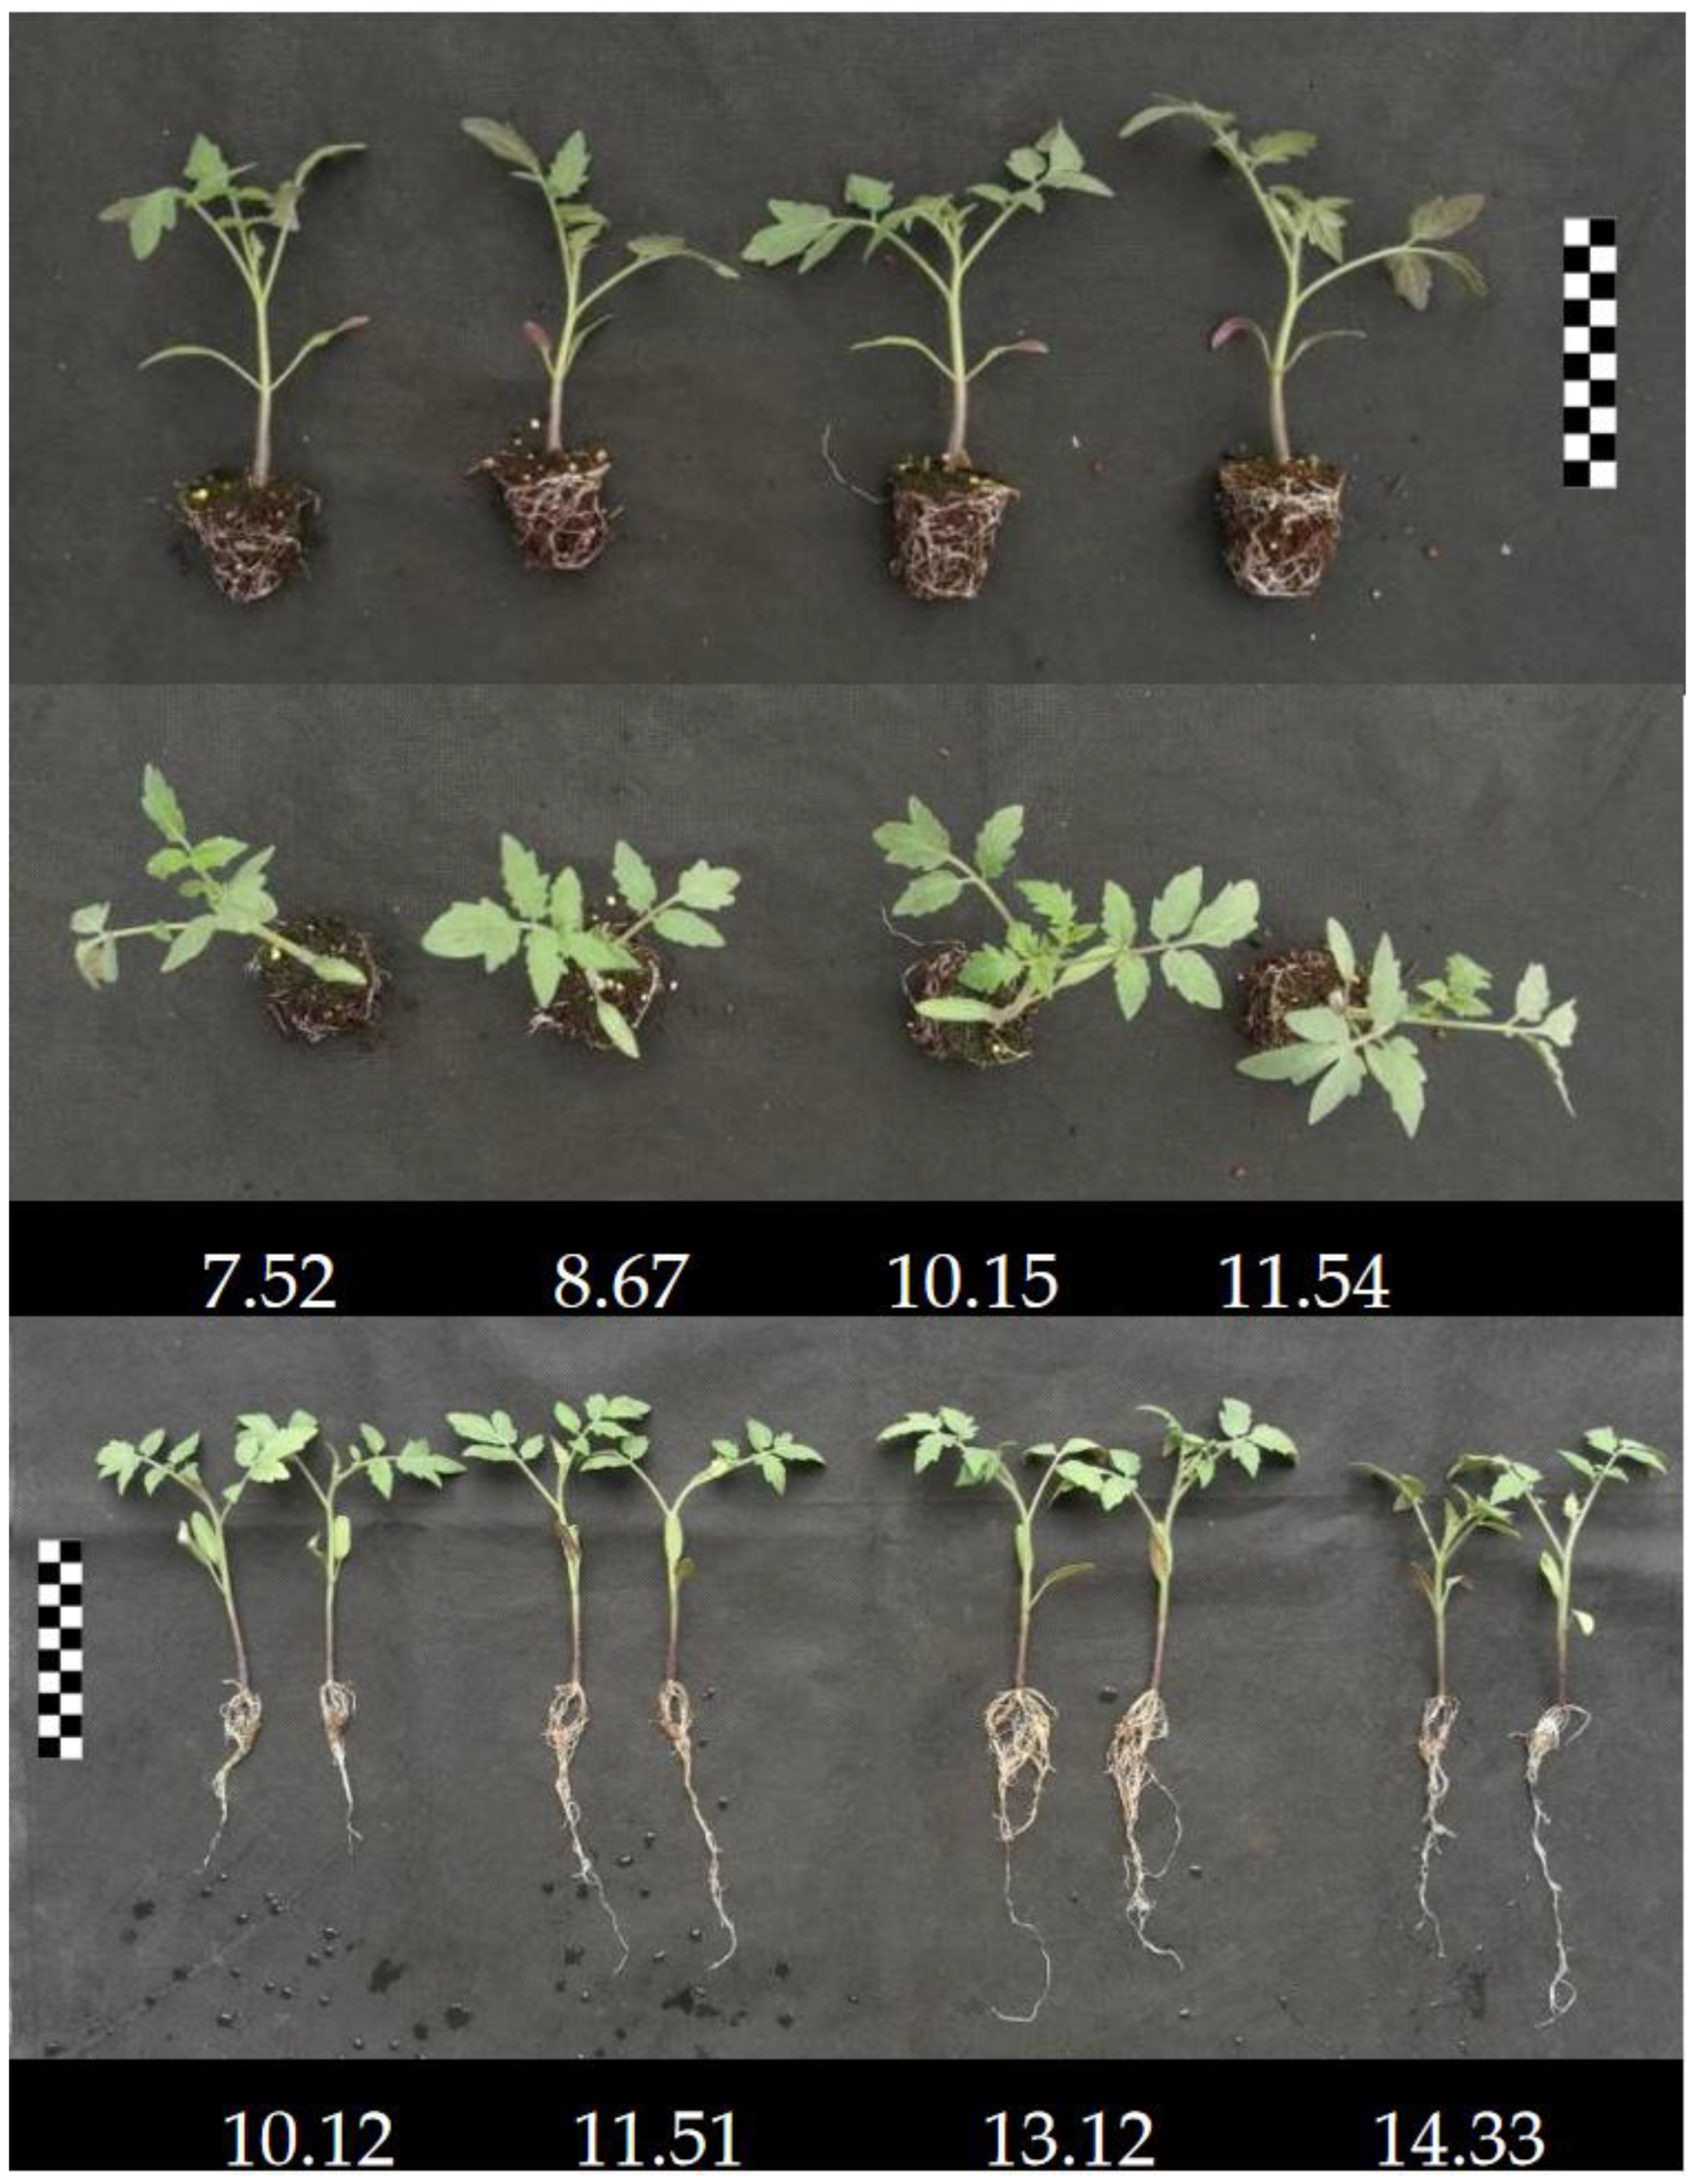
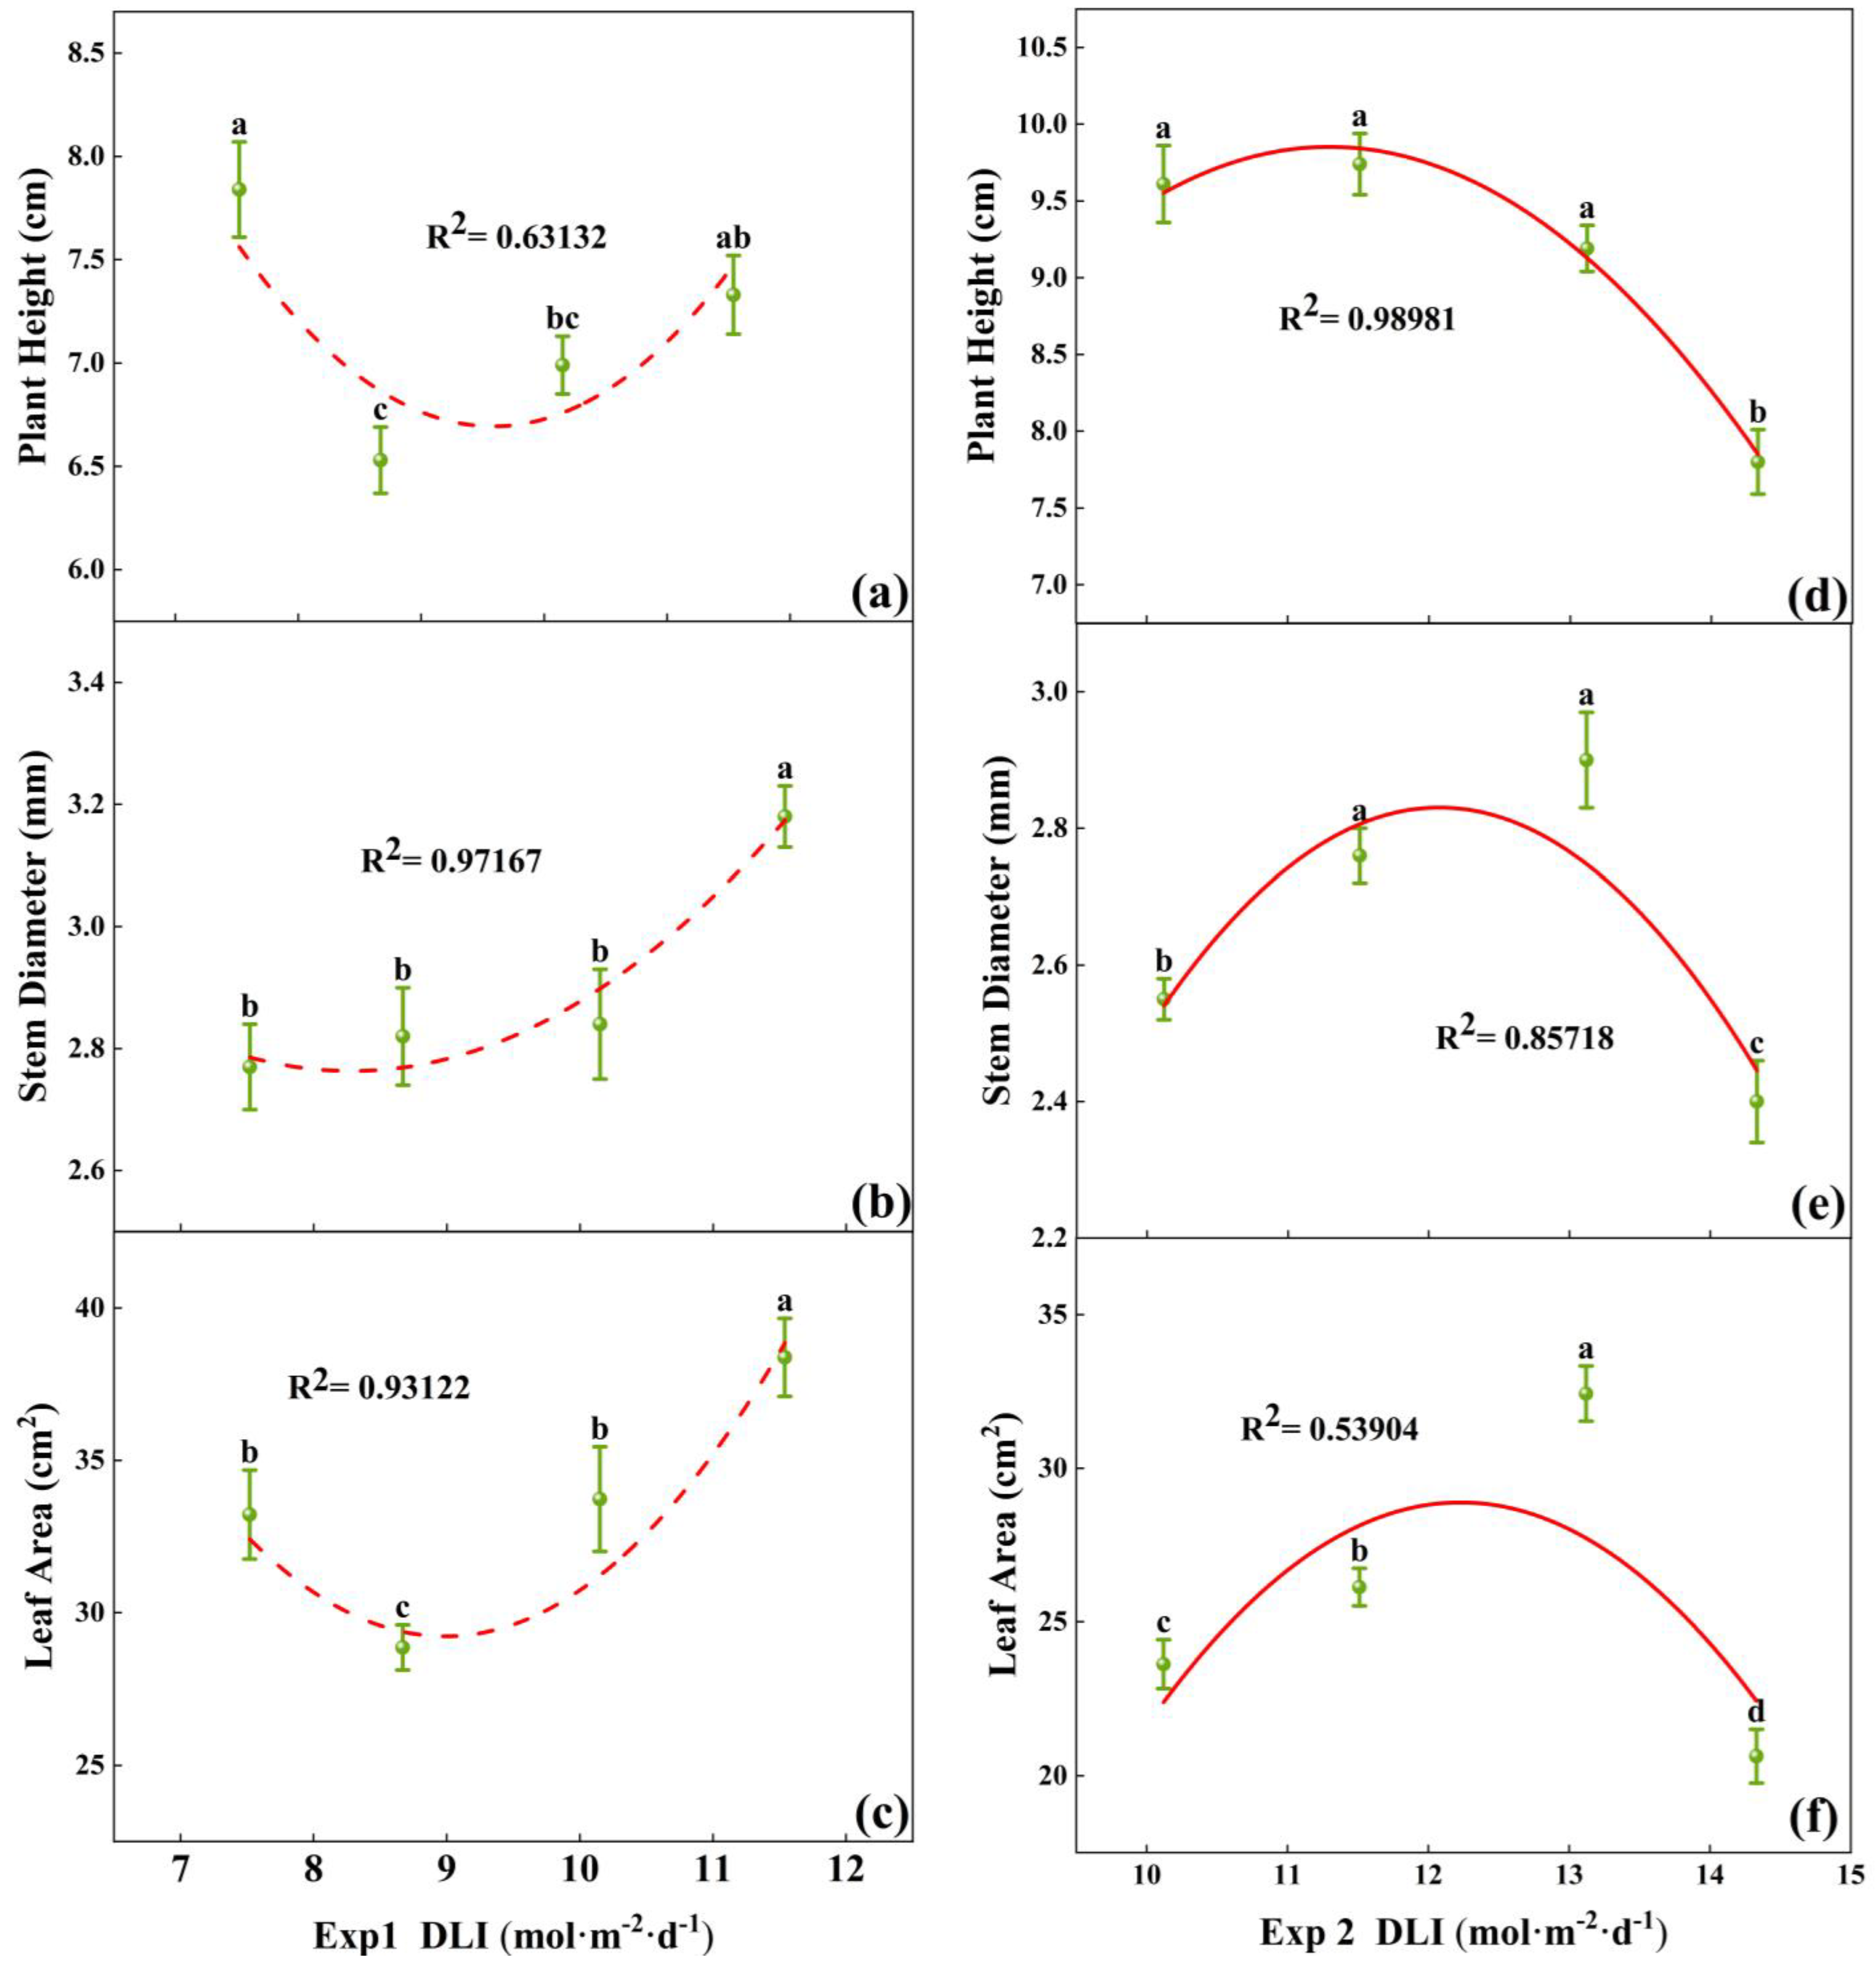
Morphological differences were observed among tomato seedlings subjected to various DLI treatments (Figure 2). In Exp 1, the plant height of tomato seedlings reached the maximum at a DLI of 7.52 mol·m−2·d−1, which was not significantly different from the height at 11.54 mol·m−2·d−1 (Figure 3a). Stem diameter and total leaf area were maximized at a DLI of 11.54 mol·m−2·d−1, significantly differing from other treatments. Additionally, stem diameter increased with higher DLI (Figure 3b,c). Building upon the last two treatment conditions of Exp 1, Exp 2 introduced two additional DLI gradients. The seedlings at a DLI of 13.12 mol·m−2·d−1 had significantly smaller plant height, stem diameter, and total leaf area compared to other treatments in Exp 2 (Figure 3d–f). At a DLI of 13.12 mol·m−2·d−1, plants had the greatest stem diameter and leaf area, with well-developed foliage and denser root systems (Figure 2). Thus, increasing DLI within a certain range could visibly promote the growth of both the shoot and root of the seedlings, but exceeding this threshold might inhibit the growth.
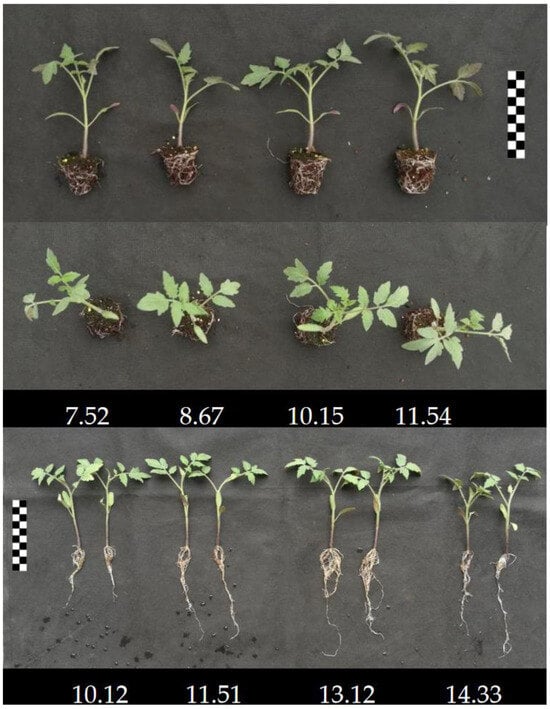
Figure 2.
The morphology of tomato seedlings treated with different DLI. The unit is mol·m−2·d−1. The length and width of the square grid on the scale are both 1 cm.
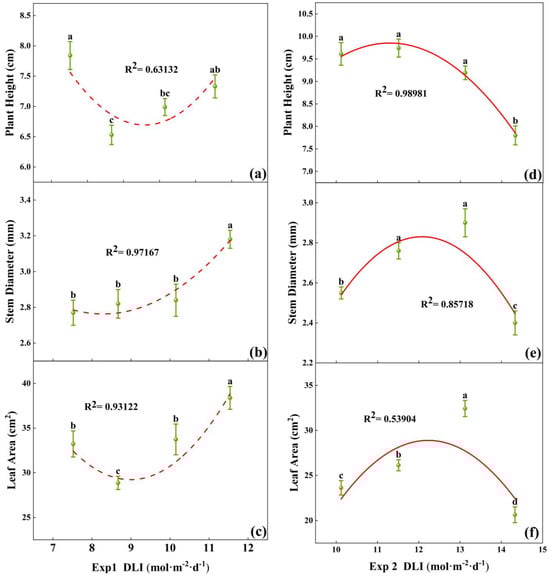
Figure 3.
Relationships between DLI and plant height, as well as stem diameter and leaf area of tomato seedlings in Exp 1 (a–c) and Exp 2 (d–f). Each symbol represents the mean of 18 plants in each treatment, and error bars represent the SEs of means. Different letters indicate statistically significant differences among treatments (p ≤ 0.05). The regression equation describes the trend of changes in research indicators as DLI varies. The fitting formula is shown in the Supplementary section.
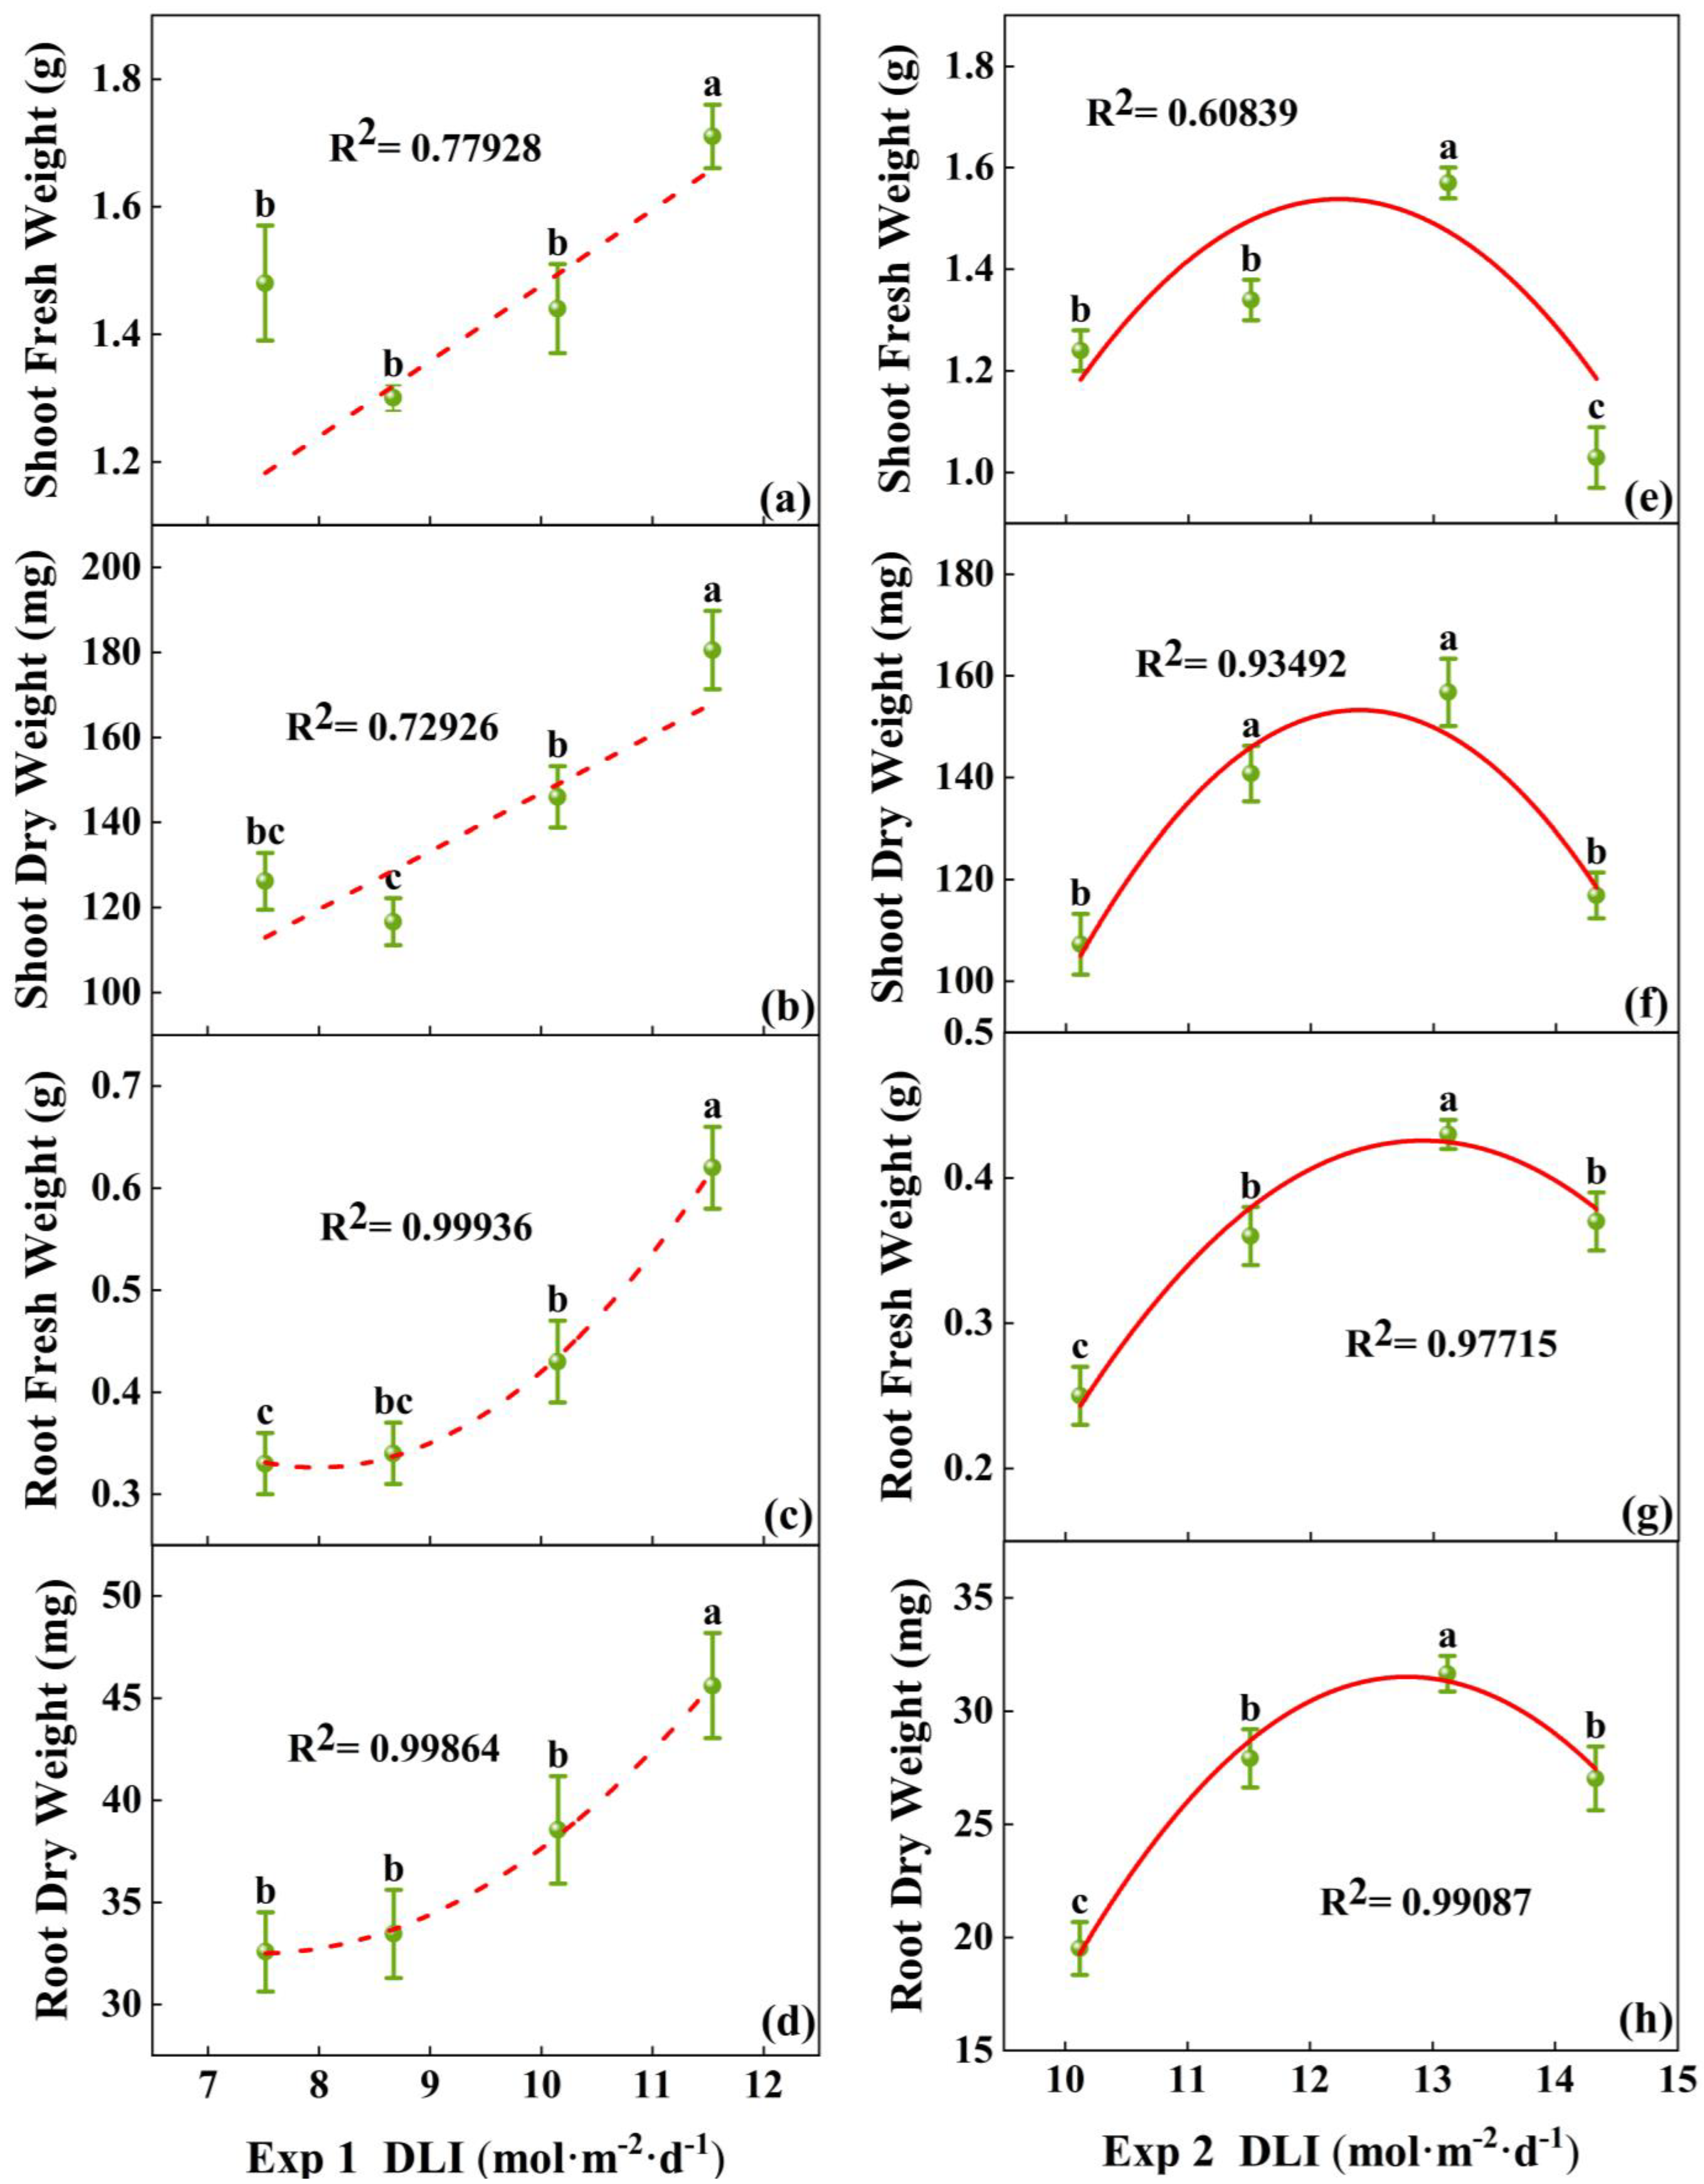
The fresh and dry weights of both the shoot and root treated with 11.54 mol·m−2·d−1 in Exp 1 were the highest (Figure 4a–d), significantly higher than other treatments. In Exp 2, the fresh and dry weight of the seedlings in the treatment at 13.12 mol·m−2·d−1 were the highest. The lowest shoot fresh weight was found in treatment at 14.33 mol·m−2·d−1, and the lowest root fresh weight and root dry weight was found in the treatment at 10.12 mol·m−2·d−1 (Figure 4e–h). So, the biomass accumulation was the greatest at 13.1 mol·m−2·d−1.
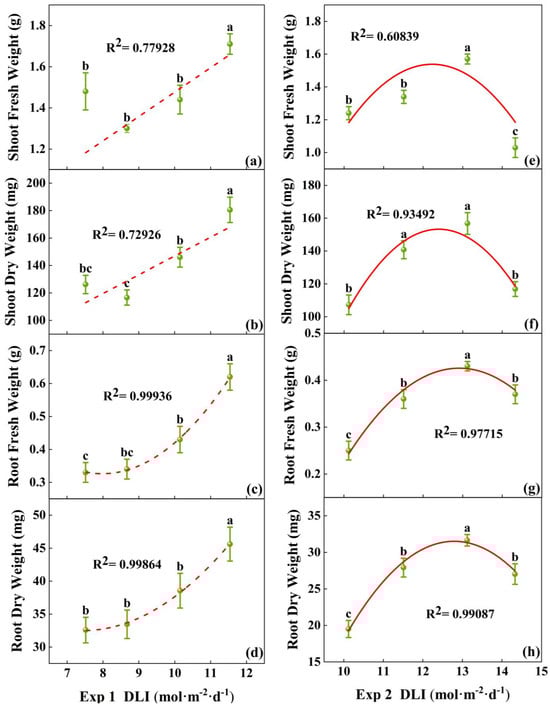
Figure 4.
Relationships between DLI and shoot fresh weight, root fresh weight, shoot dry weight, and root dry weight of tomato seedlings in Exp 1 (a–d) and Exp 2 (e–h). Each symbol represents the mean of 18 plants in each treatment, and error bars represent the SEs of means. Different letters indicate statistically significant differences among treatments (p ≤ 0.05). The regression equation describes the trend of changes in research indicators as DLI varies. The fitting formula is shown in the Supplementary section.
In Exp 1, the seedling index rose with the increasing DLI, peaking in the 11.54 mol·m−2·d−1 treatment (Table 3), which was significantly higher than the other treatments. There was no difference in the root-to-shoot ratio and the total dry matter rate among the four treatments. As DLI increased, the shoot dry matter rate gradually increased, and SLA gradually decreased. In Exp 2, the 13.12 mol·m−2·d−1 treatment had the highest seedling index, significantly higher than other treatments. The root-to-shoot ratio of tomato seedling increased with the increasing DLI, but there was no significant difference between 13.1 mol·m−2·d−1 and 14.33 mol·m−2·d−1. The shoot dry matter rate of the shoot and total plant both reached the maximum at 14.33 mol·m−2·d−1. Taking the results of the two experiments together, the seedling index was the highest at 13.1 mol·m−2·d−1, with higher-quality seedlings. As DLI increased, the root-to-shoot ratio and dry matter rate of the tomato seedlings gradually increased, while SLA showed a decreasing trend.
Table 3.
The effect of different DLIs on the seedling index, root-to-shoot ratio, dry matter rate, and SLA of tomato seedlings in Exp 1 and Exp2 1.
3.1.2. Physiological Characteristics, Enzyme Activities, and Photosynthesis Pigment Content of Tomato Plug Seedlings
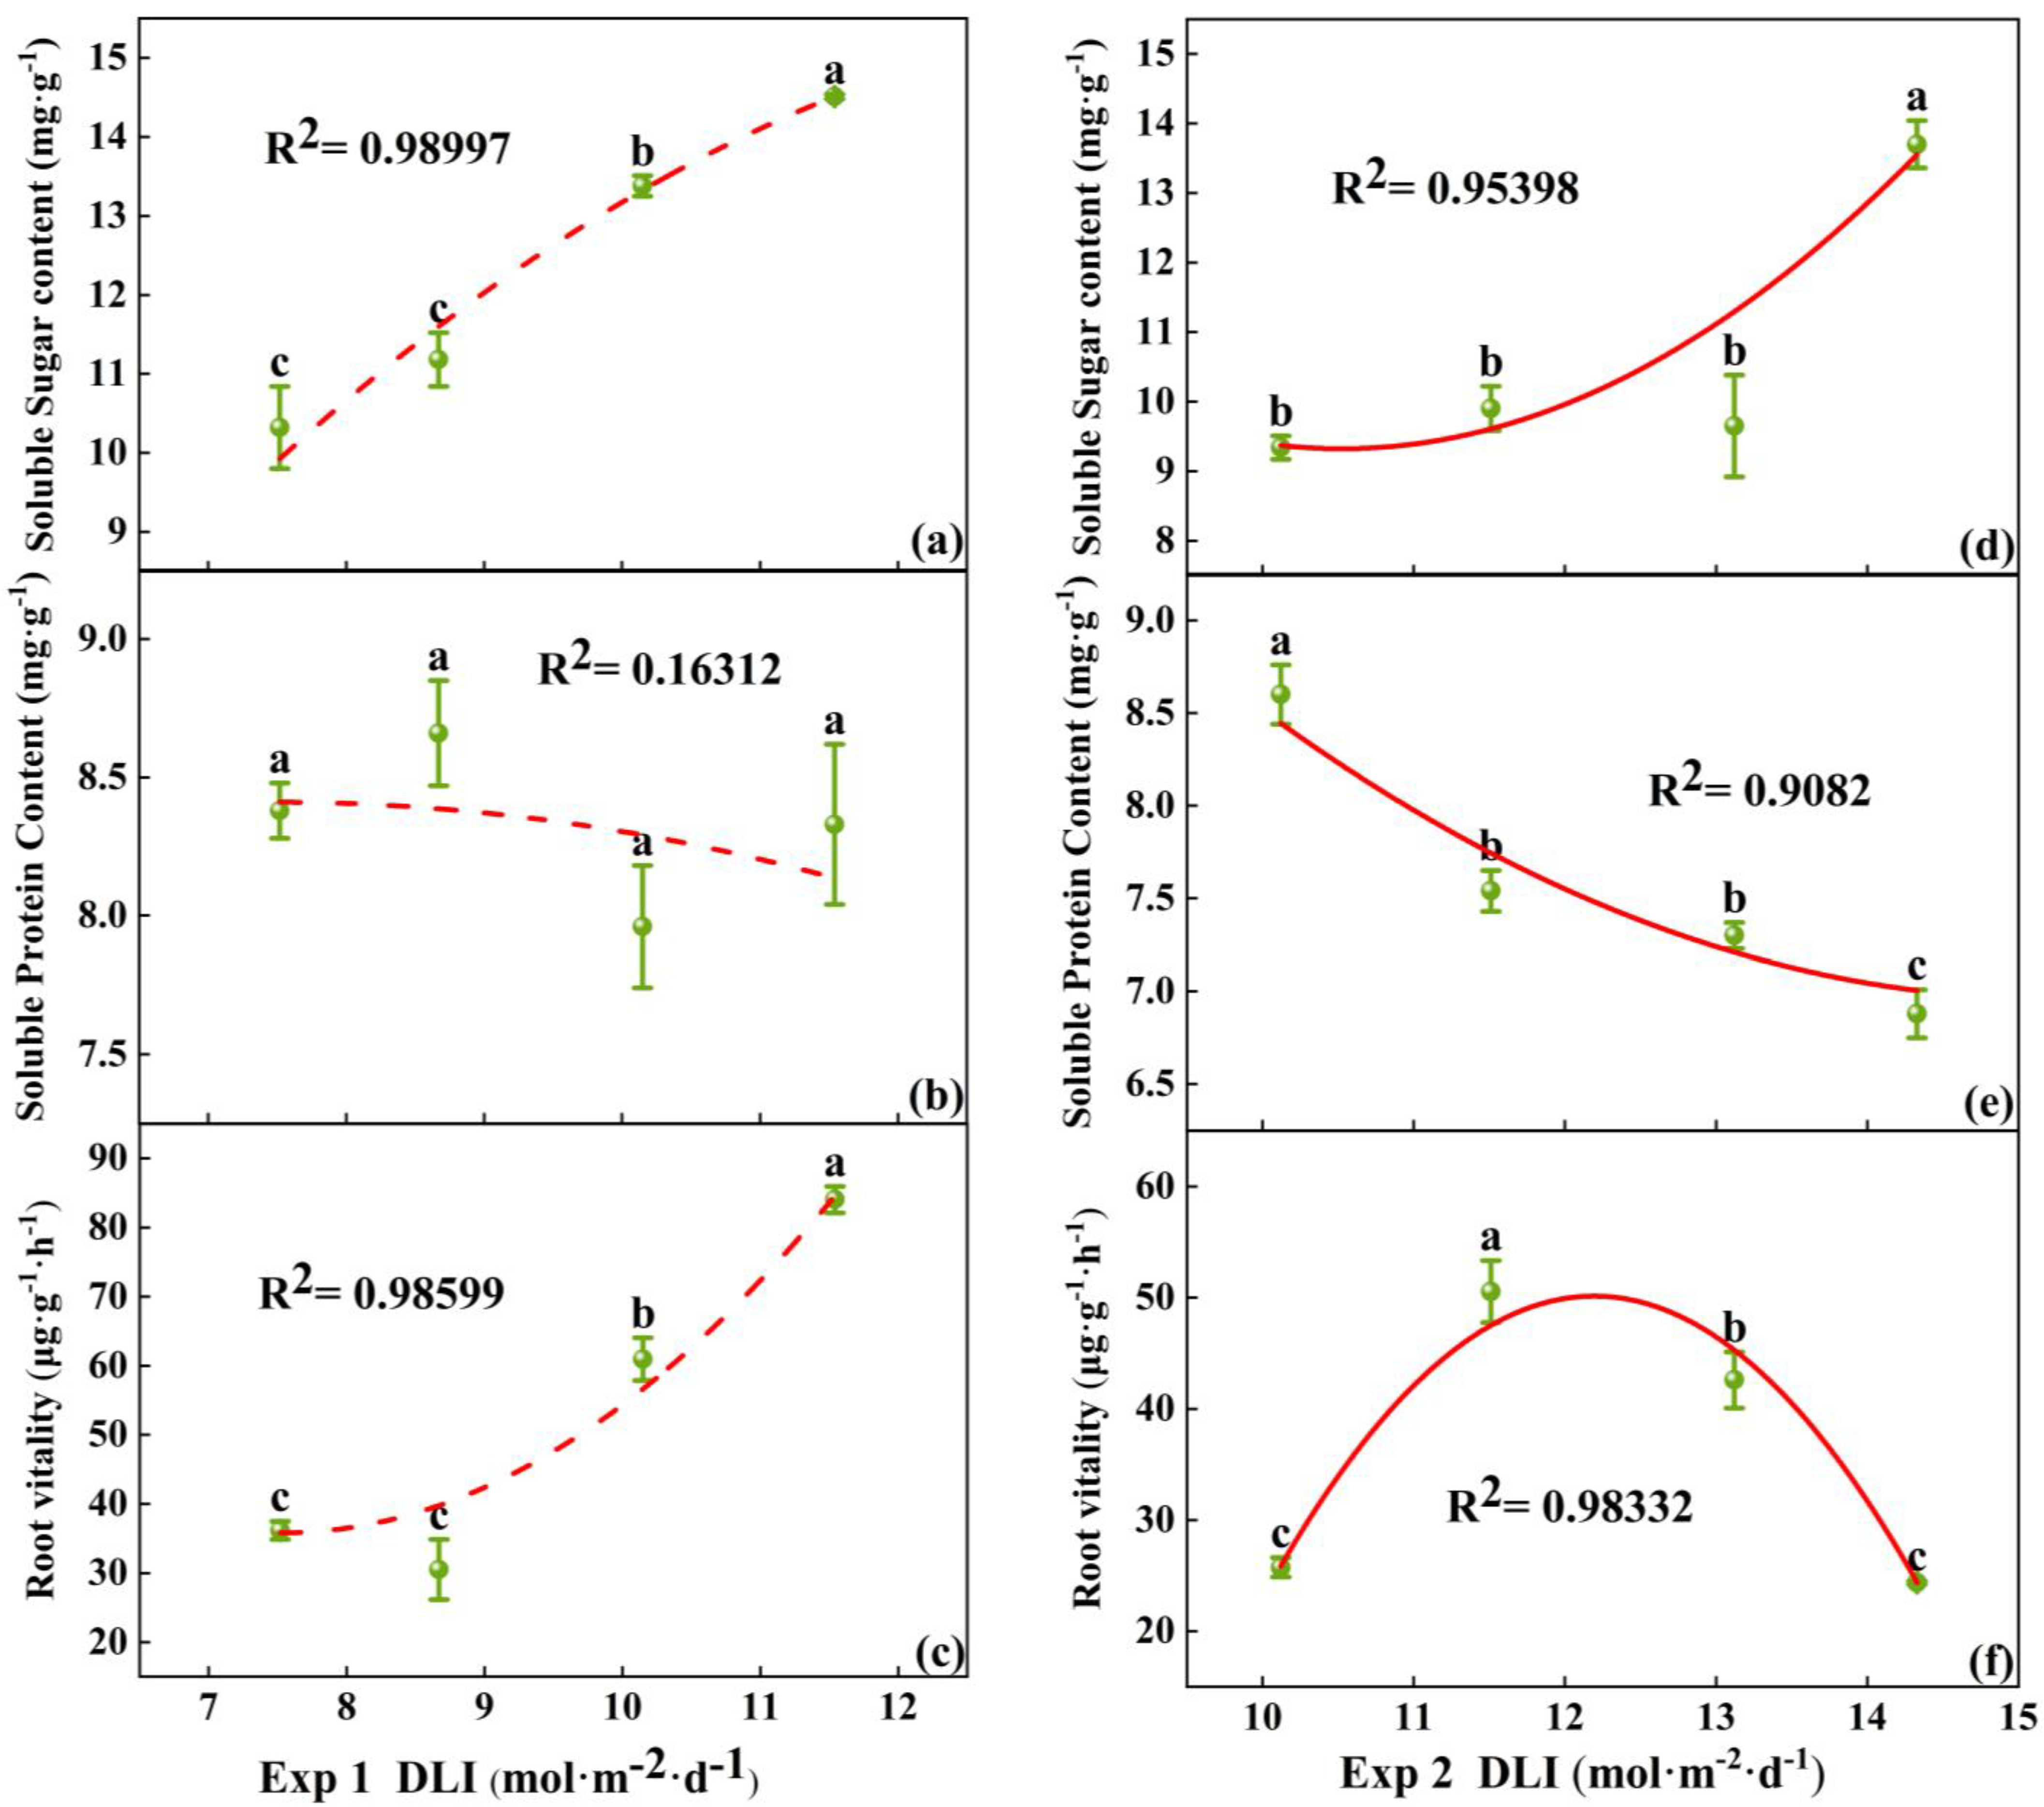
In Exp 1, the soluble sugar content at a DLI of 11.54 mol·m−2·d−1 was the highest. There was no significant difference in the soluble protein content among the treatments. Root vitality peaked at a DLI of 11.54 mol·m−2·d−1, significantly higher than the other treatments, while no significant difference was observed between the 7.52 mol·m−2·d−1 and 8.67 mol·m−2·d−1 treatments (Figure 5a–c). In Exp 2, the soluble sugar content was the greatest at a DLI of 14.33 mol·m−2·d−1. The soluble protein content was negatively correlated with DLI, with no significant difference between the treatments of 11.51 mol·m−2·d−1 and 13.12 mol·m−2·d−1. Root vitality was the highest at DLI of 11.51 mol·m−2·d−1 (Figure 5d–f). Thus, the soluble sugar content in tomato seedlings increased with the rising DLI, while the soluble protein content showed no differences under lower DLI conditions and reduced under high DLI. Root vitality increased initially with increasing DLI and then decreased, reaching its maximum at DLI of 11.5 mol·m−2·d−1.
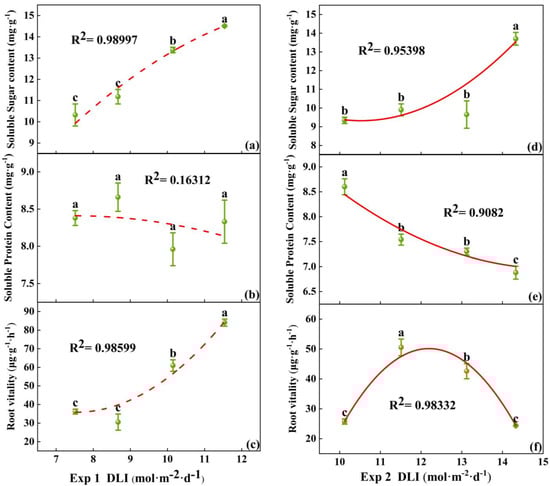
Figure 5.
Relationships between DLI and soluble sugar content, as well as soluble protein content and root vitality of tomato seedlings in Exp 1 (a–c) and Exp 2 (d–f). Each symbol represents the mean of 18 plants in each treatment, and error bars represent the SEs of means. Different letters indicate statistically significant differences among treatments (p ≤ 0.05). The regression equation describes the trend of changes in research indicators as DLI varies. The fitting formula is shown in the Supplementary section.
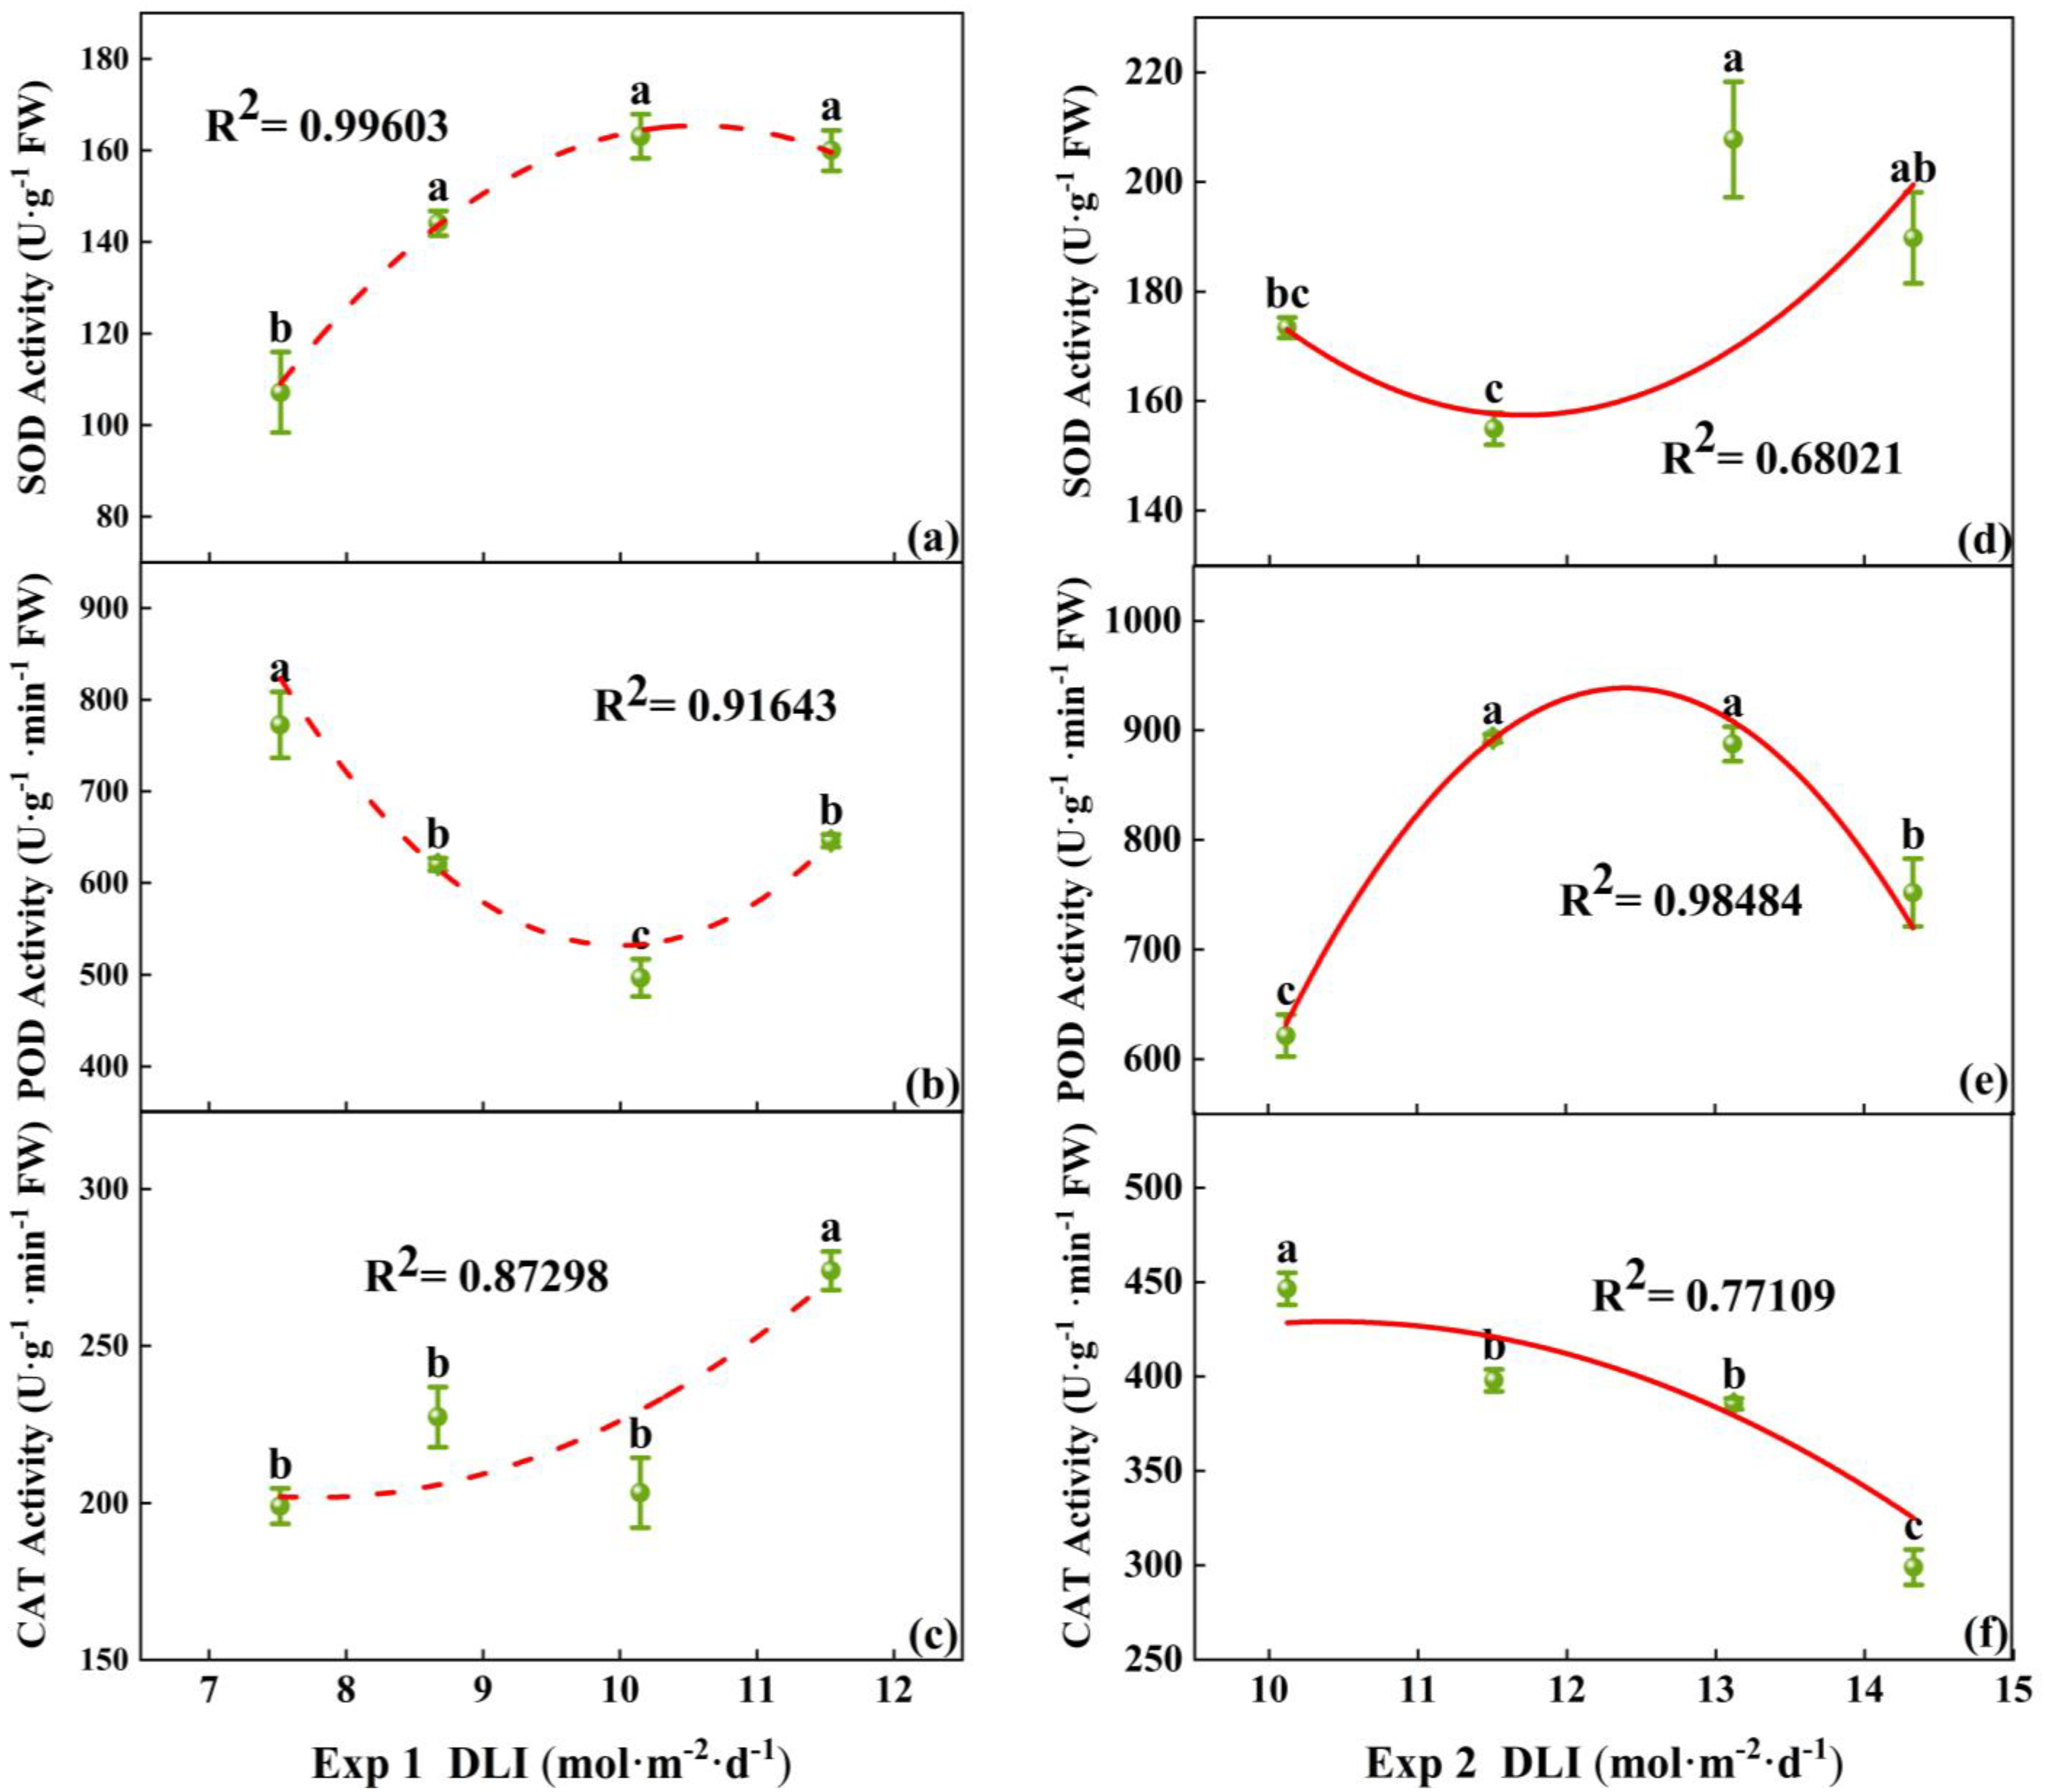
Under different DLI treatments, there were differences in the activity of antioxidant enzymes (SOD, POD, and CAT) in tomato seedlings. In Exp 1, the lowest SOD activity and the highest POD activity were found at DLI of 7.52 mol·m−2·d−1, while the highest SOD activity was at 10.15 mol·m−2·d−1. CAT activity was the highest at a DLI of 11.54 mol·m−2·d−1, with no significant difference among the other three treatments (Figure 6a–c). In Exp 2, the highest activities of SOD and POD were found at DLI of 13.12 mol·m−2·d−1. CAT activity decreased with the increase in DLI (Figure 6d–f). Thus, the increase in DLI enhanced the activity of SOD, but the effects on the activity of POD and CAT are not obvious.
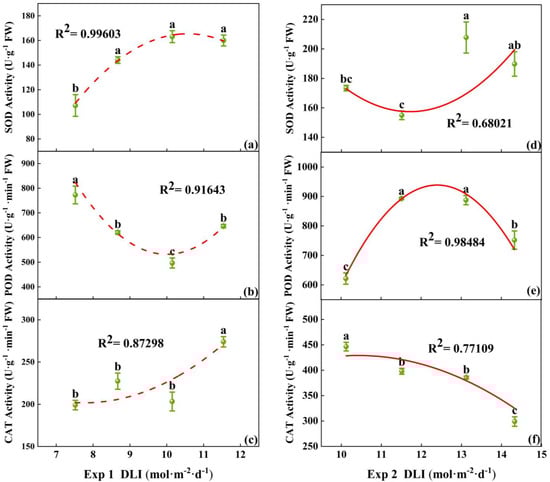
Figure 6.
Relationships between DLI and activities of SOD, POD, and CAT of tomato seedlings in Exp 1 (a–c) and Exp 2 (d–f). Each symbol represents the mean of 18 plants in each treatment, and error bars represent the SEs of means. Different letters indicate statistically significant differences among treatments (p ≤ 0.05). The regression equation describes the trend of changes in research indicators as DLI varies. The fitting formula is shown in the Supplementary section.
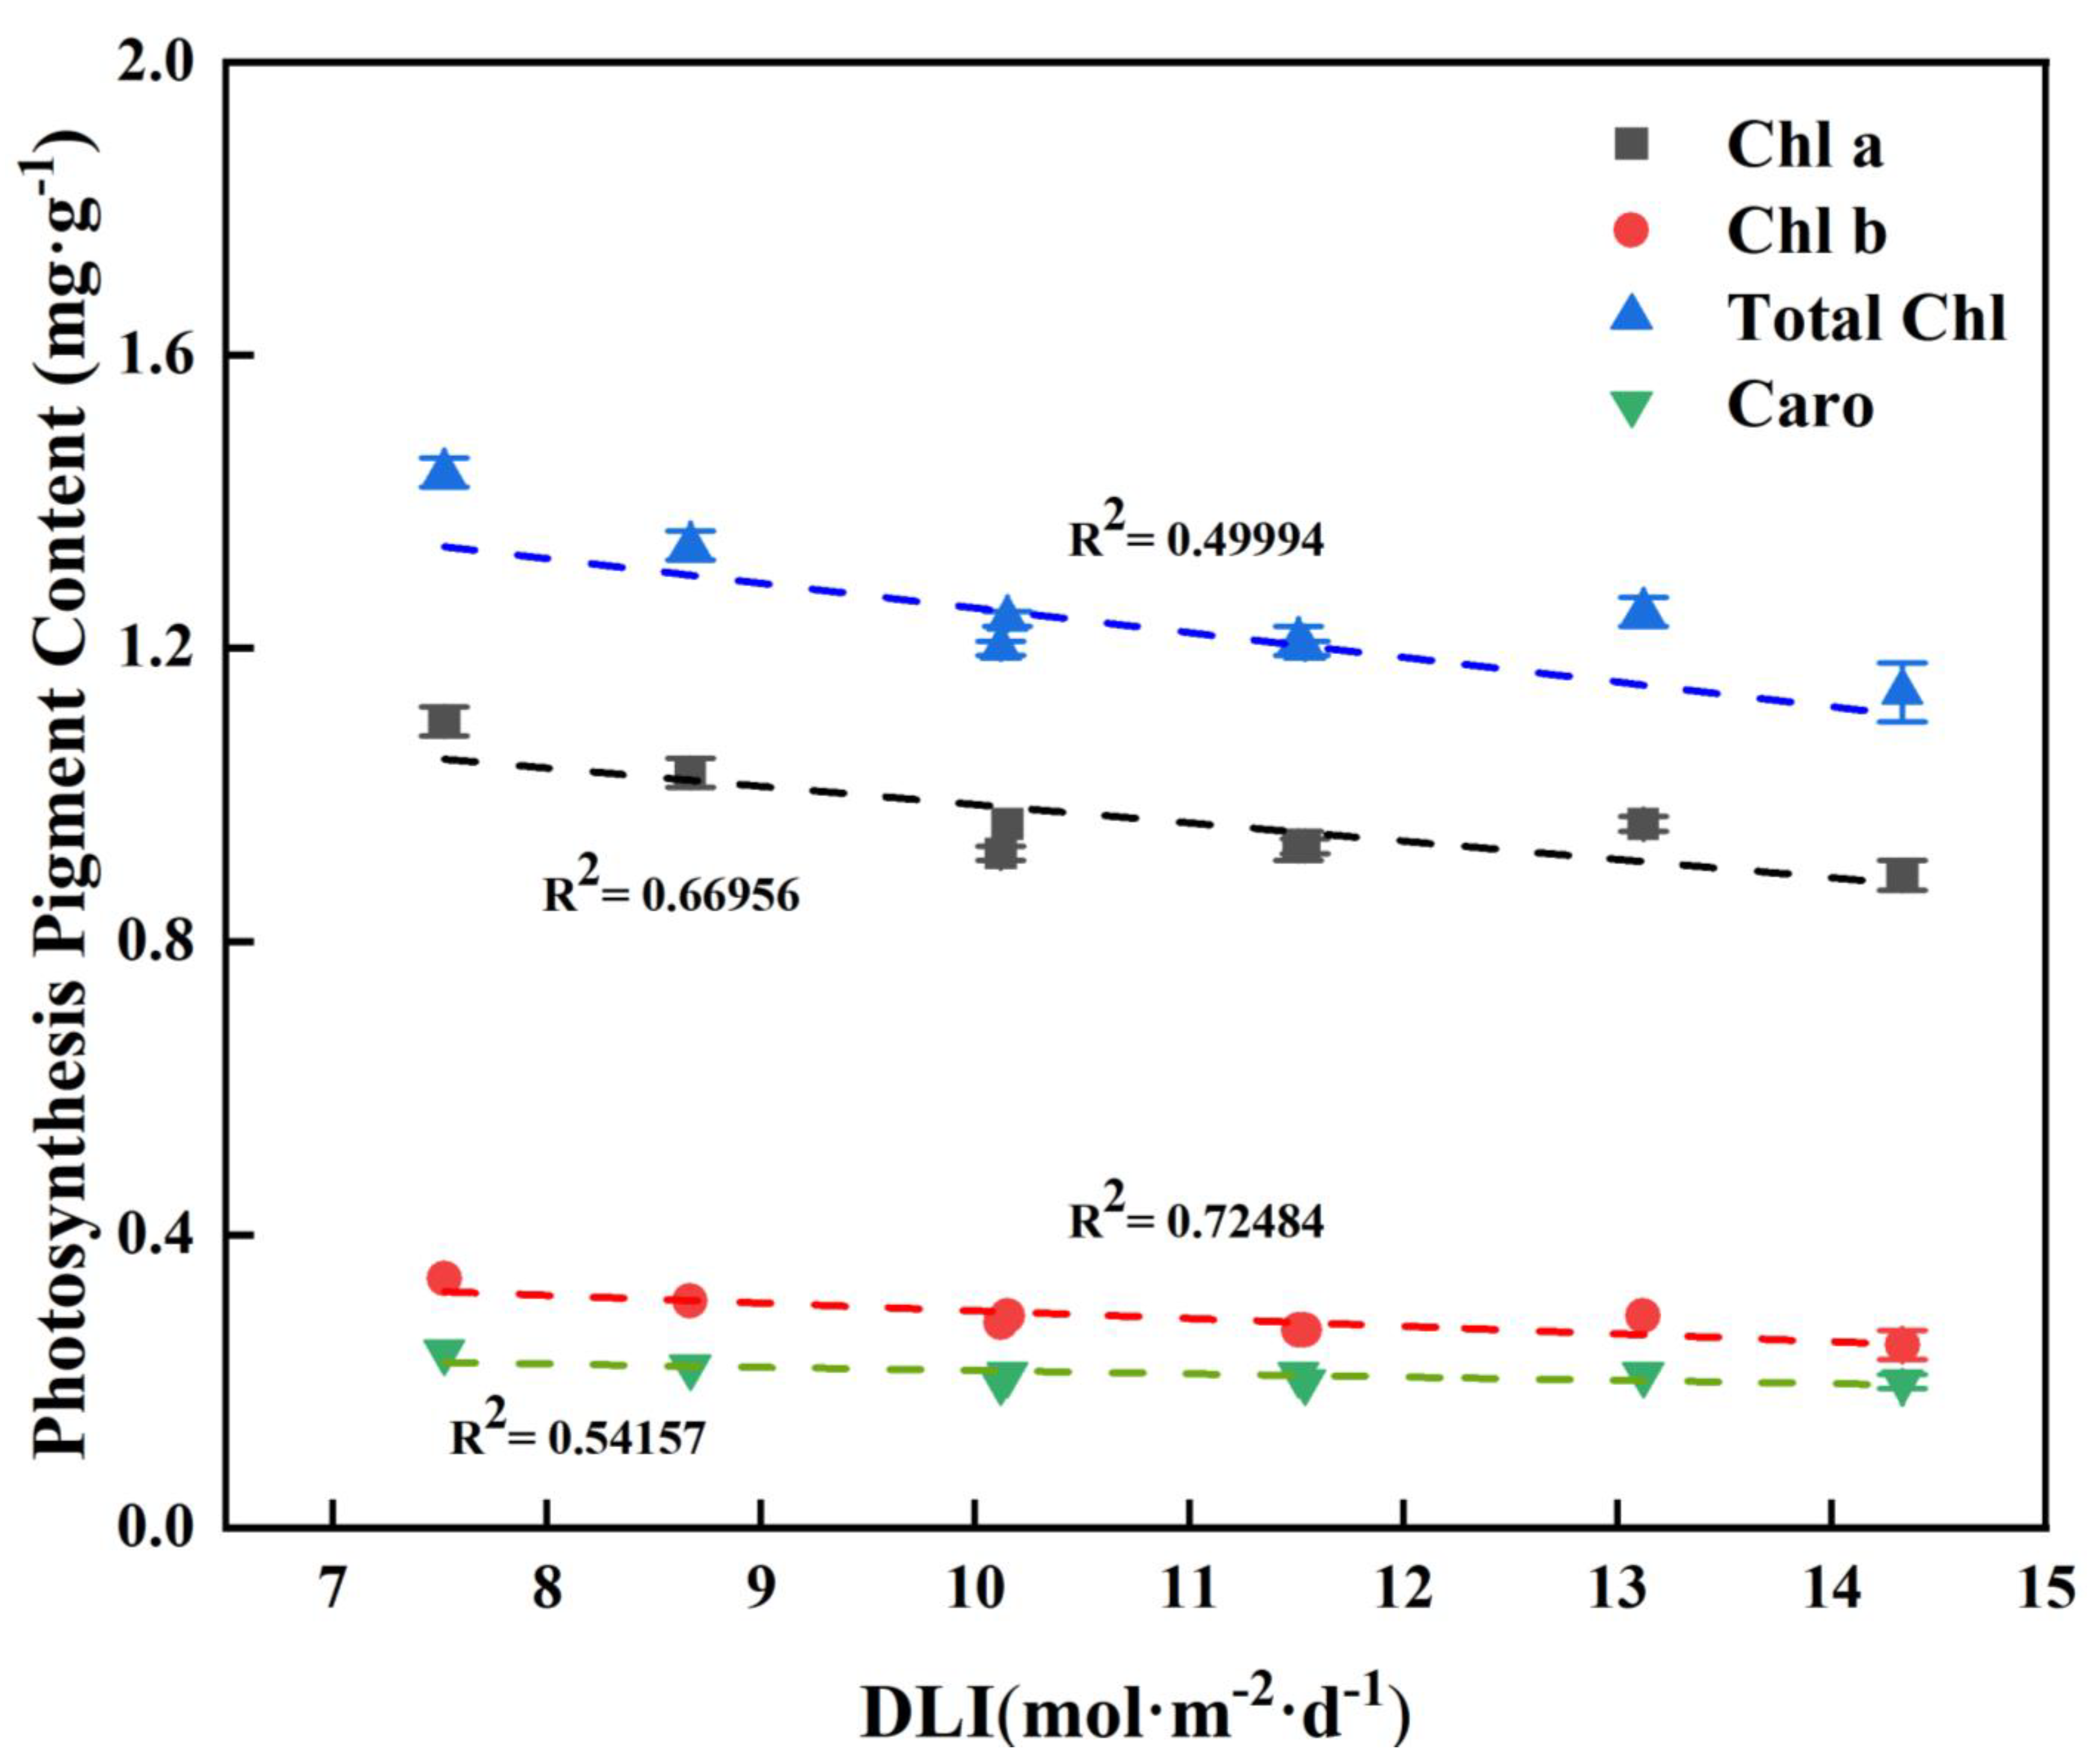
As the DLI increases, both the content of chlorophyll and carotenoids decreases to some extent. All photosynthetic pigment contents were negatively correlated with DLI (Figure 7).
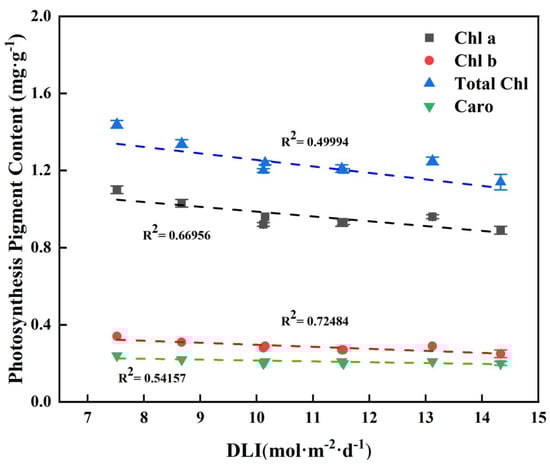
Figure 7.
Relationships between DLI and photosynthesis pigment content of tomato seedlings. Each symbol represents the mean of 18 plants in each treatment, and error bars represent the SEs of means. The regression equation describes the trend of changes in research indicators as DLI varies. The fitting formula is shown in the Supplementary section.
3.1.3. Flowering in Tomato Plant After Transplant
In Exp 2, the time to the first bloom in the tomato flowering statistics of seedlings was the longest at a DLI of 10.12 mol·m−2·d−1, while the shortest at 11.51 mol·m−2·d−1, with a difference of 1.2 days. The highest flower cluster node position was found at a DLI of 10.12 mol·m−2·d−1, and the most lateral branches at a DLI of 11.51 mol·m−2·d−1. At 33 days after transplanting (DAT), the highest total bloom count was found at a DLI of 11.51 mol·m−2·d−1, while the lowest was at 10.12 mol·m−2·d−1 (Table 4). As the DLI increased, the time from transplanting to the first bloom shortened, and the node position of the first cluster of flowers decreased, while the node position of the second cluster of flowers remained stable.
Table 4.
The effect of DLI on tomato plant flowering after transplant of cucumber plug seedlings in Exp 2 1.
The number of lateral branches reached the maximum at a DLI of 11.51 mol·m−2·d−1, but it was not significantly different among different DLIs. The total number of flowers at the 33rd and 40th DAT increased with the increase in DLI, especially most significantly at the 33rd DAT. An increasing DLI could advance the flowering period, reduce the node position of the flower cluster, and increase the number of flowers. Within the range of 11.51 to 14.33 mol·m−2·d−1, there was no difference in the flowering situation (Table 4).
3.2. Experiment 3
3.2.1. Morphology and Growth of Tomato Plug Seedlings
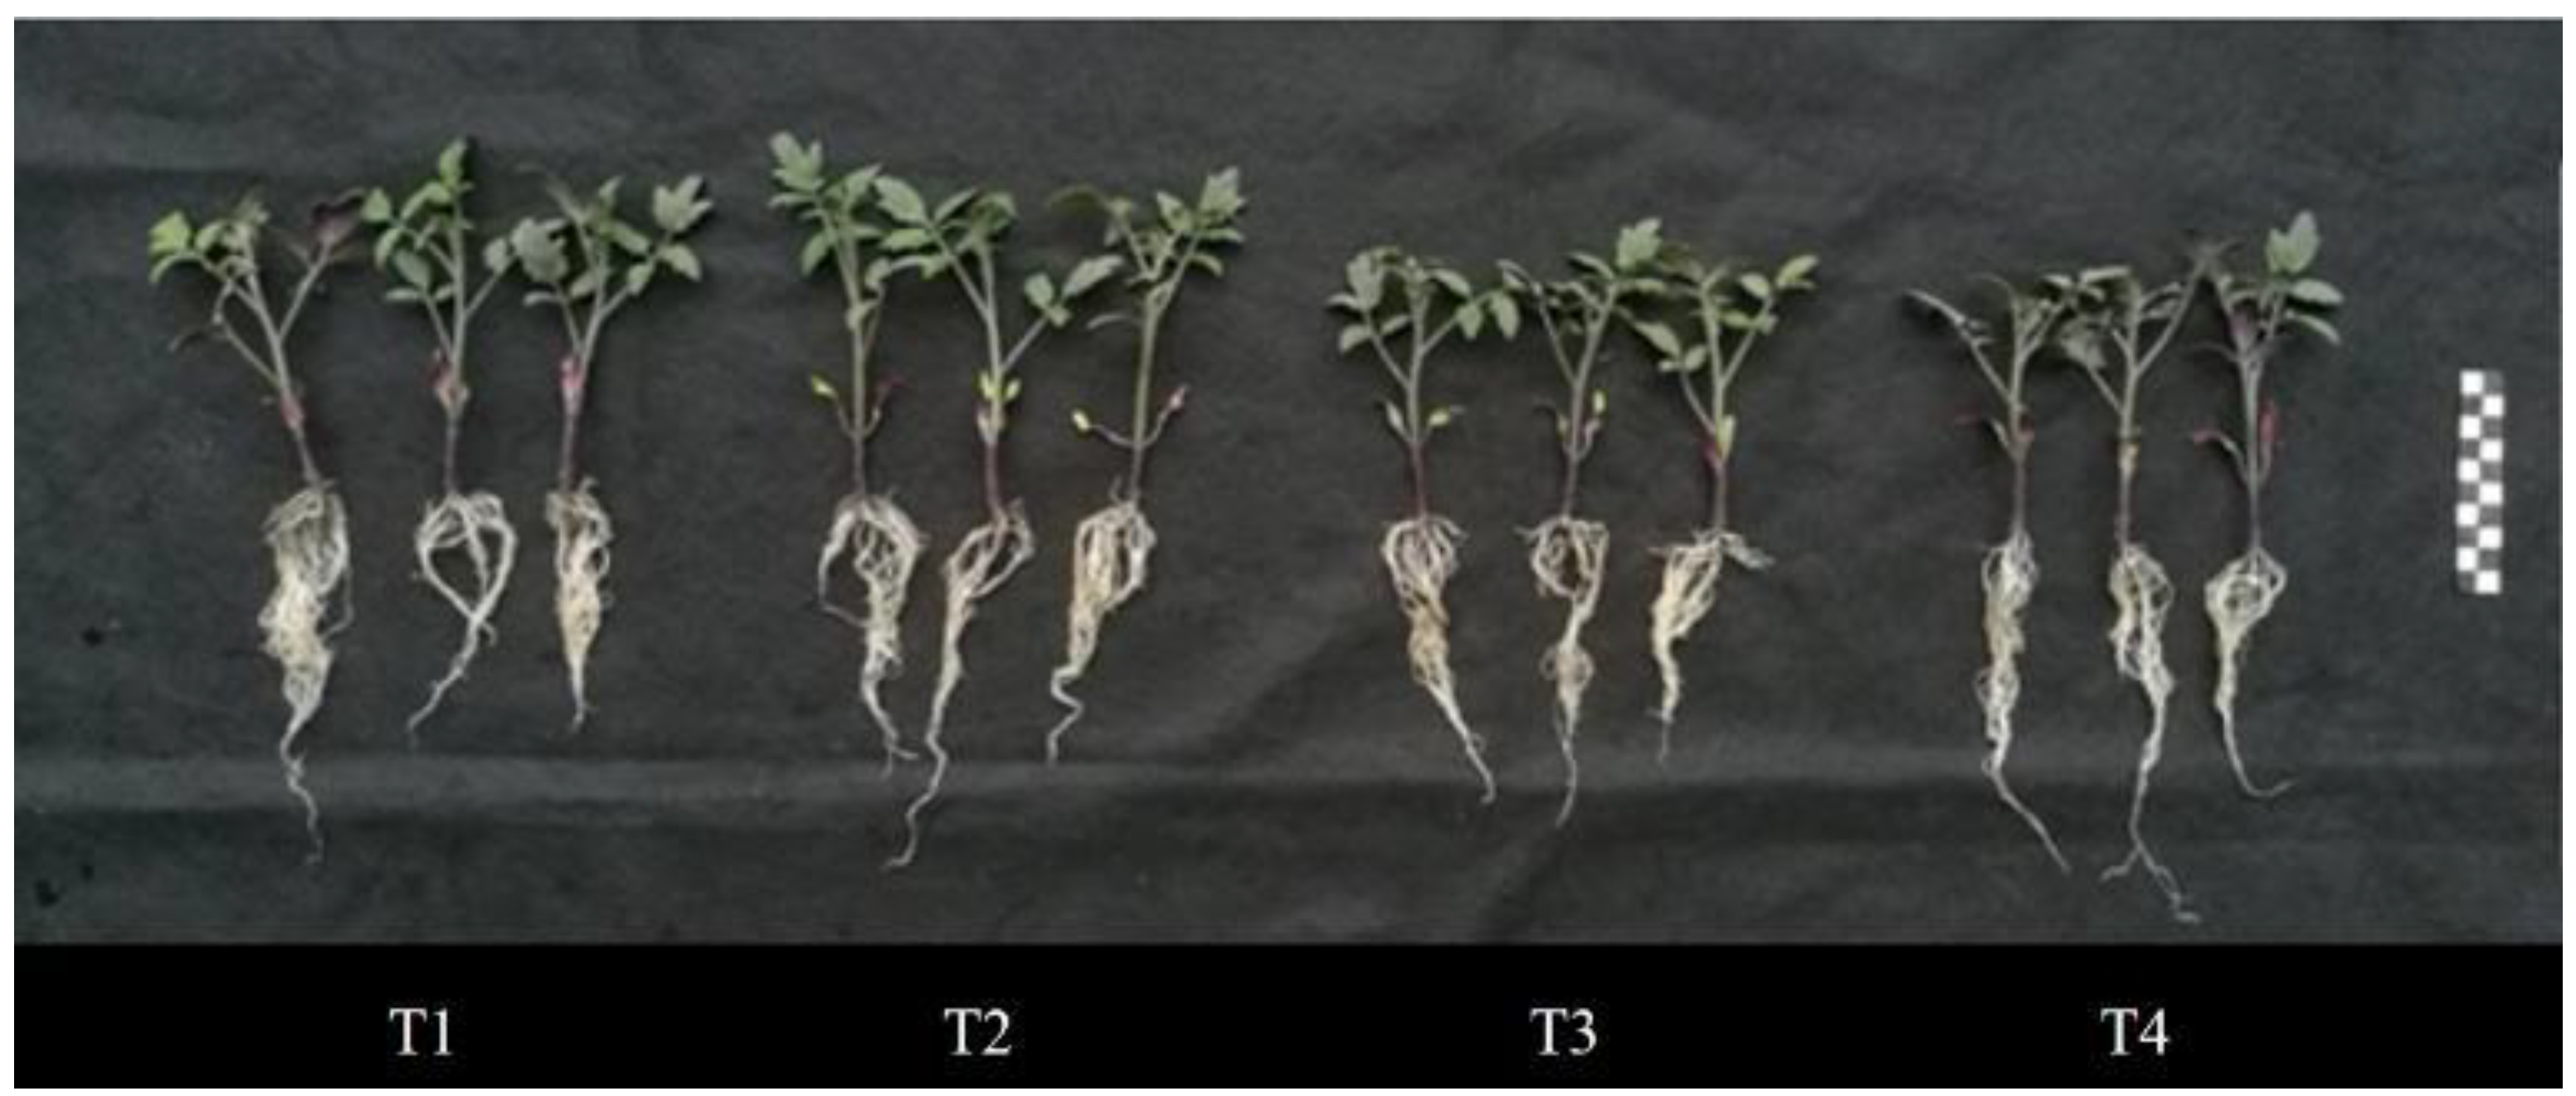
Under the same DLI, the highest plant height of tomato seedlings was found in T2, and there was no significant difference in stem diameter and leaf area among the four treatments (Table 5). The tomato seedlings in T1 and T2 had larger canopy widths, with well-developed foliage and denser root systems (Figure 8).
Table 5.
The effects of different light intensities and photoperiods on the plant height, stem diameter, and leaf area of tomato seedlings 1.
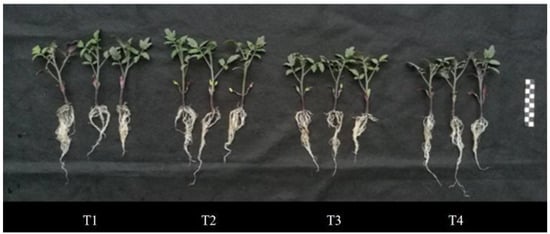
Figure 8.
Morphological characteristics of tomato seedlings under varying light intensities and photoperiods. The length and width of the square grid on the scale are both 1 cm.
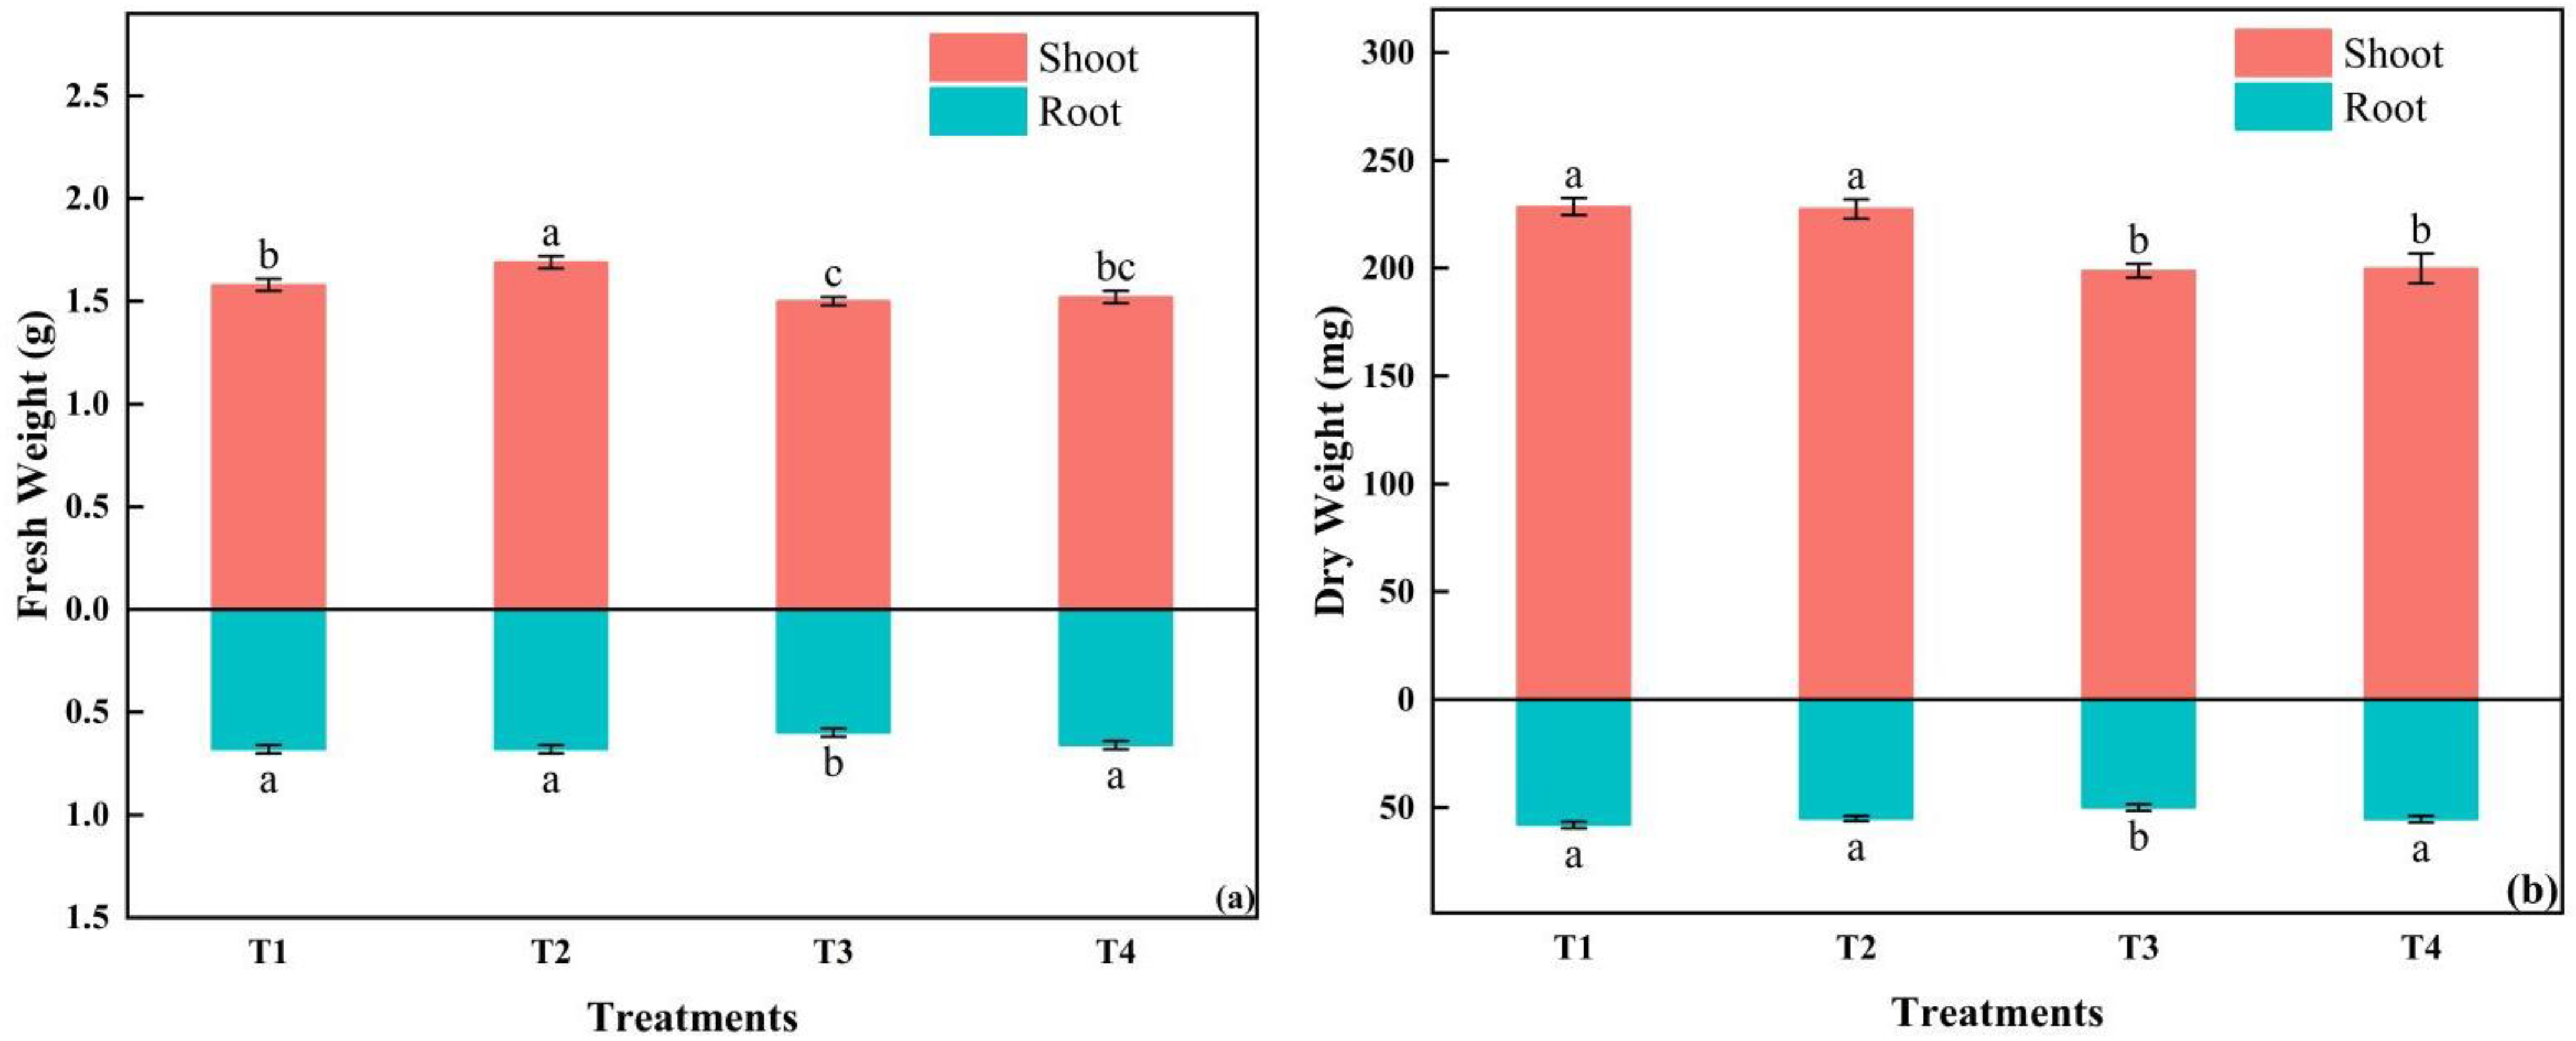
The shoot fresh weight of T2 was the largest, while the dry weight of both the shoot and root in T1 was the largest, with no significant difference from T2. The smallest fresh and dry weight was in T3 (Figure 9). The root-to-shoot ratio was the highest in T4, with significant differences from the other three treatments. The dry matter content of the shoot and the whole plant was the highest in T1. The specific leaf area tended to increase with the increasing light intensity and the shortening photoperiod (Table 6).
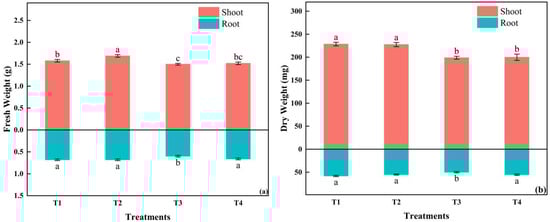
Figure 9.
The effects of different light intensities and photoperiods on shoot and root fresh weight; (a) shoot and root dry weight (b) of tomato seedlings. Different letters indicate statistically significant differences among treatments (p ≤ 0.05). Error bars show SEs (n = 18).
Table 6.
The effects of different DLIs on the seedling index, root-to-shoot ratio, dry matter rate, and SLA of tomato seedlings in Exp 3 1.
3.2.2. Physiological Characteristics and Related Enzyme Activities of Tomato Plug Seedlings
The highest soluble sugar content was in T3, with no difference from T1. The content of soluble protein gradually decreased with the increasing light intensity and the reducing photoperiods; those in T1 were 22.75% higher than in T4. The root vitality in T2 was 21.24%, 32.95%, and 29.64% higher than T1, T3, and T4, respectively (Figure 10a–c).
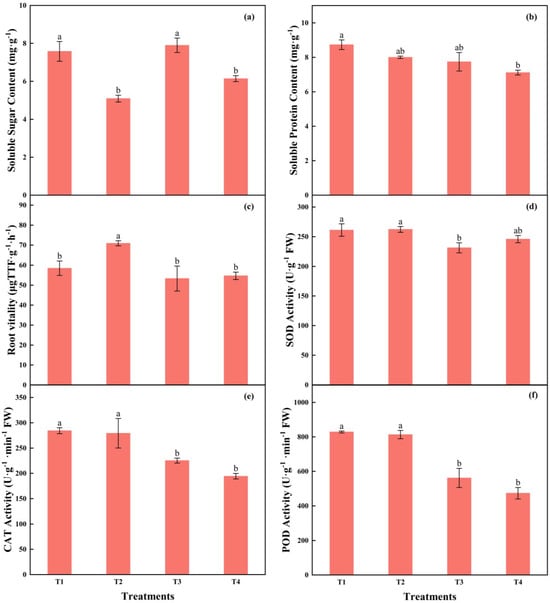
Figure 10.
The effects of different light intensities and photoperiods on soluble sugar content (a), soluble protein content (b), root vitality (c), activities of SOD (d), POD (e), and CAT (f) of tomato seedlings. Different letters indicate statistically significant differences among treatments (p < 0.05). Error bars show SEs (n = 18).
The SOD activity in T3 was significantly lower than that in T1 and T2. The activities of POD and CAT in T1 and T2 were significantly higher than those in T3 and T4, while there was no significant difference between T1 and T2, as well as T3 and T4, respectively. The POD activity in T1 was 47.47% and 75.06% higher than in that in T3 and T4, respectively, while the CAT activity was 26.22% and 46.29% higher, respectively (Figure 10d–f).
So, the soluble protein content gradually decreased with the increasing light intensity and the shortening photoperiods. The activity of antioxidant enzymes tended to decrease under the combination of higher light intensity and shorter photoperiods.
3.2.3. Photosynthesis Pigment Content and Chlorophyll Fluorescence of Tomato Plug Seedlings
As the light intensity increased and the photoperiod shortened, the chlorophyll content in tomato seedlings showed an upward trend, while the carotenoid content remained constant. The chlorophyll a/b ratio decreased (Table 7).
Table 7.
The effects of different light intensity and photoperiods on photosynthesis pigments content of tomato seedling 1.
The photochemical quenching index qP was the highest in T1, while there was no difference in qL among the four treatments. The non-photochemical quenching parameters, qN, NPQ, and Y(NPQ), showed the same trend; the lowest was in T1, and there were no differences among the other treatments. Y(NO) showed a downward trend with the increasing light intensity and the reduced photoperiod. The ΦPSII in T1 was the highest, 16.51%, 9.56%, and 17.16% higher than in T2, T3, and T4, respectively. There was no significant difference in Fv/Fm among the four treatments (Table 8).
Table 8.
The effects of different light intensities and photoperiods on chlorophyll fluorescence of tomato seedling 1.
4. Discussion
4.1. The Impact of DLI on Tomato Seedling Growth and Development
High-quality seedlings, characterized by robust stems, compact plant architecture, and well-developed root systems [64], showed greater biomass accumulation and a higher root-to-shoot ratio. In Exp 1, increasing DLI corresponded to a gradual increase in the stem diameter, leaf area, and fresh and dry weights of seedlings (Figure 3). In Exp 2, stem diameter, leaf area, and the fresh and dry weights of seedlings increased with increasing DLI, peaking at 13.1 mol·m−2·d−1. However, when DLI increased to 14.3 mol·m−2·d−1, most growth morphology indicators began to decline (Figure 4).
The DLI affected the morphology and biomass accumulation of seedlings during the early growth stage. Within a certain range, increasing DLI could promote plant growth, enhance the accumulation of dry matter, and increase stem diameter and leaf area, thereby improving the overall quality of the seedlings [29,65]. At a DLI of 14.4 mol·m−2·d−1, cucumber seedlings exhibit optimal growth and development, with the highest height of seedlings, stem diameter, total leaf area, and fresh and dry weights [66]. As DLI increased from 8.64 to 11.5 mol·m−2·d−1, the fresh weight and dry weight of lettuce increased by 42% and 41%, respectively; however, as DLI further increased to 14.4 mol·m−2·d−1 fresh weight, dry weight, and leaf area decreased [24]. With increasing DLI, the biomass and quality of tomato seedlings were effectively enhanced, and the increasing DLI could partially mitigate the negative effects of higher sowing density on tomato seedling quality; high-quality tomato seedlings could be cultivated at a density of 72 holes per tray under the optimal DLI of 12.96 mol·m−2·d−1 (with a light intensity of 300 µmol·m−2·d−1 and a light time of 12 h) [55].
To foster optimal vegetative growth during the crop seedling stage, it is generally necessary to promote root growth and increase the root-to-shoot ratio [67]. In this study, DLI did not have this effect on the root-to-shoot ratio and the total dry matter rate of tomato seedlings in Exp 1, but a positive correlation between these was observed in Exp 2. And, in Exp 2, the higher DLI might have some degree of light stress on the tomato seedling. When facing light stress, plants might adjust their biomass allocation to prioritize root growth, thereby enhancing their ability to absorb water and nutrients, and better cope with potential water stress or competition for nutrients [68,69]. Root vitality peaks at a DLI slightly lower than that for shoot growth, but at a DLI of 13.12 (the peak for shoot growth); although there is a certain decline in root vitality, it remains at a relatively high level. This suggests that tomato seedlings exhibit a certain degree of resilience in their response to DLI and can maintain a good growth state even under light conditions that are not optimal for root growth. The specific leaf area (SLA) indicated the leaf thickness, a smaller value signifying thicker leaves [70]. In this study, the leaf thickness of tomato seedlings increased with higher DLI.
Higher DLI treatments were observed to initiate flowering earlier, possibly by lowering the node position of the first flower truss. These effects might be mediated through phytochrome and cryptochrome signaling pathways, which are integral to the photoperception of light quality and intensity [71]. Phytochromes are the primary receptors for red and far-red light in plants. Members of the phytochrome family, such as phyA and phyB, can regulate the expression of flowering time genes [72]. Red and blue light in the environment are perceived by photoreceptors, which regulate the stability of the transcription factor CONSTANS (CO), thereby activating the production of FLOWERING LOCUS T (FT), and promoting flowering in plants [73]. Cryptochromes are blue light receptors that participate in regulating the flowering time of plants as well as a variety of other physiological processes, which can thereby regulate the expression of the FT [74,75]. Under high DLI, the increased intensity of red and blue light might enhance the activity of phytochromes and cryptochromes, thereby enhancing the expression of CO and FT, and promoting flowering of tomatoes. The total number of flowers also increased with higher DLI (Table 4). Thus, within an optimal range, increasing DLI promoted floral development in tomato seedlings.
In Exp 3, the plant height of tomato seedlings was maximized in the T2 treatment, whereas excessively long photoperiods and high light intensities both inhibited stem elongation. Under the same DLI conditions, variations in light intensity and photoperiod mainly influenced dry matter accumulation of annual bedding plants [76]. The shoot fresh weight of tomato seedlings was the greatest in the T2 treatment, while the fresh and dry weight of both shoot and root were the greatest in T1, with no significant difference from T2. These indicated that both the treatment conditions of 200 μmol·m−2·s−1 with an 18 h photoperiod and 230 μmol·m−2·s−1 with a 16 h photoperiod could improve biomass accumulation of tomato seedlings.
4.2. The Impact of DLI on the Physiological Indices of Tomato Seedlings
Soluble sugars are an important source of energy and cellular structural substrate in plants [77,78]. In this study, soluble sugar content in tomato seedlings increased with increasing DLI, and the enhanced carbon assimilation was beneficial for plant growth [79], while soluble protein content in tomato seedlings decreased with increasing DLI. At the DLI of 13.12 mol·m−2·d−1, tomato seedling biomass was at the maximum and declined at higher DLI. Root vitality affects plants’ ability to absorb water and nutrients, which then affects plant growth and development [80,81]. With increasing DLI, root vitality of tomato seedlings initially increased and then decreased, peaking at 11.5 mol·m−2·d−1, while root biomass peaked at 13.12 mol·m−2·d−1. This could be due to the fact that the efficiency of photosynthesis no longer increased under high light intensity, thereby affecting root vitality [55].
At a DLI of 13.12 mol·m−2·d−1 (Exp 3), the soluble sugar content in tomato seedlings reached its maximum in T1 and T3 treatments, which might reflect a photosynthetic capacity that is nearing saturation, suggesting that any further increase in DLI might not yield additional growth benefits; soluble protein content decreased with increasing light intensity and decreasing photoperiod duration (Figure 10). Under higher light intensity, plants might maximize the capture and conversion of light energy in photosynthesis, thereby affecting protein synthesis [82,83].
4.3. The Impact of DLI on the Related Enzyme Activities of Tomato Seedlings
SOD, POD, and CAT are important components of the plant membrane protection enzymes. SOD is the primary defense in plant antioxidant systems [84]. In Exp 1 and Exp 2, low DLI conditions resulted in relatively low activities of SOD and CAT, while POD activities were higher. These might indicate that under low DLI conditions, plants relied mainly on POD to remove H2O2 produced by photosynthesis [85]. As DLI increased, POD activities initially decreased and then increased, while CAT activities initially increased and then decreased, which demonstrated complementary roles under certain light-intensity stress conditions [86]. These enzymes work together to maintain cellular redox balance [87]. At a DLI of 13.1 mol·m−2·d−1, the activities of these three antioxidant enzymes were relatively higher, and tomato seedlings had good growth and enhanced resistance.
In Exp 3, these antioxidant enzymes had higher activities in T1 and T2 treatments, while lower activities were observed in T3 and T4. Thus, under the same DLI, lower light intensity and extended photoperiods could enhance the stress resistance of tomato seedlings.
4.4. The Impact of DLI on Photosynthetic Pigments and Chlorophyll Fluorescence of Tomato Seedlings
Chlorophyll absorbs red and blue light for photosynthesis [88]. In this study, chlorophyll contents in tomato leaves were negatively correlated with increased DLI [89]. At lower DLI, chlorophyll a content per unit of the leaf area of tomato seedlings increased to enhance light capture. Within the light-harvesting pigment-protein complex, chlorophyll b might increase relatively in low light intensities to optimize light absorption [90]. However, as DLI increased, the leaf area of tomato seedlings expanded, which might have reduced the demand for light-harvesting pigments and, thus, the chlorophyll content decreased [39,91]. The reduction in chlorophyll content enabled blue and red light to penetrate deeper into the leaf tissue, increasing the photosynthetic rate in the lower part of the leaves, which in turn increased the overall biomass [92,93].
The interactive effects of light intensity and photoperiod might also influence chlorophyll stability [94]. In Exp 3, under the same DLI, tomato seedlings in treatments with lower light intensity and extended light duration (T1 and T2) had higher photosynthetic pigment content, so low light intensity promoted the synthesis and accumulation of photosynthetic pigments in tomato seedlings.
The relationship between photosynthetic efficiency and plant growth is intricate and can be influenced by various factors [95]. An increase in photosynthetic efficiency, as indicated by ΦPSII, qP, and qL, is generally associated with improved plant growth; however, sometimes, plant growth still improves despite a decline in photosynthetic efficiency [96,97]. The photochemical quenching parameters (qP and qL) of tomato seedlings peaked at T1 in Exp 3, while the non-photochemical quenching parameters (qN and NPQ) were the lowest at T1. Thus, the photosynthetic activity of tomato seedlings was enhanced under a DLI of 13.1 mol·m−2·d−1, PPFD of 200 μmol·m−2·s−1, and an 18 h photoperiod. However, as light intensity increased, Y(NO) decreased, Y(NPQ) increased, the photoprotective capacity of tomato seedlings was enhanced, and, hence, prolonged light exposure might lead to some photodamage [98,99]. The highest ΦPSII of tomato seedlings in T1 was observed, and the suppression of ΦPSII with increasing light intensity was consistent with observations in lettuce and watermelon under similar DLI conditions [31,100]. The decrease in ΦPSII was accompanied by an increase in NPQ, which indicates that plants mitigate damage to PSII by dissipating excess excitation energy as heat under light-inhibited conditions.
The relationship between photosynthetic efficiency and growth is multifaceted and involves a complex interplay of light intensity, photoperiod, nutrient availability, hormonal signaling, and so on. A more comprehensive analysis of these factors is necessary to understand the observed growth patterns under varying light conditions.
5. Conclusions
This study assessed the impact of DLI, light intensity, and photoperiod on the growth and physiological characteristics of tomato seedlings under artificial light. Optimal DLI levels enhanced seedling growth and biomass accumulation, root vitality and antioxidant enzyme activity, and photosynthetic pigment synthesis. When the DLI was approximately 13.1 mol·m−2·d−1, light intensity was 200 μmol·m−2·s−1, and the photoperiod was 18 h, the photosynthetic efficiency, growth, and quality of tomato seedlings was the highest. These findings provide important guidance for optimizing the light environment in the cultivation of tomato seedlings in plant factories in South China, helping to improve the light energy utilization efficiency and production of seedlings.
Supplementary Materials
The following supporting information can be downloaded at: https://www.mdpi.com/article/10.3390/agronomy15010070/s1, Table S1: Regression equations and R2 values for the plant height, stem diameter, leaf area, shoot fresh weight, shoot dry weight, root fresh weight, root dry weight, soluble sugar content, soluble protein content, root vitality, SOD, POD, CAT, chlorophyll a, chlorophyll b, total chlorophyll and carotenoid for tomato seedlings of Experiment 1, where X is the daily light integral (DLI). Plots of each equation are shown in Figure 3a–c, Figure 4a–d, Figure 5a–d, Figure 6a–c and Figure 7; Table S2: Regression equations and R2 values for the plant height, stem diameter, leaf area, shoot fresh weight, shoot dry weight, root fresh weight, root dry weight, soluble sugar content, soluble protein content, root vitality, SOD, POD, CAT, chlorophyll a, chlorophyll b, total chlorophyll and carotenoid for tomato seedlings of Experiment 2, where X is the daily light integral (DLI). Plots of each equation are shown in 3d–f, 4e–h, 5e–h, 6d–f; Table S3: The effect of different DLI on Chlorophyll a/b of tomato seedling1.
Author Contributions
Conceptualization, Methodology, Validation, Formal analysis, Software, Data curation, Writing, original draft, M.Z.; Conceptualization, Methodology, Validation, J.C.; Methodology, Validation, Software, J.J.; Methodology, Supervision, Y.H. (Youzhi Hu), X.L. and R.H.; Writing, review and editing, J.S.; Conceptualization, Methodology, Supervision, Y.H. (Yanwu Huang); Conceptualization, Methodology, Resources, Supervision, Project administration, Funding acquisition, H.L. All authors have read and agreed to the published version of the manuscript.
Funding
This research was funded by Guangdong Seed Industry Revitalization Action Project (2023-NJS-00-011), National Key Research and Development Program of China (2017YFE0131000).
Data Availability Statement
All data supporting the findings of this study are available in the paper.
Conflicts of Interest
Author Yanwu Huang was employed by the company Hunan Xiangyan Seed Industry Co., Ltd. The remaining authors declare that the research was conducted in the absence of any commercial or financial relationships that could be construed as a potential conflict of interest.
References
- Mandriota, L.; Blanco, I.; Scarascia-Mugnozza, G. Plant Factory with Artificial Lighting: Innovation Technology for Sustainable Agriculture Production. In Proceedings of the AIIA 2022: Biosystems Engineering Towards the Green Deal; Ferro, V., Giordano, G., Orlando, S., Vallone, M., Cascone, G., Porto, S.M.C., Eds.; Springer International Publishing: Cham, Switzerland, 2023; pp. 1163–1172. [Google Scholar]
- Yan, W.; Zhang, Y.; Zhang, Y.; Cheng, R.; Zhang, Y.; Yang, Q.; Li, T. Effects of Supplementary Artificial Light on Growth of the Tomato (Solanum lycopersicum) in a Chinese Solar Greenhouse. Hortic. J. 2018, 87, 516–523. [Google Scholar] [CrossRef]
- Palmitessa, O.D.; Pantaleo, M.A.; Santamaria, P. Applications and Development of LEDs as Supplementary Lighting for Tomato at Different Latitudes. Agronomy 2021, 11, 835. [Google Scholar] [CrossRef]
- Dutta Gupta, S.; Agarwal, A. Artificial Lighting System for Plant Growth and Development: Chronological Advancement, Working Principles, and Comparative Assessment. In Light Emitting Diodes for Agriculture: Smart Lighting; Dutta Gupta, S., Ed.; Springer: Singapore, 2017; pp. 1–25. ISBN 978-981-10-5807-3. [Google Scholar]
- Jin, W.; Formiga Lopez, D.; Heuvelink, E.; Marcelis, L.F.M. Light Use Efficiency of Lettuce Cultivation in Vertical Farms Compared with Greenhouse and Field. Food Energy Secur. 2023, 12, e391. [Google Scholar] [CrossRef]
- Engler, N.; Krarti, M. Review of Energy Efficiency in Controlled Environment Agriculture. Renew. Sustain. Energy Rev. 2021, 141, 110786. [Google Scholar] [CrossRef]
- Gruda, N.; Bisbis, M.; Tanny, J. Influence of Climate Change on Protected Cultivation: Impacts and Sustainable Adaptation Strategies—A Review. J. Clean. Prod. 2019, 225, 481–495. [Google Scholar] [CrossRef]
- Gallegos-Cedillo, V.M. An In-Depth Analysis of Sustainable Practices in Vegetable Seedlings Nurseries: A Review. Sci. Hortic. 2024, 334, 113342. [Google Scholar] [CrossRef]
- Vatistas, C.; Avgoustaki, D.D.; Bartzanas, T. A Systematic Literature Review on Controlled-Environment Agriculture: How Vertical Farms and Greenhouses Can Influence the Sustainability and Footprint of Urban Microclimate with Local Food Production. Atmosphere 2022, 13, 1258. [Google Scholar] [CrossRef]
- Dsouza, A.; Newman, L.; Graham, T.; Fraser, E.D.G. Exploring the Landscape of Controlled Environment Agriculture Research: A Systematic Scoping Review of Trends and Topics. Agric. Syst. 2023, 209, 103673. [Google Scholar] [CrossRef]
- van Delden, S.H.; SharathKumar, M.; Butturini, M.; Graamans, L.J.A.; Heuvelink, E.; Kacira, M.; Kaiser, E.; Klamer, R.S.; Klerkx, L.; Kootstra, G.; et al. Current Status and Future Challenges in Implementing and Upscaling Vertical Farming Systems. Nat. Food 2021, 2, 944–956. [Google Scholar] [CrossRef] [PubMed]
- Warner, R.; Wu, B.-S.; MacPherson, S.; Lefsrud, M. How the Distribution of Photon Delivery Impacts Crops in Indoor Plant Environments: A Review. Sustainability 2023, 15, 4645. [Google Scholar] [CrossRef]
- Park, B.G.; Lee, J.H.; Shin, E.J.; Kim, E.A.; Nam, S.Y. Light Quality Influence on Growth Performance and Physiological Activity of Coleus Cultivars. Int. J. Plant Biol. 2024, 15, 807–826. [Google Scholar] [CrossRef]
- Kusuma, P.; Pattison, P.M.; Bugbee, B. From Physics to Fixtures to Food: Current and Potential LED Efficacy. Hortic. Res. 2020, 7, 56. [Google Scholar] [CrossRef]
- Ma, Y.; Xu, A.; Cheng, Z.-M. Effects of Light Emitting Diode Lights on Plant Growth, Development and Traits a Meta-Analysis. Hortic. Plant J. 2021, 7, 552–564. [Google Scholar] [CrossRef]
- Shin, E.J.; Lee, J.H.; Nam, S.Y. Changes in Growth, Visual Qualities, and Photosynthetic Parameters in Peperomia Species and Cultivars Under Different Color Temperatures of White Lighting Conditions. J. Agric. Life Environ. Sci. 2023, 35, 307–321. [Google Scholar] [CrossRef]
- Faust, J.E.; Logan, J. Daily Light Integral: A Research Review and High-Resolution Maps of the United States. HortScience 2018, 53, 1250–1257. [Google Scholar] [CrossRef]
- Torres, A.P.; Lopez, R.; Horticulture, P.; Architecture, L. Measuring Daily Light Integral in a Greenhouse. Available online: https://www.extension.purdue.edu/extmedia/HO/HO-238-W.pdf (accessed on 26 December 2024).
- Pramuk, L.A.; Runkle, E.S. Photosynthetic Daily Light Integral During the Seedling Stage Influences Subsequent Growth and Flowering of Celosia, Impatiens, Salvia, Tagetes, and Viola. HortScience 2005, 40, 1336–1339. [Google Scholar] [CrossRef]
- Lim, S.H.; Im, N.H.; An, S.K.; Lee, H.B.; Kim, K.S. Daily Light Integral Affects Photosynthesis, Growth, and Flowering of Korean Native Veronica rotunda and V. longifolia. Hortic. Environ. Biotechnol. 2022, 63, 13–22. [Google Scholar] [CrossRef]
- Whitman, C.; Padhye, S.; Runkle, E.S. A High Daily Light Integral Can Influence Photoperiodic Flowering Responses in Long Day Herbaceous Ornamentals. Sci. Hortic. 2022, 295, 110897. [Google Scholar] [CrossRef]
- Lee, H.B.; Lee, J.H.; An, S.K.; Park, J.H.; Kim, K.S. Growth Characteristics and Flowering Initiation of Phalaenopsis Queen Beer ‘Mantefon’ as Affected by the Daily Light Integral. Hortic. Environ. Biotechnol. 2019, 60, 637–645. [Google Scholar] [CrossRef]
- Kelly, N.; Choe, D.; Meng, Q.; Runkle, E.S. Promotion of Lettuce Growth under an Increasing Daily Light Integral Depends on the Combination of the Photosynthetic Photon Flux Density and Photoperiod. Sci. Hortic. 2020, 272, 109565. [Google Scholar] [CrossRef]
- Gavhane, K.P.; Hasan, M.; Singh, D.K.; Kumar, S.N.; Sahoo, R.N.; Alam, W. Determination of Optimal Daily Light Integral (DLI) for Indoor Cultivation of Iceberg Lettuce in an Indigenous Vertical Hydroponic System. Sci. Rep. 2023, 13, 10923. [Google Scholar] [CrossRef] [PubMed]
- Meng, Q.; Severin, S.N. The Alternating Light Pattern and Daily Light Integral Interactively Determine Crop-Specific Growth Responses Indoors. In Proceedings of the 2023 Annual Conference, Orlando, FL, USA, 31 July–4 August 2023; ASHS: Alexandria, VA, USA, 2023. [Google Scholar]
- Dou, H.; Niu, G.; Gu, M.; Masabni, J.G. Responses of Sweet Basil to Different Daily Light Integrals in Photosynthesis, Morphology, Yield, and Nutritional Quality. HortScience 2018, 53, 496–503. [Google Scholar] [CrossRef]
- Huber, B.M.; Louws, F.J.; Hernández, R. Impact of Different Daily Light Integrals and Carbon Dioxide Concentrations on the Growth, Morphology, and Production Efficiency of Tomato Seedlings. Front. Plant Sci. 2021, 12, 615853. [Google Scholar] [CrossRef]
- Song, J.; Fan, Y.; Li, X.; Li, Y.; Mao, H.; Zuo, Z.; Zou, Z. Effects of Daily Light Integral on Tomato (Solanum lycopersicon L.) Grafting and Quality in a Controlled Environment. Int. J. Agric. Biol. Eng. 2022, 15, 44–50. [Google Scholar] [CrossRef]
- Cui, J.; Song, S.; Yu, J.; Liu, H. Effect of Daily Light Integral on Cucumber Plug Seedlings in Artificial Light Plant Factory. Horticulturae 2021, 7, 139. [Google Scholar] [CrossRef]
- Mao, H.; Hang, T.; Zhang, X.; Lu, N. Both Multi-Segment Light Intensity and Extended Photoperiod Lighting Strategies, with the Same Daily Light Integral, Promoted Lactuca sativa L. Growth and Photosynthesis. Agronomy 2019, 9, 857. [Google Scholar] [CrossRef]
- Palmer, S.; van Iersel, M.W. Increasing Growth of Lettuce and Mizuna under Sole-Source LED Lighting Using Longer Photoperiods with the Same Daily Light Integral. Agronomy 2020, 10, 1659. [Google Scholar] [CrossRef]
- Kang, Y.; Wu, Q.; Pan, G.; Yang, H.; Li, J.; Yang, X.; Zhong, M. High Daily Light Integral Positively Regulate Photosynthetic Capacity Through Mediating Nitrogen Partitioning and Leaf Anatomical Characteristic in Flowering Chinese Cabbage. Sci. Hortic. 2024, 326, 112715. [Google Scholar] [CrossRef]
- Cruz, S.; Gómez, C. Effects of Daily Light Integral on Compact Tomato Plants Grown for Indoor Gardening. Agronomy 2022, 12, 1704. [Google Scholar] [CrossRef]
- Slattery, R.A.; Ort, D.R. Photosynthesis|Photosynthetic Efficiency Improvement. In Encyclopedia of Biological Chemistry III, 3rd ed.; Jez, J., Ed.; Elsevier: Oxford, UK, 2021; pp. 256–267. ISBN 978-0-12-822040-5. [Google Scholar]
- Wu, A.; Hammer, G.L.; Doherty, A.; von Caemmerer, S.; Farquhar, G.D. Quantifying Impacts of Enhancing Photosynthesis on Crop Yield. Nat. Plants 2019, 5, 380–388. [Google Scholar] [CrossRef]
- Poorter, H.; Niinemets, Ü.; Ntagkas, N.; Siebenkäs, A.; Mäenpää, M.; Matsubara, S.; Pons, T.L. A Meta-Analysis of Plant Responses to Light Intensity for 70 Traits Ranging from Molecules to Whole Plant Performance. New Phytol. 2019, 223, 1073–1105. [Google Scholar] [CrossRef]
- Shomali, A.; Lastochkina, O.V.; Mohammadian, M.; Rastogi, A.; Bosacchi, M.; Li, T.; Aliniaeifard, S. Photoinhibition in Horticultural Crops: An Overview of the Effect of Light Quality and Signaling in the Underlying Photoprotection Mechanisms. Int. J. Hortic. Sci. Technol. 2023, 10, 39–50. [Google Scholar] [CrossRef]
- Xu, D.-Q.; Shen, Y.-K. Light Stress: Photoinhibition of Photosynthesis in Plants Under Natural Conditions; Pessarakli, M., Ed.; CRC Press: Boca Raton, FL, USA, 1999; Volume 19990540, pp. 483–497. [Google Scholar]
- Zheng, Y.; Zou, J.; Lin, S.; Jin, C.; Shi, M.; Yang, B.; Yang, Y.; Jin, D.; Li, R.; Li, Y. Effects of Different Light Intensity on the Growth of Tomato Seedlings in a Plant Factory. PLoS ONE 2023, 18, e0294876. [Google Scholar] [CrossRef] [PubMed]
- Trivellini, A.; Toscano, S.; Romano, D.; Ferrante, A. The Role of Blue and Red Light in the Orchestration of Secondary Metabolites, Nutrient Transport and Plant Quality. Plants 2023, 12, 2026. [Google Scholar] [CrossRef]
- He, W.; Chai, Q.; Zhao, C.; Yin, W.; Fan, H.; Yu, A.; Fan, Z.; Hu, F.; Sun, Y.; Wang, F. Response of Blue Light in Different Proportions on the Growth & Flowering in Sunflower. Sci. Hortic. 2024, 338, 113689. [Google Scholar] [CrossRef]
- Li, Y.; Xin, G.; Liu, C.; Shi, Q.; Yang, F.; Wei, M. Effects of Red and Blue Light on Leaf Anatomy, CO2 Assimilation and the Photosynthetic Electron Transport Capacity of Sweet Pepper (Capsicum annuum L.) Seedlings. BMC Plant Biol. 2020, 20, 318. [Google Scholar] [CrossRef]
- Gao, W.; He, D.; Ji, F.; Zhang, S.; Zheng, J. Effects of Daily Light Integral and LED Spectrum on Growth and Nutritional Quality of Hydroponic Spinach. Agronomy 2020, 10, 1082. [Google Scholar] [CrossRef]
- Wang, Y.; Folta, K.M. Contributions of Green Light to Plant Growth and Development. Am. J. Bot. 2013, 100, 70–78. [Google Scholar] [CrossRef] [PubMed]
- Chen, Y.; Bian, Z.; Marcelis, L.F.M.; Heuvelink, E.; Yang, Q.; Kaiser, E. Green Light Is Similarly Effective in Promoting Plant Biomass as Red/Blue Light: A Meta-Analysis. J. Exp. Bot. 2024, 75, 5655–5666. [Google Scholar] [CrossRef]
- Kaiser, E.; Weerheim, K.; Schipper, R.; Dieleman, J.A. Partial Replacement of Red and Blue by Green Light Increases Biomass and Yield in Tomato. Sci. Hortic. 2019, 249, 271–279. [Google Scholar] [CrossRef]
- Bian, Z.; Wang, Y.; Zhang, X.; Grundy, S.; Hardy, K.; Yang, Q.; Lu, C. A Transcriptome Analysis Revealing the New Insight of Green Light on Tomato Plant Growth and Drought Stress Tolerance. Front. Plant Sci. 2021, 12, 649283. [Google Scholar] [CrossRef] [PubMed]
- Zhang, M.; Ju, J.; Hu, Y.; He, R.; Song, J.; Liu, H. Meta-Analysis of the Impact of Far-Red Light on Vegetable Crop Growth and Quality. Plants 2024, 13, 2508. [Google Scholar] [CrossRef]
- Ma, L.; Upadhyaya, M.K. Effects of Red/Far-Red Light Ratio on Common Lamb’s-Quarters, Redroot Pigweed, and Tomato Plants. Can. J. Plant Sci. 2016, 97, 494–500. [Google Scholar] [CrossRef]
- Meijer, D.; van Doesburg, F.; Jungerling, L.; Weldegergis, B.T.; Kappers, I.F.; Van Oystaeyen, A.; Loon, J.J.A.V.; Dicke, M. Supplemental Far-Red Light Influences Flowering Traits and Interactions with a Pollinator in Tomato Crops. Environ. Exp. Bot. 2023, 213, 105438. [Google Scholar] [CrossRef]
- Kong, J.; Zhao, Y.; Fan, P.; Wang, Y.; Xu, X.; Wang, L.; Li, S.; Duan, W.; Liang, Z.; Dai, Z. Far-Red Light Modulates Grapevine Growth by Increasing Leaf Photosynthesis Efficiency and Triggering Organ-Specific Transcriptome Remodelling. BMC Plant Biol. 2024, 24, 189. [Google Scholar] [CrossRef]
- He, R.; Zhang, Y.; Song, S.; Su, W.; Hao, Y.; Liu, H. UV-A and FR Irradiation Improves Growth and Nutritional Properties of Lettuce Grown in an Artificial Light Plant Factory. Food Chem. 2021, 345, 128727. [Google Scholar] [CrossRef] [PubMed]
- Vanhaelewyn, L.; Van Der Straeten, D.; De Coninck, B.; Vandenbussche, F. Ultraviolet Radiation From a Plant Perspective: The Plant-Microorganism Context. Front. Plant Sci. 2020, 11, 597642. [Google Scholar] [CrossRef] [PubMed]
- Kang, S.; Zhang, Y.; Zhang, Y.; Zou, J.; Yang, Q.; Li, T. Ultraviolet-A Radiation Stimulates Growth of Indoor Cultivated Tomato (Solanum Lycopersicum) Seedlings. HortScience 2018, 53, 1429–1433. [Google Scholar] [CrossRef]
- Xu, X.; Yang, F.; Song, J.; Zhang, R.; Cai, W. Does the Daily Light Integral Influence the Sowing Density of Tomato Plug Seedlings in a Controlled Environment? Horticulturae 2024, 10, 730. [Google Scholar] [CrossRef]
- Bai, Y.; Shi, W.-H.; Xing, X.-J.; Wang, Y.; Jin, Y.-R.; Zhang, L.; Song, Y.-F.; Dong, L.-H.; Liu, H.-B. Study on Tobacco Vigorous Seedling Indexes Model. Sci. Agric. Sin. 2014, 47, 1086–1098. [Google Scholar] [CrossRef]
- Currey, C.J.; Lopez, R.G. Biomass Accumulation and Allocation, Photosynthesis, and Carbohydrate Status of New Guinea Impatiens, Geranium, and Petunia Cuttings Are Affected by Photosynthetic Daily Light Integral during Root Development. J. Am. Soc. Hortic. Sci. 2015, 140, 542–549. [Google Scholar] [CrossRef]
- Faust, J.E.; Holcombe, V.; Rajapakse, N.C.; Layne, D.R. The Effect of Daily Light Integral on Bedding Plant Growth and Flowering. HortScience 2005, 40, 645–649. [Google Scholar] [CrossRef]
- Lichtenthaler, H.K.; Wellburn, A.R. Determinations of Total Carotenoids and Chlorophylls a and b of Leaf Extracts in Different Solvents. Biochem. Soc. Trans. 1983, 11, 591–592. [Google Scholar] [CrossRef]
- Li, H.; Sun, Q.; Zhao, S.; Zhang, W. Principles and Techniques of Plant Physiological Biochemical Experiment; Higher Education: Beijing, China, 2000; pp. 195–197. [Google Scholar]
- Flohé, L.; Ötting, F. Superoxide Dismutase Assays. In Methods in Enzymology; Oxygen Radicals in Biological Systems; Academic Press: Cambridge, MA, USA, 1984; Volume 105, pp. 93–104. [Google Scholar]
- Amako, K.; Chen, G.-X.; Asada, K. Separate Assays Specific for Ascorbate Peroxidase and Guaiacol Peroxidase and for the Chloroplastic and Cytosolic Isozymes of Ascorbate Peroxidase in Plants. Plant Cell Physiol. 1994, 35, 497–504. [Google Scholar]
- Patra, H.K.; Kar, M.; Mishra, D. Catalase Activity in Leaves and Cotyledons During Plant Development and Senescence. Biochem. Physiol. Pflanz. 1978, 172, 385–390. [Google Scholar] [CrossRef]
- Randall, W.C.; Lopez, R.G. Comparison of Supplemental Lighting from High-Pressure Sodium Lamps and Light-Emitting Diodes during Bedding Plant Seedling Production. HortScience 2014, 49, 589–595. [Google Scholar] [CrossRef]
- Currey, C.J.; Hutchinson, V.A.; Lopez, R.G. Growth, Morphology, and Quality of Rooted Cuttings of Several Herbaceous Annual Bedding Plants Are Influenced by Photosynthetic Daily Light Integral During Root Development. HortScience 2012, 47, 25–30. [Google Scholar] [CrossRef]
- Ji, F.; Wei, S.; Liu, N.; Xu, L.; Yang, P. Growth of Cucumber Seedlings in Different Varieties as Affected by Light Environment. Int. J. Agric. Biol. Eng. 2020, 13, 73–78. [Google Scholar] [CrossRef]
- Wang, J.L.; Evers, J.B.; Anten, N.P.R.; Li, Y.; Yang, X.; Douma, J.C.; Schneider, H.M. Far-Red Light Perception by the Shoot Influences Root Growth and Development in Cereal-Legume Crop Mixtures. Plant Soil 2024, 1–18. [Google Scholar] [CrossRef]
- Kou, X.; Han, W.; Kang, J. Responses of Root System Architecture to Water Stress at Multiple Levels: A Meta-Analysis of Trials under Controlled Conditions. Front. Plant Sci. 2022, 13, 1085409. [Google Scholar] [CrossRef] [PubMed]
- Teng, Z.; Lyu, J.; Chen, Y.; Zhang, J.; Ye, N. Effects of Stress-Induced ABA on Root Architecture Development: Positive and Negative Actions. Crop J. 2023, 11, 1072–1079. [Google Scholar] [CrossRef]
- Liu, C.; Li, Y.; Xu, L.; Chen, Z.; He, N. Variation in Leaf Morphological, Stomatal, and Anatomical Traits and Their Relationships in Temperate and Subtropical Forests. Sci. Rep. 2019, 9, 5803. [Google Scholar] [CrossRef]
- Casal, J.J. Phytochromes, Cryptochromes, Phototropin: Photoreceptor Interactions in Plants. Photochem. Photobiol. 2000, 71, 1–11. [Google Scholar] [CrossRef] [PubMed]
- Takagi, H.; Hempton, A.K.; Imaizumi, T. Photoperiodic Flowering in Arabidopsis: Multilayered Regulatory Mechanisms of CONSTANS and the Florigen FLOWERING LOCUS T. Plant Comm. 2023, 4, 100552. [Google Scholar] [CrossRef] [PubMed]
- Wang, Q.; Liu, W.; Leung, C.C.; Tarté, D.A.; Gendron, J.M. Plants Distinguish Different Photoperiods to Independently Control Seasonal Flowering and Growth. Science 2024, 383, eadg9196. [Google Scholar] [CrossRef]
- Wang, Q.; Lin, C. Mechanisms of Cryptochrome-Mediated Photoresponses in Plants. Annu. Rev. Plant Biol. 2020, 71, 103–129. [Google Scholar] [CrossRef]
- Cerdán, P.D.; Chory, J. Regulation of Flowering Time by Light Quality. Nature 2003, 423, 881–885. [Google Scholar] [CrossRef] [PubMed]
- Vaid, T.M. Improving the Scheduling and Profitability of Annual Bedding Plant Production by Manipulating Temperature, Daily Light Integral, Photoperiod, and Transplant Size. Master’s Thesis, Michigan State University, East Lansing, MI, USA, 2012. ISBN 1-267-58936-1. [Google Scholar]
- Chen, L.-Q.; Cheung, L.S.; Feng, L.; Tanner, W.; Frommer, W.B. Transport of Sugars. Annu. Rev. Biochem. 2015, 84, 865–894. [Google Scholar] [CrossRef] [PubMed]
- Sami, F.; Yusuf, M.; Faizan, M.; Faraz, A.; Hayat, S. Role of Sugars under Abiotic Stress. Plant Physiol. Biochem. 2016, 109, 54–61. [Google Scholar] [CrossRef] [PubMed]
- Eghbal, E.; Aliniaeifard, S.; Mehrjerdi, M.Z.; Abdi, S.; Hassani, S.B.; Rassaie, T.; Gruda, N.S. Growth, Phytochemical, and Phytohormonal Responses of Basil to Different Light Durations and Intensities under Constant Daily Light Integral. BMC Plant Biol. 2024, 24, 935. [Google Scholar] [CrossRef] [PubMed]
- Niu, W.-Q.; Jia, Z.-X.; Zhang, X.; Shao, H.-B. Effects of Soil Rhizosphere Aeration on the Root Growth and Water Absorption of Tomato. CLEAN Soil Air Water 2012, 40, 1364–1371. [Google Scholar] [CrossRef]
- Shahriari, Y. Plant Drought Stress: Fromimpact of Drought Stress on Plant Morphological, Biochemical and Physiological Features to Role of Nutrients in Drought Stress Alleviation. NVEO Nat. Volatiles Essent. Oils J. NVEO 2021, 8, 5344–5369. [Google Scholar]
- Didaran, F.; Kordrostami, M.; Ghasemi-Soloklui, A.A.; Pashkovskiy, P.; Kreslavski, V.; Kuznetsov, V.; Allakhverdiev, S.I. The Mechanisms of Photoinhibition and Repair in Plants under High Light Conditions and Interplay with Abiotic Stressors. J. Photochem. Photobiol. B Biol. 2024, 259, 113004. [Google Scholar] [CrossRef] [PubMed]
- Fayezizadeh, M.R.; Ansari, N.A.; Sourestani, M.M.; Hasanuzzaman, M. Variations in Photoperiods and Their Impact on Yield, Photosynthesis and Secondary Metabolite Production in Basil Microgreens. BMC Plant Biol. 2024, 24, 712. [Google Scholar] [CrossRef] [PubMed]
- Ighodaro, O.M.; Akinloye, O.A. First Line Defence Antioxidants-Superoxide Dismutase (SOD), Catalase (CAT) and Glutathione Peroxidase (GPX): Their Fundamental Role in the Entire Antioxidant Defence Grid. Alex. J. Med. 2018, 54, 287–293. [Google Scholar] [CrossRef]
- Ali, M.B.; Hahn, E.-J.; Paek, K.-Y. Effects of Light Intensities on Antioxidant Enzymes and Malondialdehyde Content during Short-Term Acclimatization on Micropropagated Phalaenopsis Plantlet. Environ. Exp. Bot. 2005, 54, 109–120. [Google Scholar] [CrossRef]
- Wang, X.; Liu, H.; Yu, F.; Hu, B.; Jia, Y.; Sha, H.; Zhao, H. Differential Activity of the Antioxidant Defence System and Alterations in the Accumulation of Osmolyte and Reactive Oxygen Species Under Drought Stress and Recovery in Rice (Oryza sativa L.) Tillering. Sci. Rep. 2019, 9, 8543. [Google Scholar] [CrossRef] [PubMed]
- Murphy, M.P.; Bayir, H.; Belousov, V.; Chang, C.J.; Davies, K.J.A.; Davies, M.J.; Dick, T.P.; Finkel, T.; Forman, H.J.; Janssen-Heininger, Y.; et al. Guidelines for Measuring Reactive Oxygen Species and Oxidative Damage in Cells and In Vivo. Nat. Metab. 2022, 4, 651–662. [Google Scholar] [CrossRef]
- Björn, L.O.; Papageorgiou, G.C.; Blankenship, R.E.; Govindjee, R.E. A Viewpoint: Why Chlorophyll a? Photosynth. Res. 2009, 99, 85–98. [Google Scholar] [CrossRef]
- Song, J.; Chen, Z.; Zhang, A.; Wang, M.; Jahan, M.S.; Wen, Y.; Liu, X. The Positive Effects of Increased Light Intensity on Growth and Photosynthetic Performance of Tomato Seedlings in Relation to Night Temperature Level. Agronomy 2022, 12, 343. [Google Scholar] [CrossRef]
- Kume, A.; Akitsu, T.; Nasahara, K.N. Why Is Chlorophyll b Only Used in Light-Harvesting Systems? J. Plant Res. 2018, 131, 961–972. [Google Scholar] [CrossRef]
- Fan, X.-X.; Xu, Z.-G.; Liu, X.-Y.; Tang, C.-M.; Wang, L.-W.; Han, X. Effects of Light Intensity on the Growth and Leaf Development of Young Tomato Plants Grown under a Combination of Red and Blue Light. Sci. Hortic. 2013, 153, 50–55. [Google Scholar] [CrossRef]
- Leister, D. Enhancing the Light Reactions of Photosynthesis: Strategies, Controversies, and Perspectives. Mol. Plant 2023, 16, 4–22. [Google Scholar] [CrossRef]
- Slattery, R.A.; Ort, D.R. Perspectives on Improving Light Distribution and Light Use Efficiency in Crop Canopies. Plant Physiol. 2021, 185, 34–48. [Google Scholar] [CrossRef] [PubMed]
- Liu, K.; Gao, M.; Jiang, H.; Ou, S.; Li, X.; He, R.; Li, Y.; Liu, H. Light Intensity and Photoperiod Affect Growth and Nutritional Quality of Brassica Microgreens. Molecules 2022, 27, 883. [Google Scholar] [CrossRef] [PubMed]
- Éva, C.; Oszvald, M.; Tamás, L. Current and Possible Approaches for Improving Photosynthetic Efficiency. Plant Sci. 2019, 280, 433–440. [Google Scholar] [CrossRef] [PubMed]
- Xu, J.; Guo, Z.; Jiang, X.; Ahammed, G.J.; Zhou, Y. Light Regulation of Horticultural Crop Nutrient Uptake and Utilization. Hortic. Plant J. 2021, 7, 367–379. [Google Scholar] [CrossRef]
- Lacour, T.; Robert, E.; Lavaud, J. Sustained Xanthophyll Pigments-Related Photoprotective NPQ Is Involved in Photoinhibition in the Haptophyte Tisochrysis Lutea. Sci. Rep. 2023, 13, 14694. [Google Scholar] [CrossRef] [PubMed]
- Kasahara, M.; Kagawa, T.; Oikawa, K.; Suetsugu, N.; Miyao, M.; Wada, M. Chloroplast Avoidance Movement Reduces Photodamage in Plants. Nature 2002, 420, 829–832. [Google Scholar] [CrossRef] [PubMed]
- Barbato, R.; Tadini, L.; Cannata, R.; Peracchio, C.; Jeran, N.; Alboresi, A.; Morosinotto, T.; Bajwa, A.A.; Paakkarinen, V.; Suorsa, M.; et al. Higher Order Photoprotection Mutants Reveal the Importance of ΔpH-Dependent Photosynthesis-Control in Preventing Light Induced Damage to Both Photosystem II and Photosystem I. Sci. Rep. 2020, 10, 6770. [Google Scholar] [CrossRef] [PubMed]
- Elkins, C.; van Iersel, M.W. Longer Photoperiods with the Same Daily Light Integral Increase Daily Electron Transport Through Photosystem II in Lettuce. Plants 2020, 9, 1172. [Google Scholar] [CrossRef] [PubMed]

Disclaimer/Publisher’s Note: The statements, opinions and data contained in all publications are solely those of the individual author(s) and contributor(s) and not of MDPI and/or the editor(s). MDPI and/or the editor(s) disclaim responsibility for any injury to people or property resulting from any ideas, methods, instructions or products referred to in the content. |
© 2024 by the authors. Licensee MDPI, Basel, Switzerland. This article is an open access article distributed under the terms and conditions of the Creative Commons Attribution (CC BY) license (https://creativecommons.org/licenses/by/4.0/).