Article

Assessing Key Factors Affecting Water Use in Winter Wheat in Slovakia Using Earth Observation Data and Random Forest-Based Model

1
Earth Science Institute of Slovak Academy of Science, 84005 Bratislava, Slovakia
2
Africa Rice Center (AfricaRice), Bouaké 01, Côte d’Ivoire
3
Institut de l’Environnement et de Recherches Agricoles, Guisga Street, P.O. Box 8645, Ouagadougou 04, Burkina Faso
*
Author to whom correspondence should be addressed.
Agronomy 2025, 15(11), 2462; https://doi.org/10.3390/agronomy15112462 (registering DOI)
Submission received: 13 September 2025 / Revised: 19 October 2025 / Accepted: 22 October 2025 / Published: 23 October 2025
(This article belongs to the Section Water Use and Irrigation)

Abstract

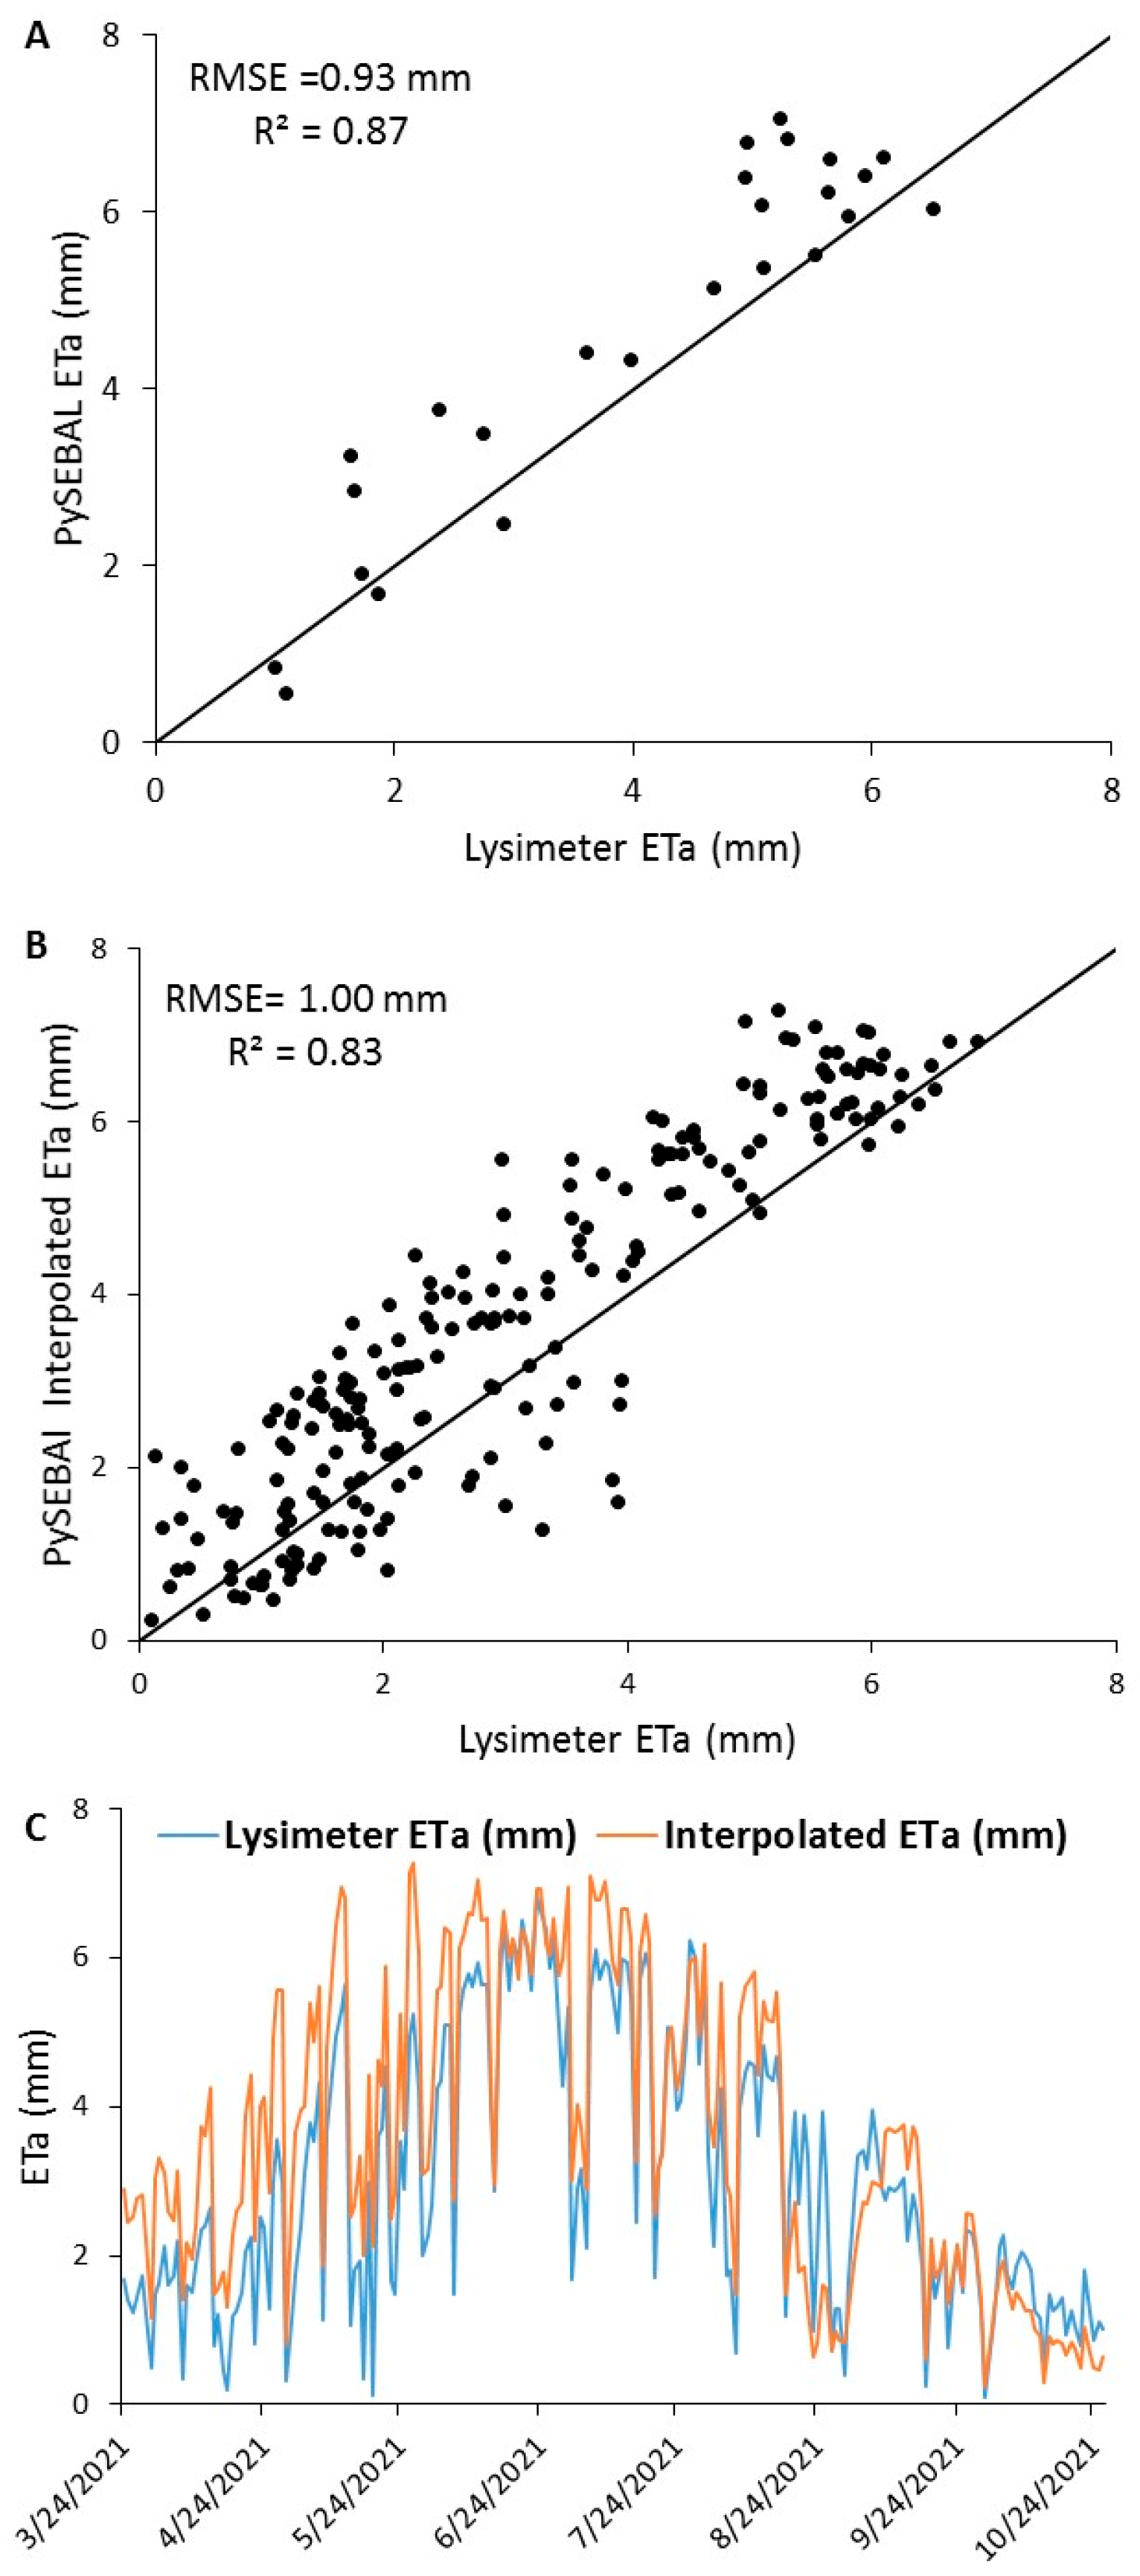
Identifying the primary soil parameters, weather variables and crop management practices that influence spatial variations in crop water use is essential for strategically defining optimal agricultural management practices. In this study, soil physico-chemical, weather and crop management variables were used through random forest (RF)-based modeling to evaluate the determinants of actual evapotranspiration (ETa) in winter wheat across Slovakia. ETa was estimated using Landsat imagery and the Python implementation of the Surface Energy Balance Algorithm for Land (PySEBAL), along with information from the Land Use/Cover Area frame Survey (LUCAS) over four cropping seasons. Overall, good agreements were found between PySEBAL-derived ETa and measured values, with RMSE and R2 values of 0.93 mm and 0.87, respectively. Seasonal ETa values ranged from 434.87 mm to 506.12 mm, with the highest and lowest average values found in the 2011/2012 and 2017/2018 cropping seasons, respectively. The RF model showed good performance in predicting seasonal ETa, with an RMSE of 21 mm/season for the training data and 32 mm/season for the validation data, and R2 values of 0.90 and 0.72, respectively. Our analysis indicated that ETa was primarily influenced by relative humidity, wind speed, solar radiation, altitude, and pH. The study further indicated that wheat production was unsuitable above 600 m elevation, while optimal crop water use occurred below 200 m. Addressing issues such as soil erosion and acidification could improve wheat crop water use efficiency across Slovakia. This modeling approach can serve as a basis to develop a crop water use forecasting system for sustainable wheat production in the region.

1. Introduction

Water resources are under increasing pressure due to competing demands from industrial, agricultural, and domestic sectors [1]. Agriculture alone accounts for approximately 70% of global freshwater withdrawals, with demand expected to increase in the future [2,3]. To address these challenges, it is essential to improve water productivity in cropland areas. Efficient water use in agriculture is vital to preserve biodiversity and ecosystem functioning and to mitigate the ongoing biodiversity crisis for a sustainable supply of natural resources and ecosystem services. This is particularly relevant in the intensively cropped plains of Slovakia, where biodiversity is negatively affected by agriculture and more than 576,000 ha of arable land are impacted by water erosion [4]. Beyond optimizing water use efficiency, the ability to predict crop water use (CWU) in response to climate variability at local and national scales is crucial for developing agricultural policies, forecasting, and identifying effective adaptation strategies to climate change. In addition to mapping and predicting CWU as a pathway toward sustainable agricultural production, identifying key soil properties, weather variables, and crop management practices that influence spatial variations in CWU enables the development of best management practices and supports the spatial management of crop production constraints.
Traditionally, the identification of soil properties, weather and crop management practices affecting crop growth follows these steps: diagnostic, planning, experimentation, assessment, and recommendations [5]. These various steps can extend over several years and require a combination of surveys, on-farm trials and laboratory work, making the process expensive, labor-intensive, and time-consuming. With unpredictable and increasingly frequent extreme weather events, along with growing pressure on natural resources [6,7], there is an urgent need for cost-effective methods for identifying crop growth constraints. Developing strategies that accurately pinpoint these constraints and deliver timely information is crucial for reducing the adverse impacts of climate variability and change on crop production.
Remote sensing (RS)-based approaches have proven both cost-effective and time-efficient, especially in data-scarce environments. RS-derived information combined with machine learning (ML) modeling has been widely applied in various agricultural applications, ranging from crop classification and land cover mapping to plant biotic and abiotic stress detection to yield estimation and forecasting [8,9]. RS-derived information has also been employed in ML models to assess land use suitability and to characterize drought and ETa predictors in rice production systems [10,11].
Extensive research in Central and Eastern Europe (CEE) has primarily focused on analyzing and modeling the impacts of climate change on winter wheat production [12,13]. These studies indicate that decreasing water availability and rising temperatures threaten wheat production. While other studies [14,15] have demonstrated the influence of climate and soil on winter wheat in CEE, achieving the objectives of the European Green Deal will require the adoption of new management practices. Therefore, evaluating the influence of soil, weather, and crop management factors on winter wheat production in CEE is essential to facilitate the transition toward more sustainable agricultural systems.
In this study, soil physico-chemical, weather and crop management variables were integrated through random forest-based modeling to evaluate the determinants of actual evapotranspiration (ETa) in winter wheat across Slovakia. Such an approach has not yet been applied in Slovakia. Identifying these factors could serve as a basis for developing strategies to more effectively manage the spatial limitations of winter wheat production and to ensure both food security and environmental sustainability in Slovakia and other regions with similar environmental characteristics.

2. Materials and Methods

2.1. Study Area and Period

Data for four winter wheat growing seasons—2008/2009, 2011/2012, 2014/2015, and 2017/2018—covering 261 wheat sites across Slovakia were used in the analysis (Figure 1). Various climatic zones are found across Slovakia, ranging from temperate zones in the south to continental zones in the north [16,17], with distinct stratifications from west to north [18]. Average temperatures vary between 6 °C and 11 °C, in the valleys and basins, and drop below −3 °C in the High Tatra Mountains. Average annual precipitation typically ranges from 550 mm in the lowlands to 2000 mm in the High Tatra Mountains [19].
Arable land and permanent crops cover approximately 1.6 million ha in Slovakia, with the main crops being wheat, barley, maize, oilseeds, potatoes, sugar beet, vineyards, and fruit trees [20]. In this study, wheat site data were obtained from the Land Use and Coverage Area frame Survey (LUCAS) database. Sowing and harvesting data were retrieved from the Pan European Phenology Project (PEP725) (http://www.pep725.eu/). Sowing data in 2011–2012 season were not available.
To determine the study period for the calculation of ETa, an Analysis of Variance (ANOVA) was conducted to assess variability in sowing and harvesting dates between plots and across years. This analysis indicated no statistically significant differences (p > 0.05) between plots and years for sowing (Table 1).
For harvesting, there were highly significant differences between years and sites (p < 0.05; Table 1). This can be explained by several factors, including weather conditions and the need to achieve acceptable grain moisture content before harvesting. Wheat harvest in Slovakia is highly dependent on weather conditions, as it can be delayed by inclement weather [21]. Sowing and harvesting maps were generated using Inverse Distance Weighting interpolation (Figures S1 and S2). Since the field dry period is not accounted in the crop development process, basing the analysis solely on climate stratification zones may lead to an overestimation of ETa. In this study, the cropping season was defined as 1 October to 30 June of each year to represent the average sowing date and early harvesting periods.

2.2. Data

2.2.1. PySEBAL-Derived and Measured ETa

The Python implementation (version 2.7.18) of the Surface Energy Balance Algorithm for Land (PySEBAL, version 3.4.4.3) model was applied to calculate the spatial and temporal variations in ETa during the 2008/2009, 2011/2012, 2014/2015, and 2017/2018 cropping seasons. Input data included satellite imagery and hourly and daily weather data such as average air temperature, wind speed, relative humidity, and solar radiation. A total of 84 clear-sky Landsat images covering the study sites and periods were retrieved from Earth Explorer (https://earthexplorer.usgs.gov/), while weather data were sourced from the ERA5 reanalysis dataset (https://cds.climate.copernicus.eu/datasets, accessed on 10 December 2024). The outputs of PySEBAL included ETa and crop coefficients at the daily time scale. Seasonal ETa was determined using linear interpolation applied between crop coefficients values derived from successive satellite images [22].
The lysimeter station at Petrovce nad Laborcom (48°47.540′ N and 21°53.175′ E) (Figure 1) features five weighable lysimeters, each containing undisturbed soil monolith. These lysimeters are installed on a three-point electronic weighing system that offers a precision of 10 g. Lysimeter data collected between 24 March and 26 October 2021, were obtained from the Institute of Hydrology of the Slovak Academy of Sciences. These data were used to validate the PySEBAL model. However, they were not included in the determination of key factors influencing ETa, as LUCAS data were unavailable for 2021. LUCAS surveys are conducted once every three years. For the estimation of ETa in 2021, 25 clear-sky Landsat images covering the lysimeter station were used. No ETa measurements were available for the other cropping seasons.

2.2.2. Biophysical Predictors

Potential explanatory variables related to soil physico-chemical characteristics, weather and crop management were used to assess the variability in PySEBAL-derived ETa. Soil physico-chemical variables (Table S1) were sourced from the LUCAS at the point scale, except for soil loss by water erosion and soil erodibility (K_Factor). Gridded annual data for soil erosion (10 km × 10 km resolution) and soil erodibility (500 m × 500 m resolution) for Slovakia were sourced from the European Soil Data Centre (ESDAC) [23,24]. Details of the methods used for soil analysis in the LUCAS surveys are provided in Jones et al. [25].
Weather data for maximum air temperature, wind speed, relative humidity, and solar radiation were retrieved from the Agri4Cast Toolbox (https://agri4cast.jrc.ec.europa.eu/). Gridded data for the average aridity index (1 km × 1 km resolution) for the period 1979–2018 were sourced from ERA5.
The cover management factor (CF) represents the effects of vegetation cover, crop type, and land management practices on soil loss. The influence of individual cover management practices, including tillage (CF_Till), plant residues (CF_Res), and cover crops (CF_Cov), was also considered in the analysis. CF data at 100 m × 100 m spatial resolution were obtained from ESDAC [26,27]. Irrigation variables included the area actually irrigated (AAI) and the area equipped for irrigation (AEI). These data were sourced from the Global Map of Irrigation Areas (version 5.0) of AQUASTAT—FAO’s Global Information System on Water and Agriculture. AAI and AEI are expressed as percentages of total land area within each raster cell at a 5 min spatial resolution [28,29]. The complete list of predictors used in this study is provided in Table S1.

2.3. Data Analysis

In this study, point pattern analysis was employed. Pixel values of growing season average ETa and biophysical predictors at each site were extracted using QGIS (version 3.18.3). All statistical analyses were performed using R (version 4.0.0) [30] within the RStudio (version 1.0.136) development environment [31].

2.3.1. Random Forest Modeling

The random forest (RF) model was trained to predict PySEBAL-derived ETa using weather, crop management, and soil physico-chemical predictors. Prior to modeling, a correlation analysis was performed to identify highly correlated predictors (Figure S3). Predictors with correlation coefficient ≥ 0.75 were removed to avoid multi-collinearity. From the initial set of 35 variables, 25 were retained for modeling (Table S1).
The dataset was split into 80% for training and 20% for validation. RF combines binary decision trees constructed using bootstrapped samples from the training data, where a random subset of predictors is selected at each node [32,33]. Variable importance, partial dependence plot (PDP) and model prediction were used to evaluate the performance of the RF-based model. The mean decrease accuracy was used as a measure of variable importance [34]. The PDP illustrates the isolated effect of a selected predictor variable on the response variable [35]. These relationships can be categorized into three types: linear and monotonic, non-linear and monotonic, and non-linear and non-monotonic. A linear and monotonic relationship is characterized by a consistent, unidirectional effect, where an increase (or decrease) in the predictor variable leads to a proportional change in the response variable. A non-linear and monotonic relationship maintains a consistent direction but with varying rates of change. A non-linear and non-monotonic relationship exhibits fluctuations, meaning the response variable does not follow a single directional trend as the predictor variable changes. For the PDP analysis, only the top most influential predictors of ETa were used. Following the PDP analysis, two-dimensional (2D) PDP analysis was performed to examine interactions between soil and crop management variables and their combined effect on ETa.

2.3.2. Network Visualization

This analysis focused on three key aspects: variable importance, the nature of the relationship with ETa, and the correlation with ETa. These three aspects were derived from the results of variable importance and PDP analyses. The plot produced from this analysis integrates these three key aspects into a single visualization, facilitating the interpretation of complex relationships and providing a clearer understanding. For the network visualization analysis, the following procedures were applied:
Variable Importance
Variable importance was categorized into three levels—low, medium, and high—and visually represented by the thickness of the edges in the network graph. The classification was based on the mean decrease accuracy from the RF model as follows:
i.
Low importance (thin edges): mean decrease accuracy below 10;
ii.
Medium importance (medium-sized edges): mean decrease accuracy between 10 and 20;
iii.
High importance (thick edges): mean decrease accuracy exceeding 20.
Nature of the Relationship
The color of the edges was used to represent the nature of the relationship between ETa and its predictors as follows:
i.
Orange: Linear and monotonic relationship;
ii.
Gray: Non-linear and monotonic relationship;
iii.
Black: Non-linear and non-monotonic relationship.
Correlation
The color of the vertices was used to represent the correlation between ETa and its predictors. The correlation was categorized into three types as follows:
i.
Positive correlation (green): The PDP curve shows an increasing trend;
ii.
Negative correlation (red): The PDP curve shows a decreasing trend;
iii.
Complex correlation (blue): The PDP curve shows a combination of increasing and decreasing trends.
The network visualization analysis of the top ten influential predictors was conducted using the igraph 2.1.4 [36,37].

2.3.3. Model Evaluation

The PySEBAL-derived ETa from 24 March 2021 to 26 October 2021 were compared with measured values obtained from a lysimeter. The validation process included satellite image acquisition dates and the interpolated ETa. The training dataset was used to evaluate the model’s learning performance, whereas the validation dataset was employed to assess prediction accuracy. The coefficient of determination (R2) and the root mean square error (RMSE) were used to assess the goodness-of-fit of the PySEBAL and RF models. Their respective formulas are as follows:
R 2 = i = 1 n ( O i O ¯ ) . P i P ¯ i = 1 n O i O ¯ 2 .     i = 1 n P i P ¯ 2
R M S E = 1 n i = 1 n P i O i 2
where Pi and Oi refer to the predicted and observed values, respectively; P ¯ and O ¯ are the average predicted and observed values, respectively; and n is the sample number.

3. Results

3.1. Descriptive Statistics

Values of PySEBAL-derived ETa ranged from 220.00 mm to 552.80 mm during the four cropping seasons, with average values varying between 433.87 mm and 506.12 mm (Table 2). ETa varied moderately during the cropping seasons. The highest variability was found for the 2008/2009 season, with a coefficient of variation of 17%. In 2011/2012 and 2014/2015, the variability in ETa was below 10% (Table 2). ETa also varied spatially across the study sites (Figure S4).
Soil properties, weather conditions, and crop management practices varied across the study sites (Table 3). Among the soil physico-chemical variables, the greatest variability was observed in soil erosion, with a CV of 78%. Carbon to nitrogen ratio (C/N) presented the lowest variability, with a CV of 6%. The high variability in soil erosion suggests that erosion processes differed considerably across sites, likely due to variations in topography, land use, and conservation practices, among other factors. In contrast, the relatively low variability in C/N might indicate more uniform soil organic matter and nutrient management across sites. For weather variables, wind speed (CV = 20%) showed greater fluctuations, with a CV of 20% (Table 3), possibly influenced by local topographical features and seasonal patterns. Conversely, relative humidity remained relatively stable (CV = 5%). When comparing crop management variables, AAI showed the highest variability (CV = 159%). On the other hand, the low variability in crop residue and cover management (CV = 1% each) suggests uniform adoption of residue management practices across farms.

3.2. Comparison of Lysimeter and PySEBAL-Derived ETa

Figure 2 presents the comparison between measured and PySEBAL-derived ETa for the period of March–October 2021. Overall, a good agreement was obtained between the daily ETa estimates from PySEBAL and the lysimeter, with RMSE of 0.93 mm and 1 mm and R2 values of 0.87 and 0.83 for the satellite overpass dates (Figure 2A) and interpolated estimations (Figure 2B), respectively. The patterns of interpolated ETa were similar to those of the lysimeter over March-October 2021 (Figure 2C), indicating that PySEBAL provided acceptable ETa estimations.

3.3. Determinants of Actual Evapotranspiration

3.3.1. Assessment of RF Model Performance

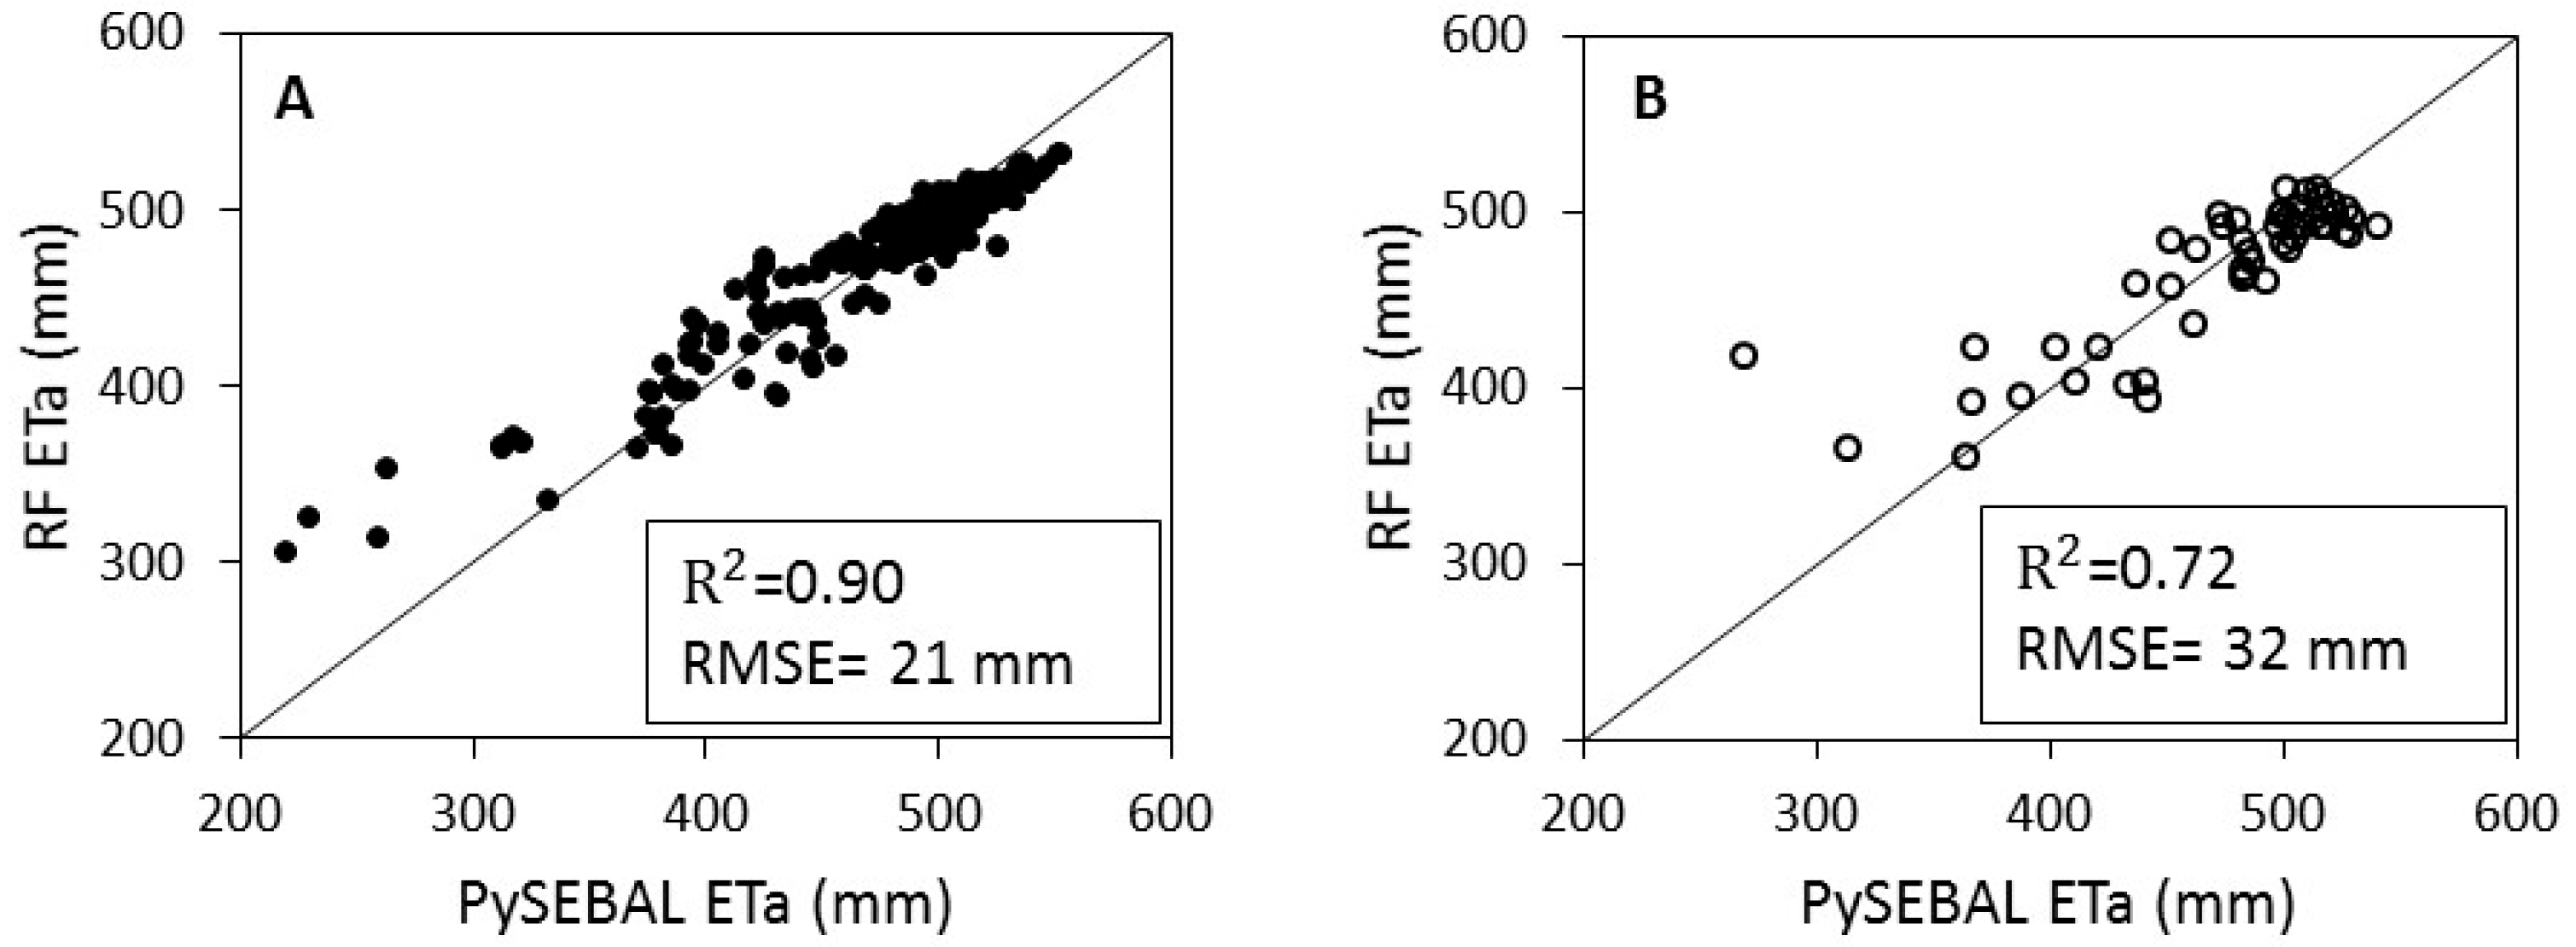
The RF-based model achieved good performance in predicting ETa (Figure 3). For the training dataset, the RF model demonstrated a high level of accuracy, with a R2 of 0.90 and a RMSE of 21 mm. However, the performance on the validation dataset showed a slight decline but remained good, with an R2 of 0.72 and a RMSE of 32 mm.

3.3.2. Variable Importance

The primary predictors influencing ETa variability were relative humidity (RH, 38%), followed by wind speed (Win, 28%) and solar radiation (Rad, 22%) (Figure 4), highlighting the dominant role of climatic variables in ETa determination. Other notable predictors included altitude (Alt, 15.2%), pH (14.7%), cover management (CF, 12.7%), aridity index (Ari, 12.4%) and maximum temperature (Temp, 11.5%). In contrast, variables such as cation exchange capacity, phosphorus, USDA soil textural classes and C/N showed lower importance.

3.3.3. Partial Dependence Plot

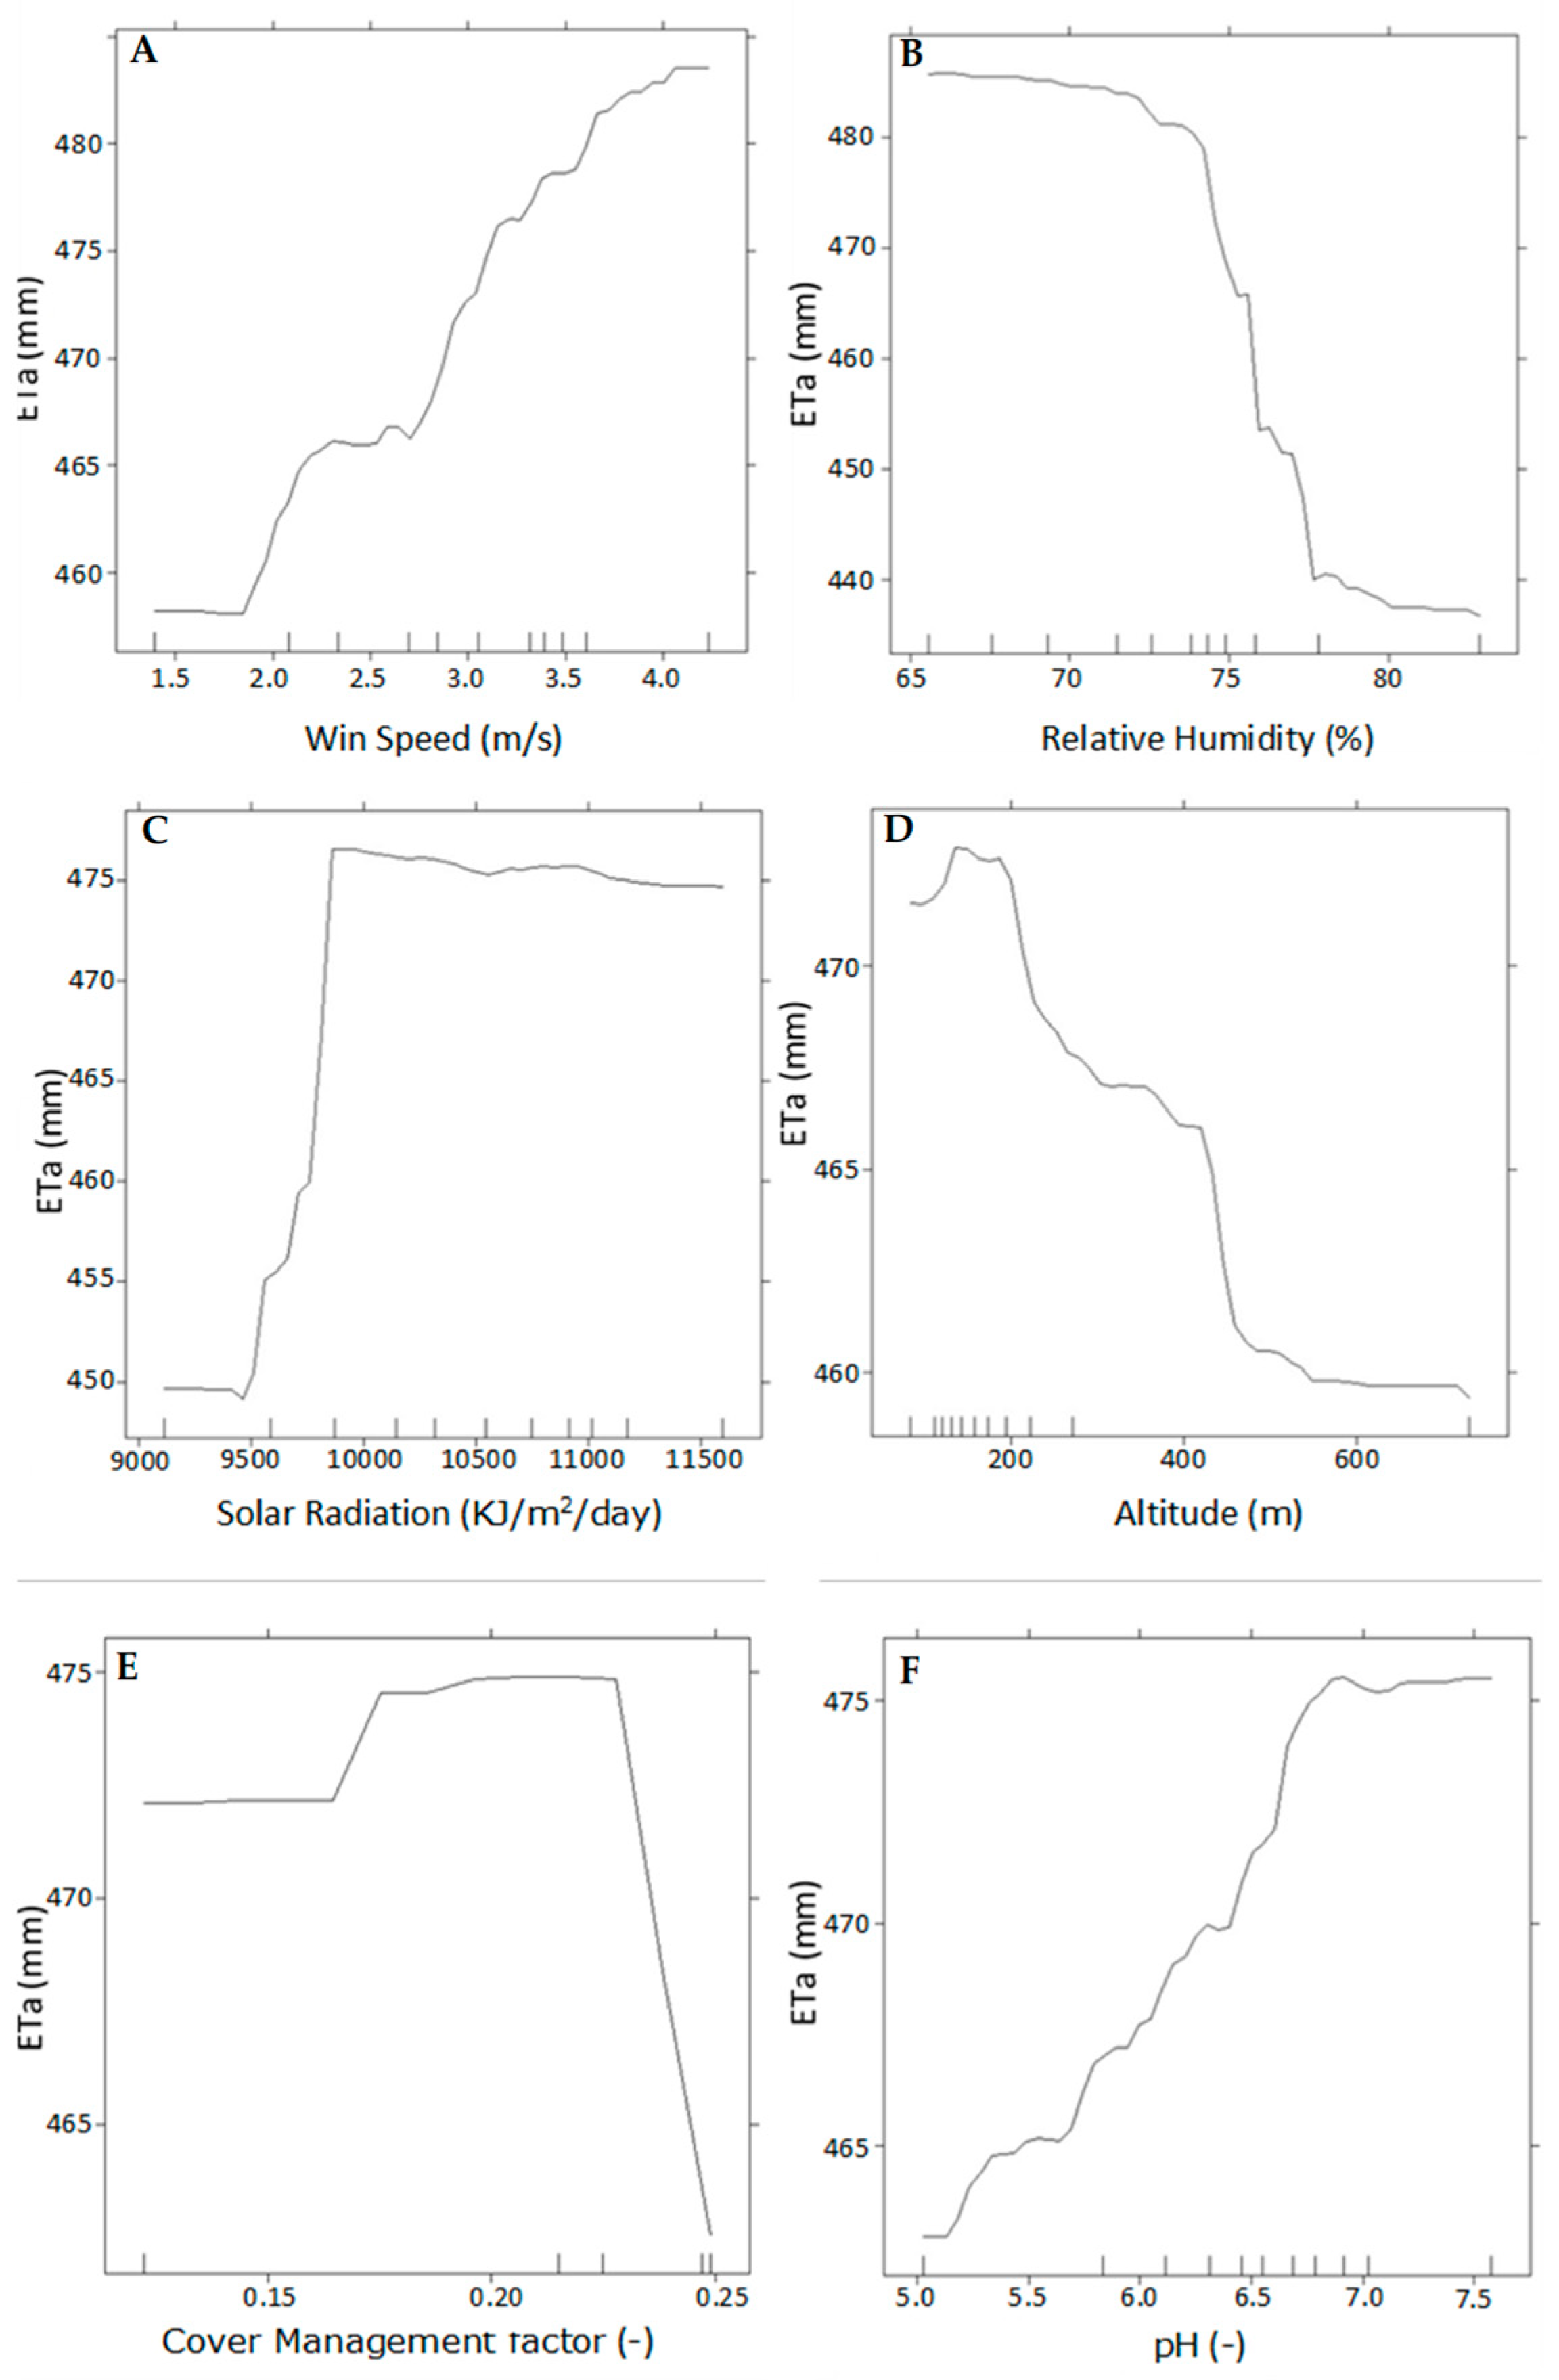
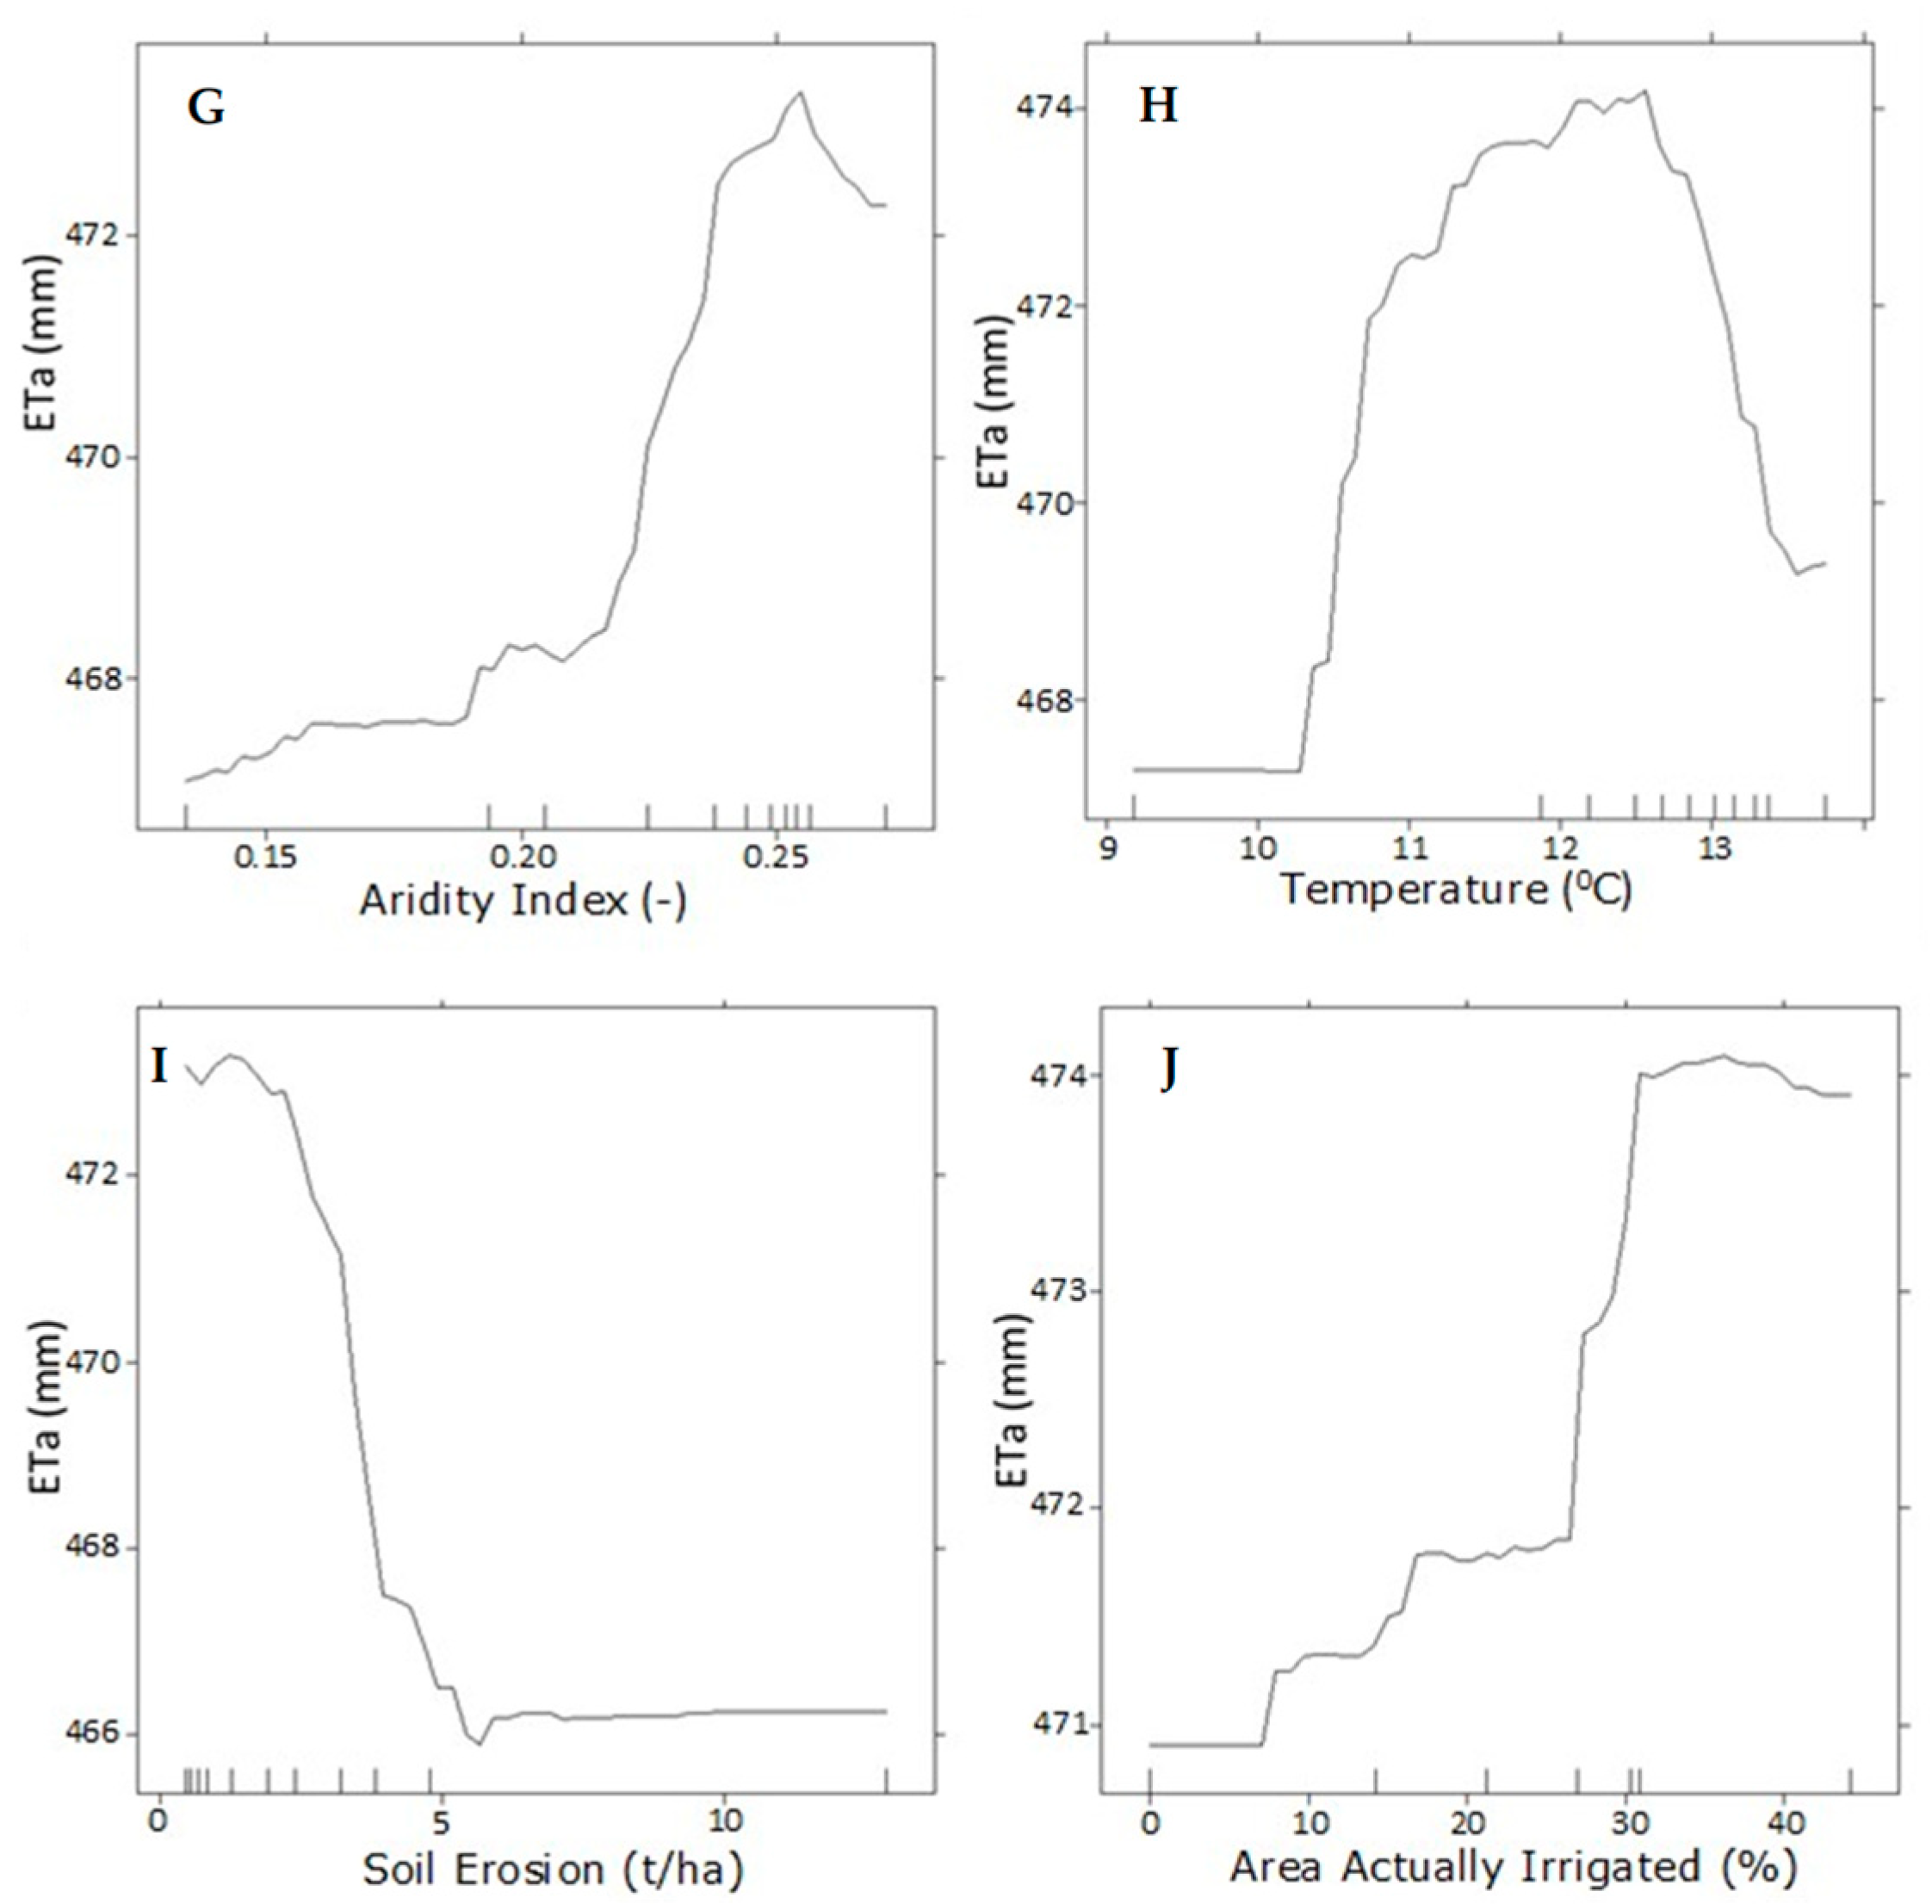
Figure 5 shows the PDPs for the top 10 predictors. Among the top 10 predictors, the relationship between wheat ETa and pH or wind speed was linear and monotonic: an increase in pH or wind speed was positively associated with a linear increase in wheat ETa (Figure 5A,F). Non-linear and monotonic relationships were observed between wheat ETa and soil erosion, area actually irrigated, aridity index, relative humidity, and altitude (Figure 5B,D,G,I,J). However, only AAI and Ari showed a positive association with wheat ETa, while the other predictors showed a negative association. Non-linear and non-monotonic relationships were observed between wheat ETa and solar radiation, maximum temperature and cover management factor. For those predictors, there was generally an increasing trend to wheat ETa up to a given threshold, followed by a decreasing trend (Figure 5C,E,H).
The network visualization plot is presented in Figure 6. Wind speed and relative humidity had the highest importance, while erosion and the area actually irrigated had lower influence on ETa. The color of the vertices illustrates the correlation between ETa and its predictors. Wind speed was positively associated with ETa (green color); erosion was negatively associated with ETa (red color); whereas complex relationships were found for radiation, maximum temperature and cover management factor (blue color). This figure allows for a clear visualization and comparison of predictors influence on wheat ETa.

3.3.4. Analysis of Soil and Crop Management Factors Interactions on ETa

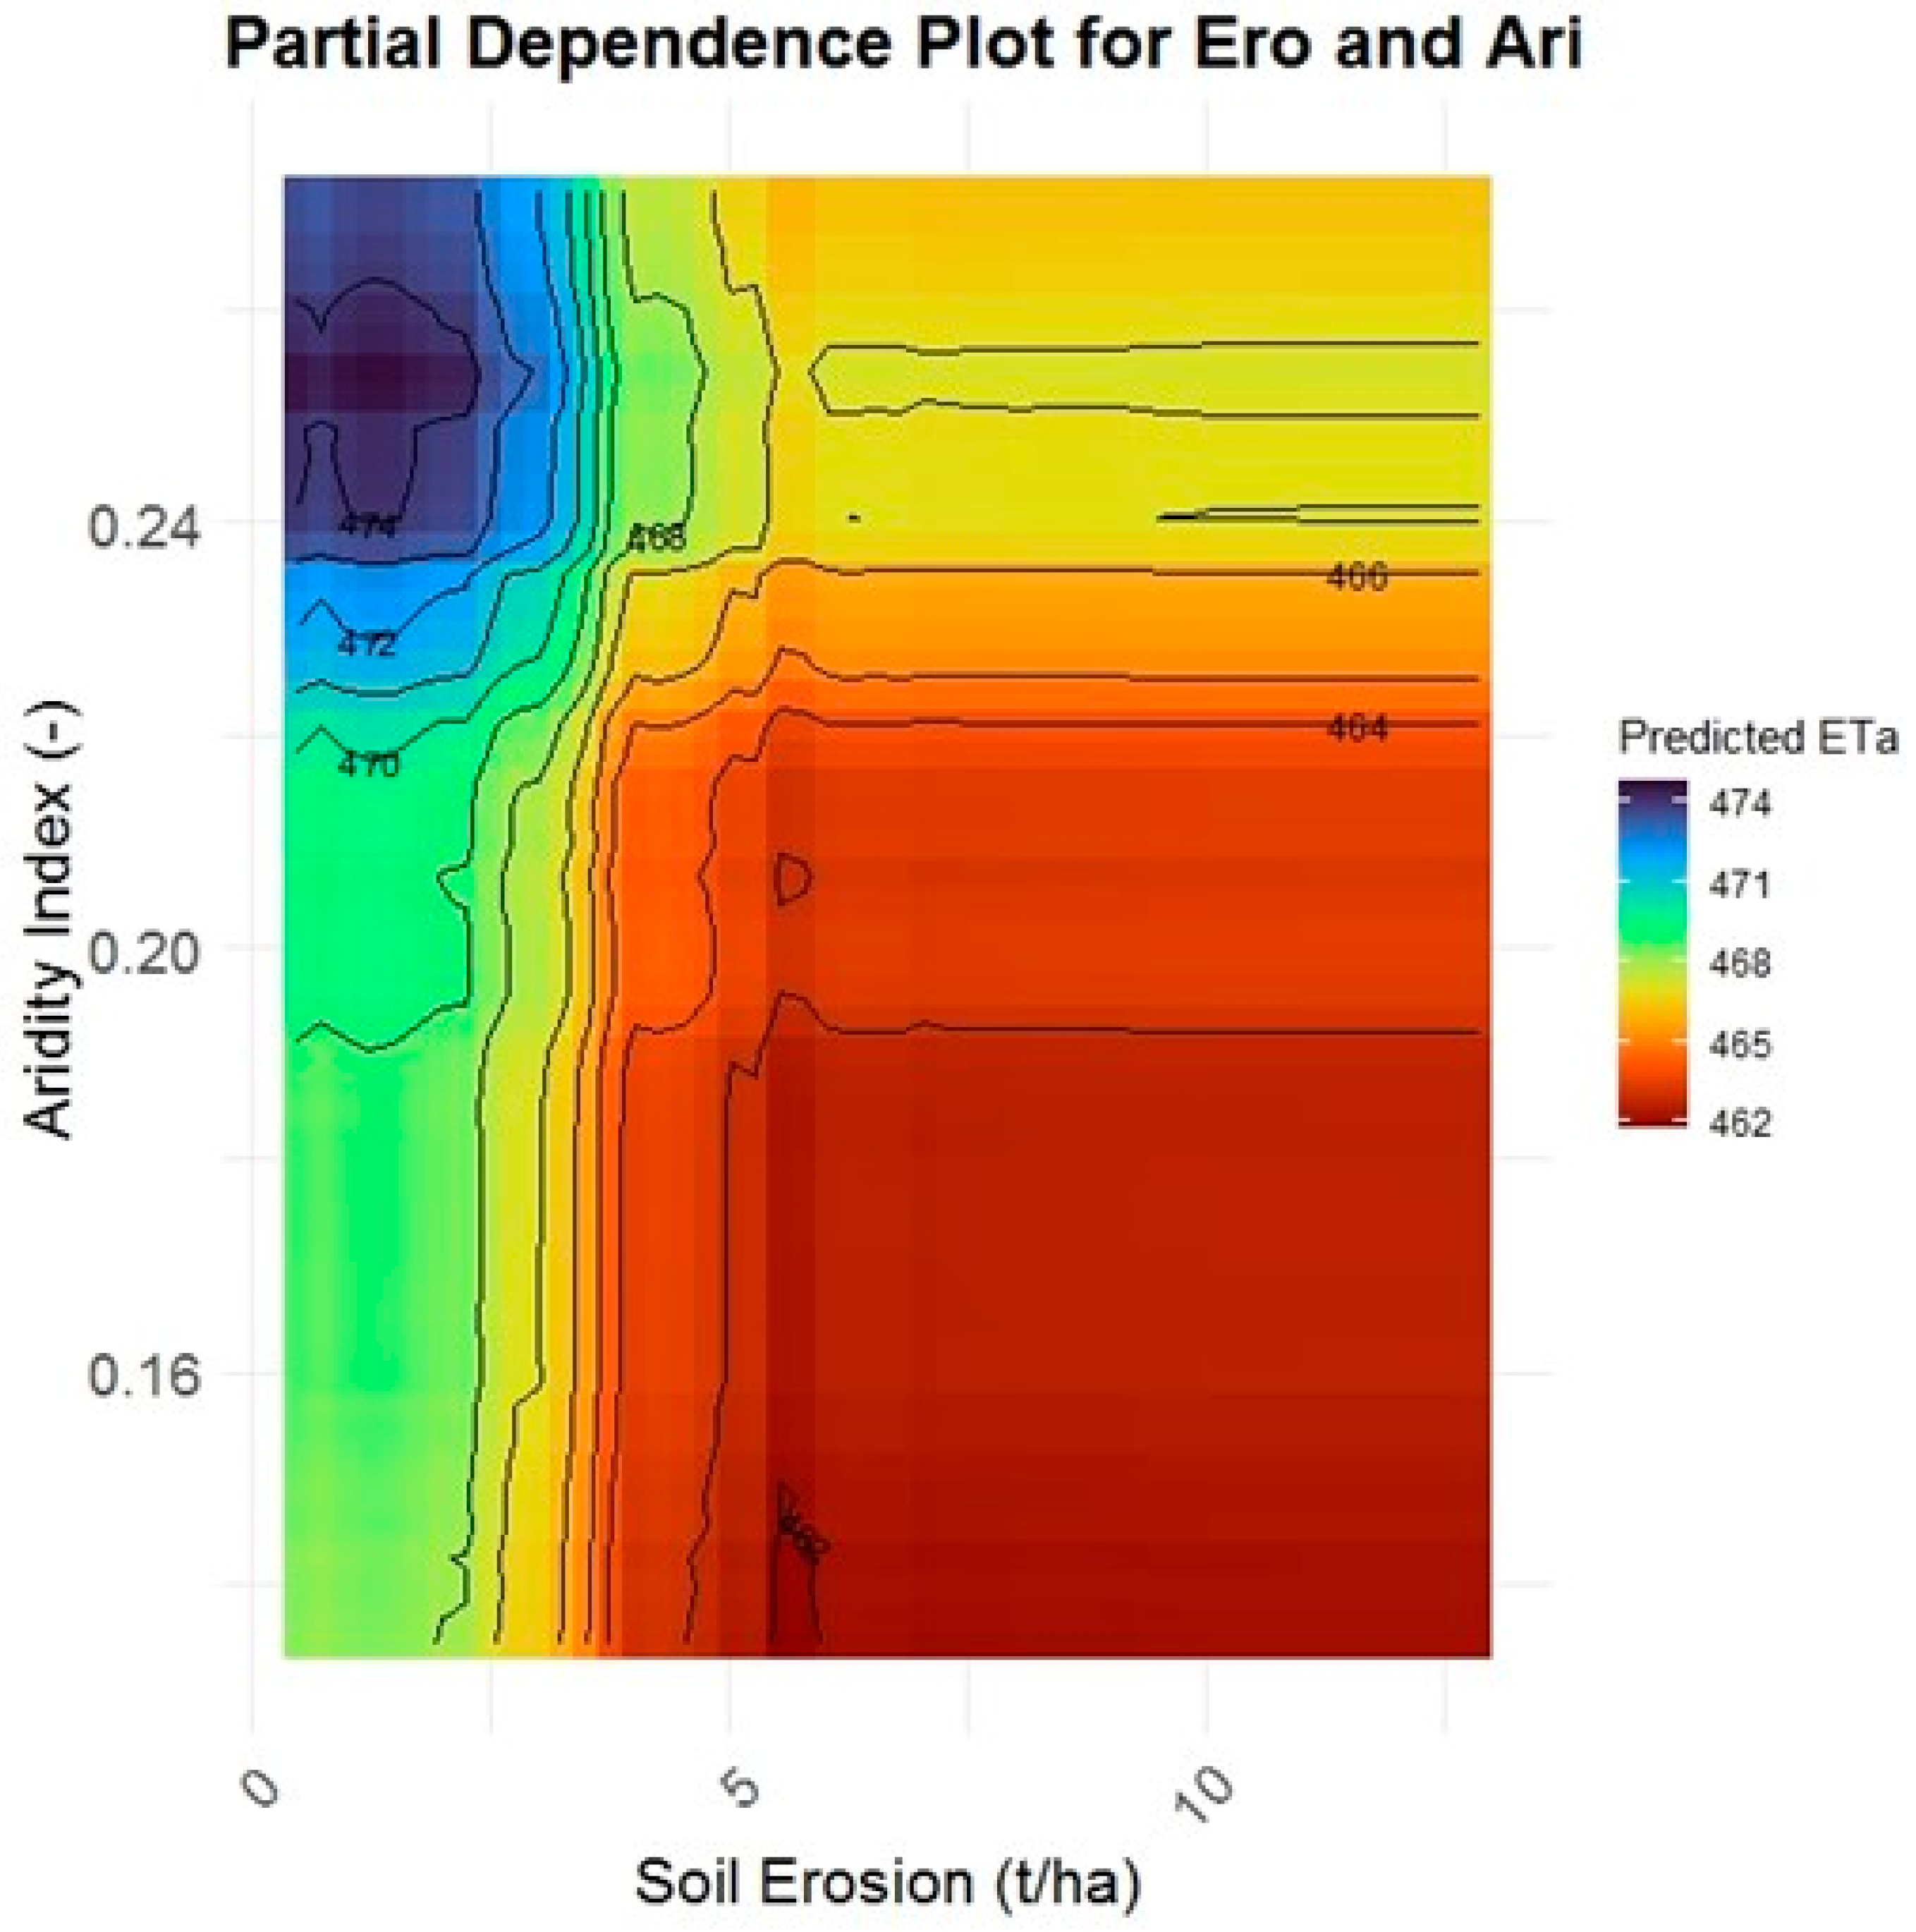
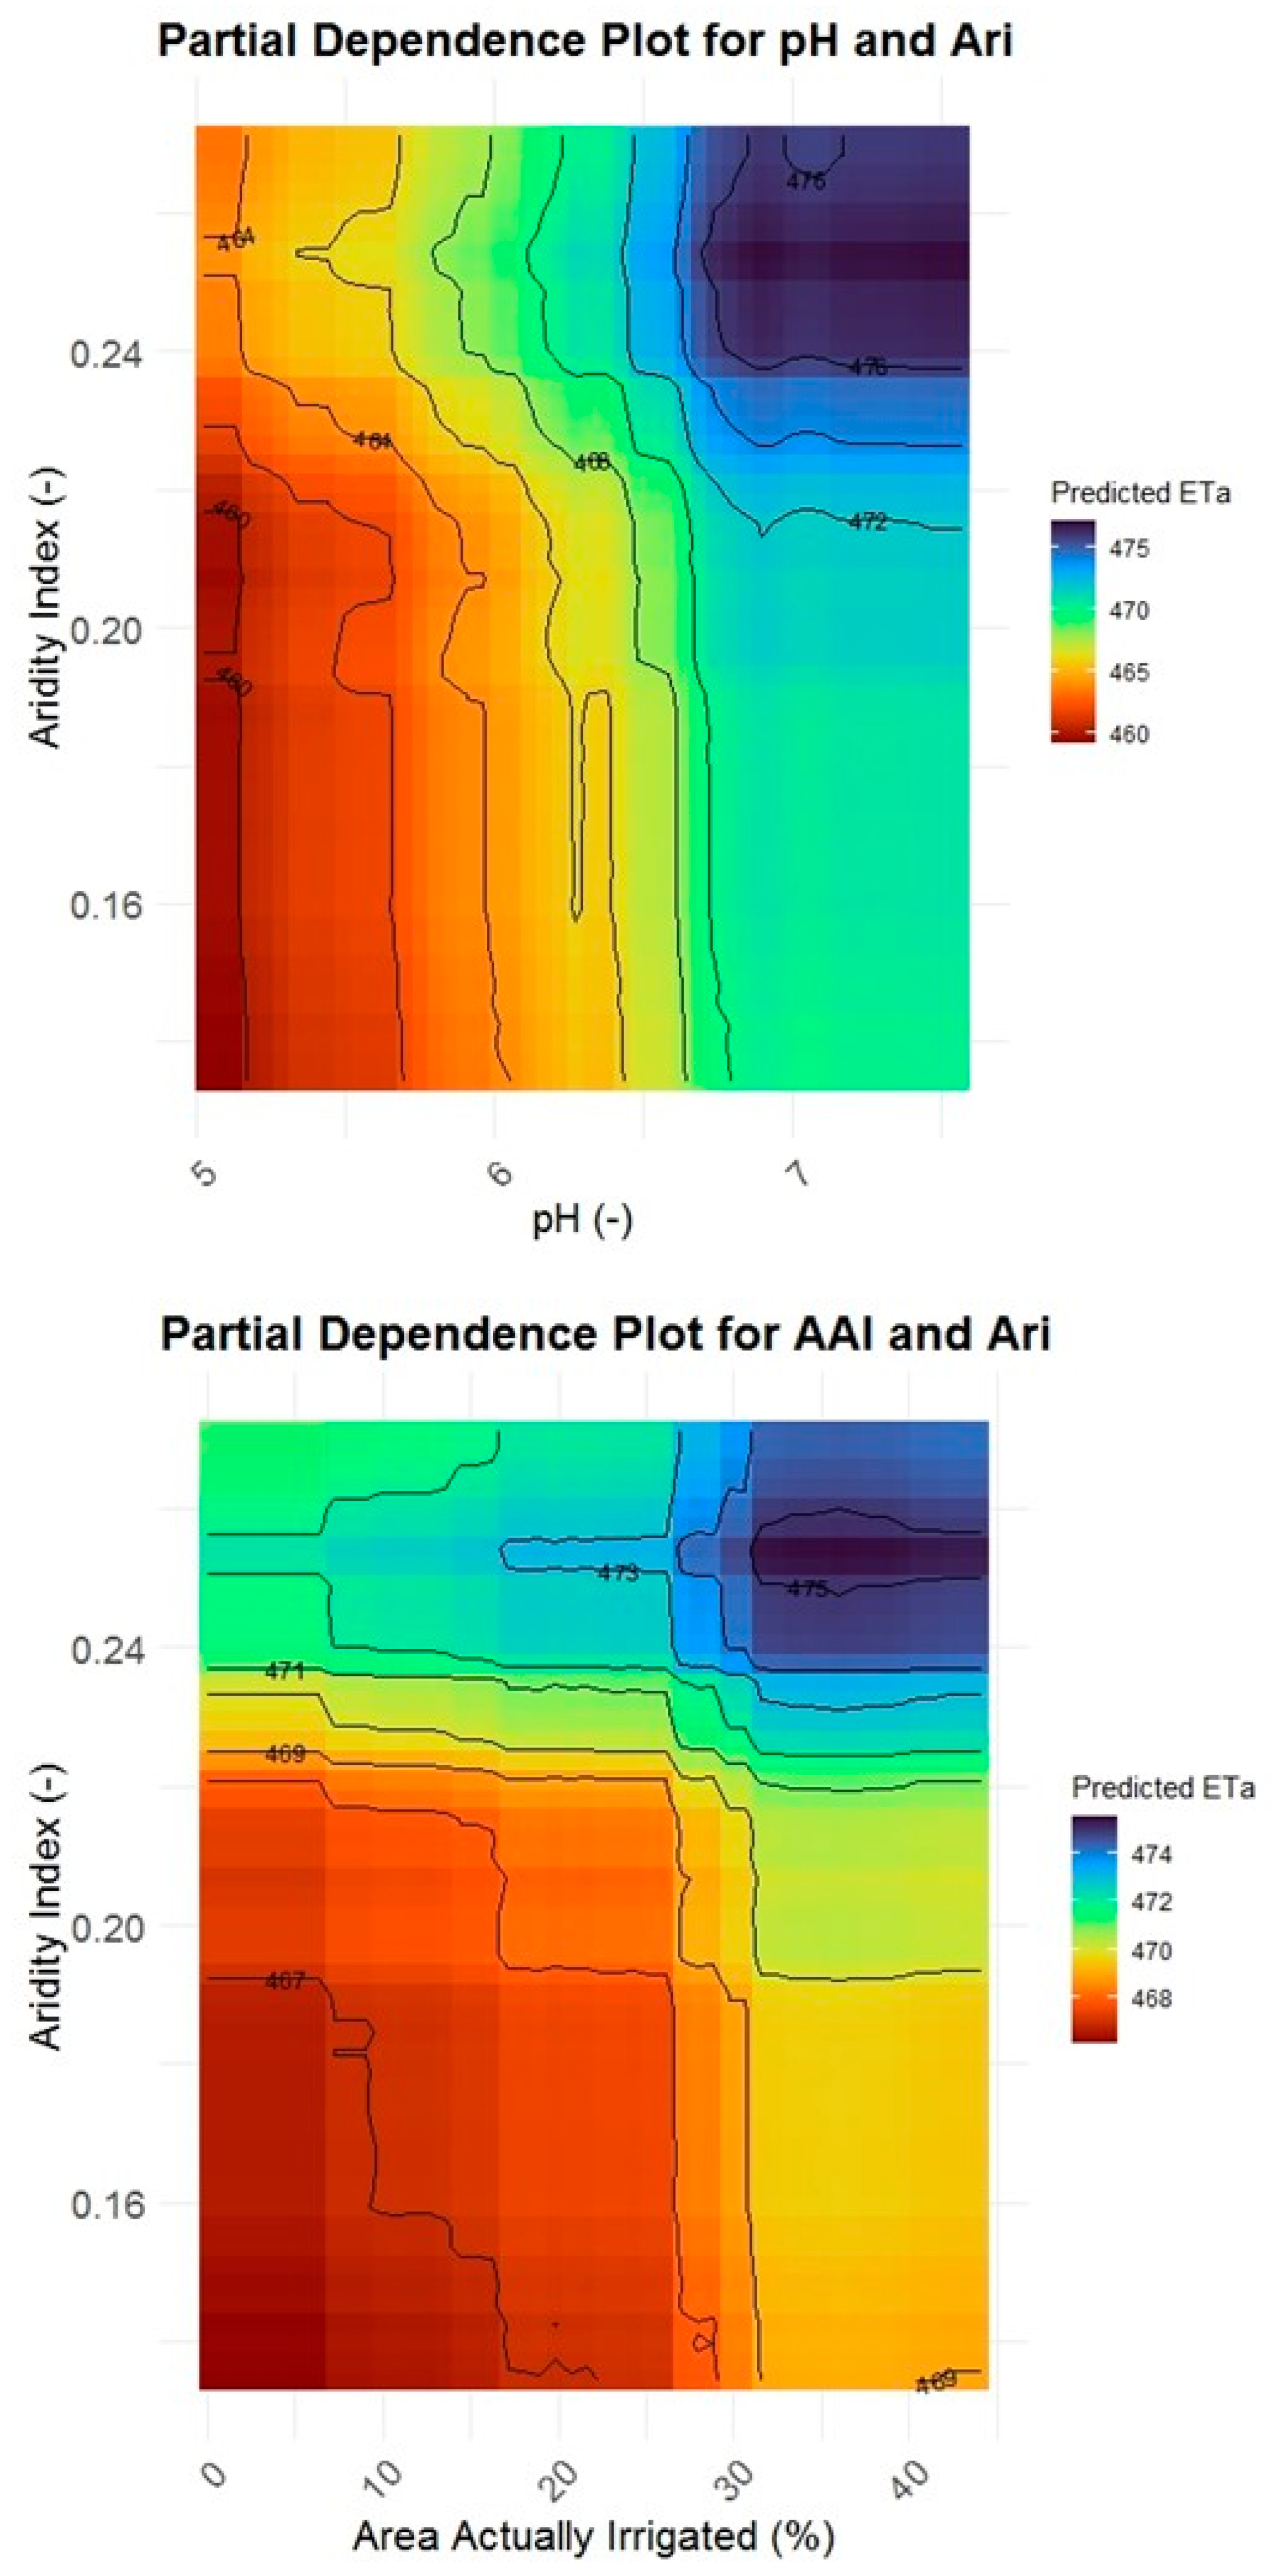
Figure 7 and Figure S5 present the analysis of interactions between soil and crop management factors on ETa. The predictor Ari was primarily a climatic variable but had significant interactions with soil properties. It was considered within the soil and crop management variables for the interactions analysis. High ETa was typically observed at altitudes below 200 m, while moderate ETa was found at altitudes between 200 m and 400 m and low ETa at altitudes above 600 m (Figure S5). For soils, ETa was higher in areas where soil erosion was low to moderate (0–2 t/ha) (Figure 7 and Figure S5). Excessive erosion (>5 t/ha) was associated with low ETa (Figure 7 and Figure S5), likely due to soil degradation. Highest ETa values occurred in the mid-range pH levels (approximately 6–7), indicating that extreme soil acidity might have negatively impacted on wheat CWU. Irrigation water supply was a critical factor influencing ETa, with higher AAI (above 20%) leading to increased ETa, particularly at lower elevations. However, in acidic soils with a pH range from 5 to 6, even high irrigation level failed to achieve optimal CWU (Figure S5). This highlight the importance of prioritizing soil pH management in agricultural productivity improvement programs. Across plots, noticeable drop in ETa was observed at higher CF values (>0.23) (Figure 7 and Figure S5). This suggests that higher CF values, associated with less conservation management practices (reduced/no tillage, use of cover crops and plant residues), may lead to reduced ETa. High irrigation levels (above 20%) generally led to increased ETa. However, this effect decreased when combined with high CF values, suggesting the need for conservation management practices to ensure sustainable agriculture. The analysis of Ari showed that higher ETa was typically observed at Ari > 0.24, while a decreasing trend in ETa was found at Ari < 0.24 (Figure 7), suggesting the critical role of water availability in ETa determination.

4. Discussion

In this study, soil physico-chemical properties, weather and crop management variables affecting wheat crop ETa across Slovakia were investigated. High variability in soil properties, weather conditions, and crop management practices was observed across wheat fields. Soil variability in Slovakia is mainly related of varying geological, topographical, climatic conditions, and land use [38,39]. The weather variability observed in this study primarily depends on atmospheric circulation and the topography [40,41]. Fedor [42] highlighted that severe winds driven by orographic effects are common in Slovakia and could explain the variability in wind speed observed in this study. The highest variability in the area actually irrigated reflects the spatial clustering of irrigated zones, which are, for the most part, located along major river systems such as the Morava and the Danube [43]. The low variability in crop residue cover management may be attributed to the widespread adoption of this practice by farmers due to its positive effects on crop yield, as well as the impact of agricultural policies, including the European Union legislation on crop residue management [44,45].
The highest average ETa value (506.12 mm) was recorded in the 2011/2012 season, while the lowest mean (434.87 mm) was observed in the 2017/2018 season. These findings are consistent with those of Takáč and Ilavská [46], who reported average ETa values ranging from 312 mm to 414 mm in winter wheat during the period 1991–2020 in Slovakia. Our results indicated even greater evapotranspiration in winter wheat. In addition to interannual variability in climate, factors such as heterogeneous agro-ecosystems and advection effects can also contribute to ETa variation when remote sensing approaches are used for evaluation [47,48]. The climatic variability observed during the 2008/2009 and 2017/2018 seasons (Table S2) was reflected in the variability in ETa during these cropping seasons. The validation results of PySEBAL are in line with findings from recent studies in Türkiye and Czech Republic, with R2 ranging from 0.70 to 0.89 and RMSE from 0.51 to 1.09 mm day−1 [49,50]. The linear interpolated ETa, showed a slight decline in accuracy that can be attributed to climatic variations over the study period and linear interpolation error [51,52]. Despite these limitations, the linear interpolation showed acceptable performance in estimating seasonal ETa.
Soil variables, particularly those related to chemical and physical fertility such as cation exchange capacity, phosphorus, USDA soil textural classes, nitrogen and C/N were less influential in predicting ETa. This weak relationship can be explained by the overall suitability of the soil for wheat production, as approximately 54% of farmland in Slovakia was classified as suitable for wheat cultivation [53]. In addition, relatively high fertilizer application rates ranging from 113.0 to 129.3 kg/ha in 2015 and 2018 [54], respectively, likely contributed to minimizing soil fertility constraints. Moreover, Slovakia’s Act No. 220/2004 Coll. [55], which governs soil protection and provides guidance to farmers on proper fertilization and soil conservation practices to ensure long-term soil fertility, along with the EU Common Agricultural Policy [56], which encourages sustainable fertilization and offers targeted funding such as support for small and young farmers have likely contributed to enhancing overall soil fertility while reducing its spatial variability. As a result, soil fertility may have played a less significant role compared to other biophysical factors.
Climate variables such as relative humidity, wind speed, solar radiation, and maximum temperature were among the most influential factors of wheat ETa. Climate variables have been identified as among the principal factors affecting ETa in Europe [57]. Similar results were reported in Germany, where vapor pressure deficit, temperature, and relative humidity were identified as the primary factors influencing ETa [58]. Although the relationship between relative humidity, wind speed, and ETa (Figure 5) aligns with previous studies [59], the decreasing relationship between solar radiation, maximum temperature and ETa (Figure 5) suggests the presence of hidden factors, e.g., water availability. While evapotranspiration is known to increase with rising temperature and solar radiation under non-limiting water conditions, increases in these variables lead to a decrease in ETa under water stress conditions [59,60], as found in this study. This suggests that the crop may have experienced water stress during the study period. Slovakia experienced three extreme droughts in 2003, 2012, and 2015, driven by variations in temperature and precipitation [61,62]. While limited water availability is likely the main factor driving the observed decline in ETa with increasing temperature and solar radiation, other factors such as pressure from plant diseases may have also interacted with these weather variables and contributed to decrease in ETa. Wheat diseases such as leaf rust (caused by Puccinia triticina Eriks.) spread under temperatures near 20 °C [63,64]. Moreover, this disease is recognized as one of the major threats to wheat production in Slovakia [65,66]. Future studies could focus on mapping and forecasting leaf rust disease risk conditions across Slovakia using remote sensing data. The results of such studies could be integrated into similar analyses to better understand the impact of this disease on crop water use.
The negative impact of erosion on wheat ETa is mainly linked to soil physical, chemical and biological fertility loss [67,68]. In Slovakia, soil erosion is one of the greatest threats to farming, impacting about 37–39% of agricultural land [4,69]. Since altitude influences soil erosion [70,71], the latter may also help explain the negative effect of altitude on ETa observed in this study. Based on the interaction results, which showed lower ETa at altitudes above 600 m, farmers can adopt conservation management practices to reduce soil erosion and improve soil fertility. This is particularly relevant, as high CF values (above 0.23) associated with higher altitudes (above 600 m), were related to low ETa (Figure S5). Adopting conservation management practices such as cover cropping, reduced or no tillage, and plant residues can improve soil fertility, increase water capture and storage and reduce the CF by on average 19.1% [27,72]. This study highlights the impact of conservation management practices on the ETa, by showing that reduced application of these practices (CF above 0.23) led to a noticeable decline in ETa across sites. The adoption of conservation management and soil erosion control measures reflects alignment with the European Green Deal’s priorities, supporting low-disturbance farming systems that enhance soil health, water retention, and overall agricultural sustainability [73]. Regarding soil acidity, this study found an increasing trend in ETa from acidic to basic soils, with the highest ETa values occurring at pH varying between 6 and 7. This aligns with [74,75] in which soil pH was identified as a critical factor influencing nutrient availability and crop growth. Soil acidification is a concern in Slovakia; it affects about 17.5% of the Slovakian agricultural land areas [4,76]. Regarding irrigation, the results showed an increasing trend in ETa, with the expansion of AAI (Figure 5), highlighting the potential of irrigation to improve wheat production in Slovakia. However, the interaction between pH and irrigation (Figure S5) showed that even with irrigation, achieving the full CWU potential remains challenging in acidic soils. This highlights the priority of pH management over irrigation expansion to improve overall agricultural productivity. Nevertheless, irrigation can also be used to raise soil pH and reduce acidity by adding salts such as potassium carbonate to the irrigation water [77,78].
Regarding the accuracy of the RF model for ETa prediction, the RMSE was 32 mm/season for the validation dataset and 21 mm/season for the training dataset, with corresponding R2 of 0.72 and 0.90, respectively. This indicates the good predictive performance of RF-based model for ETa prediction. Using more accurate data with higher spatial and temporal resolution and precise irrigation data (e.g., water supply rates) could enhance the model’s accuracy. Although the RF model demonstrated acceptable performance, factors such as microclimatic variations or groundwater interactions may have influenced its results. Incorporating spatially explicit methods, such as the geographically weighted regression or the Moran’s I, can help assess local variability and identify areas where variability remains unexplained, thereby enhancing both model performance and interpretability.
This analysis was conducted using a relatively short dataset spanning four cropping seasons. Expanding the analysis to cover a longer period could enhance the robustness of the method and is considered a potential direction for future research in the study country. Another limitation involves the uncertainties associated with satellite data. Although collecting field-based data at the national scale is challenging, incorporating such data could help validate and improve the RS-based approach. Additionally, in this study, PySEBAL-derived ETa estimates were validated using data from a single lysimeter station. We acknowledge that relying on a single site may be limiting, as it does not fully capture spatial variability across a large area. Future research could include additional lysimeter stations, eddy covariance measurements, or gravimetric ETa estimations to provide a more comprehensive assessment of model accuracy.

5. Conclusions

The main objective of this study was to investigate the soil, weather, and crop management factors influencing wheat ETa across Slovakia. PySEBAL-derived ETa, along with spatial data on soil, weather, and crop management, were used within a random forest-based modeling approach. This approach enabled the identification of the most influential factors and the characterization of their relationships with wheat ETa. The results showed that climatic variables were the most influential predictors of ETa in Slovakia. Higher ETa (>470 mm) values were generally observed at lower altitudes, up to 200 m. Conversely, at altitudes above 600 m, ETa values were lower (<450 mm), mainly due to soil erosion. Implementing conservation practices such as no-tillage, cover cropping, and plant residue management—particularly at such altitudes—could help reduce soil loss and mitigate the negative impacts of climate variability on crop productivity. An unexpected result of this analysis was the decreasing trend in wheat ETa with increasing temperature, suggesting the influence of water stress during the study period. Further analyses are needed to better understand the impact of major plant diseases on wheat crop water use, given their potential interaction with temperature in Slovakia. In this analysis, ETa prediction using the RF model achieved acceptable performance. To further improve model accuracy, future studies could focus on incorporating near real-time irrigation data and on integrating farmers’ socio-economic information. Additionally, establishing standard local threshold levels for key biophysical factors and management practices could enhance the method’s applicability for improving water management in winter wheat in Slovakia and elsewhere.

Supplementary Materials

The following supporting information can be downloaded at: https://www.mdpi.com/article/10.3390/agronomy15112462/s1, Figure S1: Average sowing dates (day of year, DOY) of winter wheat across Slovakia during the 2008/2009, 2012/2012, 2014/2015 and 2017/2018 cropping seasons; Figure S2: Average harvesting dates (day of year, DOY) of winter wheat across Slovakia during the 2008/2009, 2011/2012, 2014/2015 and 2017/2018 cropping seasons; Figure S3: Paired correlation between the soil physicochemical, weather and crop management predictors used in the study; Figure S4: Spatial and temporal distribution of seasonal ETa in a sample fields from 1 October 2014, to 30 June 2015; Figure S5: Two-dimensional partial dependence plot illustrating soil and crop management factors interactions on ETa using the RF model; Table S1: Soil physico-chemical, weather and crop management predictors used in the study; Table S2: Descriptive statistics for average weather variables during the study period by years.

Author Contributions

Conceptualization, A.S. and P.N.; Formal analysis, A.S.; Methodology, A.S., L.K. and F.T.; Writing—original draft preparation, A.S.; Writing—review and editing, L.K., F.T. and P.N. All authors have read and agreed to the published version of the manuscript.

Funding

This research APC was funded by the ESI SAS under projects VEGA no. 2/00115/25 and VEGA no. 2/0025/24. The first author (A.S.) was supported by the National Scholarship Programme of the Slovak Republic.

Data Availability Statement

The data presented in this study are available on request from the corresponding author. Data used in this study are below the Institute of Hydrology, and Earth Science Institute of Slovak Academy of Science and subject to institutional privacy restrictions.

Acknowledgments

The authors are grateful to Andrej Tall of the Institute of Hydrology, Slovak Academy of Sciences, for sharing the lysimeter evapotranspiration data.

Conflicts of Interest

The authors declare no conflicts of interest.

References

  1. UN-Water. The United Nations World Water Development Report 4: Managing Water under Uncertainty and Risk; World Water Assessment Programme (WWAP); UNESCO: Paris, France, 2012. [Google Scholar]
  2. FAO. The State of the Worlds Land and Water Resources for Food and Agriculture (SOLAW) Managing Systems at Risk; Food and Agriculture Organization of the United Nations: Rome, Italy, 2011. [Google Scholar]
  3. Turner, R.K. Economic Valuation of Water Resources in Agriculture: From the Sectoral to a Functional Perspective of Natural Resource Management; Food and Agriculture Organization of the United Nations: Rome, Italy, 2004; Volume 27. [Google Scholar]
  4. Stehlo, P.; Ková, K. Country Report on the Present Environmental Situation in Agriculture; Food and Agriculture Organization of the United Nations: Rome, Italy, 1999; pp. 88–109. [Google Scholar]
  5. CIMMYT. From Agronomic Data to Farmer Recommendations: An Economics Training Manual; CIMMYT: Texcoco, Mexico, 1988. [Google Scholar]
  6. Bolan, S.; Padhye, L.P.; Jasemizad, T.; Govarthanan, M.; Karmegam, N.; Wijesekara, H.; Amarasiri, D.; Hou, D.; Zhou, P.; Biswal, B.K.; et al. Impacts of climate change on the fate of contaminants through extreme weather events. Sci. Total Environ. 2024, 909, 168388. [Google Scholar] [CrossRef]
  7. Kundzewicz, Z.W. Extreme Weather Events and their Consequences. Pap. Glob. Change IGBP 2016, 23, 59–69. [Google Scholar] [CrossRef]
  8. Karmakar, P.; Teng, S.W.; Murshed, M.; Pang, S.; Li, Y.; Lin, H. Crop monitoring by multimodal remote sensing: A review. Remote Sens. Appl. Soc. Environ. 2024, 33, 101093. [Google Scholar] [CrossRef]
  9. Traoré, F.; Bonkoungou, J.; Compaoré, J.; Kouadio, L.; Wellens, J.; Hallot, E.; Tychon, B. Using multi-temporal landsat images and support vector machine to assess the changes in agricultural irrigated areas in the Mogtedo region, Burkina Faso. Remote Sens. 2019, 11, 1442. [Google Scholar] [CrossRef]
  10. Laborte, A.G.; Maunahan, A.A.; Hijmans, R.J. Opportunities for expanding paddy rice production in Laos: Spatial predictive modeling using Random Forest. J. Land Use Sci. 2012, 7, 21–33. [Google Scholar] [CrossRef]
  11. Sawadogo, A.; Dossou-Yovo, E.R.; Kouadio, L.; Zwart, S.J.; Traoré, F.; Gündoğdu, K.S. Assessing the biophysical factors affecting irrigation performance in rice cultivation using remote sensing derived information. Agric. Water Manag. 2023, 278, 108124. [Google Scholar] [CrossRef]
  12. Eitzinger, J.; Žalud, Z.; Alexandrov, V.; Diepen, C.v.; Trnka, M.; Dubrovský, M.; Semeradova, D.; Oberforster, M. A local simulation study on the impact of climate change on winter wheat production in north-eastern Austria. Bodenkultur 2001, 52, 199–212. [Google Scholar]
  13. Hlavinka, P.; Trnka, M.; Semerádová, D.; Dubrovský, M.; Žalud, Z.; Možný, M. Effect of drought on yield variability of key crops in Czech Republic. Agric. For. Meteorol. 2009, 149, 431–442. [Google Scholar] [CrossRef]
  14. Kas, M.; Muhlbachova, G.; Kusa, H. Winter wheat yields under different soil-climatic conditions in a long-term field trial. Plant Soil Environ. 2019, 65, 27–34. [Google Scholar] [CrossRef]
  15. Hlisnikovský, L.; Menšík, L.; Barłóg, P.; Kunzová, E. How Weather and Fertilization Affected Grain Yield and Stability of Winter Wheat in a Long-Term Trial in the South Moravian Region, Czech Republic. Agronomy 2023, 13, 2293. [Google Scholar] [CrossRef]
  16. Kottek, M.; Grieser, J.; Beck, C.; Rudolf, B.; Rubel, F. World map of the Köppen-Geiger climate classification updated. Meteorol. Z. 2006, 15, 259–263. [Google Scholar] [CrossRef] [PubMed]
  17. Zeleňáková, M.; Fendeková, M. Key Facts About Water Resources in Slovakia. In Water Resources in Slovakia: Part I: Assessment and Development; Negm, A.M., Zeleňáková, M., Eds.; Springer International Publishing: Cham, Switzerland, 2019; pp. 3–19. [Google Scholar] [CrossRef]
  18. Novotná, B.; Cviklovič, V.; Chvíla, B.; Minárik, M. Application of Developing Artificial Intelligence (AI) Techniques to Model Pan Evaporation Trends in Slovak River Sub-Basins. Sustainability 2025, 17, 526. [Google Scholar] [CrossRef]
  19. Kišš, V.; Minárik, M.; Čimo, J.; Tárník, A.; Mikulová, K. Changes in the Agroclimatic Areas of Slovakia in 1961–2020. J. Ecol. Eng. 2023, 24, 293–300. [Google Scholar] [CrossRef]
  20. FAO. Seed Policy and Programmes for the Central and Eastern European Countries, Commonwealth of Independent States and Other Countries in Transition: Proceedings of the Regional Technical Meeting on Seed Policy Programmes for the Central and Eastern European Countries, Commonwealth of Independent States and Other Countries in Transition, Budapest, Hungary, 6–10 March 2001; Food and Agriculture Organization of the United Nations: Rome, Italy, 2001. [Google Scholar]
  21. Dorrian, K.; Mkhabela, M.; Sapirstein, H.; Bullock, P. Effects of delayed harvest on wheat quality, gluten strength, and protein composition of hard red spring wheat. Cereal Chem. 2023, 100, 196–212. [Google Scholar] [CrossRef]
  22. Trezza, R.; Allen, R.G.; Kilic, A.; Ratcliffe, I.; Tasumi, M. Influence of Landsat revisit frequency on time-integration of evapotranspiration for agricultural water management. In Advanced Evapotranspiration Methods and Applications; Bucur, D., Ed.; IntechOpen: London, UK, 2018. [Google Scholar] [CrossRef]
  23. Fendrich, A.N.; Ciais, P.; Lugato, E.; Carozzi, M.; Guenet, B.; Borrelli, P.; Naipal, V.; McGrath, M.; Martin, P.; Panagos, P. Matrix representation of lateral soil movements: Scaling and calibrating CE-DYNAM (v2) at a continental level. Geosci. Model Dev. 2022, 15, 7835–7857. [Google Scholar] [CrossRef]
  24. Panagos, P.; Van Liedekerke, M.; Borrelli, P.; Köninger, J.; Ballabio, C.; Orgiazzi, A.; Lugato, E.; Liakos, L.; Hervas, J.; Jones, A.; et al. European Soil Data Centre 2.0: Soil data and knowledge in support of the EU policies. Eur. J. Soil Sci. 2022, 73, e13315. [Google Scholar] [CrossRef]
  25. Jones, A.; Fernandez-Ugalde, O.; Scarpa, S. Lucas 2015 Topsoil Survey: Presentation of Dataset and Results; EUR 30332; Publications Office of the European Union: Luxembourg, 2020. [Google Scholar] [CrossRef]
  26. Borrelli, P.; Panagos, P. An indicator to reflect the mitigating effect of Common Agricultural Policy on soil erosion. Land Use Policy 2020, 92, 104467. [Google Scholar] [CrossRef]
  27. Panagos, P.; Borrelli, P.; Meusburger, K.; Alewell, C.; Lugato, E.; Montanarella, L. Estimating the soil erosion cover-management factor at the European scale. Land Use Policy 2015, 48, 38–50. [Google Scholar] [CrossRef]
  28. Siebert, S.; Döll, P.; Feick, S.; Hoogeveen, J.; Frenken, K. Global Map of Irrigation Areas; FAO Land & Water: Bonn, Germany, 2007. [Google Scholar]
  29. Siebert, S.; Henrich, V.; Frenken, K.; Burke, J. Update of the Global Map of Irrigation Areas to Version 5: Project Report; Institute of Crop Science and Resource Conservation: Bonn, Germany, 2013. [Google Scholar]
  30. R Core Team. R: A Language and Environment for Statistical Computing; R Foundation for Statistical Computing: Vienna, Austria, 2023; Available online: http://www.R-project.org/ (accessed on 25 December 2024).
  31. Posit Team. RStudio: Integrated Development Environment for R; Posit Software; PBC: Boston, MA, USA, 2023; Available online: http://www.posit.co/ (accessed on 25 December 2024).
  32. Kouadio, L.; Deo, R.C.; Byrareddy, V.; Adamowski, J.F.; Mushtaq, S.; Phuong Nguyen, V. Artificial intelligence approach for the prediction of Robusta coffee yield using soil fertility properties. Comput. Electron. Agric. 2018, 155, 324–338. [Google Scholar] [CrossRef]
  33. Prasad, A.M.; Iverson, L.R.; Liaw, A. Newer Classification and Regression Tree Techniques: Bagging and Random Forests for Ecological Prediction. Ecosystems 2006, 9, 181–199. [Google Scholar] [CrossRef]
  34. Breiman, L. Random Forests. Mach. Learn. 2001, 45, 5–32. [Google Scholar] [CrossRef]
  35. Friedman, J.H. Greedy function approximation: A gradient boosting machine. Ann. Stat. 2001, 29, 1189–1232, 1144. [Google Scholar] [CrossRef]
  36. Csárdi, G.; Nepusz, T.; Traag, V.; Horvát, S.; Zanini, F.; Noom, D.; Müller, K.; iGraph Developers. igraph: Network Analysis Package for R; Version 2.1.4; R Foundation for Statistical Computing: Vienna, Austria, 2025. [Google Scholar]
  37. Csardi, G.; Nepusz, T. The igraph software package for complex network research. InterJournal Complex System. 2006, 1695. Available online: https://igraph.org/ (accessed on 25 December 2024).
  38. Bednarik, M.; LIščák, P. Landslide susceptibility assessment in Slovakia. Miner. Slovaca 2010, 42, 193–204. [Google Scholar]
  39. Varga, J.; Kanianska, R.; Spišiak, J. Impact of land use and geological conditions on selected physical soil properties in relation to the earthworm abundance and biomass along an altitudinal gradient in Slovakia. Soil Sci. Annu. 2018, 69, 160–168. [Google Scholar] [CrossRef]
  40. Labudová, L.; Faško, P.; Ivaňáková, G. Changes in climate and changing climate regions in Slovakia. Morav. Geogr. Rep. 2015, 23, 71–82. [Google Scholar] [CrossRef]
  41. Zbigniew, U.; Agnieszka, W.; Pavol, N.; Katarína, M. The influence of circulation conditions on extreme precipitation totals over the territory of the Western Carpathians in the warm season. Contrib. Geophys. Geod. 2023, 53, 399–411. [Google Scholar] [CrossRef]
  42. Fedor, T. Severe wind induced by orographic effects during cold airmass advection over Carpathian Mountains. In Proceedings of the European Geosciences Union General Assembly 2024 (EGU24-13033), Vienna, Austria, 14–19 April 2024. [Google Scholar]
  43. Jurík, Ľ.; Halászová, K.; Pokrývková, J.; Rehák, Š. Irrigation of arable land in Slovakia: History and perspective. In Water Resources in Slovakia: Part I: Assessment and Development; Negm, A.M., Zeleňáková, M., Eds.; Springer International Publishing: Cham, Switzerland, 2019; pp. 81–96. [Google Scholar]
  44. Korczyk-Szabó, J.; Macák, M.; Jarecki, W.; Sterczyńska, M.; Jug, D.; Pużyńska, K.; Hromadová, Ľ.; Habán, M. Influence of Crop Residue Management on Maize Production Potential. Agronomy 2024, 14, 2610. [Google Scholar] [CrossRef]
  45. Searle, S.; Bitnere, K. Review of the Impact of Crop Residue Management on Soil Organic Carbon in Europe; The International Council on Clean Transportation: Washington, DC, USA, 2017. [Google Scholar]
  46. Takáč, J.; Ilavská, B. Crop water sufficiency in Slovakia. Pedosphere Res. 2021, 1, 20–39. [Google Scholar] [CrossRef]
  47. Sawadogo, A.; Gundogdu, K.S.; Traoré, F.; Kouadio, L.; Hessels, T. Estimating in-season actual evapotranspiration over a large-scale irrigation scheme in resource-limited conditions. C. R. Acad. Bulg. Sci. 2020, 73, 1473. [Google Scholar] [CrossRef]
  48. Singh, R.K.; Irmak, A.; Irmak, S.; Martin, D.L. Application of SEBAL Model for Mapping Evapotranspiration and Estimating Surface Energy Fluxes in South-Central Nebraska. J. Irrig. Drain. Eng. 2008, 134, 273–285. [Google Scholar] [CrossRef]
  49. Sawadogo, A.; Hessels, T.; Gündoğdu, K.S.; Demir, A.O.; Mustafa, Ü.; Zwart, S.J. Comparative analysis of the pysebal model and lysimeter for estimating actual evapotranspiration of soybean crop in Adana, Turkey. Int. J. Eng. Geosci. 2020, 5, 60–65. [Google Scholar] [CrossRef]
  50. Ghisi, T.; Fischer, M.; Nieto, H.; Kowalska, N.; Jocher, G.; Homolová, L.; Burchard-Levine, V.; Žalud, Z.; Trnka, M. Evaluation of the METRIC and TSEB remote sensing evapotranspiration models in the floodplain area of the Thaya and Morava Rivers. J. Hydrol. Reg. Stud. 2024, 53, 101785. [Google Scholar] [CrossRef]
  51. Jiao, Y.; Zhang, F.; Huang, Q.; Liu, X.; Li, L. Analysis of Interpolation Methods in the Validation of Backscattering Coefficient Products. Sensors 2023, 23, 469. [Google Scholar] [CrossRef] [PubMed]
  52. Kandra, B.; Tall, A.; Gomboš, M.; Pavelková, D. Quantification of Evapotranspiration by Calculations and Measurements Using a Lysimeter. Water 2023, 15, 373. [Google Scholar] [CrossRef]
  53. Vilček, J.; Torma, S. Winter wheat (Triticum aestivum L.) growth potential in the Slovak rural landscape. Arch. Agron. Soil Sci. 2016, 62, 235–245. [Google Scholar] [CrossRef]
  54. TheGlobalEconomy.com. Global Economy, World Economy. Available online: https://www.theglobaleconomy.com/ (accessed on 10 October 2025).
  55. The National Council of the Slovak Republic. Law No. 220/2004 Coll. Act on the Protection and Use of Agricultural Land and Amending Act No. 245/2003 Coll. on Integrated Pollution Prevention and Control and in Amendments to Certain Acts; The National Council of the Slovak Republic: Bratislava, Slovak Republic; Available online: https://www.zakonypreludi.sk/zz/2004-220 (accessed on 13 October 2025). (In Slovak)
  56. European Union. Regulation (EU) No 1305/2013 of the European Parliament and of the Council of 17 December 2013 on support for rural development by the European Agricultural Fund for Rural Development (EAFRD) and repealing Council Regulation (EC) No 1698/2005. Off. J. Eur. Union 2013, 20. Available online: http://data.europa.eu/eli/reg/2013/1305/oj (accessed on 10 October 2025).
  57. Nistor, M.-M.; Satyanaga, A.; Dezsi, Ş.; Haidu, I. European Grid Dataset of Actual Evapotranspiration, Water Availability and Effective Precipitation. Atmosphere 2022, 13, 772. [Google Scholar] [CrossRef]
  58. Ahmadpour, S.; Bayzidi, Y.; Trachte, K. Spatio-temporal patterns of evapotranspiration in the temperate Eastern German lowlands and its response to climate and land use change. Theor. Appl. Climatol. 2025, 156, 307. [Google Scholar] [CrossRef]
  59. Allen, R.G.; Pereira, L.S.; Raes, D.; Smith, M. Crop Evapotranspiration: Guidelines for Computing Crop Water Requirements; FAO Irrigation and Drainage Paper No. 56; Food and Agriculture Organization of the United Nations (FAO): Rome, Italy, 1998; p. 300. [Google Scholar]
  60. Trout, T.J.; DeJonge, K.C. Evapotranspiration and Water Stress Coefficient for Deficit-Irrigated Maize. J. Irrig. Drain. Eng. 2021, 147, 04021044. [Google Scholar] [CrossRef]
  61. Fendeková, M. Major Droughts in Slovakia in the Twenty-First Century. In Water Resources in Slovakia: Part II: Climate Change, Drought and Floods; Negm, A.M., Zeleňáková, M., Eds.; Springer International Publishing: Cham, Switzerland, 2019; pp. 125–144. [Google Scholar]
  62. Nikoloa, N.; Nejedlík, P.; Lapin, M. Temporal variability and spatial distribution of drought events in the lowlands of Slovakia. Geofizika 2016, 33, 119–135. [Google Scholar] [CrossRef]
  63. Bolton, M.D.; Kolmer, J.A.; Garvin, D.F. Wheat leaf rust caused by Puccinia triticina. Mol. Plant Pathol. 2008, 9, 563–575. [Google Scholar] [CrossRef]
  64. Pozo, A.d.; Méndez-Espinoza, A.M.; Castillo, D. Chapter 13—Triticale. In Neglected and Underutilized Crops; Farooq, M., Siddique, K.H.M., Eds.; Academic Press: Cambridge, MA, USA, 2023; pp. 325–362. [Google Scholar] [CrossRef]
  65. Hanzalová, A.; Šliková, S.; Hudcovicová, M.; Klčová, L.; Gregová, E. Virulence of wheat leaf rust (Puccinia triticina Eriks.) and Lr resistance genes in wheat cultivars in the Slovak Republic in the years 2016-2019. Cereal Res. Commun. 2021, 50, 281–286. [Google Scholar] [CrossRef]
  66. Hanzalová, A.; Sumíková, T.; Huszár, J.; Bartoš, P. Physiologic specialization of wheat leaf rust (Puccinia triticina Eriks.) in the Slovak Republic in 2009-2011. Czech J. Genet. Plant Breed. 2012, 48, 101–107. [Google Scholar] [CrossRef]
  67. Panagos, P.; Borrelli, P.; Poesen, J.; Ballabio, C.; Lugato, E.; Meusburger, K.; Montanarella, L.; Alewell, C. The new assessment of soil loss by water erosion in Europe. Environ. Sci. Policy 2015, 54, 438–447. [Google Scholar] [CrossRef]
  68. Xiao, H.; Li, Z.; Chang, X.; Huang, B.; Nie, X.; Liu, C.; Liu, L.; Wang, D.; Jiang, J. The mineralization and sequestration of organic carbon in relation to agricultural soil erosion. Geoderma 2018, 329, 73–81. [Google Scholar] [CrossRef]
  69. Petrikovičová, L.; Rampašeková, Z.; Sobocká, J. A Detailed Identification of Erosionally Endangered Agricultural Land in Slovakia (Case Study of Nitra Upland). Sustainability 2020, 12, 4863. [Google Scholar] [CrossRef]
  70. Bayram, C.A.; Şimşek Semercioğlu, T.; Büyük, G.; Akça, E.; Kalkancı, N. The effect of altitude on soil organic carbon content in semi-arid mediterranean climate. Int. J. Agric. Environ. Food Sci. 2023, 7, 192–196. [Google Scholar] [CrossRef]
  71. Zhu, Y.; Li, W.; Wang, D.; Wu, Z.; Shang, P. Spatial Pattern of Soil Erosion in Relation to Land Use Change in a Rolling Hilly Region of Northeast China. Land 2022, 11, 1253. [Google Scholar] [CrossRef]
  72. Burke, J.A.; Lewis, K.L.; Ritchie, G.L.; DeLaune, P.B.; Keeling, J.W.; Acosta-Martinez, V.; Moore, J.M.; McLendon, T. Net positive soil water content following cover crops with no tillage in irrigated semi-arid cotton production. Soil Tillage Res. 2021, 208, 104869. [Google Scholar] [CrossRef]
  73. Agency, E.E. Water and Agriculture: Towards Sustainable Solutions; European Environment Agency: Copenhagen, Denmark, 2021. [Google Scholar]
  74. Pais, I.P.; Moreira, R.; Semedo, J.N.; Ramalho, J.C.; Lidon, F.C.; Coutinho, J.; Maçãs, B.; Scotti-Campos, P. Wheat Crop under Waterlogging: Potential Soil and Plant Effects. Plants 2023, 12, 149. [Google Scholar] [CrossRef] [PubMed]
  75. Vitosh, M. Wheat Fertility and Fertilization; Michigan State University, Cooperative Extension Service: Traverse City, MI, USA, 1998. [Google Scholar]
  76. Pichler, V.; Bublinec, E.; Gregor, J. Acidification of forest soils in Slovakia—Causes and consequences. J. For. Sci. 2006, 52, S23–S27. [Google Scholar] [CrossRef]
  77. Hartl, W.; Erhartl, E. Effects of potassium carbonate as an alternative road de-icer to sodium chloride on soil chemical properties. Ann. Appl. Biol. 2002, 140, 271–277. [Google Scholar] [CrossRef]
  78. Shu, L.; Lu, X.; Jegatheesan, V.; Jegatheesan, L. Investigating pH and other electrical properties of potassium salt solutions. Food Chem Adv. 2023, 2, 100210. [Google Scholar] [CrossRef]
Figure 1. Spatial distribution of winter wheat study sites.
Agronomy 15 02462 g001
Figure 2. Scatterplots comparing Lysimeter and PySEBAL ETa at satellite overpass dates (A) and interpolated dates (B,C).
Agronomy 15 02462 g002
Figure 3. Scatterplots of PySEBAL-derived versus random forest predicted wheat crop actual evapotranspiration under training (A), and validation (B) dataset.
Agronomy 15 02462 g003
Figure 4. Variable importance contribution in terms of mean decrease accuracy of all potential predictors of ETa. Abbreviations: Altitude (Alt); Bulk Density (Bulk); Calcium Carbonates (CaCO3); Cation Exchange Capacity (CEC); Clay (Clay); Carbon to Nitrogen ratio (C/N); USDA soil textural classes (Text_USDA); Extractable Potassium Content (K); Total Nitrogen Content (N); Phosphorous Content (P); Potential of Hydrogen in CaCl2 (pH); Organic Carbon (C); Soil Loss by Water Erosion (Ero); Soil Erodibility (k_Factor); Aridity Index (Ari); Wind Speed (Win); Solar Radiation (Rad); Relative Humidity (RH); Maximum Temperature (Temp); Cover Management factor (CF); Only tillage CF (CF_Till); Only residues CF (CF_Res); Only cover crops CF (CF_Cov); Area Actually Irrigated (AAI); Area Equipped for Irrigation (AEI).
Agronomy 15 02462 g004
Figure 5. Partial dependence plot of the ten top predictors of PySEBAL-derived wheat crop actual evapotranspiration based on random forest modeling. (A) Wind Speed; (B) Relative Humidity; (C) Solar Radiation; (D) Altitude; (E) Cover Management factor; (F) pH; (G) Aridity Index; (H) Temperature; (I) Soil Erosion; (J) Area Actually Irrigated.
Agronomy 15 02462 g005aAgronomy 15 02462 g005b
Figure 6. Network visualization of the relationship between ETa and the ten main predictors. Abbreviations: Abbreviations: Altitude (Alt); Soil Loss by Water Erosion (Ero); Aridity Index (Ari); Wind Speed (Win); Solar Radiation (Rad); Potential of Hydrogen (pH); Relative Humidity (RH); Maximum Temperature (Temp); Cover Management factor (CF); Area Actually Irrigated (AAI).
Agronomy 15 02462 g006
Figure 7. Two-dimensional partial dependence plots showing interactions between the aridity index and some predictors (soil erosion, pH, Area Actually Irrigated, and cover management factor) on ETa using the RF model. (Additional plots are provided in Figure S5).
Agronomy 15 02462 g007aAgronomy 15 02462 g007bAgronomy 15 02462 g007c
Table 1. ANOVA results for winter wheat crop sowing and harvesting dates (Number of sites N = 261).
Sowing Dates
DfSum SqMean SqF ValuePr(>F)
Plots475539.17117.851.530.068 n.s.
Years2298.07149.041.930.1551n.s.
Residuals524010.9377.13
Harvesting Dates
DfSum SqMean SqF ValuePr(>F)
Plots5114,070.14275.8912.031.46 × 10−23 ***
Years3665.53221.849.671.37 × 10−5 ***
Residuals892041.6422.94
n.s., non-significant and ***, p < 0.001.
Table 2. Descriptive statistics of PySEBAL-derived ETa values. N = 261.
Cropping SeasonMean (mm)CV (%)Min (mm)Max (mm)
2008/2009466.5017220.00552.80
2011/2012506.123440.40543.97
2014/2015481.458381.59540.20
2017/2018434.8715230.58534.12
Table 3. Descriptive statistics of the soil physico-chemical, weather and crop management variables. N = 261.
CategoryPredictorsUnitMeanMinMaxCV (%)
Soil Altm187.4985.00730.0056
Bulkg cm−31.220.871.4211
CaCO3g kg−128.580.00125.6856
CECcmol(+) kg−120.7111.8328.3516
Clay%28.4016.8454.9121
C/N-9.948.4212.246
Text_USDA-5.732.009.0045
Kmg kg−1256.86114.38396.1221
Ng kg−11.730.932.9217
Pmg kg−133.4818.5049.5017
pH-6.485.037.577
Cg kg−116.5012.3448.5629
Erot ha−12.410.4812.8878
k_Factort ha h ha−1 MJ−1 mm−10.040.030.0613
WeatherAri-0.230.130.2713
Winm s−12.941.314.2320
RadKJ m−2 day−110,472.159115.3711,592.526
RH%73.0365.5982.845
Temp°C12.658.6513.747
Crop ManagementCF-0.230.100.259
CF_Till-0.240.220.255
CF_Res-0.270.270.281
CF_Cov-0.270.270.281
AAI% area of 5
minutes resolution
13.760.0044.13101
AEI14.640.0075.09159
Abbreviations: Altitude (Alt); Bulk Density (Bulk); Calcium Carbonates (CaCO3); Cation Exchange Capacity (CEC); Clay (Clay); Carbon to Nitrogen ratio (C/N); USDA soil textural classes (Text_USDA); Extractable Potassium Content (K); Total Nitrogen Content (N); Phosphorous Content (P); Potential of Hydrogen in CaCl2 (pH); Organic Carbon (C); Soil Loss by Water Erosion (Ero); Soil Erodibility (k_Factor); Aridity Index (Ari); Wind Speed (Win); Solar Radiation (Rad); Relative Humidity (RH); Maximum Temperature (Temp); Cover Management factor (CF).; Only tillage CF (CF_Till); Only residues CF (CF_Res); Only cover crops CF (CF_Cov); Area Actually Irrigated (AAI); Area Equipped for Irrigation (AEI).
Disclaimer/Publisher’s Note: The statements, opinions and data contained in all publications are solely those of the individual author(s) and contributor(s) and not of MDPI and/or the editor(s). MDPI and/or the editor(s) disclaim responsibility for any injury to people or property resulting from any ideas, methods, instructions or products referred to in the content.