Article

Integrative Transcriptomic and Metabolomic Analysis Reveals Regulatory Networks and Metabolite Dynamics in Gastrodia elata Flower Development

1
School of Pharmacy, Guizhou University of Traditional Chinese Medicine, Guiyang 550025, China
2
School of Basic Medicine, Guizhou University of Traditional Chinese Medicine, Guiyang 550025, China
3
Faculty of Agronomy, Jilin Agricultural University, Changchun 130118, China
4
Department of Biology, University of British Columbia Okanagan, Kelowna, BC V1V 1V7, Canada
*
Authors to whom correspondence should be addressed.
Agronomy 2025, 15(2), 441; https://doi.org/10.3390/agronomy15020441
Submission received: 17 January 2025 / Revised: 6 February 2025 / Accepted: 10 February 2025 / Published: 11 February 2025

Abstract

:
Flower development, a vital phase in the plant life cycle, involves intricate physiological and morphogenetic processes driven by dynamic molecular and metabolic processes. However, the specific molecular mechanisms and metabolite accumulation patterns during Gastrodia elata flower development remain largely unknown. This study utilized Illumina’s next-generation sequencing to analyze the G. elata flower transcriptome across three critical developmental stages, capturing gene expression changes, particularly those related to transcription factors that regulate flower formation and metabolite accumulation. FPKM analysis showed significant transcriptomic changes during G. elata flower development, while targeted metabolomics identified key metabolites with stage-specific variations via widely targeted metabolic profiling. Here, integrative transcriptome and metabolome analyses were performed to investigate floral genes and compounds in G. elata flowers at three different developmental stages. The differentially expressed genes (DEGs) and significant changes in metabolites (SCMs) involved in key biological pathways were identified. This approach aimed to identify functional genes or pathways jointly enriched in metabolites, thereby defining pathways linked to crucial biological phenotypes. By mapping DEGs and SCMs to KEGG pathways, the comprehensive network was constructed, uncovering functional relationships between gene expression and metabolite accumulation. This study proposes dynamic models of transcriptomic and metabolite changes, revealing key regulatory networks that govern G. elata flower development and potential applications.

1. Introduction

The traditional Chinese medicinal plant Gastrodia elata Bl., known as TianMa in China, has been used for centuries to prevent and treat conditions such as childhood convulsions, sciatic neuropathy, memory loss, epilepsy, and other disorders [1,2]. Pharmacological studies indicate that G. elata and its extracts offer a variety of therapeutic effects, including anti-tumor, antioxidant, and anti-aging benefits, and also exhibit sedative, hypoglycemic, immunoregulatory, antidepressant, hypolipidemic, antiviral, and anticonvulsant activities [3]. As a rootless and leafless plant, G. elata cannot perform photosynthesis, instead relying on symbiosis with fungi for survival [4,5]. Its life cycle, spanning three years from seed germination to flowering, includes five distinct stages: seed germination, protocorm development, initial asexual reproduction forming immature tubers, secondary asexual reproduction producing mature tubers, and finally, bolting, flowering, and seed setting. During this final stage, a scape emerges from the mature tuber, supporting the developing flower that produces seeds in summer [6]. Increasing demand and habitat loss have led to a significant decline in wild G. elata populations, classifying it as a category II protected species in China and highlighting the urgent need for conservation.
Flower development, a pivotal phase in the plant life cycle, means the transition from vegetative growth to reproductive development [7]. The ABC model of flower development classifies the genes involved in the differentiation of floral organs into A, B, and C, which regulate the development of petals, pistils, stamens, and calyx [8]. Studies focus on the flowering process, including the morphological structure of flowers, nutrients, and genes, in order to elucidate the morphological and biological characteristics [9,10]. Flower development is a highly coordinated process essential for successful fertilization and propagation. Understanding the molecular basis of this developmental process requires a system-based approach, often facilitated by omics studies.
Next-generation sequencing (NGS) technologies, such as Roche/454 and Illumina HiSeq, provide high-throughput, cost-effective sequencing capabilities, making them invaluable for de novo sequencing, genome resequencing, and transcriptome analysis [11]. Analyses of NGS data provide critical functional insights into the molecular mechanisms governing gene expression [12], particularly in model organisms with reference genomes [13], including G. elata [5,14,15,16,17,18]. Illumina paired-end sequencing has revealed dynamic transcriptome changes during flower development across a wide range of plants, including wintersweet (Chimonanthus praecox) [19], Arabidopsis [20], tea (Camellia sinensis (L.)) [21], Lei bamboo (Phyllostachys violascens) [22], Vaccinium corymbosum [23], Lycoris radiata [24], Gastrodia [25], Frankliniella occidentalis [26], Chrysanthemum [27], Vaccinium corymbosum [28], Cardiocrinum giganteum [29], and Pogostemon cablin [30]. These studies elucidate complex gene expression patterns and flowering phenotypes, providing valuable insights into the intricacies of flower development in diverse plant species.
Metabolite profiling, a valuable approach for studying flower development, has shown that metabolite levels directly impact plant phenotypes, positioning metabolomics as a crucial tool for understanding dynamic changes in metabolite levels throughout flower development. This approach enables the identification of metabolites by mapping their roles within metabolic networks, functions, and pathways. Recently, integrating metabolomics with transcriptomics has provided deeper insights into the biosynthetic mechanisms underlying essential metabolic pathways, especially those associated with medicinally valuable bioactive plant compounds. Studies on Chrysanthemum indicum var. aromaticum [31], Pogostemon cablin [30], Gloriosa superba [32], Lonicera macranthoides [33], and Chinese orchid (Cymbidium sinense) [34] illustrate the value of this integrative approach. However, despite these advances, the molecular and biochemical mechanisms regulating flower development in G. elata remain unclear due to limited data on basal transcriptional differences across its developmental stages.
In this study, we collected G. elata flowers at three developmental stages and analyzed them using Illumina paired-end sequencing technology, establishing a comprehensive flower transcriptome database. Concurrently, we conducted metabolome profiling to identify and characterize dynamic changes in metabolite accumulation throughout flower development. Our findings offer new insights into the molecular mechanisms governing the biosynthesis and regulation of metabolites in G. elata flowers across developmental stages, underscoring the value of integrated approaches in elucidating this complex developmental process.

2. Materials and Methods

2.1. Plant Materials

Gastrodia elata Bl. plants were used in this study. G. elata were provided by Dr. Hongyu Chen (Guizhou University of Traditional Chinese Medicine). Two-year-old G. elata plants were grown at 25 °C with a 16 h light/8 h dark cycle prior to harvesting. Flowers were collected between 20 June and 30 June 2024 from nine G. elata plants. Three flower developmental stages (Stage 1: TMH1; Stage 2: TMH2; Stage 3: TMH3) were selected for transcriptomic analysis. Each stage was analyzed with three biological replicates.

2.2. RNA Extraction and Illumina Sequencing

Total RNA was extracted from flowers using the cetyltrimethylammonium bromide (CTAB) method and dissolved in 50 µL of DEPC-treated water. RNA quality and quantity were assessed using a Qubit fluorometer and a Qsep400 high-throughput Bio-Fragment Analyzer. RNA sequencing (RNA-Seq) was conducted by Wuhan Metware Biotechnology Co., Ltd. (Wuhan, China). By utilizing the structural characteristic that most eukaryotic mRNAs carry a polyA tail, mRNAs with polyA tails were enriched by Oligo(dT) magnetic beads. The purified mRNAs were cleaved into small fragments with a fragmentation buffer at a suitable temperature. First-strand cDNAs were produced by reverse transcription using a random hexamer primer; second-strand cDNAs were synthesized (strand-specific library: dUTPs were used instead of dTTPs in the second-strand synthesis to incorporate dUTPs in the second-strand cDNAs, while the high-fidelity DNA polymerase used in this method could not amplify uracil-containing DNA templates, thus realizing the strand specificity), while simultaneously performing end repair and dA-Tailing. Sequencing adapter ligation was performed, followed by DNA magnetic bead purification and fragment selection after ligation was completed to yield a library with 250–350 bp insert fragments. The ligated products were amplified by PCR and purified again using DNA magnetic beads, where the products were solubilized with nuclear-free water. After the initial library was constructed, a Qubit fluorescence quantifier was used for concentration detection, followed by a Qsep400 high-throughput biofragment analyzer for fragment size detection. Finally, the effective concentration of the library was accurately quantified using Q-PCR. After passing the library check, the different libraries were sequenced in Illumina after pooling them according to the effective concentration and the target sequencing output data volume, yielding 150 bp paired-end reads. The basic principle of sequencing is to synthesize and sequence at the same time. Four types of fluorescently labeled dNTPs, DNA polymerase, and junction primers were added to the sequencing flow cell for amplification. When extending the complementary strand of each sequencing cluster, each fluorescently labeled dNTP added emits corresponding fluorescence, and the sequencer captures the fluorescence signals and converts the light signals into sequencing peaks through computer software, so as to obtain the sequence information of the fragment to be tested.
Data quality was assessed using fastp and then adapter sequences were removed. Paired reads were discarded under two conditions: (1) the number of ambiguous bases (N) in any sequencing read exceeded 10% of its length or (2) if any read contained low-quality bases (Q ≤ 20) in over 50% of its length. Clean reads were used for all subsequent analyses. Sequence alignments to the reference genome were performed using the reference genome and annotation files were downloaded from a specified website. After HISAT [35] was used to build an index, clean reads were aligned to the reference genome. Novel transcripts were predicted using StringTie, which employs network flow algorithms and optional de novo transcript assembly. Compared to other software, such as Cufflinks, StringTie generates more complete and accurate transcripts with faster processing.
Gene expression levels were quantified using the feature Counts to calculate gene alignment statistics. Subsequently, FPKM (fragments per kilobase per million mapped reads) values were calculated for each gene based on gene length, as FPKM is widely used for estimating gene expression levels. Differential gene expression analysis was conducted using DESeq2 [36] with Benjamini–Hochberg correction for p-values. Corrected p-values and log2 fold change values were set as thresholds for significant differential expression. Enrichment analysis of differentially expressed genes (DEGs) was performed using the hypergeometric test, with pathway enrichment conducted via the Kyoto Encyclopedia of Genes and Genomes (KEGG) [37] and term-based enrichment conducted via gene ontology (GO).

2.3. Quantitative Real-Time PCR Analysis

To validate the transcript abundance of genes analyzed through RNA-Seq, quantitative real-time PCR (qRT-PCR) was conducted using AceQ® qPCR SYBRR Green Master Mix (Vazyme) on a RealTime PCR System (Roche, LightCycler 480 II, 384-well format). RNA preparations from G. elata used in RNA-Seq were reverse-transcribed into cDNA, and three technical replicates were generated for each qRT-PCR sample. Single amplicons were confirmed by melting curve analysis and gel electrophoresis of the final product. The cycle threshold (CT) value of each gene was normalized to the reference gene, and relative fold changes in expression were calculated using the ΔΔCT method as previously described [38].

2.4. Widely Targeted Metabolic Profiling

Each biological sample was freeze-dried under vacuum using a lyophilizer (Scientz-100F) and ground to a fine powder using a grinder (MM400 Planetary Ball Mill, Retsch) operated at 30 Hz for 1.5 min. Next, 50 mg of each powdered sample was weighed using an electronic balance (MS105DM) and mixed with 1200 μL of pre-cooled (−20 °C) 70% methanol aqueous internal standard extract (for samples under 50 mg, 1200 μL of extractant per 50 mg sample was used). Samples were vortexed for 30 s at 30 min intervals, and this was repeated six times. After centrifugation at 12,000 rpm for 3 min, the supernatant was collected via aspiration, filtered through a 0.22 μm microporous membrane, and stored in an injection vial for UPLC-MS/MS analysis.
Sample extracts were analyzed using a UPLC-ESI-MS/MS system (UPLC, ExionLCTM AD, https://sciex.com.cn/) coupled to a tandem mass spectrometry system (https://sciex.com.cn/) under the following analytical conditions: UPLC column, Agilent SB-C18 (1.8 µm, 2.1 mm × 100 mm); mobile phase composed of solvent A (pure water with 0.1% formic acid) and solvent B (acetonitrile with 0.1% formic acid). Measurements were performed using a gradient program, starting with 95% A and 5% B, changing linearly over 9 min to 5% A and 95% B, maintained for 1 min, adjusted back to 95% A and 5% B within 1.1 min, and held for 2.9 min. The flow rate was set to 0.35 mL/min, the column oven temperature to 40 °C, and the injection volume to 2 μL. The effluent was directed to an ESI triple–quadrupole–linear ion trap (QTRAP)–MS for analysis.
ESI source parameters were as follows: source temperature 500 °C; ion spray voltage (IS) 5500 V (positive ion mode)/−4500 V (negative ion mode); ion source gas I (GSI), gas II (GSII), and curtain gas (CUR) set at 50, 60, and 25 psi, respectively; and high collision-activated dissociation (CAD). QQQ scans were acquired as multiple reaction monitoring (MRM) experiments with nitrogen as the collision gas and a medium setting. Declustering potential (DP) and collision energy (CE) for individual MRM transitions were optimized with further DP and CE enhancements. Specific MRM transitions were monitored for each period according to the metabolites eluted.
Unsupervised principal component analysis (PCA) was performed using the R function prcomp (www.r-project.org), with data scaled to unit variance before analysis. Hierarchical cluster analysis (HCA) results of samples and metabolites were presented as heatmaps with dendrograms, and Pearson correlation coefficients (PCCs) between samples were calculated using the cor function in R and visualized as heatmaps. Both HCA and PCC analyses were conducted using the ComplexHeatmap R package. For HCA, normalized signal intensities of metabolites (unit variance scaling) were visualized as a color spectrum. In two-group analyses, differential metabolites were identified based on VIP (VIP > 1) and absolute Log2FC (|Log2FC| ≥ 1.0). VIP values were extracted from OPLS-DA results, which included score plots and permutation plots generated using the MetaboAnalystR package in R. Data were log2-transformed and mean-centered before OPLS-DA, with overfitting assessed through a permutation test (200 permutations). Identified metabolites were annotated using the KEGG Compound database (http://www.kegg.jp/kegg/compound/) and mapped to the KEGG Pathway database (https://www.genome.jp/kegg/pathway.html).

3. Results

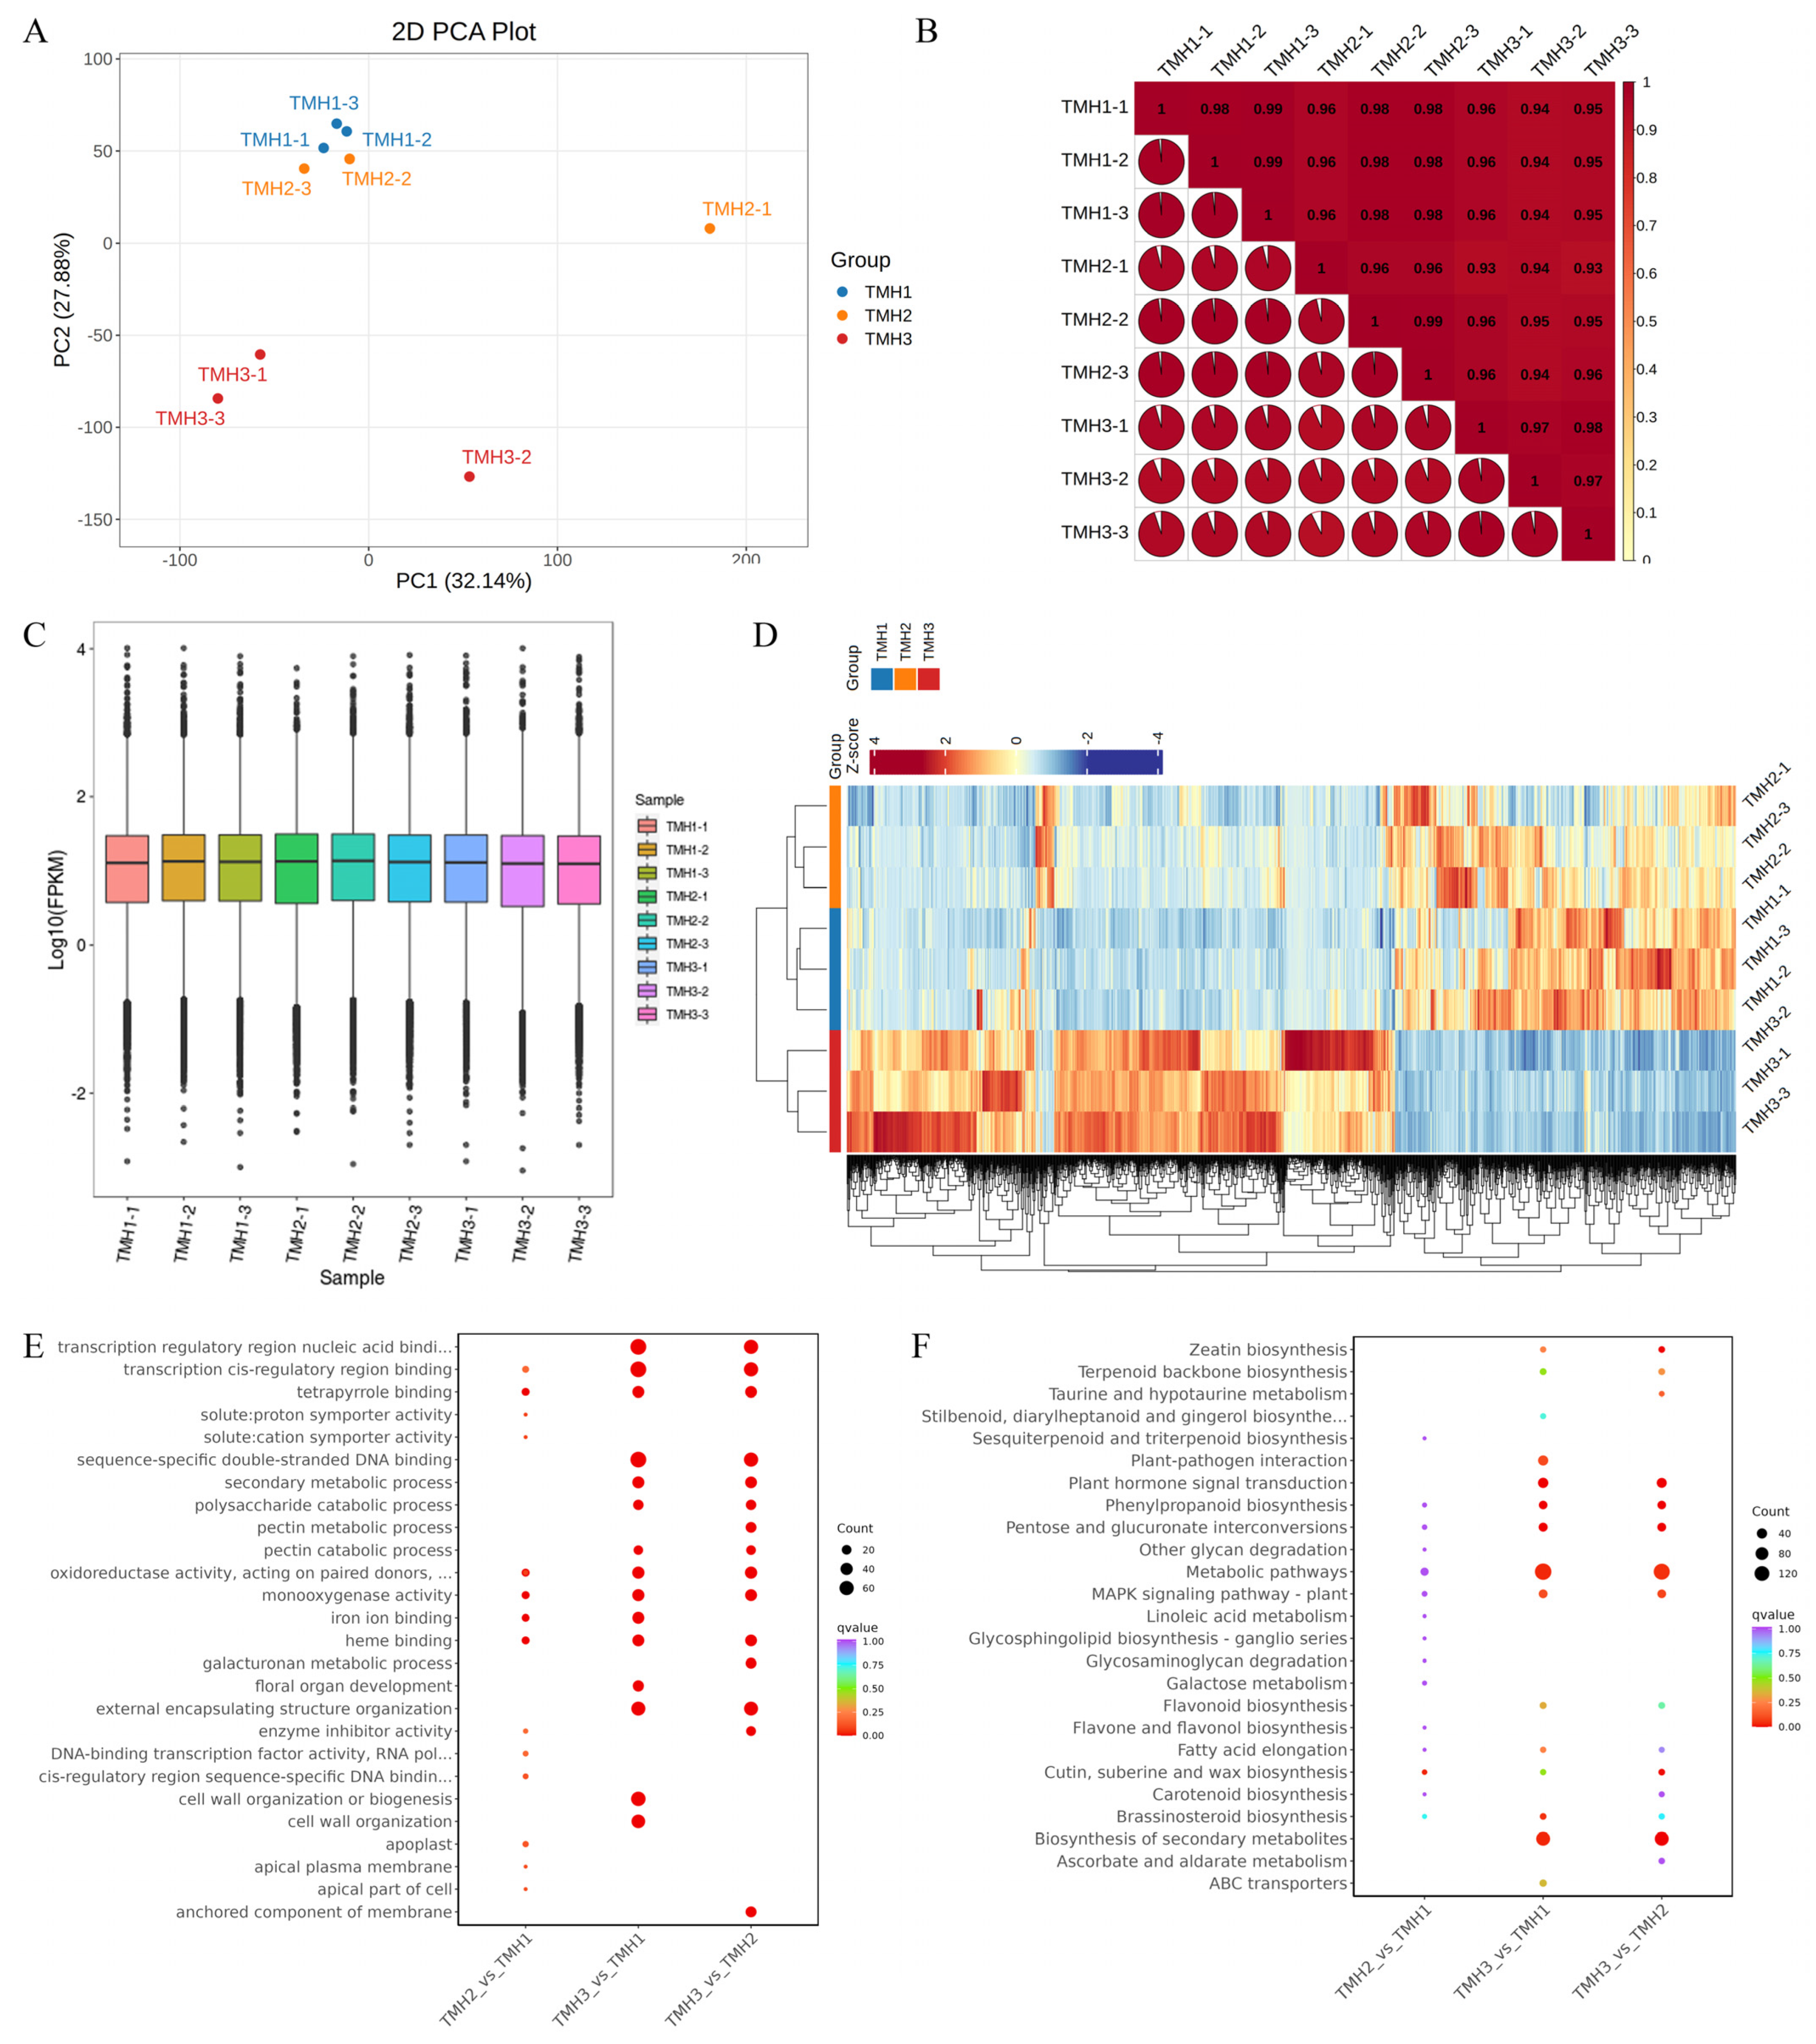
3.1. DEG Analysis in G. elata Flowers During Three Developmental Stages

To elucidate the molecular basis underlying physiological processes in G. elata flower development, we performed comprehensive transcriptome analysis using RNA-Seq Analyzer II, focusing on differential gene expression across three G. elata flower developmental stages (Figure 1). This analysis utilized nine cDNA libraries constructed from total RNA samples. Each sample generated over 45.01 million raw reads, yielding approximately 44.20 million high-quality (clean) reads per sample (Table 1). High sequencing quality was confirmed by a Q30 of ≥93.17% for each sample, ensuring data reliability for subsequent analyses.
Leveraging the published G. elata genome [9], we achieved a satisfactory annotation rate by aligning unigenes against genes or proteins in available databases. We aligned the reads to the complete G. elata reference genome sequence using the HISAT2 tool, and de novo assembly was performed using the Trinity method with default parameters. Notably, 1712 novel loci were identified in the G. elata genome database that were not previously annotated. High-quality reads from the three G. elata flower developmental stages were combined to provide comprehensive transcriptome information, with transcriptomic profiles showing consistency across biological replicates.
In the principal component analysis (PCA), the first principal component (PC1) explained 32.14% of the variation, and the second principal component (PC2) explained 27.88% of the variation (Figure 2A). Correlation analysis explained the strong correlation of sample repetition (Figure 2B). Gene expression changes across the developmental stages of G. elata flowers were analyzed by quantifying the abundance of each gene transcript as FPKM values. The box plot of expressed genes in nine samples is shown in Figure 2C. To validate the RNA-Seq results, several genes were selected for qRT-PCR analysis. Thirteen primer pairs, including one for the G. elata ACTIN gene as a reference, are listed in Table S1. Correlations between RNA-Seq and RT-PCR data indicated significant agreement in gene expression trends across both datasets.
Our results revealed significant changes in the G. elata transcriptome during flower development, as indicated by DEG analysis. A total of 61 genes were upregulated and 39 were downregulated in Stage 2 (TMH2) compared to Stage 1 (TMH1) (Table S2, Figure S1A). In Stage 3 (TMH3), 709 genes were upregulated and 342 were downregulated compared to Stage 2 (TMH2) (Table S2, Figure S1B). Additionally, the correlation heatmap demonstrated a high degree of consistency among the three replicates (Figure 2D). This analysis revealed distinct gene expression patterns across the three developmental stages, suggesting a complex regulatory mechanism involving the regulation of gene expression through the regulation of signal transduction during flower development. To further explore these findings, we analyzed the expression levels of TF families associated with the regulation of these pathways (Table S2). Given the strong correlation between gene expression levels and gene functions, our results suggest that TFs play crucial roles in G. elata growth and development.
Regarding functional enrichment using GO (Figure 2E), Stage 2 vs. Stage 1 was mainly enriched in the cellular anatomical entity (72 DEGs), binding (48 DEGs), catalytic activity (44 DEGs), cellular process (43 DEGs), and metabolic process (40 DEGs). Stage 3 vs. Stage 2 was mainly enriched in the cellular anatomical entity (679 DEGs), cellular process (527 DEGs), binding (468 DEGs), metabolic process (431 DEGs), and catalytic activity (355 DEGs). The KEGG pathway analysis (Figure 2F, Table S3) revealed key pathways associated with flower development, including “metabolic pathways”, “biosynthesis of secondary metabolites”, and “MAPK signaling pathway—plant”, among others in Stage 2 vs. Stage 1. In Stage 3 compared to Stage 2, key pathways associated with flower development, including “metabolic pathways”, “biosynthesis of secondary metabolites”, and “plant hormone signal transduction”, among others, were found.

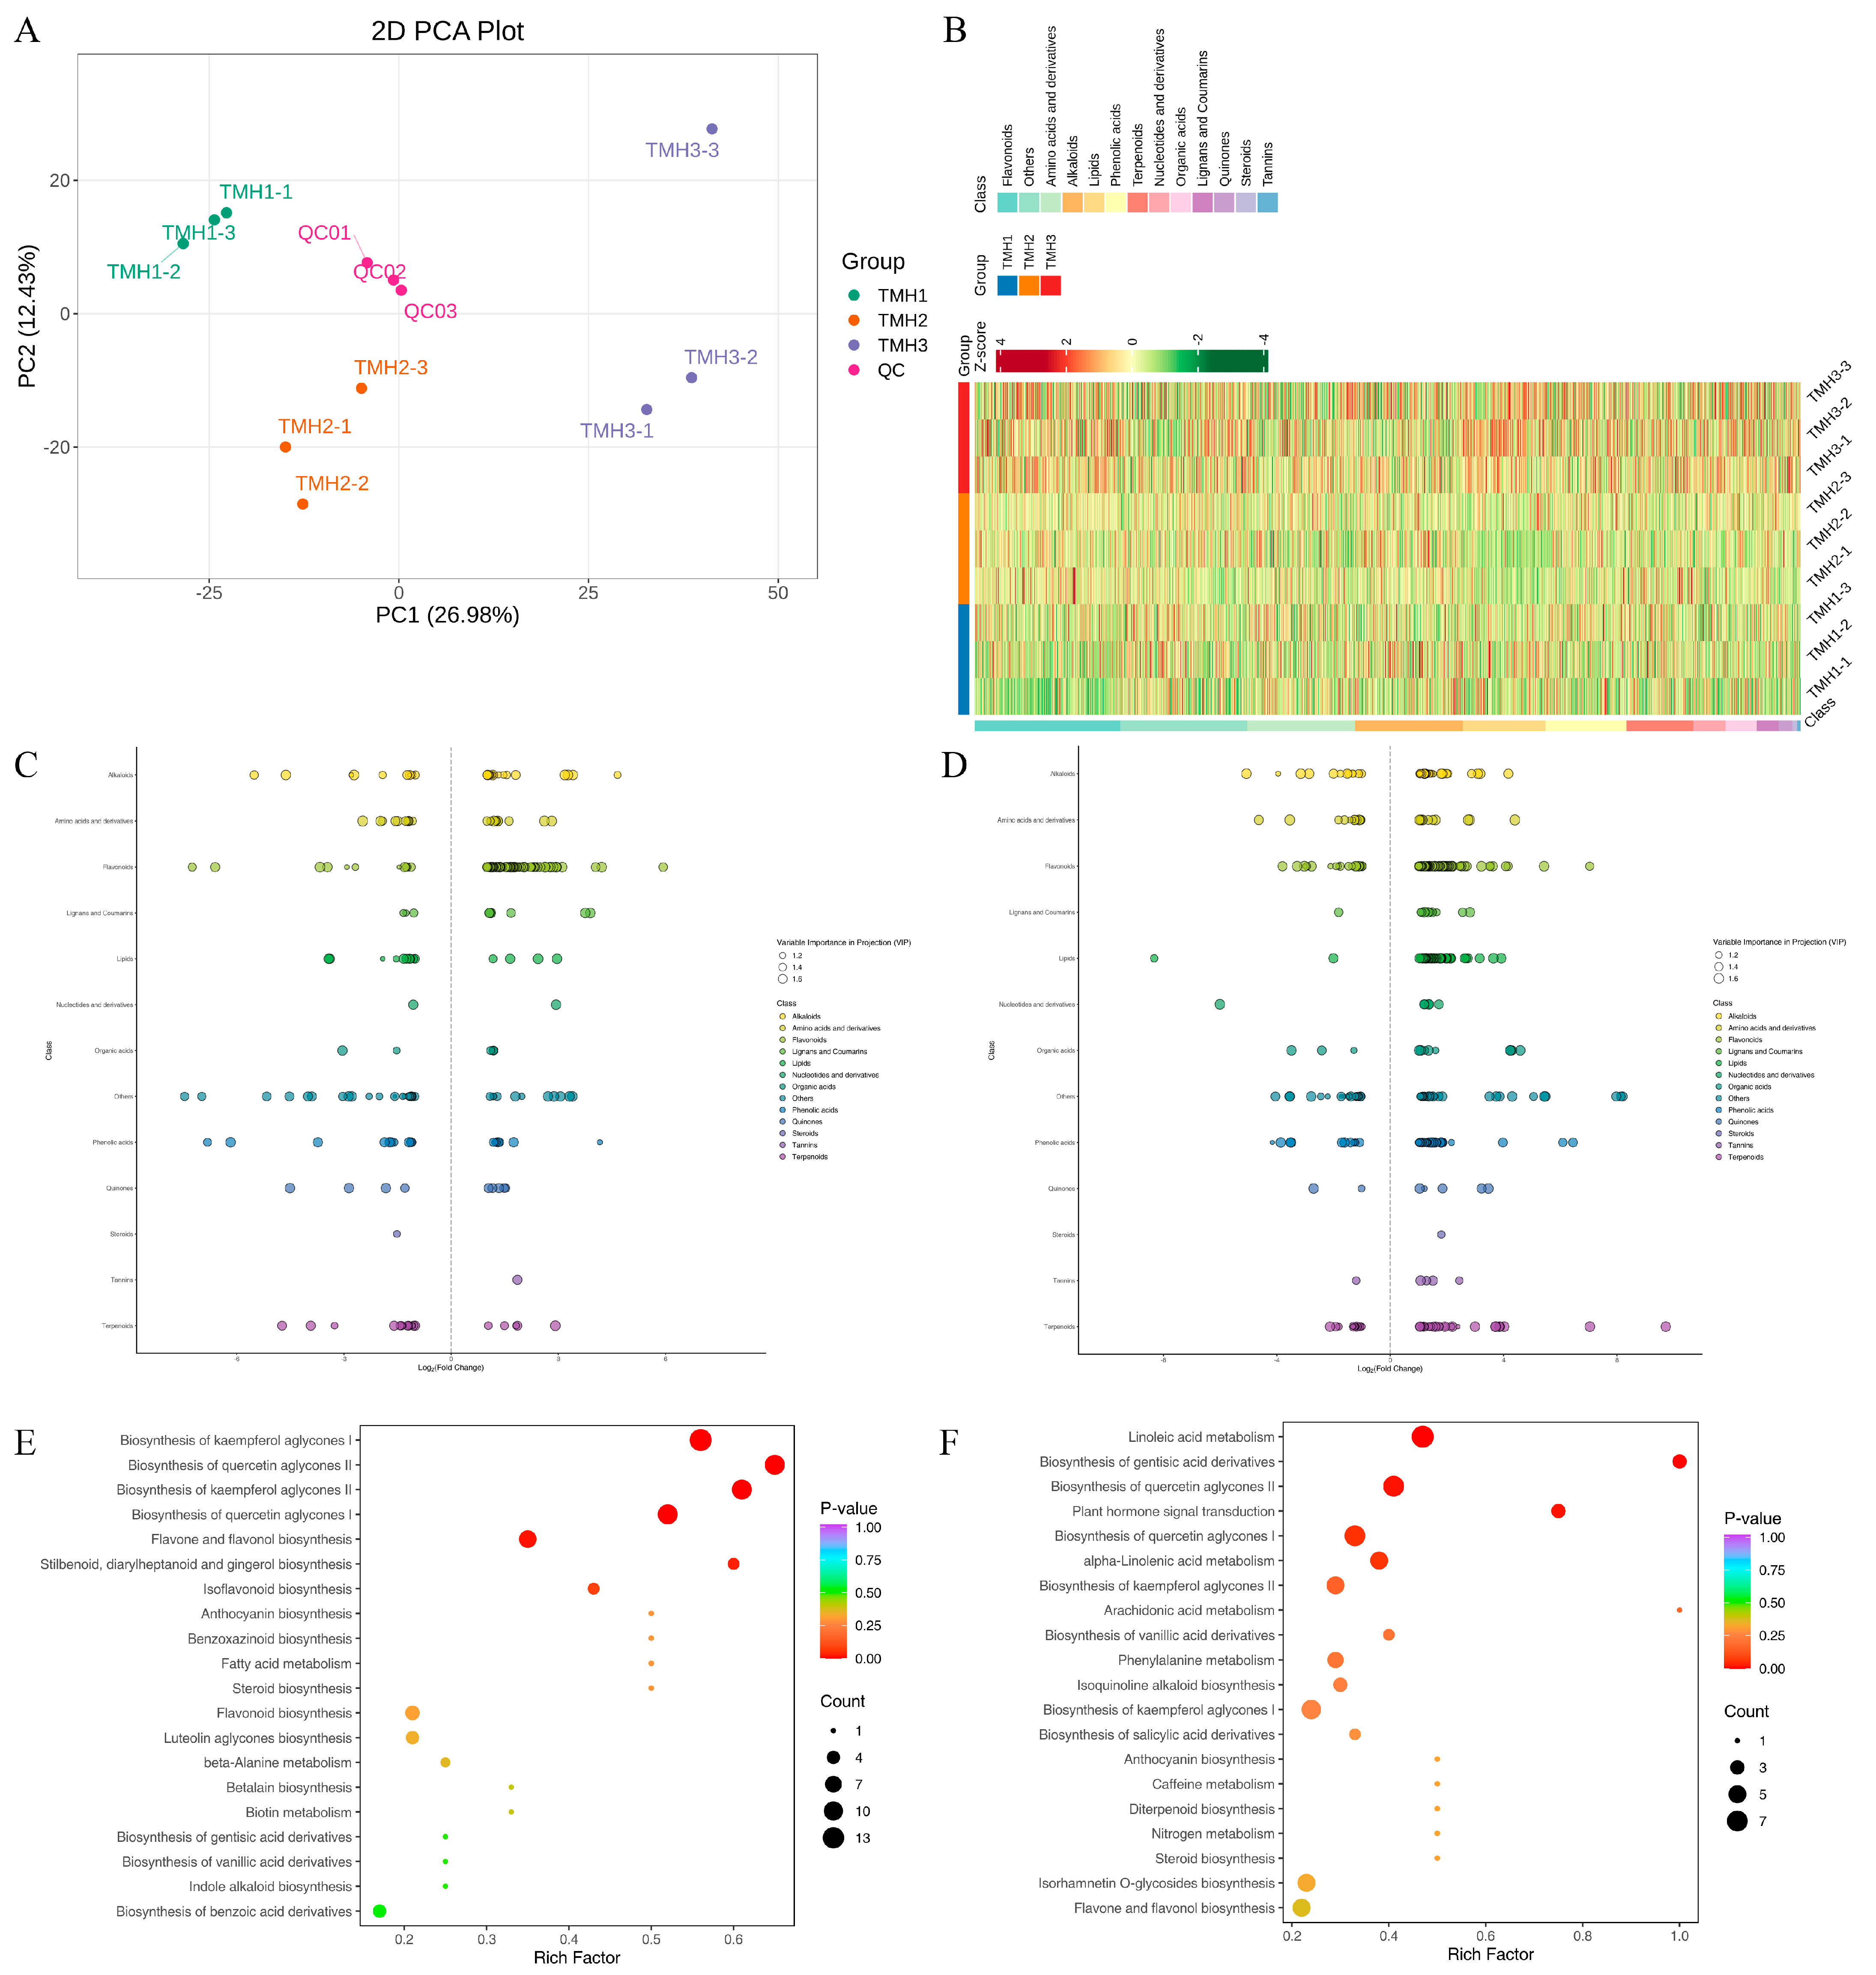
3.2. Metabolic Differences Observed Between Three G. elata Flower Developmental Stages

Principal component analysis (PCA) of the metabolomic data showed a clear separation between Stage 1, Stage 2, and Stage 3 flowers, based on PC1 (26.98%) and PC2 (12.43%) (Figure 3A). Furthermore, OPLS-DA results suggest a highly reliable model (Figure S2). Metabolites were identified and categorized into 30 distinct groups (Table S4). The cluster results (Figure 3B) and PCA results indicated significant differences in metabolites in different samples. The most abundant compound categories included flavonoids (17.63%), amino acids and derivatives (13.05%), alkaloids (13%), lipids (10.08%), phenolic acids (9.76%), terpenoids (8.1%), nucleotides and derivatives (3.87%), organic acids (3.82%), lignans and coumarins (2.65%), quinones (1.66%), steroids (0.54%), and tannins (0.45%).
To identify significantly changed metabolites (SCMs) between the three stages, three biological replicates of flower samples were analyzed. A substantial number of metabolites exhibited differential accumulation between stages (Table S5). Specifically, 165 metabolites showed increased accumulation and 107 showed decreased accumulation in Stage 2 compared to Stage 1 (Figure 3C and Figure S3A, Table S5). In Stage 3 compared to Stage 2, 296 metabolites exhibited increased accumulation, while 114 showed decreased accumulation (Figure 3D and Figure S3B, Table S5). For instance, the relative levels of the following metabolites were notably elevated in Stage 3 compared to Stage 2 flowers, including the following: MWSslk126 (2′-hydroxy-2-methoxychalcone, Class I: flavonoids, Class II: chalcones), Wbmp001561 (nigelline, Class I: alkaloids, Class II: alkaloids), Zblp001600 (delphinidin-3,5-di-O-glucoside, Class I: flavonoids, Class II: anthocyanidins), MWSmce387 (3-O-methylgallic acid, Class I: phenolic acids, Class II: phenolic acids), Zmhp003716 (rhodionidin, Class I: flavonoids, Class II: flavonols), Waptp02740 (6-methoxycoumarin, Class I: lignans and coumarins, Class II: coumarins), Waptp03029 (8-methoxycoumarin, Class I: lignans and coumarins, Class II: coumarins), Lcpp000285 (demethylnupharolidine, Class I: alkaloids, Class II: terpenoid alkaloids), WaTKp05402 (3-ethynylbenzaldehyde, Class I: others, Class II: aldehyde compounds), and MWS2056 (delta-hexalactone, Class I: others, Class II: lactones), among others; these were higher in Stage 2 compared to Stage 1 flowers. Similarly, the relative accumulation levels of Hmyp007081 (oxyphyllenone B, Class I: terpenoids, Class II: sesquiterpenoids), Cmsp006710 (3′,4-dihydroxy-3,5′-dimethoxybibenzyl, Class I: others, Class II: Stilbene), Zblp007216 (3,4-dihydroxy-5,4′-dimethoxybibenzyl, Class I: others, Class II: Stilbene), Zmfn007930 (aloifol I, Class I: others, Class II: Stilbene), Qmkp092205 (nigakilactone R, Class I: terpenoids, Class II: Ditepenoids), Zbbp006589 (medicarpin-3-O-glucoside; Medicocarpin, Class I: flavonoids, Class II: isoflavones), pmp001125 (dendrobin A, Class I: phenolic acids, Class II: phenolic acids), Lmtn002565 (1-O-vanilloyl-beta-D-glucose, Class I: phenolic acids, Class II: phenolic acids), Jmwn004371(4-hydroxyphenethoxy-8-O-D-[6-O-(4-O-D-glucopyranosyl)-sinapoyl]glucopyranoside, Class I: others, Class II: alcohol compounds), and Lcsn007077 (octyl-beta-D-glucopyranoside, Class I: others, Class II: saccharides) were found. These results highlight dynamic metabolic adjustments in flower development in G. elata.
KEGG analyses revealed key pathways in G. elata. These SCMs of Stage 2 vs. Stage 1 were mainly enriched in the biosynthesis of kaempferol aglycones I, the biosynthesis of kaempferol aglycones II, the biosynthesis of quercetin aglycones I, the biosynthesis of quercetin aglycones II, and flavone and flavonol biosynthesis (Figure 3E). And SCMs of Stage 3 vs. Stage 2 were mainly enriched in linoleic acid metabolism, the biosynthesis of quercetin aglycones I, the biosynthesis of quercetin aglycones II, the biosynthesis of kaempferol aglycones I, and alpha-linolenic acid metabolism (Figure 3F).
The complex regulatory dynamics of gene expression and metabolite accumulation across diverse metabolic pathways highlight the intricate nature of G. elata flower development, involving a cascade of transitions managed by a network of interacting genes and signaling pathways. Overall, in this study, a large number of SCMs were detected across the three developmental stages of G. elata flowers. These variations likely influence key processes shaping flower morphology, photosynthesis, and metabolite accumulation by actively participating in metabolic pathways associated with the synthesis and degradation of metabolites essential for flower development. These findings provide new insights into G. elata flower development and lay the foundation for future research in functional genomics and medicinal applications.

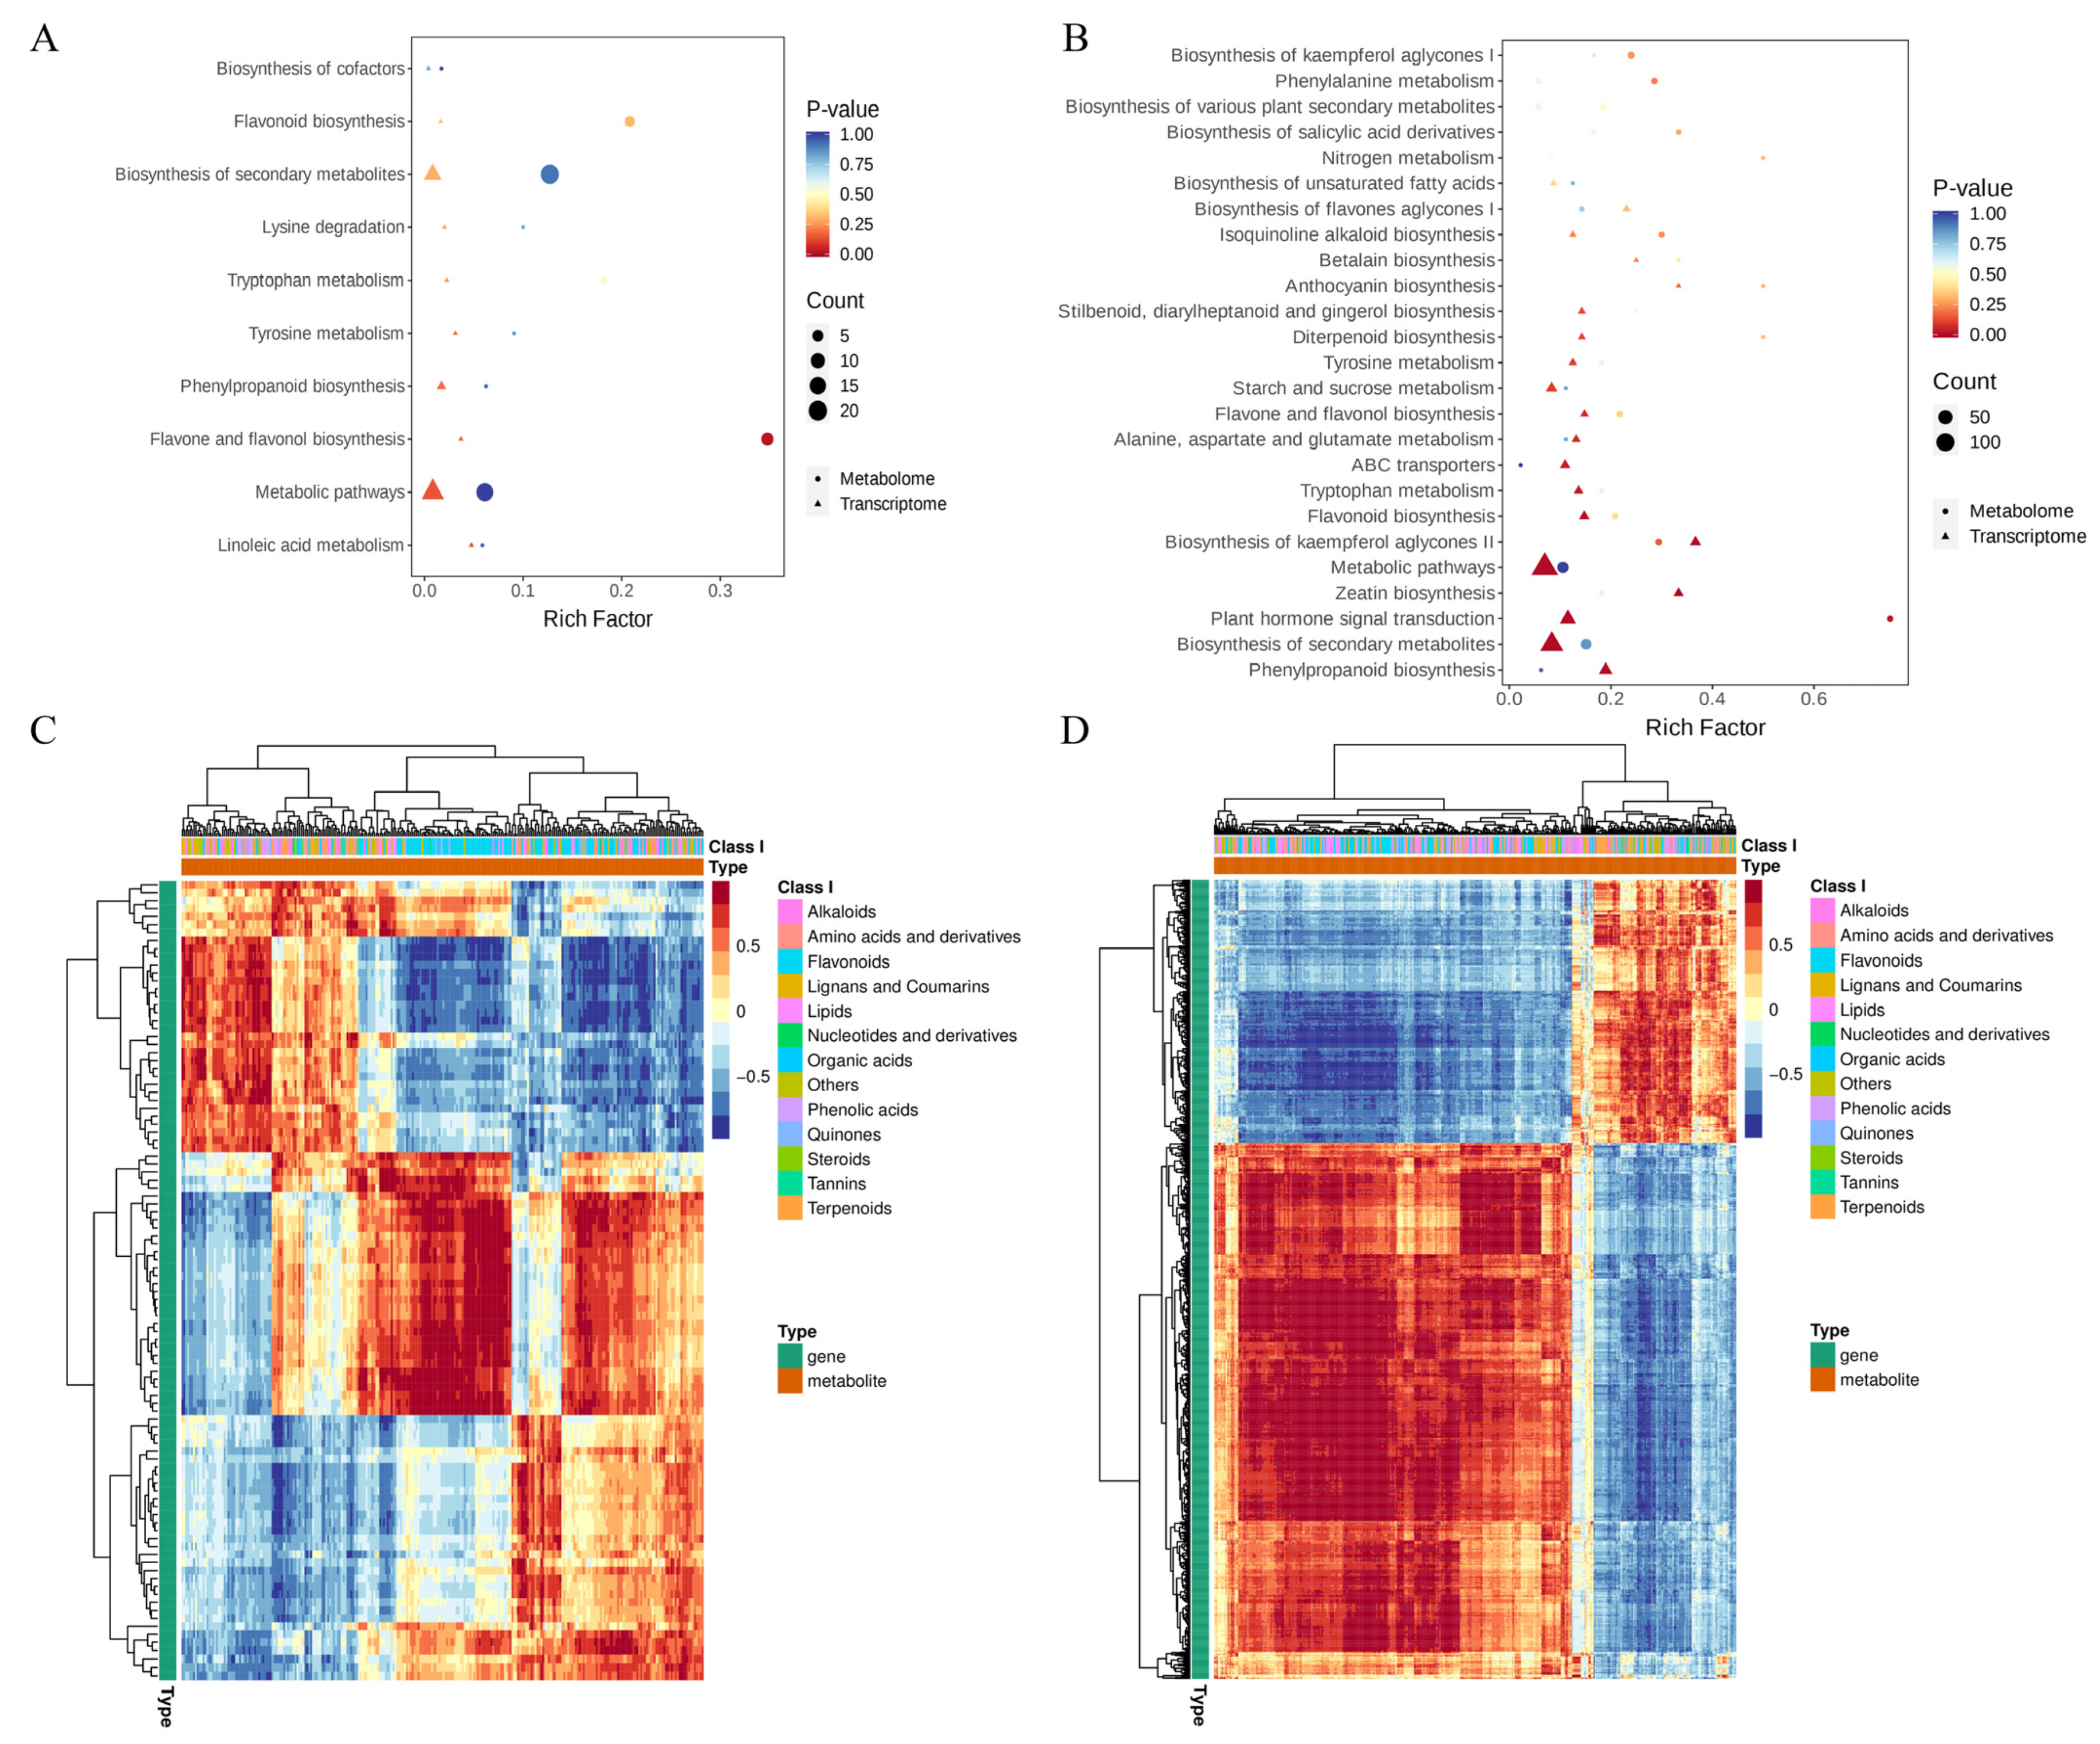
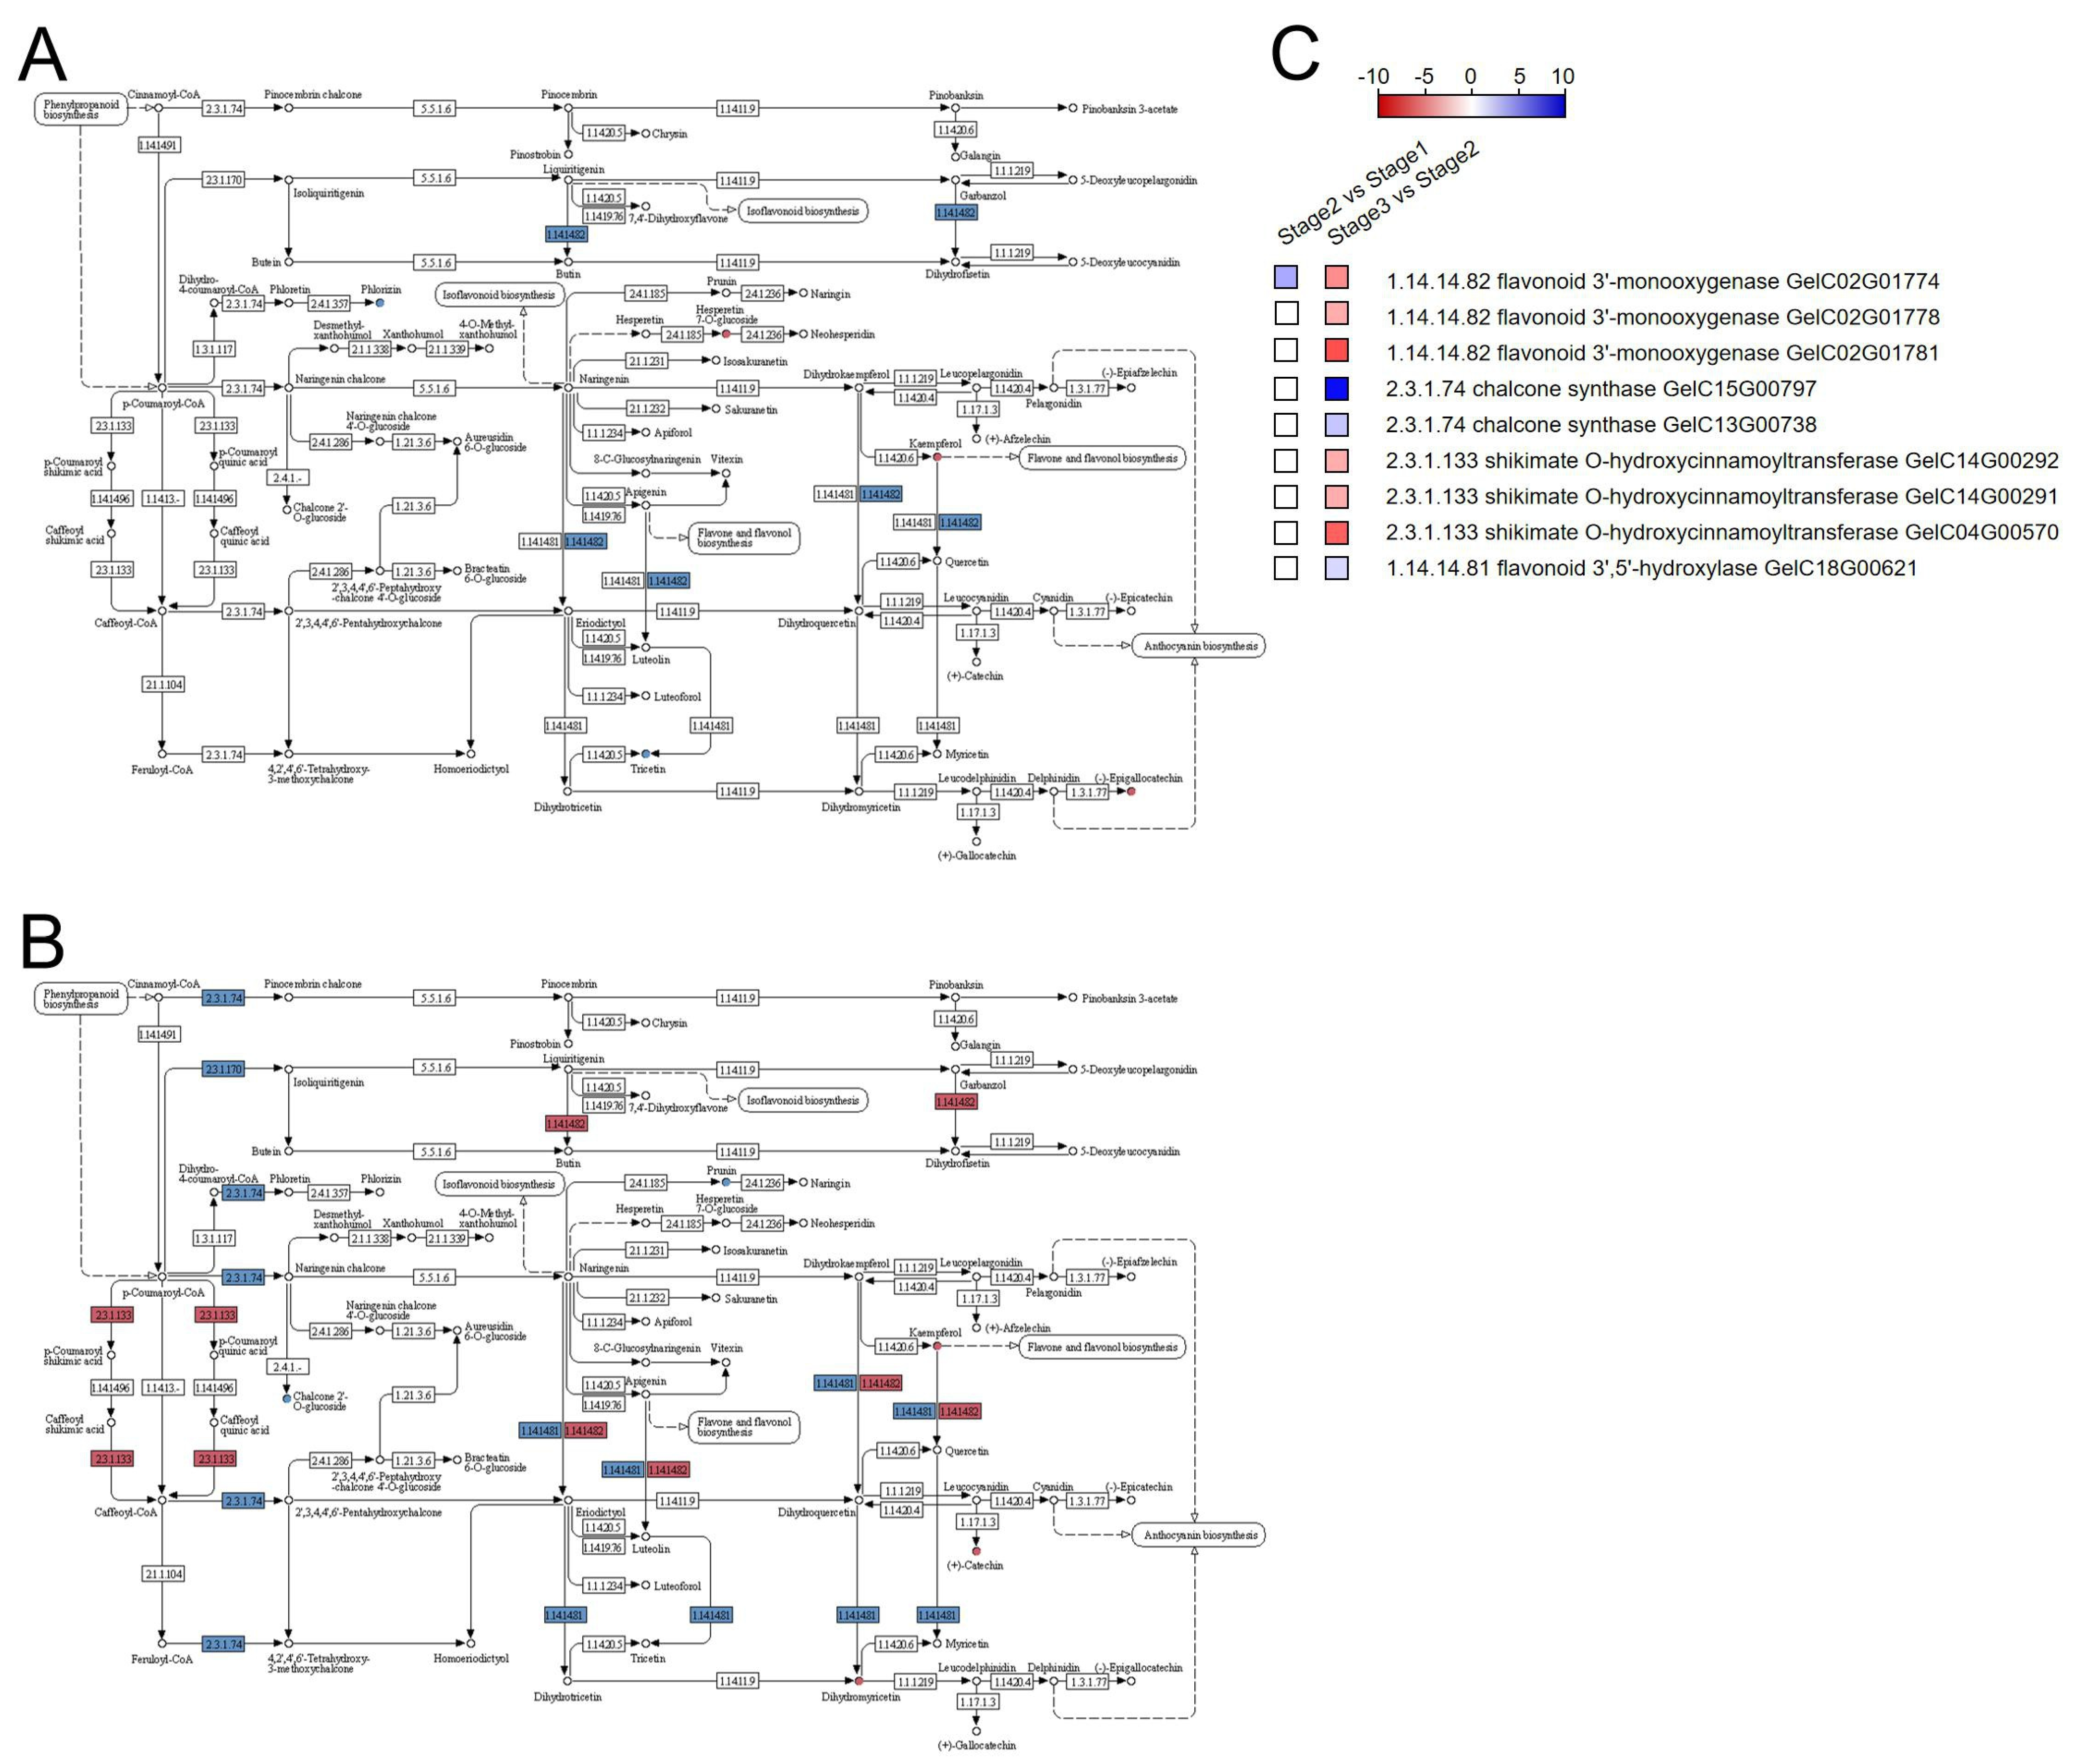
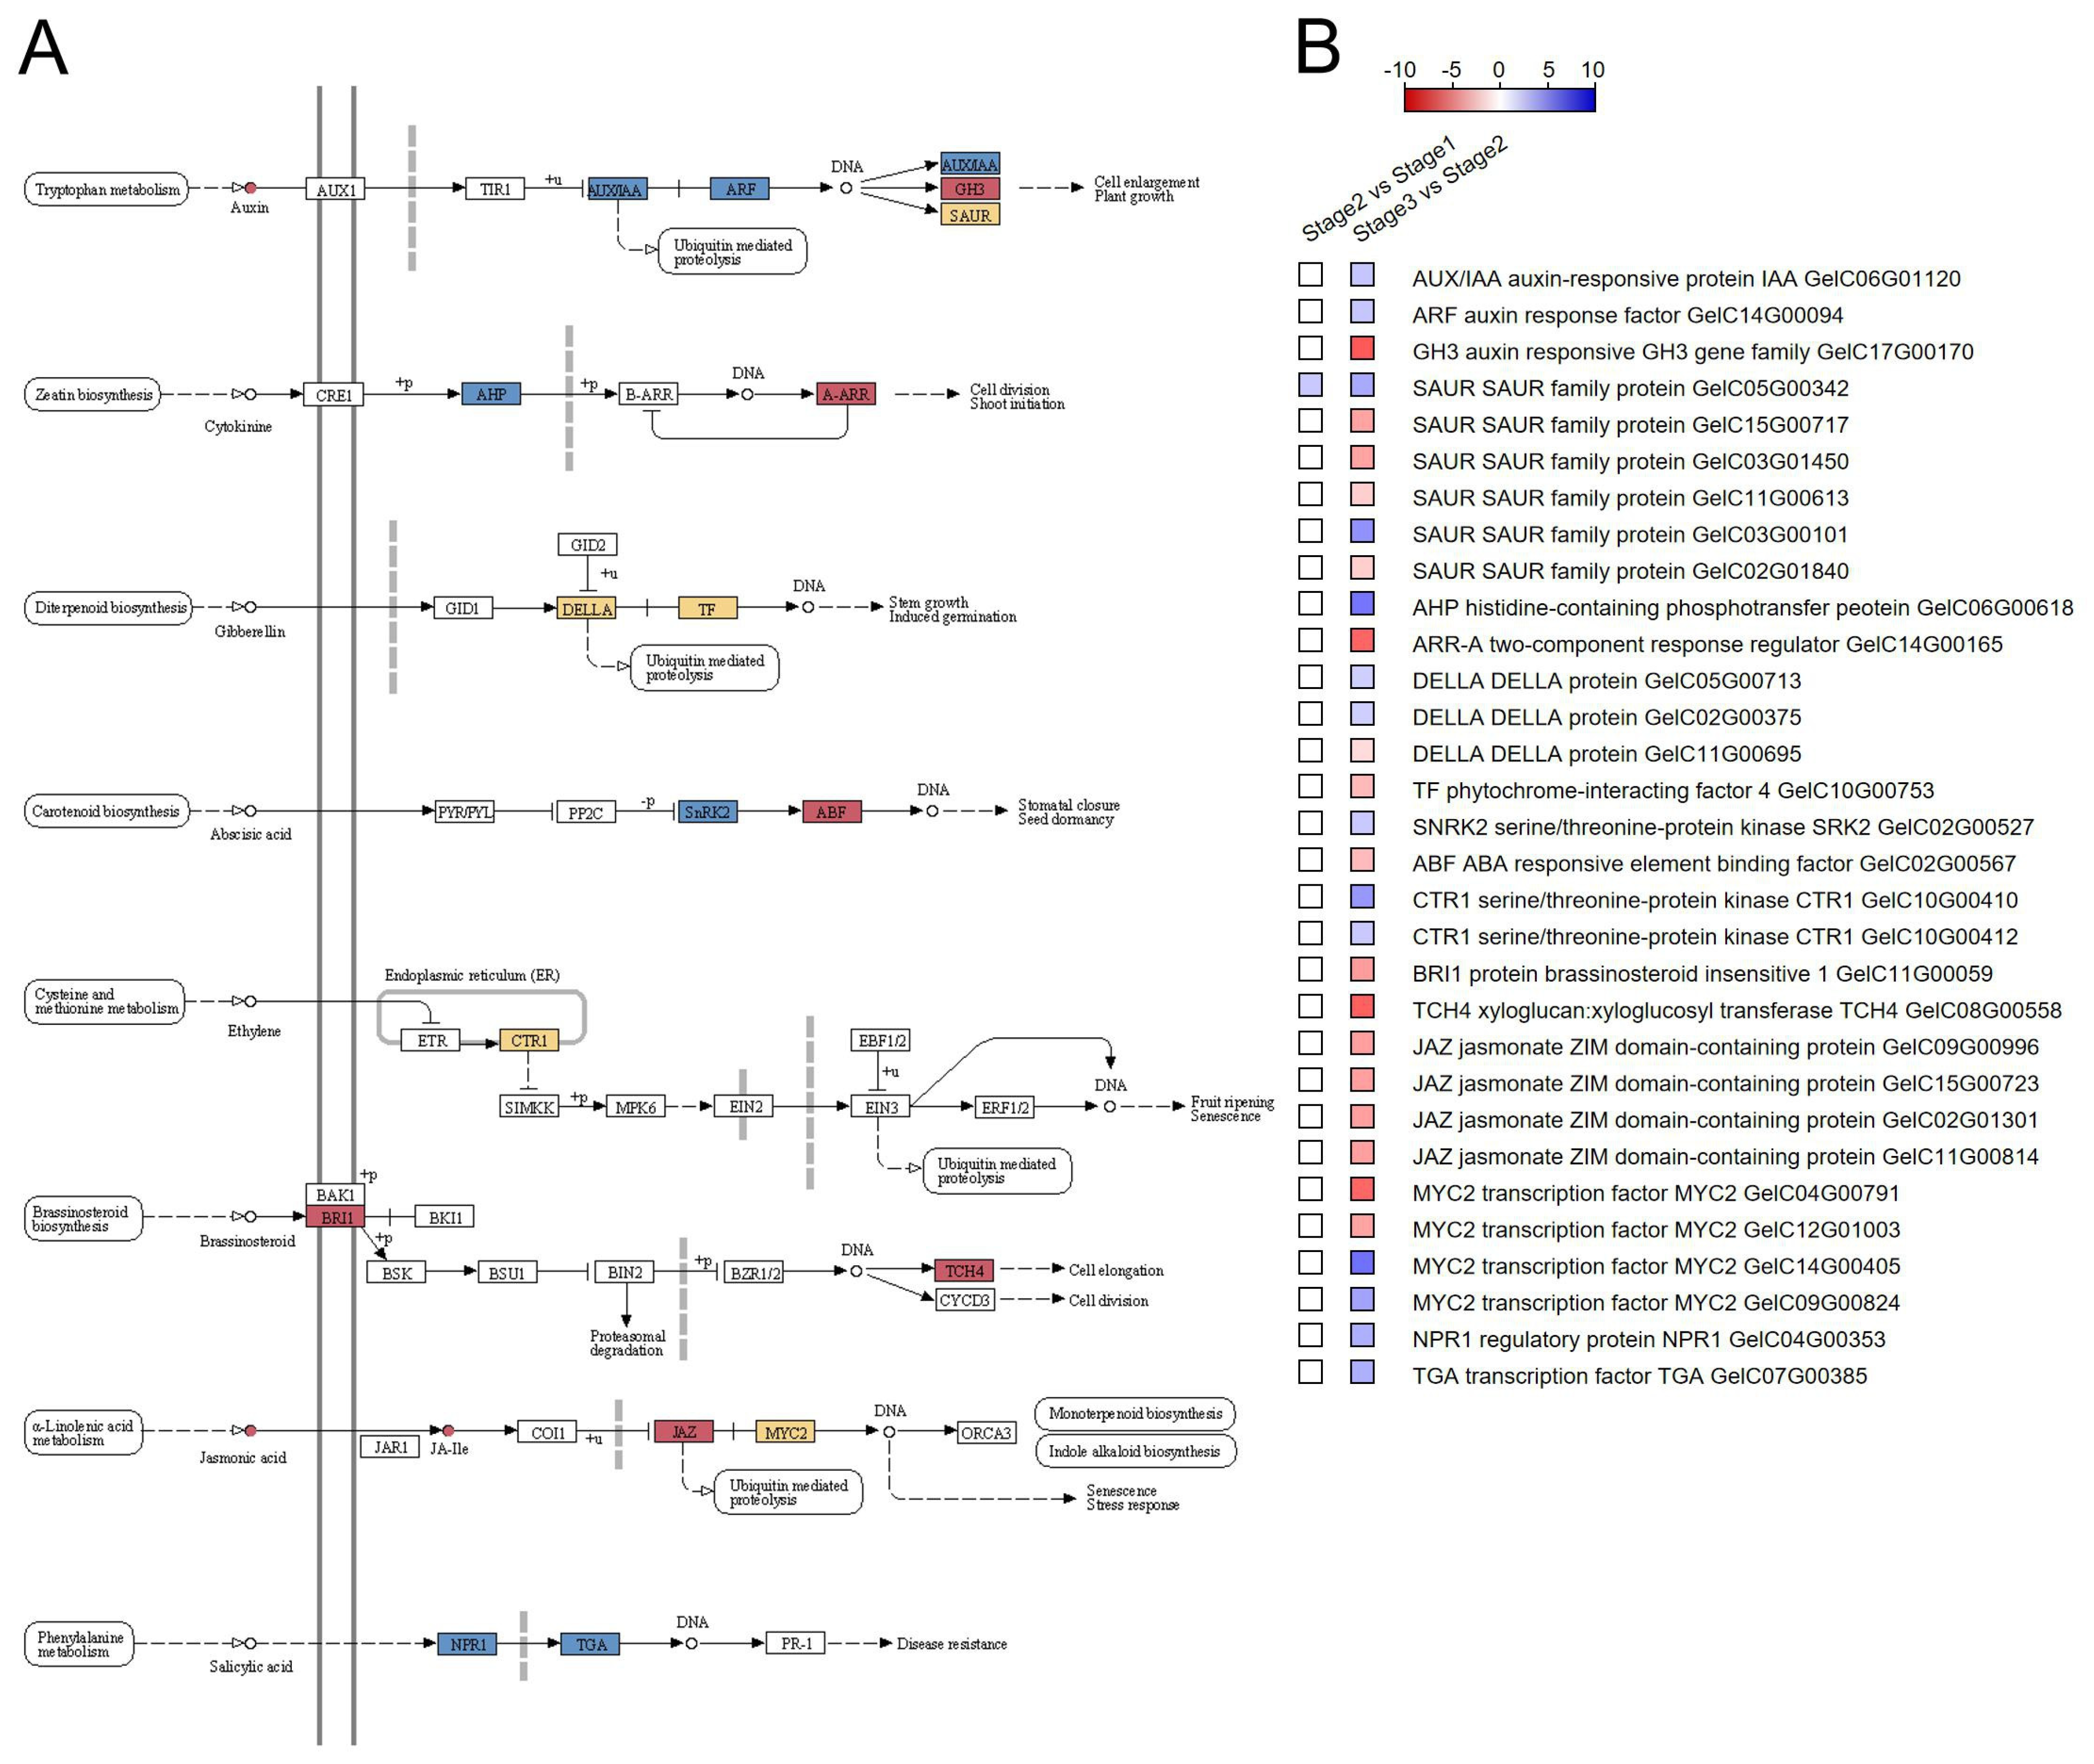
3.3. Integrative Transcriptome and Metabolome Analysis Related to “Flavonoid Biosynthesis” and “Plant Hormone Signal Transduction” Pathways

To investigate gene expression and metabolite content differences associated with flavonoid biosynthesis during G. elata flower development, heatmaps were generated to visualize metabolite expression patterns across the three developmental stages. Differential metabolites were annotated in KEGG pathways (Figure 4A,B, Tables S6 and S7), allowing the visualization of metabolite interactions across pathways. Pathway enrichment analysis further identified biological pathways most significantly associated with specific phenomena (Figure 4C,D).
For instance, in the flavonoid biosynthesis pathway, 61 genes encoding enzymes involved in flavonoid biosynthesis were identified. The regulatory network diagram revealed that one DEG and three SCMs related to flavonoid biosynthesis were highly correlated, with the gene encoding flavonoid 3′,5′-hydroxylase (GelC18G00621) exerting a negative regulatory effect on dihydromyricetin as an example. Additionally, the regulatory network diagram included five SCMs (Figure 5).
In the plant hormone signal transduction pathway, 320 key synthetase genes were identified, with high-level expression of one ARR-A two-component response regulator gene (GelC14G00165) and one TCH4 xyloglucan:xyloglucosyl transferase gene (GelC08G00558) in Stage 3, as well as one AHP histidine-containing phosphotransfer protein gene (GelC06G00618) and two MYC2 transcription factor (TF) genes (GelC14G00405 and GelC09G00824) in Stage 1 and Stage 2 (Figure 6).
Predictions of gene-regulated metabolite changes were also made. For example, in the “zeatin biosynthesis” pathway (ko00908), two upregulated UDP-glucosyltransferase 73C genes (GelC10G00230 and GelC10G00232) and one upregulated cis-zeatin O-glucosyltransferase gene (GelC14G00261) in Stage 3 correlated with increased Uridine 5′-diphosphate levels, implicating their role in zeatin biosynthesis (Figure S6). In the “phenylalanine metabolism” pathway (ko00360), the upregulation of one aromatic-L-amino-acid/L-tryptophan decarboxylase gene (GelC15G00116) in Stage 3 corresponded to increased phenethylamine levels (Figure S12). Similarly, in the “tryptophan metabolism” pathway (ko00380), the upregulation of three indole-3-pyruvate monooxygenase genes (GelC05G00629, GelC05G01238, and GelC16G00150) and the downregulation of one (GelC03G01391) in Stage 3 corresponded to increased indoleacetate levels (Figure S13B).
Additionally, integrative transcriptome and metabolome analyses were conducted for pathways such as “anthocyanin biosynthesis”, “diterpenoid biosynthesis”, “alanine, aspartate and glutamate metabolism”, “cysteine and methionine metabolism”, “valine, leucine and isoleucine degradation”, “valine, leucine and isoleucine biosynthesis”, “lysine degradation”, “phenylalanine metabolism”, “tryptophan metabolism”, “alpha-linolenic acid metabolism”, and “stilbenoid, diarylheptanoid and gingerol biosynthesis” (Figures S4–S15). Joint multi-omics analysis enhances understanding of regulatory mechanisms in biological processes, providing dynamic models of transcriptome and metabolite changes and uncovering key regulatory networks involved in G. elata flower development.

4. Discussion

G. elata is widely distributed in Guizhou, Yunnan, Hubei, and other places in China, where it holds significant medicinal, ecological, and economic value. Beyond its traditional medicinal applications, it plays a role in ecosystem and soil and water conservation. However, over-harvesting and habitat destruction have led to a dramatic decline in wild populations. Despite its medicinal potential and market demand, the molecular mechanisms regulating metabolite biosynthesis during its flower growth and development remain largely unexplored. This study addresses this gap by integrating transcriptomic and metabolomic analyses to elucidate the regulatory networks and metabolite dynamics of G. elata flower at three developmental stages.
Using a published genome for G. elata, 1712 novel loci were identified that were not previously annotated. High correlation coefficients among biological replicates, coupled with confirmatory qPCR results, underscore the reliability of the transcriptomic data. The KEGG pathway analysis revealed key pathways associated with flower development, including “metabolic pathways”, “biosynthesis of secondary metabolites”, and “MAPK signaling pathway—plant”, among others in Stage 2 vs. Stage 1. In Stage 3 compared to Stage 2, key pathways were associated with flower development, including “metabolic pathways”, “biosynthesis of secondary metabolites”, and “plant hormone signal transduction”, among others. Similar pathways were significantly enriched in a study on L. radiata, which identified flower development-related pathways such as “flavonoid biosynthesis”, “phenylpropanoid biosynthesis”, “tropane, piperidine and pyridine alkaloid biosynthesis”, “terpenoid backbone biosynthesis”, and “plant hormone signal transduction” [20]. In P. cablin studies, 62, 85, and 86 KEGG pathways were significantly enriched in the Stage 2 vs. Stage 1, Stage 3 vs. Stage 1, and Stage 4 vs. Stage 1 comparisons, respectively. Key pathways such as “phenylpropanoid biosynthesis”, “alpha-linolenic acid metabolism”, and “starch and sucrose metabolism pathways” were all significantly enriched from Stage 2 to Stage 4, with “flavonoid biosynthesis” and “plant hormone signal transduction pathway” also notably enriched at Stage 2 and Stage 3 [26]. Studies on C. sinense also highlighted flower development-related DEG functional terms, including “spliceosome”, “biosynthesis of secondary metabolites”, “carbon metabolism”, and “ribosome” [30].
In Arabidopsis, physiological and molecular genetic analyses have revealed that plant flowering is largely regulated by vernalization, photoperiod, autonomous, gibberellin, thermosensory, and age pathways [39]. Several central transcription factors, including LEAFY (LFY), FLOWERING LOCUS T (FT), TERMINAL FLOWER1 (TFL1), and SUPPRESSOR OF OVEREXPRESSION OF CONSTANS1 (SOC1), play crucial roles in flower development [40]. FT promotes flowering and TFL1 inhibits it [41]. Studies of the MADS-box family have shown that members of this family are extensively involved in the floral transition and floral organ morphogenesis [42]. In this study, transcription factors (TFs) emerged as critical regulators of these pathways. For instance, genes such as GelC06G00250 (FLOWERING LOCUS T), GelC06G00251 (FLOWERING LOCUS T 1), and GelC05G01373 (Floricaula/leafy homolog) exhibited higher expression in Stage 1 compared to Stage 3. For the MADS family such as GelC14G00749 (MADS-box transcription factor 32), it exhibited higher expression in Stage 1 and Stage 2 compared to Stage 3, while GelC09G00678 (MADS-box transcription factor 16) showed higher expression in Stage 3. MADS-box transcription factor 16 (GelC02G01831) expression levels gradually increase during the development of floral organs. These results highlight TFs with distinct expression profiles during different developmental stages of the G. elata flower, underscoring their stage-specific roles. However, further studies are required to confirm the functions of these TF genes.
This study represents a significant step towards understanding the molecular basis of G. elata flower development and metabolite biosynthesis. The findings lay the groundwork for functional genomics research and may inform conservation and sustainable utilization strategies for this valuable medicinal plant. However, limitations such as the small sample size highlight the need for further investigations to validate the identified regulatory networks and pathways. Despite these limitations, the results demonstrate the potential of genome-wide approaches to unravel the molecular mechanisms underlying G. elata development and evolution.

5. Conclusions

In this study, NGS was utilized to characterize the G. elata flower transcriptome across three developmental stages, enabling the assessment of gene expression changes, particularly among TFs associated with flower formation and metabolite accumulation. The FPKM-based analysis highlighted substantial transcriptomic shifts during G. elata flower development. Complementary metabolomics identified significant changes in metabolite profiles across G. elata samples. The presenting report proposed dynamic models of transcriptome and metabolite changes, offering insights into key regulatory networks driving G. elata flower growth and development.

Supplementary Materials

The following supporting information can be downloaded at https://www.mdpi.com/article/10.3390/agronomy15020441/s1: Table S1: The qRT-PCR and primer pairs; Table S2: List of genes used to identify differentially expressed genes (DEGs); Table S3: KEGG analysis of differentially expressed genes (DEG); Table S4: The metabolites in G. elata; Table S5: Significant changes in metabolites (SCMs) in G. elata; Table S6: Integrative transcriptome and metabolome analysis of Stage 2 vs. Stage 1; Table S7: Integrative transcriptome and metabolome analysis of Stage 3 vs. Stage 2; Figure S1: The volcano plot of DEGs in G. elata; Figure S2: OPLS-DA; Figure S3: The volcano plot of SCMs in G. elata; Figures S4–S15: Integrative analysis of transcriptome and metabolome data.

Author Contributions

Conceptualization, J.Z. (Jiehong Zhao) and J.Z. (Jian Zhang); methodology, H.C. and Y.Y.; software, H.C. and Y.Y.; writing—original draft preparation, H.C.; writing—review and editing, J.Z. (Jiehong Zhao) and J.Z. (Jian Zhang). All authors have read and agreed to the published version of the manuscript.

Funding

This research was funded by a project of Guizhou University of Traditional Chinese Medicine (20231127) and a Jilin Agricultural University high-level researcher grant (JLAUHLRG20102006 and 10102028602).

Data Availability Statement

The data that support the findings of this study were deposited into the CNGB Sequence Archive (CNSA) of the China National GeneBank DataBase (CNGBdb) with accession number CNP0006738.

Conflicts of Interest

The authors declare no conflicts of interest.

Abbreviations

The following abbreviations are used in this manuscript:
PSMplant secondary metabolite
NGSnext-generation sequencing
CTABcetyltrimethylammonium bromide
FPKMfragments per kilobase per million mapped reads
DEGsdifferentially expressed genes
KEGGgenes and genomes
GOgene ontology
CTcycle threshold
PCAprincipal component analysis
PCCsPearson correlation coefficients
HCAhierarchical cluster analysis
SCMssignificant changes in metabolites

References

  1. Zhang, M.J.; Xu, H.D.; An, X.G. Research on ultrasonic wave extraction of Gastrodia elata Bl. polysaccharides. J. Nat. Sci. Ed. 2007, 35, 91–95. [Google Scholar]
  2. Wu, Y.N.; Wen, S.H.; Zhang, W. Gastrodia elata BI.:A comprehensive review of its traditional use, botany, phytochemistry, pharmacology, and pharmacokinetics. Evid. Based Complement. Alternat. Med. 2023, 18, 5606021. [Google Scholar] [CrossRef]
  3. Liu, Y.; Huang, G.L. The chemical composition, pharmacological effects, clinical applications and market analysis of Gastrodia elata. Pharm. Chem. J. 2017, 51, 211–215. [Google Scholar] [CrossRef]
  4. Ho, L.H.; Lee, Y.I.; Hsieh, S.Y.; Lin, I.S.; Wu, Y.C.; Ko, H.Y.; Klemens, P.A.; Neuhaus, H.E.; Chen, Y.M.; Huang, T.P.; et al. GeSUT4 mediates sucrose import at the symbiotic interface for carbon allocation of heterotrophic Gastrodia elata (Orchidaceae). Plant Cell Environ. 2021, 44, 20–33. [Google Scholar] [CrossRef] [PubMed]
  5. Shan, T.Y.; Yin, M.Z.; Wu, J.X.; Yu, H.W.; Liu, M.L.; Xu, R.; Wang, J.T.; Peng, H.S.; Zha, L.P.; Gui, S.Y. Comparative transcriptome analysis of tubers, stems, and flowers of Gastrodia elata Blume reveals potential genes involved in the biosynthesis of phenolics. Fitoterapia 2021, 153, 104988. [Google Scholar] [CrossRef] [PubMed]
  6. Liu, J.J.; Yang, X.Q.; Li, Z.Y.; Miao, J.Y.; Li, S.B.; Zhang, W.P.; Lin, Y.C.; Lin, L.B. The role of symbiotic fungi in the life cycle of Gastrodia elata Blume (Orchidaceae): A comprehensive review. Front. Plant Sci. 2024, 14, 1309038. [Google Scholar] [CrossRef] [PubMed]
  7. Chen, M.; Zhang, J.Z. Flowering and flower development in plants. Agronomy 2024, 15, 256. [Google Scholar] [CrossRef]
  8. Irish, V. The ABC model of floral development. Curr. Biol. 2017, 27, 887–890. [Google Scholar] [CrossRef]
  9. Li, X.M.; Fan, T.; Zou, P.; Zhang, W.H.; Wu, X.J.; Zhang, Y.X.; Liao, J.P. Can the anatomy of abnormal flowers elucidate relationships of the androecial members in the ginger (Zingiberaceae)? Evodevo 2020, 11, 12. [Google Scholar] [CrossRef]
  10. Luo, H.H.; Wang, Q.; Zhang, J.K.; Wang, L.S.; Li, Y.B.; Yang, G.Z. Minimum fertilization at the appearance of the first flower benefits cotton nutrient utilization of nitrogen, phosphorus and potassium. Sci. Rep. 2020, 10, 6815. [Google Scholar] [CrossRef]
  11. Gase, K.B.I. Transformational tools for next-generation plant ecology: Manipulation of gene expression for the functional analysis of genes. Plant Ecol. Divers. 2012, 5, 485–490. [Google Scholar] [CrossRef]
  12. Morozova, O.; Marra, M.A. Applications of next-generation sequencing technologies in functional genomics. Genomics 2008, 92, 255–264. [Google Scholar] [CrossRef]
  13. Bae, E.K.; An, C.; Kang, M.J.; Lee, S.A.; Lee, S.J.; Kim, K.T.; Park, E.J. Chromosome-level genome assembly of the fully mycoheterotrophic orchid Gastrodia elata. G3 2022, 12, jkab433. [Google Scholar] [CrossRef]
  14. Tsai, C.C.; Wu, K.M.; Chiang, T.Y.; Huang, C.Y.; Chou, C.H.; Li, S.J.; Chiang, Y.C. Comparative transcriptome analysis of Gastrodia elata (Orchidaceae) in response to fungus symbiosis to identify gastrodin biosynthesis-related genes. BMC Genom. 2016, 17, 212. [Google Scholar] [CrossRef]
  15. Zeng, X.; Li, Y.Y.; Ling, H.; Liu, S.S.; Liu, M.M.; Chen, J.; Guo, S.X. Transcriptomic analyses reveal clathrin-mediated endocytosis involved in symbiotic seed germination of Gastrodia elata. Bot. Stud. 2017, 58, 31. [Google Scholar] [CrossRef]
  16. Wang, Y.S.; Qasim Shahid, M.; Ghouri, F.; Ercişli, S.; Baloch, F.S. Development of EST-based SSR and SNP markers in Gastrodia elata (herbal medicine) by sequencing, de novo assembly and annotation of the transcriptome. 3 Biotech 2019, 9, 292. [Google Scholar] [CrossRef]
  17. Wang, Y.H.; Gao, Y.G.; Zang, P.; Xu, Y. Transcriptome analysis reveals underlying immune response mechanism of fungal (Penicillium oxalicum) disease in Gastrodia elata Bl. f. glauca S. chow (Orchidaceae). BMC Plant Biol. 2020, 20, 445. [Google Scholar] [CrossRef]
  18. Ren, L.Y.; Zhao, H.; Liu, X.L.; Zong, T.K.; Qiao, M.; Liu, S.Y.; Liu, X.Y. Transcriptome reveals roles of lignin-modifying enzymes and abscisic acid in the symbiosis of mycena and Gastrodia elata. Int. J. Mol. Sci. 2021, 22, 6557. [Google Scholar] [CrossRef] [PubMed]
  19. Liu, D.F.; Sui, S.Z.; Ma, J.; Li, Z.N.; Guo, Y.L.; Luo, D.P.; Yang, J.F.; Li, M.Y. Transcriptomic analysis of flower development in wintersweet (Chimonanthus praecox). PLoS ONE 2014, 9, e86976. [Google Scholar] [CrossRef]
  20. Nakamura, Y.; Teo, N.Z.W.; Shui, G.H.; Chua, C.H.L.; Cheong, W.F.; Parameswaran, S.; Koizumi, R.; Ohta, H.; Wenk, M.R.; Ito, T. Transcriptomic and lipidomic profiles of glycerolipids during Arabidopsis flower development. New Phytol. 2014, 203, 310–322. [Google Scholar] [CrossRef]
  21. Liu, F.; Wang, Y.; Ding, Z.T.; Zhao, L.; Xiao, J.; Wang, L.J.; Ding, S.B. Transcriptomic analysis of flower development in tea (Camellia sinensis (L.)). Gene 2017, 631, 39–51. [Google Scholar] [CrossRef]
  22. Jiao, Y.L.; Hu, Q.T.; Zhu, Y.; Zhu, L.F.; Ma, T.F.; Zeng, H.Y.; Zang, Q.L.; Li, X.; Lin, X.C. Comparative transcriptomic analysis of the flower induction and development of the Lei bamboo (Phyllostachys violascens). BMC Bioinform. 2019, 20, 687. [Google Scholar] [CrossRef]
  23. Yang, L.; Liu, L.M.; Wang, Z.Y.; Zong, Y.; Yu, L.; Li, Y.Q.; Liao, F.L.; Chen, M.M.; Cai, K.L.; Guo, W.D. Comparative anatomical and transcriptomic insights into Vaccinium corymbosum flower bud and fruit throughout development. BMC Plant Biol. 2021, 21, 289. [Google Scholar] [CrossRef]
  24. Wang, N.; Shu, X.C.; Zhang, F.J.; Zhuang, W.B.; Wang, T.; Wang, Z. Comparative transcriptome analysis identifies key regulatory genes involved in anthocyanin metabolism during flower development in Lycoris radiata. Front. Plant Sci. 2021, 12, 761862. [Google Scholar] [CrossRef]
  25. Suetsugu, K.; Fukushima, K.; Makino, T.; Ikematsu, S.; Sakamoto, T.; Kimura, S. Transcriptomic heterochrony and completely cleistogamous flower development in the mycoheterotrophic orchid Gastrodia. New Phytol. 2023, 237, 323–338. [Google Scholar] [CrossRef]
  26. Choi, D.Y.; Kim, Y. Transcriptome analysis of female western flower thrips, Frankliniella occidentalis, exhibiting neo-panoistic ovarian development. PLoS ONE 2022, 17, e0272399. [Google Scholar] [CrossRef]
  27. Shi, Z.Y.; Zhao, W.Q.; Li, Z.A.; Kang, D.R.; Ai, P.H.; Ding, H.X.; Wang, Z.C. Development and validation of SSR markers related to fower color based on full-length transcriptome sequencing in Chrysanthemum. Sci. Rep. 2022, 12, 22310. [Google Scholar] [CrossRef]
  28. Liu, L.M.; Zheng, Y.Q.; Feng, S.J.; Yu, L.; Li, Y.Q.; Zong, Y.; Chen, W.R.; Liao, F.L.; Yang, L.; Guo, W.D. Transcriptomic and physiological analysis reveals the responses to auxin and abscisic acid accumulation during Vaccinium corymbosum flower bud and fruit development. Front. Plant Sci. 2022, 13, 818233. [Google Scholar] [CrossRef]
  29. Wei, Y.; Li, A.H.; Zhao, Y.R.; Li, W.Q.; Dong, Z.Y.; Zhang, L.; Zhu, Y.T.; Zhang, H.; Gao, Y.K.; Zhang, Q.X. Time-course transcriptomic analysis reveals molecular insights into the inflorescence and flower development of Cardiocrinum giganteum. Plants 2024, 13, 649. [Google Scholar] [CrossRef]
  30. Zhang, C.; Liu, X.F.; Liu, Y.; Yu, J.; Yao, G.L.; Yang, H.G.; Yang, D.M.; Wu, Y.G. An integrated transcriptome and metabolome analysis reveals the gene network regulating flower development in Pogostemon cablin. Front. Plant Sci. 2023, 14, 1201486. [Google Scholar] [CrossRef]
  31. Zhu, L.; Liao, J.H.; Liu, Y.F.; Zhou, C.M.; Wang, X.; Hu, Z.G.; Huang, B.S.; Zhang, J.J. Integrative metabolome and transcriptome analyses reveal the molecular mechanism underlying variation in floral scent during flower development of Chrysanthemum indicum var. aromaticum. Front. Plant Sci. 2022, 13, 919151. [Google Scholar] [CrossRef]
  32. Sun, Y.; Hu, P.L.; Jiang, Y.N.; Li, J.; Chang, J.X.; Zhang, H.H.; Shao, H.J.; Zhou, Y.W. Integrated metabolome and transcriptome analysis of petal anthocyanin accumulation mechanism in Gloriosa superba ‘rothschildiana’ during different flower development stages. Int. J. Mol. Sci. 2023, 24, 15034. [Google Scholar] [CrossRef]
  33. Long, Y.Q.; Zeng, J.; Liu, X.R.; Wang, Z.H.; Tong, Q.Z.; Zhou, R.B.; Liu, X.D. Transcriptomic and metabolomic profling reveals molecular regulatory network involved in fower development and phenotypic changes in two Lonicera macranthoides varieties. 3 Biotech 2024, 14, 174. [Google Scholar] [CrossRef]
  34. Ahmad, S.; Lu, C.Q.; Gao, J.; Wei, Y.L.; Xie, Q.; Jin, J.P.; Zhu, G.F.; Yang, F.X. Integrated proteomic, transcriptomic, and metabolomic profiling reveals that the gibberellin–abscisic acid hub runs flower development in the Chinese orchid Cymbidium sinense. Hortic. Res. 2024, 11, uhae073. [Google Scholar] [CrossRef]
  35. Kim, D.; Langmead, B.; Salzberg, S.L. HISAT: A fast spliced aligner with low memory requirements. Nature methods. 2015, 12, 357–360. [Google Scholar] [CrossRef]
  36. Varet, H.; Brillet-Guéguen, L.; Coppée, J.Y.; Dillies, M.A. SARTools: A DESeq2- and EdgeR-based rpipeline for comprehensive differential analysis of RNA-seq data. PLoS ONE 2016, 11, e0157022. [Google Scholar] [CrossRef]
  37. Kanehisa, M.; Araki, M.; Goto, S.; Hattori, M.; Hirakawa, M.; Itoh, M.; Katayama, T.; Kawashima, S.; Okuda, S.; Tokimatsu, T.; et al. KEGG for linking genomes to life and the environment. Nucleic Acids Res. 2008, 36, D480–D484. [Google Scholar] [CrossRef]
  38. Livak, K.J.; Schmittgen, T.D. Analysis of relative gene expression data using real-time quantitative PCR and the 2(-Delta Delta C(T)) method. Methods 2001, 25, 402–408. [Google Scholar] [CrossRef]
  39. Wu, Z.; Fang, X.; Zhu, D.; Dean, C. Autonomous pathway: FLOWERING LOCUS C repression through an antisense-mediated chromatin-silencing mechanism. Plant Physiol. 2020, 182, 27–37. [Google Scholar] [CrossRef]
  40. Wickland, D.P.; Hanzawa, Y. The FLOWERING LOCUS T/TERMINAL FLOWER 1 gene family: Functional evolution and molecular mechanisms. Mol. Plant 2015, 8, 983–997. [Google Scholar] [CrossRef]
  41. Coelho, C.P.; Minow, M.A.A.; Chalfun-Júnior, A.; Colasanti, J. Putative sugarcane FT/TFL1 genes delay flowering time and alter reproductive architecture in Arabidopsis. Front. Plant Sci. 2014, 5, 221. [Google Scholar] [CrossRef]
  42. Schilling, S.; Kennedy, A.; Pan, S.; Jermiin, L.S.; Melzer, R. Genome-wide analysis of MIKC-type MADS-box genes in wheat: Pervasive duplications, functional conservation and putative neofunctionalization. New Phytol. 2020, 225, 511–529. [Google Scholar] [CrossRef]
Figure 1. Flower and petal phenotypes at three developmental stages: Stage 1 (TMH1) (A), Stage 2 (TMH2) (B), and Stage 3 (TMH3) (C).
Agronomy 15 00441 g001
Figure 2. The DEG analysis in G. elata. (A) PCA of 9 samples. (B) Correlation analysis of 9 samples. The scale bar represents the size of the correlation. (C) The box plot of expressed genes in 9 samples. (D) Hierarchical clustering of transcripts in G. elata. (E) Analysis of GO terms for DEGs in G. elata. (F) Analysis of KEGG enrichment for DEGs in G. elata.
Agronomy 15 00441 g002
Figure 3. Metabolic pathways analysis in G. elata. (A) PCA of 9 samples. (B) Heatmap and cluster analysis of metabolite profiles, illustrating variations at the metabolome level. (C) The scatter of SCMs in G. elata of Stage 2 vs. Stage 1. (D) The scatter of SCMs in G. elata of Stage 3 vs. Stage 2. (E) KEGG enrichment of SCMs in G. elata of Stage 2 vs. Stage 1. (F) KEGG enrichment of SCMs in G. elata of Stage 3 vs. Stage 2.
Agronomy 15 00441 g003
Figure 4. Integrative transcriptome and metabolome analysis in G. elata. (A) KEGG pathway enrichment analysis comparing Stage 2 vs. Stage 1. (B) KEGG pathway enrichment analysis comparing Stage 3 vs. Stage 2. (C) Heatmap and cluster analysis of Stage 2 vs. Stage 1. (D) Heatmap and cluster analysis of Stage 3 vs. Stage 2.
Agronomy 15 00441 g004
Figure 5. Integrative analysis of transcriptome and metabolome data for the flavonoid biosynthesis pathway (ko00941) in G. elata. (A) Mapping of enriched DEGs between Stage 2 and Stage 1, with red and blue boxes representing upregulated and downregulated genes, respectively, and red and blue dots indicating metabolites with increased and decreased accumulation, respectively. (B) Mapping of enriched DEGs between Stage 3 and Stage 2. (C) Expression patterns of DEGs involved in flavonoid biosynthesis across the three flower developmental stages.
Agronomy 15 00441 g005
Figure 6. Integrative analysis of transcriptome and metabolome data for the plant hormone signal transduction pathway (ko04075) in G. elata. (A) Mapping of enriched DEGs between Stage 3 and Stage 2. Red and blue boxes represent genes with upregulated and downregulated expression, respectively, and red and blue dots represent metabolites with increased and decreased accumulation, respectively. (B) Expression pattern of DEGs involved in plant hormone signal transduction across the three flower developmental stages.
Agronomy 15 00441 g006
Table 1. Summary of RNA-Seq datasets for the 9 libraries.
SamplesRaw ReadsClean ReadsClean Bases (Gb)Clean Reads Q20 (%)Clean Reads Q30 (%)
Stage1-148,258,88047,134,8847.0797.5693.18
Stage1-251,444,20250,169,5307.5397.5993.22
Stage1-354,631,21053,461,5028.0297.6393.38
Stage2-161,991,11055,062,0988.2698.1994.88
Stage2-249,126,84248,052,4187.2197.6093.30
Stage2-354,897,79053,795,7768.0797.5993.17
Stage3-145,013,37244,198,8066.6397.6493.26
Stage3-260,224,28259,050,4648.8697.8093.83
Stage3-354,954,65853,808,5568.0797.5793.21
Disclaimer/Publisher’s Note: The statements, opinions and data contained in all publications are solely those of the individual author(s) and contributor(s) and not of MDPI and/or the editor(s). MDPI and/or the editor(s) disclaim responsibility for any injury to people or property resulting from any ideas, methods, instructions or products referred to in the content.

