Article

Comprehensive Evaluation of Nanhaia speciosa Germplasm Resources Using Agronomic Traits, Molecular Markers, and Metabolomics

1
School of Chinese Materia Medica, Guangdong Pharmaceutical University, Guangzhou 510006, China
2
Teaching and Experimental Center, Guangdong Pharmaceutical University, Guangzhou 510006, China
3
Guangdong Xiaoyang Ecological Agriculture Co., Ltd., Yunfu 527500, China
4
Key Specialty of Clinical Pharmacy, The First Affiliated Hospital of GuangDong Pharmaceutical University, Guangzhou 510080, China
5
Guangdong Provincial Key Laboratory for Research and Evaluation of Pharmaceutical Preparations, Guangdong Pharmaceutical University, Guangzhou 510006, China
*
Authors to whom correspondence should be addressed.
These authors contributed equally to this work.
Agronomy 2025, 15(3), 508; https://doi.org/10.3390/agronomy15030508
Submission received: 21 January 2025 / Revised: 18 February 2025 / Accepted: 19 February 2025 / Published: 20 February 2025
(This article belongs to the Section Crop Breeding and Genetics)

Abstract

:
Nanhaia speciosa is a valuable industrial crop known for its significant edible and medicinal properties, attributed to its abundance of secondary metabolites. This study aims to elucidate the genetic relationships among N. speciosa, enhance species identification accuracy, and select genetically stable, high-quality germplasms of N. speciosa. To achieve this, we conducted chloroplast gene amplification and sequencing, alongside an analysis of the agronomic traits of 19 N. speciosa germplasms. Additionally, non-targeted metabolomic profiling using UPLC-Q-Orbitrap/MS and chemometric methods was employed to assess their metabolic diversity and genetic relationships. The results revealed notable differences in DNA barcodes and secondary structures across the germplasms, with the atpF-atpH sequence successfully distinguishing all 19 germplasms into distinct varieties. Multivariate statistical analyses, including principal component analysis (PCA), partial least squares discriminant analysis (PLS-DA), and hierarchical clustering, identified 12 key marker metabolites that effectively differentiated the germplasms, consistent with the observed phenotypic diversity. A clustering analysis integrating genetic, phenotypic, and metabolomic data further validated the utility of DNA barcoding for species identification. The results of the comprehensive analysis showed that NDL-2 and NDL-18 exhibited relatively good edible and medicinal properties, while NDL-1 and NDL-19 exhibited relatively poor edible and medicinal properties. This study provides crucial insights for the breeding and genetic improvement of N. speciosa and related species, offering a valuable reference for the identification, conservation, and utilization of germplasm resources within the N. speciosa.

1. Introduction

N. speciosa (Champ. ex Benth.) J. Compton & Schrire, a member of the Fabaceae family [1,2], is a perennial liana native to subtropical regions of southern China. In its natural habitat, it thrives in thickets, sparse forests, and open areas at altitudes below 1500 m, with its geographical distribution, between 18° and 30° N latitude, notably in Hainan, Guangxi, and Guangdong provinces [3]. This species is valued for its dual edible and medicinal properties. It is commonly used as a raw material for food products such as N. speciosa rice flour, a traditional Chinese snack [4]. More significantly, its medicinal applications are well-documented in traditional Chinese medicine (TCM). As early as the Ming dynasty, the text Essential Properties of Raw Herbs described N. speciosa for its efficacy in “strengthening tendons, invigorating blood circulation, nourishing the lungs, and treating lumbar pain, rheumatism, chronic hepatitis, and pulmonary tuberculosis”.
Recent pharmacological studies have confirmed its multifunctional bioactivities, including anti-hepatic fibrosis, hypoglycemic, antioxidant, anti-inflammatory, antidepressant, and analgesic effects [5,6,7]. These properties are attributed to its rich repertoire of secondary metabolites [8], comprising sugars (α,α-trehalose, rhamnose, lactose, glucose, mannose, and fructose) [9], flavonoids (esculetin, diosmetin, glycitein, formononetin, (−)-maackiain, and medicarpin) [10], alkaloids (anthranilic acid, tyrosine, phenylalanine, and hypaphorine), and organic acids (D-(−)-quinic acid, cis-aconitic acid, pantothenic acid, salicylic acid, 2-hydroxycinnamic acid, and 3-hydroxybenzoic acid) [11]. These bioactive compounds underpin its applications in health products such as medicinal wines and herbal teas [12,13].
Despite its economic and therapeutic value importance, the sustainable utilization of N. speciosa faces critical challenges. Overharvesting has severely depleted the wild populations, necessitating the reliance on cultivated sources [14]. However, challenges such as germplasm misidentification, growth heterogeneity, and inconsistent phytochemical profiles have compromised the product quality and market value [15,16]. Systematic germplasm resource management (encompassing collection, preservation, characterization, and evaluation) is imperative for breeding programs aimed at developing elite cultivars [17]. The current germplasm assessment can be analyzed using various methods, including morphological markers, molecular markers, and non-targeted metabolomics [18,19].
Morphological markers are simple and effective for visually distinguishing and classifying plant varieties without the need for complex analytical techniques [20]. Molecular markers, such as DNA barcoding, are highly efficient for species identification and genetic evaluation [21]. DNA barcoding utilizes species-specific DNA sequences as molecular markers, facilitating the accurate identification of species and the study of their evolutionary relationships [22]. Non-targeted metabolomics is an emerging field that provides comprehensive insights into the chemical diversity of plants, enabling applications in plant variety identification, the origin tracing of plant-based foods, and chemical variation analysis among different species [23]. These methods have been successfully applied to various species. For example, phenotypic traits and SNP markers have been used to assess the genetic diversity of cowpea germplasm [24]; Kress W.J., et al. evaluated the genetic variation of invasive plants in Ontario, Canada through DNA barcoding technology, and studied intraspecific differences, providing a basis for the management of popular species [25]; and enzyme markers have been employed for genetic diversity analysis in celery [26]. The integration of DNA barcoding with morphological and chemical analyses has proven effective for the quality evaluation of Pruni Semen [27]. Similarly, chemometrics-assisted metabolomics has been utilized for the identification of spices, herbs, and food varieties [28,29,30].
In this study, we integrate DNA barcoding with UPLC-Q-Orbitrap/MS-based metabolomics to systematically evaluate the genetic diversity, agronomic traits, and key metabolites of N. speciosa germplasms. Our objective was to establish a reliable framework for germplasm identification, and identify key metabolites linked to medicinal efficacy, and then provide a scientific basis for breeding superior cultivars and sustainable resource utilization. This multidisciplinary approach advances the genetic improvement and commercial development of N. speciosa resources.

2. Materials and Methods

2.1. Experimental Reagents and Plant Materials

2.1.1. Chemical Reagents

Genomic DNA was extracted using the Plant Genomic DNA Extraction Kit (Accurate Biotechnology Co., Ltd., Changsha, China). Agarose powder and ultrapure water were purchased from Sinopharm Chemical Reagent Co., Ltd. (Shanghai, China). Tris and EDTA were supplied by Aladdin (Shanghai, China). HPLC-grade formic acid and acetonitrile were procured from Thermo Fisher Scientific (Guangzhou, China), methanol from Guangzhou Chemical Reagent Factory (Guangzhou, China), and ultrapure water from A.S. Watson Tm Limited (Guangzhou, China).

2.1.2. Plant Materials

A total of 19 N. speciosa germplasms were collected from three major production regions in southern China: Guangdong (n = 7), Guangxi (n = 6), and Hainan (n = 6). Detailed sample codes, geographic origins, and GPS positioning are listed in Table 1. All germplasms were subsequently transplanted to the Xiaoyang Agricultural Nanhaia speciosa Standardized Cultivation Base (23°12′ N, 113°25′ E; GAP-certified) under uniform agroecological conditions. Cultivation followed standardized protocols: planting density: 1.2 m × 1.5 m spacing; soil management: lateritic red soil (pH 5.8–6.3), and organic matter ≥ 2.5%; agronomic practices: drip irrigation, monthly growth monitoring, and pest control according to national medicinal plant cultivation guidelines (GB/T 29344-2023).
Nineteen N. speciosa germplasms with three biological replicates per accession were analyzed in this study. For DNA extraction, healthy young leaves from each sample were collected, washed, dried, flash-frozen with liquid nitrogen, and stored in an ultra-low temperature freezer. For biochemical and metabolomic analyses, the entire plant of each sample was washed, dried, flash-frozen with liquid nitrogen, and stored in an ultra-low-temperature freezer. Botanical identification of all specimens was performed by Dr. Yang Jing (School of Traditional Chinese Medicine Resources, Guangdong Pharmaceutical University) through morphological characterization. All corresponding genomic/metabolomic samples are stored in Prof. He Xin’s laboratory under controlled conditions (−80 °C for tissues, 4 °C for extracts). A representative field photograph of N. speciosa is provided in Figure S1 (Supporting Materials).

2.2. Genome DNA Extraction, PCR Amplification, and Sequence Analysis

2.2.1. Genomic DNA Extraction and Quality Control

Total genomic DNA (gDNA) was isolated from 1 g fresh leaf tissues using the using the Steady Pure Plant Genomic DNA Extraction Kit (Accurate Biotechnology Co., Ltd., Changsha, China) following the manufacturer’s protocol. DNA integrity was verified via 1% (w/v) agarose gel electrophoresis (Bio-Rad Gel Doc™ XR+ Imaging System, Hercules, CA, USA), and purity was assessed by spectrophotometry (A260/A280 ratio: 1.8–2.0).

2.2.2. PCR Amplification and Optimization

Zhang C.Y., et al. showed that atpF-atpH and psbk-psbl are non-coding regions in the chloroplast genome with a high rate of variation, which is suitable for species identification [31]. These regions are easy to amplify, and the primers are versatile enough for a wide range of plant groups. Specific primer sequences and amplification conditions are provided in the literature as a reference for the design of this experiment. Two DNA barcode, psbk-psbl and atpF-atpH, were amplified using gene specific primers (Table 2). The PCR reactions (50 µL final volume) containing 25 µL of 2 × Phanta Max Buffer (Vazyme Biotech Co., Ltd., Nanjing, China), 2 µL of gDNA (20–50 ng/μL), 2 µL of each forward and reverse primer (10 µM), 1 µL of Phanta Max Super-Fidelity DNA Polymerase (2.5 U/μL), 1 µL of dNTP mix (10 mM), and 17 μL PCR-grade ddH2O. Optimal annealing temperatures for each primer pair were determined through gradient PCR (Table 2). The PCR products were visualized by 2% (w/v) agarose gel electrophoresis in 1 × TAE buffer and visualized under UV light.

2.2.3. Sequencing and Bioinformatics

An analysis using bidirectional sequencing was performed by Tsingke Biotechnology Co. (Guangzhou, China). Raw chromatograms were processed via BioEdit 7.2.5, with low-quality regions removed and sequences corrected manually. For taxonomic identification, consensus sequences were aligned against the NCBI nucleotide database using BLASTn (E-value ≤ 1 × 10⁻¹⁰). Similar sequences from closely related species were downloaded from GenBank (detailed sequence information is provided in Table S1 in Supplementary Material). We employed Kimura two-parameter model “https://pubmed.ncbi.nlm.nih.gov/7463489/ (accessed on 15 February 2025)” to analyze genetic distance model, and the Bootstrap test which set the number of repetitions (1000) to evaluate the node support rate. The Neighbor-Joining (NJ) algorithm is used for the construction of phylogenetic trees.

2.3. Genetic Diversity Analysis of Agronomic Traits

Agronomic phenotypic traits were analyzed using the Shannon–Wiener index (H′) “https://pubmed.ncbi.nlm.nih.gov/14078577/ (accessed on 15 February 2025)”. Phenotypic traits and biochemical characteristics were classified and graded (Table 3). The average observed values (X) and standard deviations (σ) were calculated for each trait, and relative frequencies were determined based on X ± Kσ (K = 0, 1, 2). The diversity index (H′) was calculated using the following formula:
H′ = −∑(Pi × lnPi)
where Pi is the relative frequency of a trait level, N is the total number of samples, and Ni is the number of individuals at a specific level.
Standard deviation, mean, maximum value, minimum value, coefficient of variation, and H′ values were calculated using Excel 16.0, while SPSS 26.0 was employed for correlation analysis, cluster analysis, and principal component analysis (PCA). Leaf length, leaflet width, leaflet length, and root diameter were measured using a ruler. For biochemical traits, plant roots were ground into fine powder and extracted at 60 °C with a 1:10 (w/v) solid-to-solvent ratio using 50% methanol, with extraction performed using an ultrasonic device for 30 min. The extracted solution was used as Sample 1, and Sample 2 was prepared by mixing with a color reagent for absorbance measurement. High-performance liquid chromatography (HPLC) was utilized to measure the peak areas of Vitamin B3 and Hypaphorine, which were then used to calculate the final content values.

2.4. Preparation of MS Samples

For each batch of the 19 N. speciosa germplasms, biological triplicates (n = 3) were processed through an optimized extraction protocol. Precisely 0.2 g of fine plant powder was mixed with 50% methanol at a solid-to-liquid ratio of 1:20 (w/v). Ultrasonication-assisted extraction was conducted at 50 °C for 60 min using a thermostatic ultrasonic bath (40 kHz, 500 W), and subsequently centrifuged at 3500 rpm for 10 min using a high-speed centrifuge. The supernatants were filtered through 0.22 μm PTFE membranes prior to ultra-high-performance liquid chromatography–quadrupole–orbitrap mass spectrometry (UPLC-Q-Orbitrap/MS) analysis. For quality assurance, a quality control (QC) sample was prepared by pooling 20 μL of each of the 57 individual samples. The pooled QC sample was thoroughly vortexed to ensure phase homogeneity. All samples were maintained at 4 °C in amber glass vials during autosampler storage to prevent photodegradation.

2.5. UPLC-Q-Orbitrap/MS Analysis

Chromatographic analysis was performed on a Vanquish Flex UPLC system (Thermo Fisher Scientific), equipped with a Hypersil GOLD C18 column (100 × 2.1 mm, 1.9 μm). The mobile phase comprised (A) 0.1% formic acid in water and (B) 0.1% formic acid in acetonitrile. A multistep gradient was implemented: 0–12 min from 95% to 5% A (linear), 12–13.001 min isocratic at 5% A, 13.001–13.1 min return to initial conditions (95% A), followed by 1.9 min column re-equilibration. The system operated at 0.3 mL/min flow rate with column temperature maintained at 35 °C. Mass spectrometric detection was performed using an Orbitrap Exploris 120 mass spectrometer (Thermo Fisher Scientific, Waltham, MA, USA) equipped with a heated electrospray ionization (HESI) source. Key parameters were optimized as follows: sheath gas 50 psi, auxiliary gas 8 psi; capillary temperature 325 °C; vaporizer temperature 350 °C; and S-lens RF 60%. Full scan MS1 spectra (m/z 100–1500) were acquired at 60,000 FWHM resolution, with data-dependent MS2 scans triggered above 1 × 10⁴ intensity threshold at 15,000 resolutions. Dynamic exclusion was set to 15 s with ±10 ppm mass tolerance. Collision energy ramping (20%, 40%, and 60%) enabled comprehensive fragmentation. Instrument control and data acquisition were managed through Xcalibur 4.3 software under positive/negative ion switching mode (spray voltage +3.5/−2.8 kV).
Mass spectrometric data were processed using Compound Discoverer 3.3 (Thermo Fisher Scientific, USA). This processing involved peak extraction, alignment, and compound identification by matching MS/MS spectra against the mzCloud and mzVault databases, with identification criteria requiring a mass deviation of less than 5 ppm and a matching score of at least 80.
Use MetaboAnalyst V5.0 “https://www.metaboanalyst.ca/ (accessed on 15 February 2025)” for data processing, with specific parameters: upload data first, select “Remove missing values”, select Normalization by sum, select logarithmic transformation, and remove low variance metabolites (variance < 10%). Statistical analysis: multivariate analysis: principal component analysis (PCA): default parameters for data dimensionality reduction and visualization. Partial least squares discriminant analysis (PLS-DA): categorical variables are set for analysis of differences between groups. Metabolite annotation: metabolite annotation is performed using the built-in database (KEGG). Set the mass error range (±10 ppm) and retention time error range (±0.2 min). Pathway analysis: metabolite Set Enrichment Analysis (MSEA) was selected and the significance threshold was set (p < 0.05).

2.6. Multicriteria Evaluation System for Germplasm Performance

To assess the edible and medicinal potential of the 19 germplasms of N. speciosa, a comprehensive scoring system was developed based on key phenotypic, edible, and medicinal indicators. These quality indicators are determined by reference to Guo Peng’s master’s thesis [32]. The scoring process involved calculating the average value (X) and standard deviation (σ) for each indicator and categorizing the results into six grades according to the formula X ± Aσ, where A = 0, 1, or 2. According to Kumar S., et al., X (mean) ± Aσ (standard deviation) were used as grading scoring criteria for the analysis of variation in plant agronomic phenotype and metabolite content [33]. In this study, we also referred to the grading scoring method of Kumar S, and further proposed the score: the narrower and shorter the leaves, the shorter the root diameter, the lower the vitamin B3 content, the lower the protein content, the lower the total flavonoid content, and the smaller the VIP value, indicating that the agronomic phenotypic traits and biochemical characteristics and metabolite levels were worse. Therefore, as shown in Table 4 and Table 5, the worst agronomic phenotypic traits, biochemical characteristics, and metabolite levels were divided into the first level, which was numerically X1 ≤ X − 2σ, and assigned a score of 1. Those with poor agronomic phenotypic traits, biochemical characteristics, and metabolite levels were divided into the second level, which were X − 2σ < X2 ≤ X − σ numerically, and were assigned two points, and so on. As Kim M. J., et al. have shown, leaflet length and leaflet width are relatively unimportant in terms of edible indices [34], so leaflet length and leaflet width are assigned a score of 0.5 points in the first level. The specific weights and assigned points are as follows:
For edible indicators, the weights were assigned as follows: leaflet length and leaflet width were each assigned a weight of 0.1, while root diameter, vitamin B3 content, protein content, and total sugars were each assigned a weight of 0.2 (Table 4). For medicinal indicators, the weights were distributed as follows: vitamin B3 content, total sugars, and total flavonoids were each assigned a weight of 0.2, while the variable importance in projection (VIP) value, representing the importance of differential metabolites (with two metabolites having VIP > 5 selected as observed indicators), was assigned a weight of 0.4 (Table 5).
The comprehensive performance score for each germplasm was calculated using a weighted average of the edible and medicinal scores. Statistical analyses, including mean value calculation, standard deviation, and coefficient of variation, were performed using Microsoft Excel. Additionally, correlation analysis, cluster analysis, and principal component analysis (PCA) were conducted using SPSS 26.0 to evaluate the genetic diversity among the germplasms and identify promising candidates for future breeding programs.

3. Results

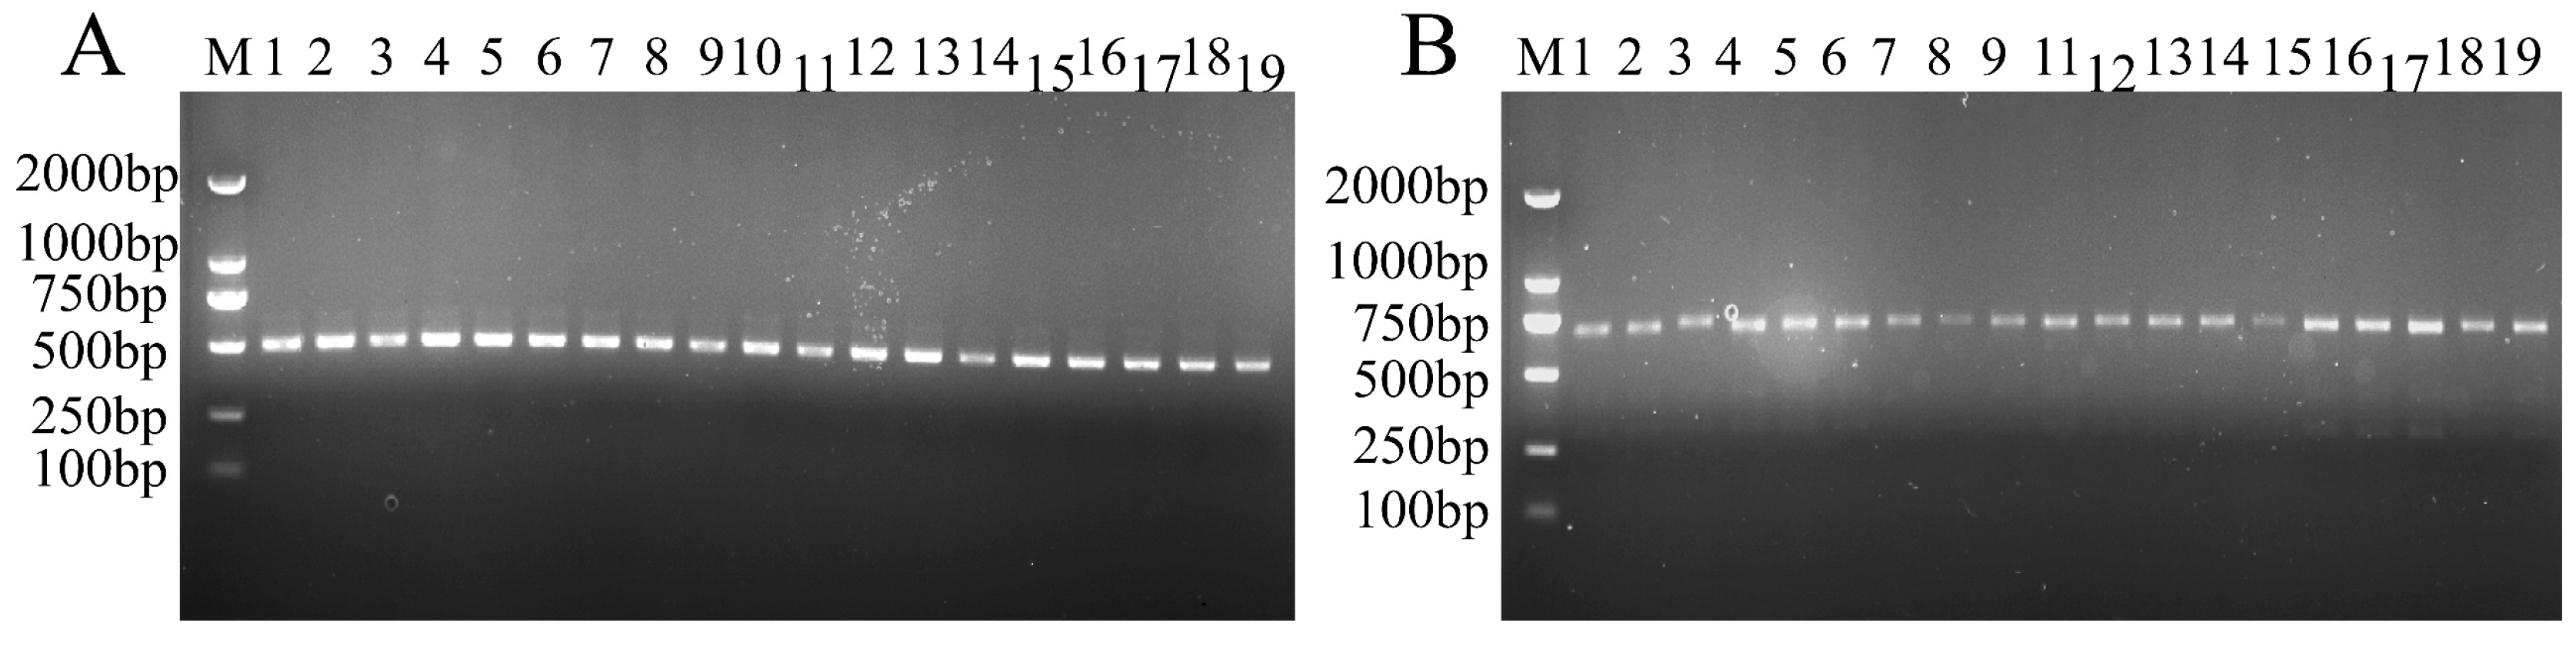
3.1. Molecular Characterization of Chloroplast Barcodes

The chloroplast intergenic regions psbk-psbl and atpF-atpH were universally amplified from all 19 N. speciosa germplasms, with distinct electrophoretic bands observed in 2% agarose gels (Figure 1). Bidirectional sequencing confirmed high-quality sequences (QV > 30) for all amplicons. A comparative analysis against 29 NCBI reference sequences (Table S1) was performed using BLASTn with default parameters (E-value < 1 × 10⁻⁵). After multiple sequences with MegAlign alignment and manual correction, the key molecular features were evaluated and summarized in Table 6.
The atpF-atpH region demonstrated superior length polymorphism (599 bp vs. 444 bp in psbk-psbl), while psbk-psbl exhibited a higher thermostability potential as evidenced by the elevated GC content (28.05% vs. 25.04%). The level of sequence conservation calculated by MEGA 11.0. showed psbk-psbl maintained 95.9% conserved sites (426/444), significantly higher than atpF-atpH’s 91.3% (547/599). Conversely, atpF-atpH displayed greater genetic variability with the following: (1) 8.7% variable sites (52/599) vs. 4.1% (18/444) in psbk-psbl; and (2) 5.5% parsimony-informative sites (33/599) vs. 2.3% (10/444).
Among the variable sites in the atpF-atpH region, specific contributions were observed from NDL-8, NDL-11, NDL-2, NDL-3, and NDL-4, with germplasms NDL-10 and others showing minimal contributions. These findings suggest that, among the 19 germplasms of N. speciosa analyzed, the atpF-atpH barcode exhibits the highest sequence variability, making it a promising candidate for a DNA barcode to differentiate N. speciosa.

3.2. Molecular Divergence Assessment and Barcode Gap Evaluation

Genetic distances were calculated using the Kimura 2-Parameter (K2P) model to assess the interspecific and intraspecific variability of the psbk-psbl and atpF-atpH barcode sequences (Table 7). As shown in Table 7, the atpF-atpH intergenic spacer demonstrated significantly higher molecular variation than psbk-psbl at both taxonomic levels (p < 0.01, Mann–Whitney U test). The average intraspecific genetic distance was larger for atpF-atpH compared to psbk-psbl. Similarly, the average interspecific genetic distance was also greater for atpF-atpH than for psbk-psbl. A comparative analysis of the genetic distance distributions revealed that psbk-psbl exhibited a minimal genetic distance both within and between species, with a certain degree of overlap between intraspecific and interspecific distances. In contrast, atpF-atpH displayed larger genetic distances within and between species, with a clear separation between the two categories. The average interspecific genetic distance for atpF-atpH was significantly greater than its average intraspecific genetic distance, further supporting its higher discriminatory power. These results highlight the superior variability and barcoding gap of the atpF-atpH barcode, making it a more effective molecular marker for distinguishing species within the N. speciosa.

3.3. Phylogenetic Analysis

The phylogenetic reconstruction conclusively validated the discriminatory capacity of the atpF-atpH intergenic spacer as a molecular barcode. Utilizing sequence polymorphisms and phylogenetically informative sites identified through preliminary analyses, we generated a neighbor-joining (NJ) phylogenetic tree with 1000 bootstrap replicates in MEGA 11.0 (Figure 2). The resulting topology demonstrated significant phylogenetic resolution, segregating the germplasms into distinct clades with notable evolutionary divergence. Notably, five germplasms (NDL-2, NDL-3, NDL-4, NDL-8, and NDL-11) formed well-defined monophyletic clusters, while the remaining germplasms clustered together.
The phylogenetic architecture revealed NDL-8 as the most divergent lineage, followed sequentially by NDL-3, both exhibiting substantial genetic distance from the primary cluster (branch length > 0.012 substitutions/site). All major nodes received strong statistical support (bootstrap values 62–98%), confirming the reliability of the inferred relationships. These findings underscore the utility of the atpF-atpH sequence as a core DNA barcode for accurately identifying and classifying N. speciosa, particularly within the context of plant biodiversity and conservation efforts in China.

3.4. Analysis of Variance in Agronomic Phenotypic Traits and Biochemical Characteristics

An analysis of variance revealed significant inter-germplasm differences (p < 0.05) in both agronomic phenotypic traits and biochemical characteristics among N. speciosa accessions (Table 8). The comprehensive phenotypic characterization demonstrated substantial morphological and biochemical diversity across the germplasm collection.
In terms of leaf morphological variation, germplasms NDL-1, NDL-2, NDL-6, NDL-9, NDL-16, and NDL-18 exhibited significantly longer leaf lengths (>15 cm), with NDL-1 showing the maximum length of 19.7 ± 2.06 cm. In contrast, NDL-14 displayed the shortest leaf length (3.78 ± 0.61 cm). Leaflet dimensions showed distinct patterns, where NDL-5 displayed the longest leaflet (length: 10.20 ± 1.97 cm; width: 5.07 ± 1.45 cm), while NDL-8 and NDL-14 had the narrowest leaflet width (1.60 ± 0.20 cm and 4.37 ± 1.42 cm, respectively).
Regarding root traits, root diameter measurements revealed NDL-15 had the longest root diameter (1.42 ± 0.21 cm), contrasting with NDL-19’s minimal root diameter (0.69 ± 0.27 cm). Most germplasms maintained intermediate root diameters ranging from 0.70 cm to 1.30 cm, suggesting moderate genetic variability in this trait.
In biochemical composition profiling, the biochemical analysis uncovered notable metabolic diversity. The vitamin B3 content ranged from 11.57 ± 0.53 μg/g (NDL-8) to 60.69 ± 0.77 μg/g (NDL-7). Protein content extremes were observed between NDL-2/NDL-3 (1.09 ± 0.14 mg/g) and NDL-14/NDL-16 (0.19 ± 0.05 mg/g). Total sugars showed a 3.2-fold variation, from 43.00 ± 0.33 mg/g (NDL-1) to 137.76 ± 0.26 mg/g (NDL-16). Flavonoid accumulation peaked in NDL-18 (1.23 ± 0.10 mg/g), while NDL-4 and NDL-10 showed minimal synthesis (0.72–0.73 mg/g). Hypaphorine content demonstrated a 2.2-fold variation, with maxima in NDL-11/NDL-14 (2.07–2.08 mg/g) and minima in NDL-2/NDL-3/NDL-4/NDL-16 (1.62–1.63 mg/g).

3.5. Diversity Analysis of Agronomic and Biochemical Traits in N. speciosa Germplasms

A comprehensive diversity analysis of 19 N. speciosa germplasms revealed substantial phenotypic and biochemical variation, with coefficients of variation (CV) ranging from 14.29% to 48.43% across measured parameters (Table 9). This quantitative characterization provides critical insights into the germplasm’s genetic potential for breeding applications.
The morphological analysis demonstrated distinct patterns of variation: leaf dimensions exhibited moderate to high variability (CV: 29.92–44.86%); leaf length showed the greatest absolute variation (extreme difference: 15.92 cm); leaflet width displayed the highest morphological (CV: 44.86%); and root architecture showed relatively conserved variation (CV: 21.36%), with the maximum diameter (1.52 cm) 2.2-fold greater than the minimum (0.69 cm). These findings suggest a strong environmental adaptability in foliar development compared to the more genetically constrained root system development.
Biochemical traits displayed exceptional diversity: protein content showed maximum variability (CV: 48.43%), ranging 5.7-fold from 0.19 to 1.09 mg/g; vitamin B3 exhibited the largest absolute biochemical difference (49.12 μg/g range); total flavonoids demonstrated remarkable stability (CV: 14.29%), with values confined to 0.72–1.23 mg/g; and hypaphorine content maintained a moderate variation (CV: 19.51%) despite a 2.04-fold concentration range. The inverse relationship between protein content variability and flavonoid stability suggests distinct regulatory mechanisms governing nitrogenous compound versus secondary metabolite biosynthesis.
Notable differential patterns emerged: the leaflet width (CV: 44.86%) vs. length (CV: 29.92%) variation indicates the independent genetic control of these foliar dimensions; protein content’s exceptional variability (CV: 48.43%) highlights the potential for nutritional enhancement through selective breeding; the total sugars’ moderate variation (CV: 20.04%) contrasts with its wide concentration range (43.00–137.76 mg/g), suggesting threshold-regulated accumulation.
These patterns provide strategic targets for germplasm utilization: high-variation traits (protein and leaflet width) offer immediate selection potential, while stable traits (flavonoids) may require molecular interventions for modification.
The Shannon–Wiener diversity index (H′) analysis revealed substantial genetic variability among 10 key traits in N. speciosa germplasms, with indices ranging from 1.118 to 1.470 (mean = 1.282), indicating moderate to high genetic diversity (Table 10). Notably, the vitamin B3 content demonstrated the highest genetic diversity (H′ = 1.417), followed by leaflet length (H′ = 1.412) and protein content (H′ = 1.470). From the multidimensional trait comparison analysis, it can be observed that the contents of vitamin B3 (H′ = 1.417), protein (H′ = 1.470), and the length of small leaves (H′ = 1.412) exhibit the highest genetic diversity, with their distribution frequencies showing typical multimodal distribution characteristics. Specifically, the content of vitamin B3 displays an even distribution across levels 1, 2, and 6 (with frequencies of approximately 15.5% for each level), while the cumulative frequency for levels 3 and 4 reaches 71.5%. This distribution pattern suggests that this trait may be regulated by the synergistic action of multiple genetic loci or significantly influenced by environmental factors. In contrast, the content of total flavonoids (H′ = 1.118) shows a unimodal distribution across levels 2–5 (with level 4 reaching 32.8%), indicating a relatively conservative genetic basis.
Notably, traits with high genetic diversity (H′ > 1.3) exhibit two typical distribution patterns: (1) the “bimodal distribution” of protein content and small leaf length (with frequencies of 32.8% at levels 2 and 5, respectively), which may reflect the segregation of dominant/recessive alleles; and (2) the “plateau distribution” of the content of hypaphorine (with frequencies of 36.8% at levels 3 and 4), which implies the continuous variation characteristic of quantitative traits. The equal frequency distribution of the root diameter thickness at levels 3 and 4 (each at 36.4%) further validates the stable genetic characteristics of underground organ traits.
These findings suggest that N. speciosa germplasms maintain considerable genetic variability, particularly in nutrition-related biochemical traits (vitamin B3 and protein content) and foliar morphological characteristics. The bimodal distribution patterns observed in several traits may indicate disruptive selection pressures or the presence of major effect genes governing these characteristics. The high diversity indices for pharmacologically relevant compounds (hypaphorine and flavonoids) highlight the species’ potential for medicinal applications through targeted breeding programs.

3.6. Multivariate Analysis of Agronomic and Biochemical Traits in N. speciosa Germplasms

A Pearson correlation analysis of nine agronomic and biochemical traits across 19 N. speciosa germplasms revealed distinct relationship patterns (Figure 3A). The results revealed that intra-group correlations showed that Total sugars exhibited the strongest positive correlation (r = 0.910), while leaflet width showed a minimal association (r = −0.015). The inter-group correlation analysis showed the following: (1) Leaflet width correlated positively with leaflet length (r = 0.523, p < 0.05); (2) leaf length was negatively associated with root diameter (r = −0.491, p < 0.01); (3) in terms of biochemical–morphological interactions, the root diameter positively correlated with total sugars (r = 0.512, p < 0.05); and (4) hypaphorine had significant positive correlations with leaflet width (r = 0.652), leaflet length (r = 0.630), and root diameter (r = 0.504) (p < 0.01). These results suggest a coordinated regulation between photosynthetic structures (leaf dimensions) and root development, with hypaphorine potentially serving as a biochemical mediator in resource allocation strategies.
Principal component analysis (PCA) was performed on the nine traits and characteristics, resulting in the extraction of three principal components with a cumulative contribution rate of 69.313% (Figure 3B and Table 11). The first principal component (PC1) had an eigenvalue of 2.862, contributing 31.804% of the total variance, with leaflet width, root diameter, and hypaphorine content being the primary indicators (loadings of 0.743, 0.794, and 0.767, respectively). The second principal component (PC2), with an eigenvalue of 2.151, explained 23.895% of the total variance, with leaf length and protein content as the key indicators (loadings of 0.708 and 0.712). The third component (PC3), with an eigenvalue of 1.225, contributed 13.614% of the variance, with vitamin B3 content being the main indicator (loading of 0.822). A PCA biplot revealed that the first principal component, explaining 31.804% of the variance, was significantly influenced by leaflet width, root diameter, and hypaphorine content, while the second principal component, explaining 23.895% of the variance, was influenced by leaf length and protein content. The analysis highlighted that leaflet width, leaf length, root diameter, hypaphorine content, and protein content had significant contributions to the classification of the germplasms, serving as important evaluation criteria for N. speciosa germplasms.
The cluster analysis, based on Euclidean distance, classified the 19 N. speciosa germplasms into two phylogenetically significant clusters (Figure 4). Cluster I (NDL-2, NDL-4, NDL-5, NDL-8, NDL-10, NDL-11, and NDL-18) exhibited characteristics such as a longer leaf length, a larger root diameter, higher protein and sugar contents, and a higher hypaphorine content. In contrast, Cluster II (remaining 12 germplasms), showed a compact architecture (shorter leaf length, narrower leaflet width, and smaller root diameter), vitamin B3-enriched but with reduced protein and hypaphorine. The convergent results from multivariate analyses demonstrate the following: (1) trait co-evolution: this results in a strong integration between root morphology and alkaloid biosynthesis (PC1); (2) resource allocation trade-offs: negative leaf–root correlations suggest carbon partitioning constraints; and (3) breeding implications: PC1-associated traits (hypaphorine and root diameter) represent key targets for medicinal cultivar development.

3.7. Metabolomic Differences Analysis of Different Germplasms of N. speciosa

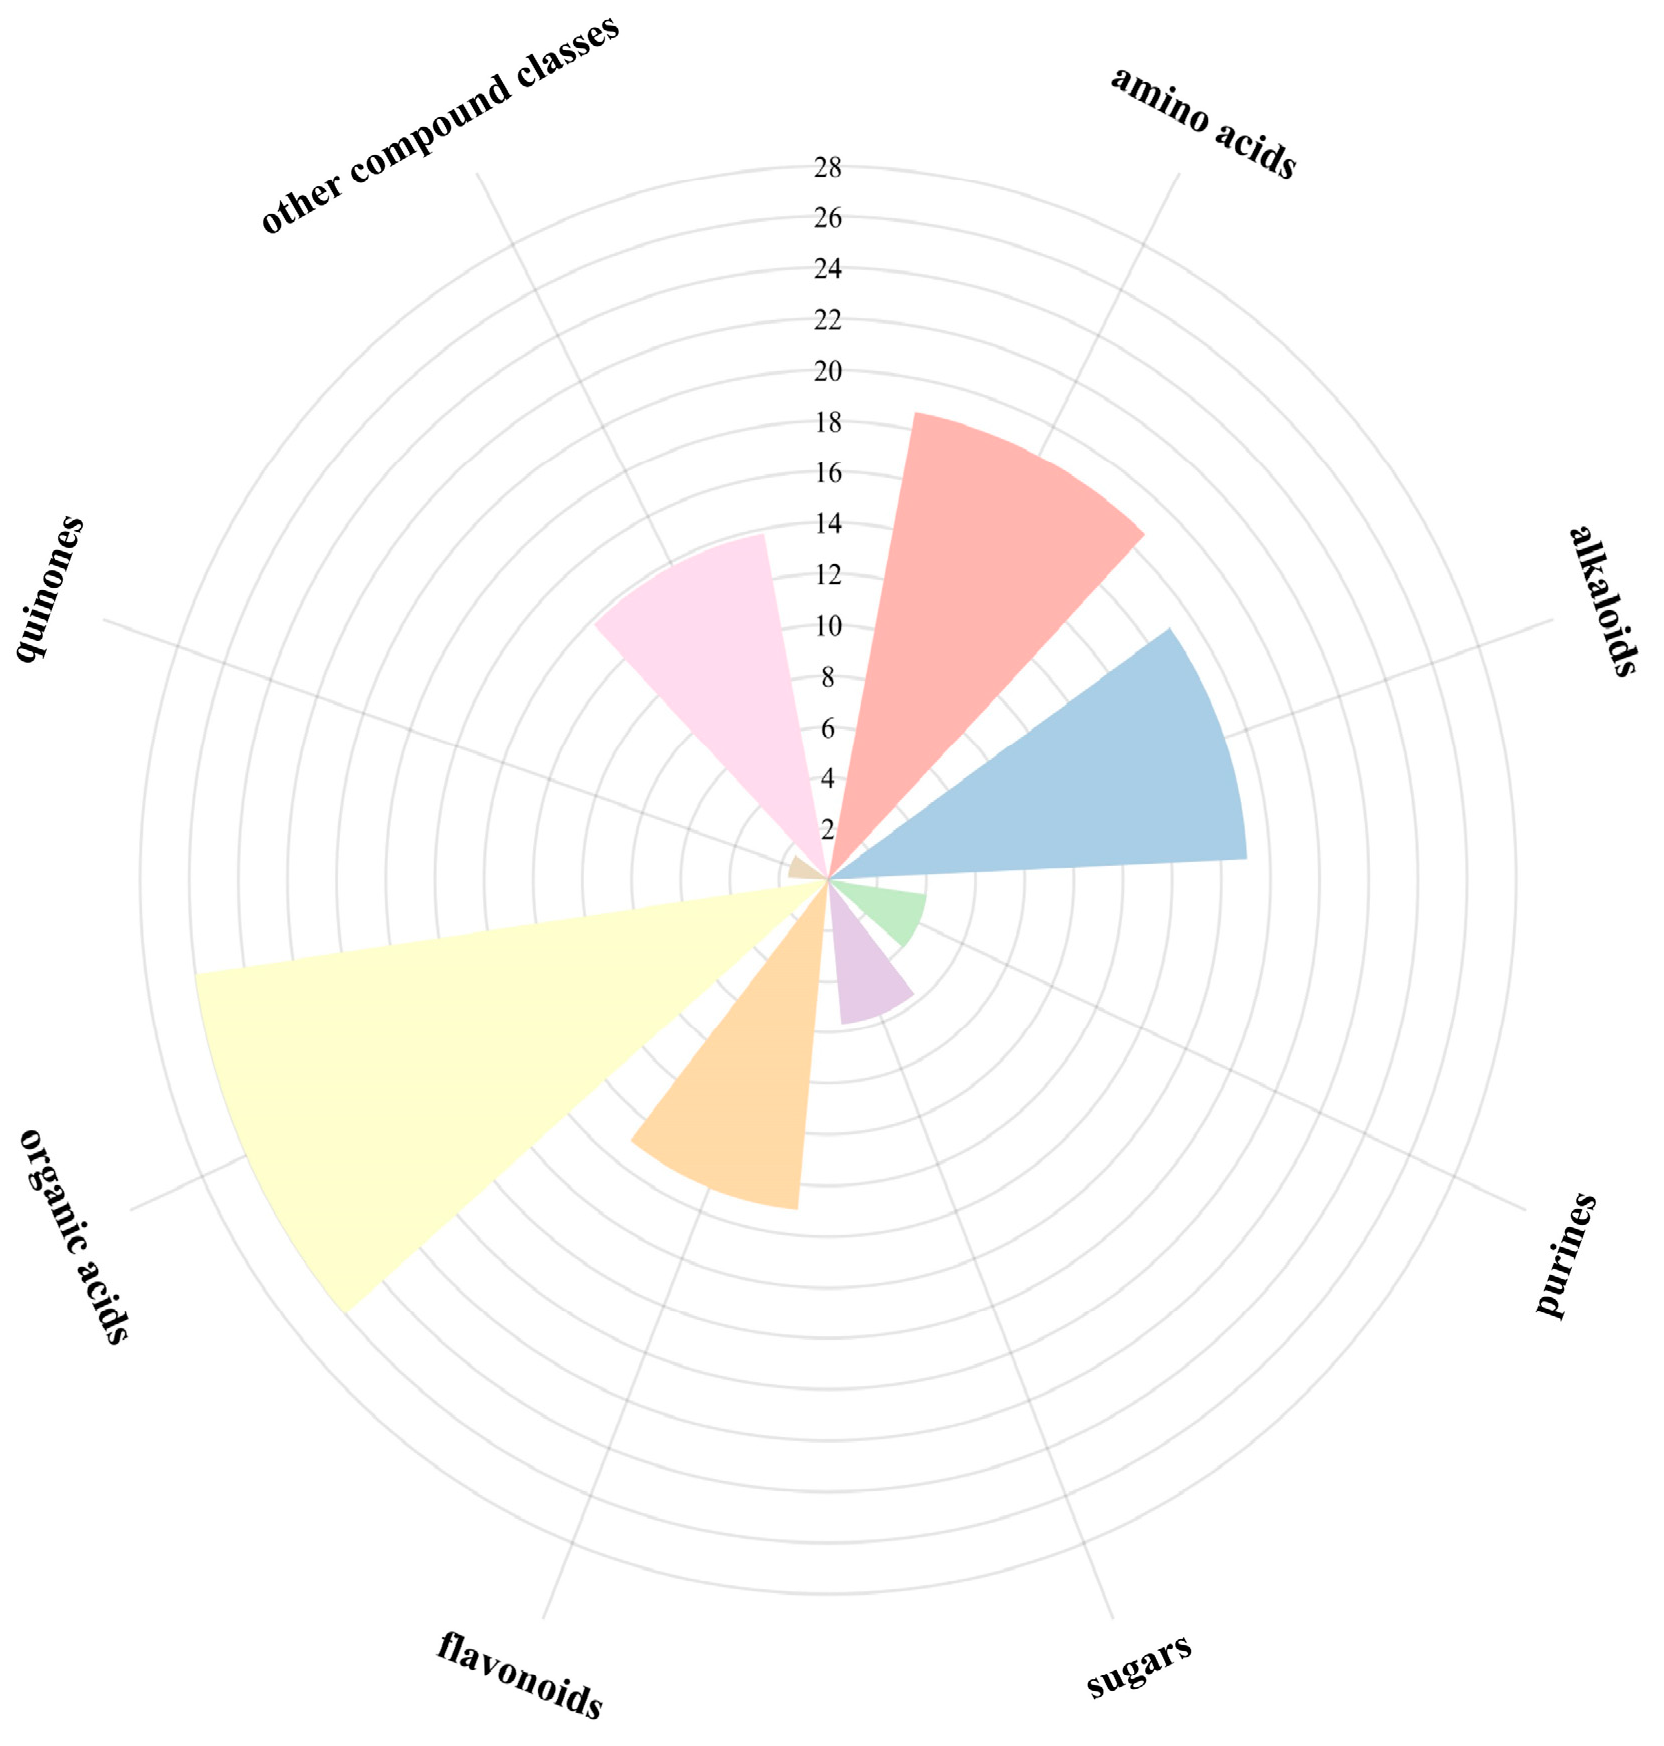
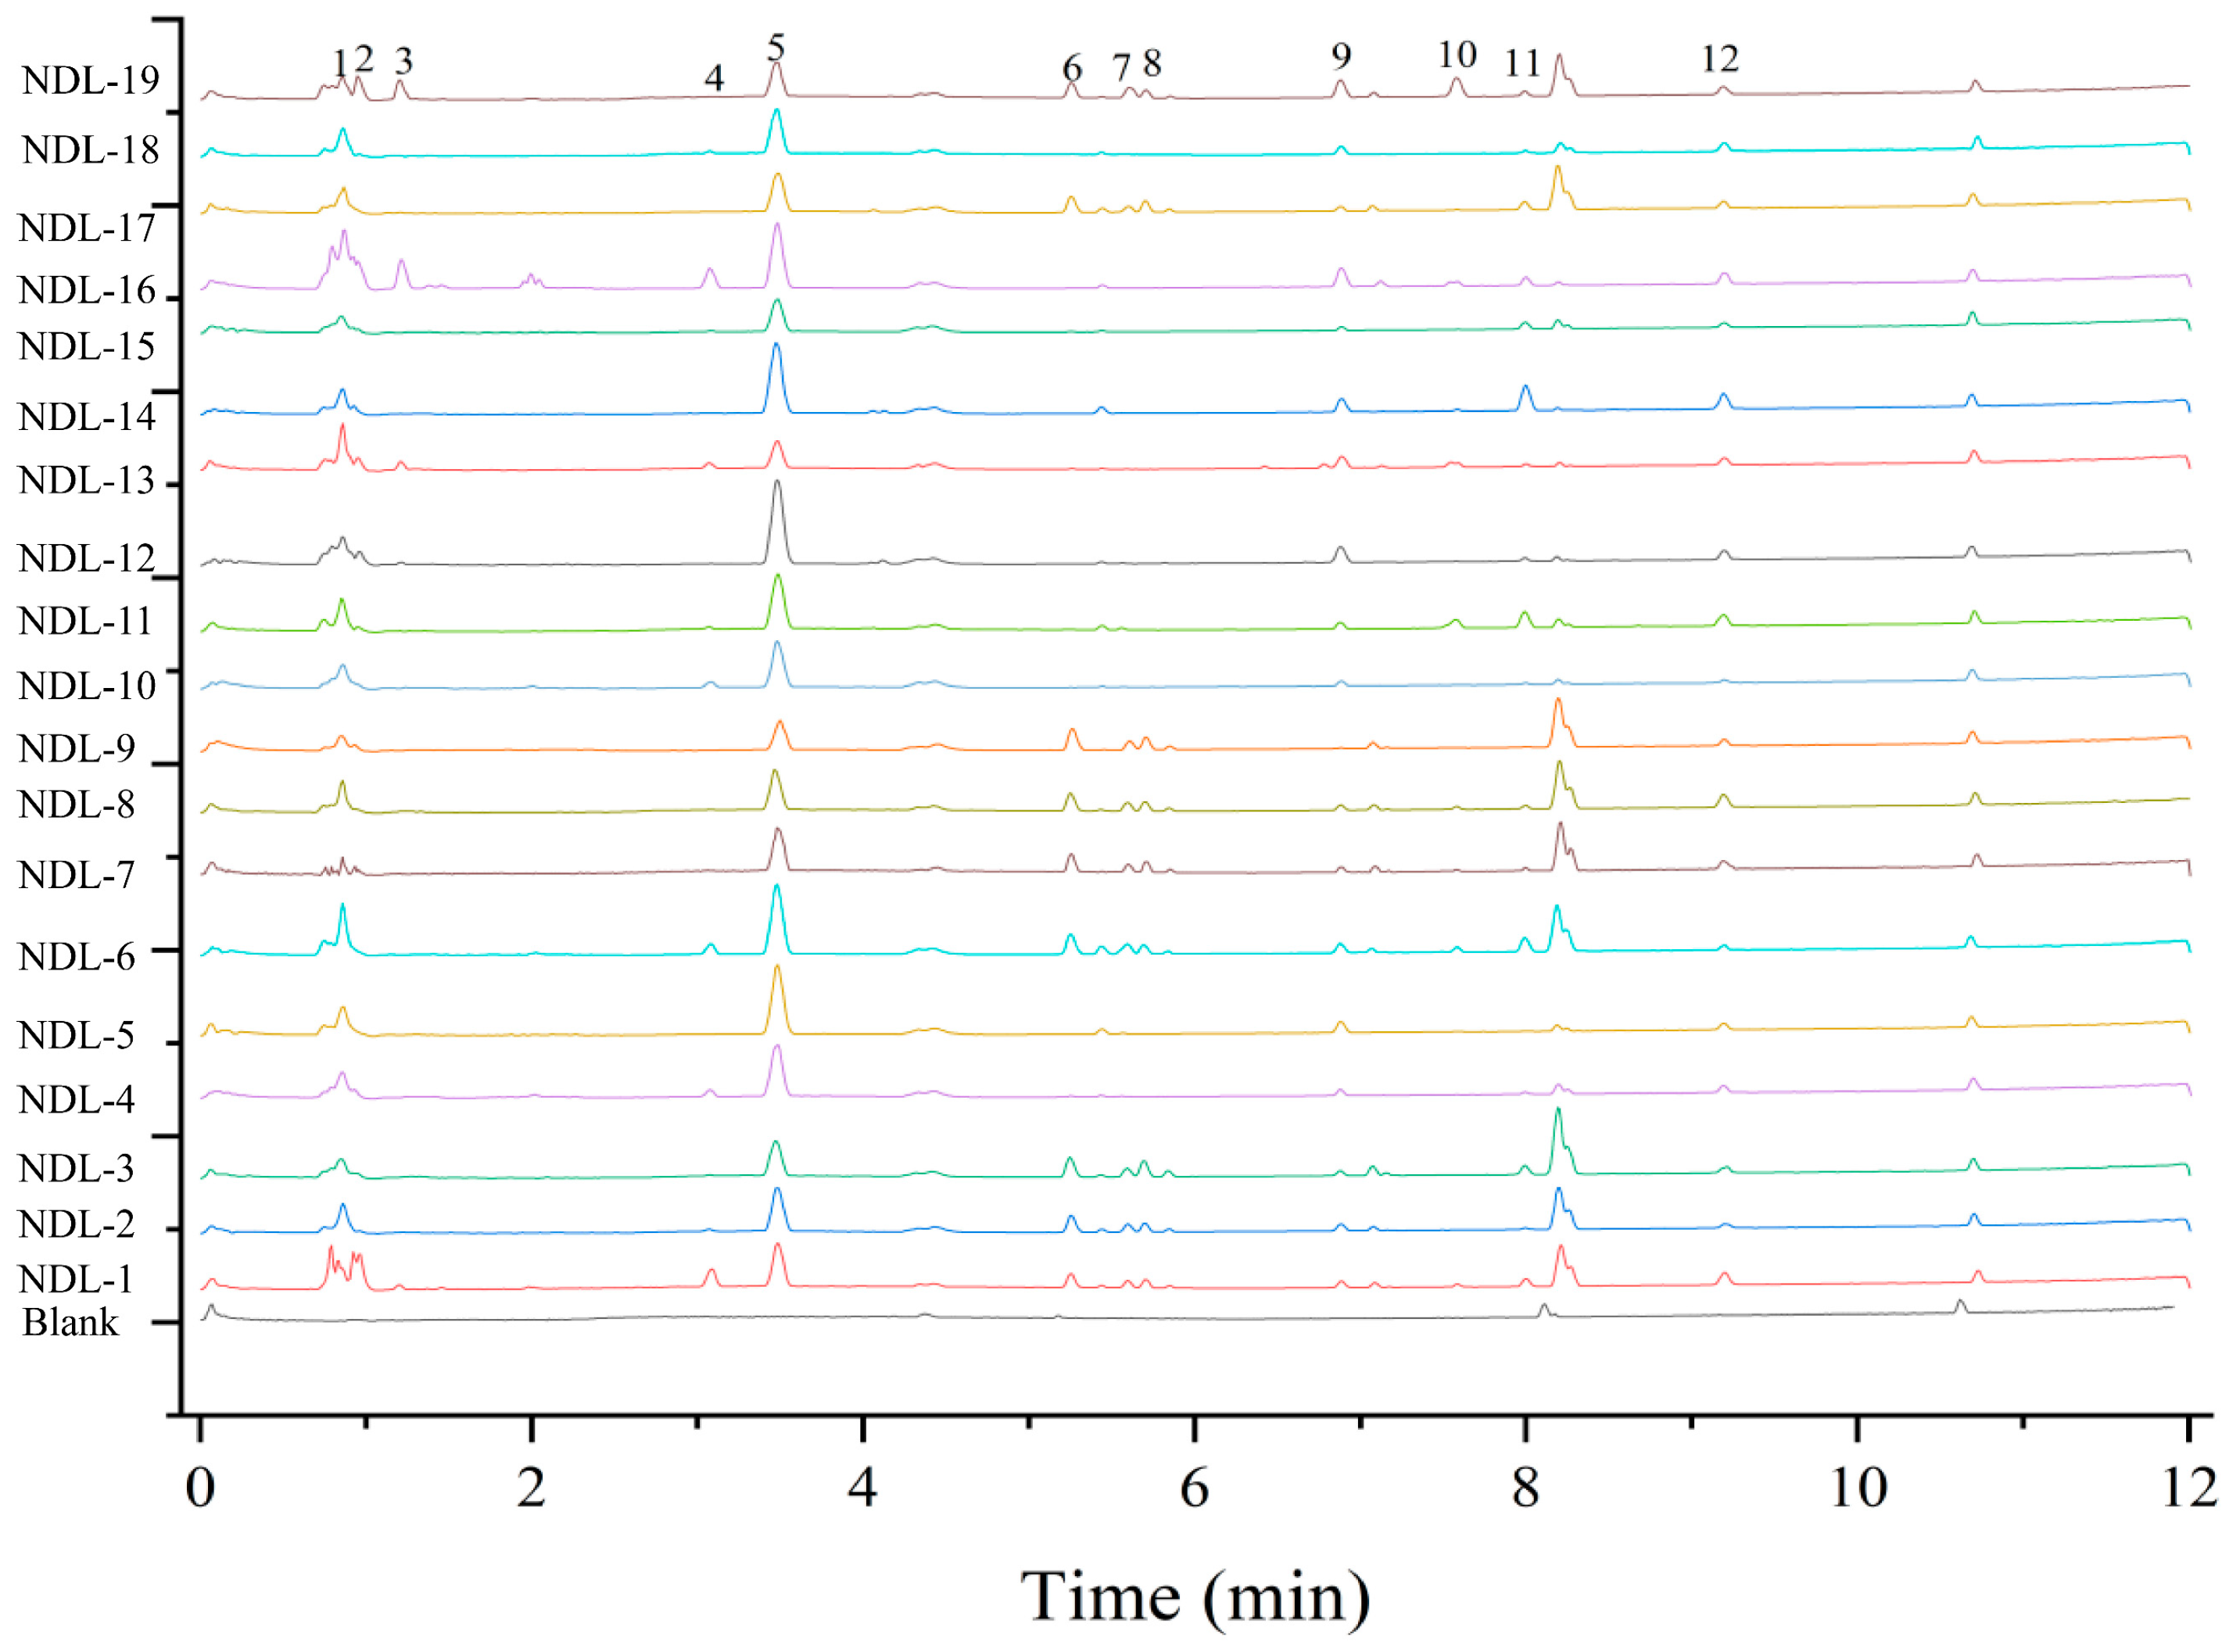
3.7.1. UPLC-Q-Orbitrap/MS Was Employed for the Qualitative Analysis of Samples

The results showed that 123 metabolites were identified in this study, as depicted in Figure 5. These metabolites were classified into eight major phytochemical classes: organic acids (32 compounds, 26.02%), amino acids (23 compounds, 18.70%), alkaloids (21 compounds, 17.07%), flavonoids (16 compounds, 13.01%), sugars (7 compounds, 5.69%), purines (5 compounds, 4.06%), quinones (2 compounds, 1.63%), and miscellaneous metabolites (17 other compounds, 13.82%). Notably, the metabolic profile was dominated by nitrogen-containing compounds (amino acids and alkaloids, collectively 35.77%) and antioxidative phytochemicals (flavonoids and organic acids, 39.03%), suggesting an evolutionary adaptation to environmental stressors. The complete annotated metabolite list is provided in Supplementary Table S2.

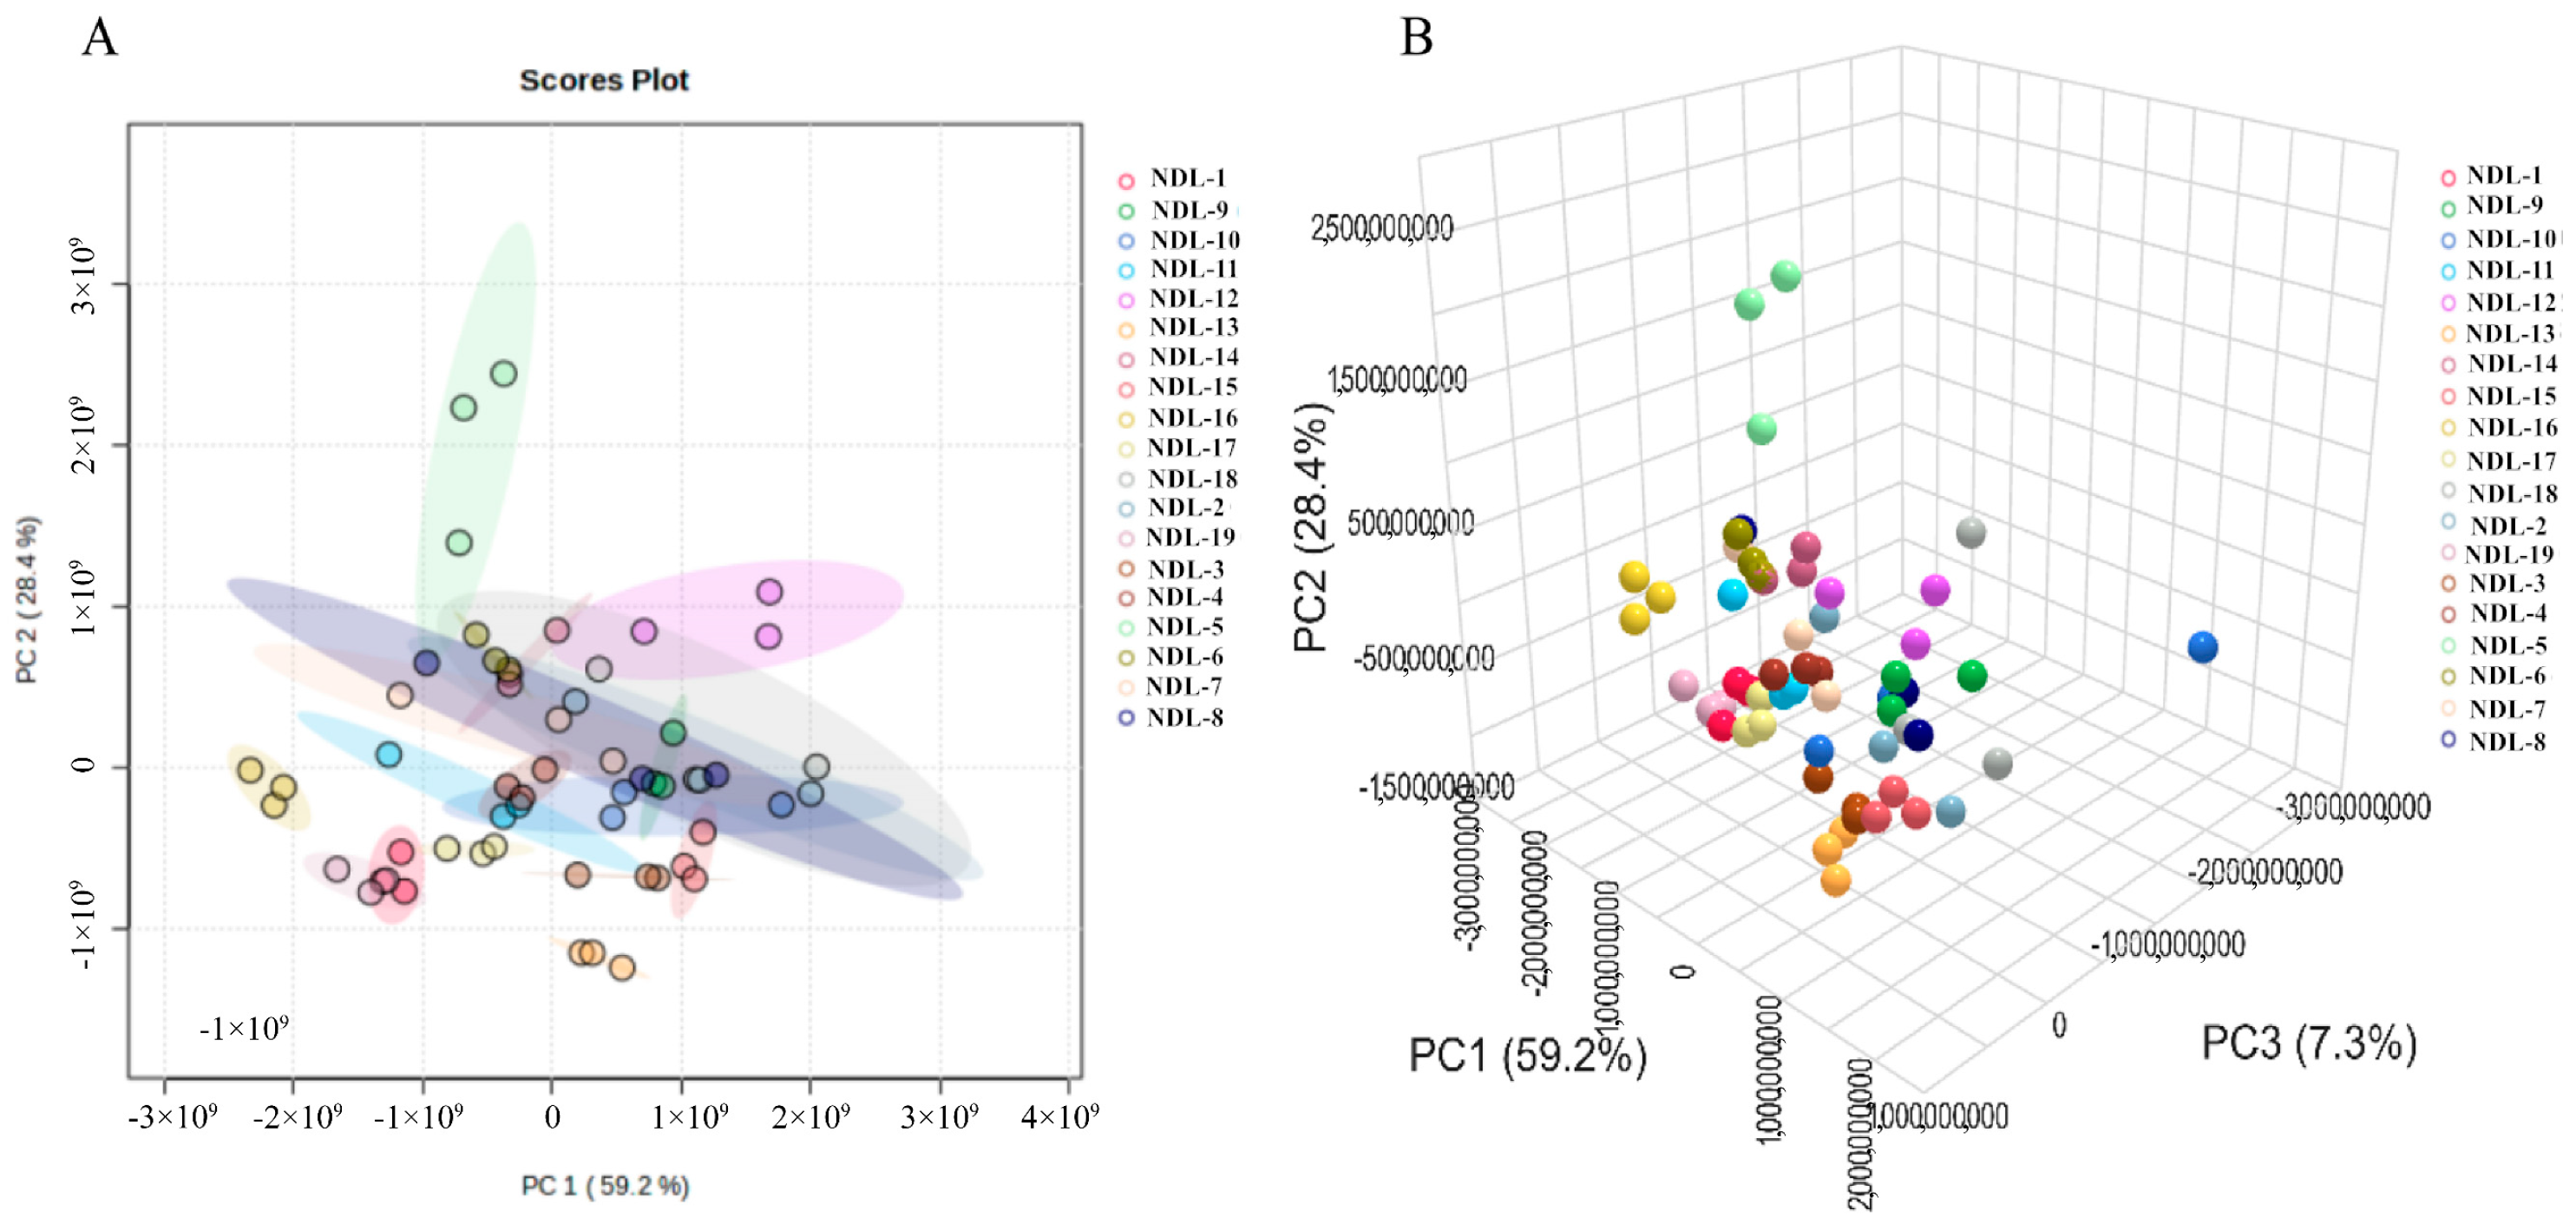
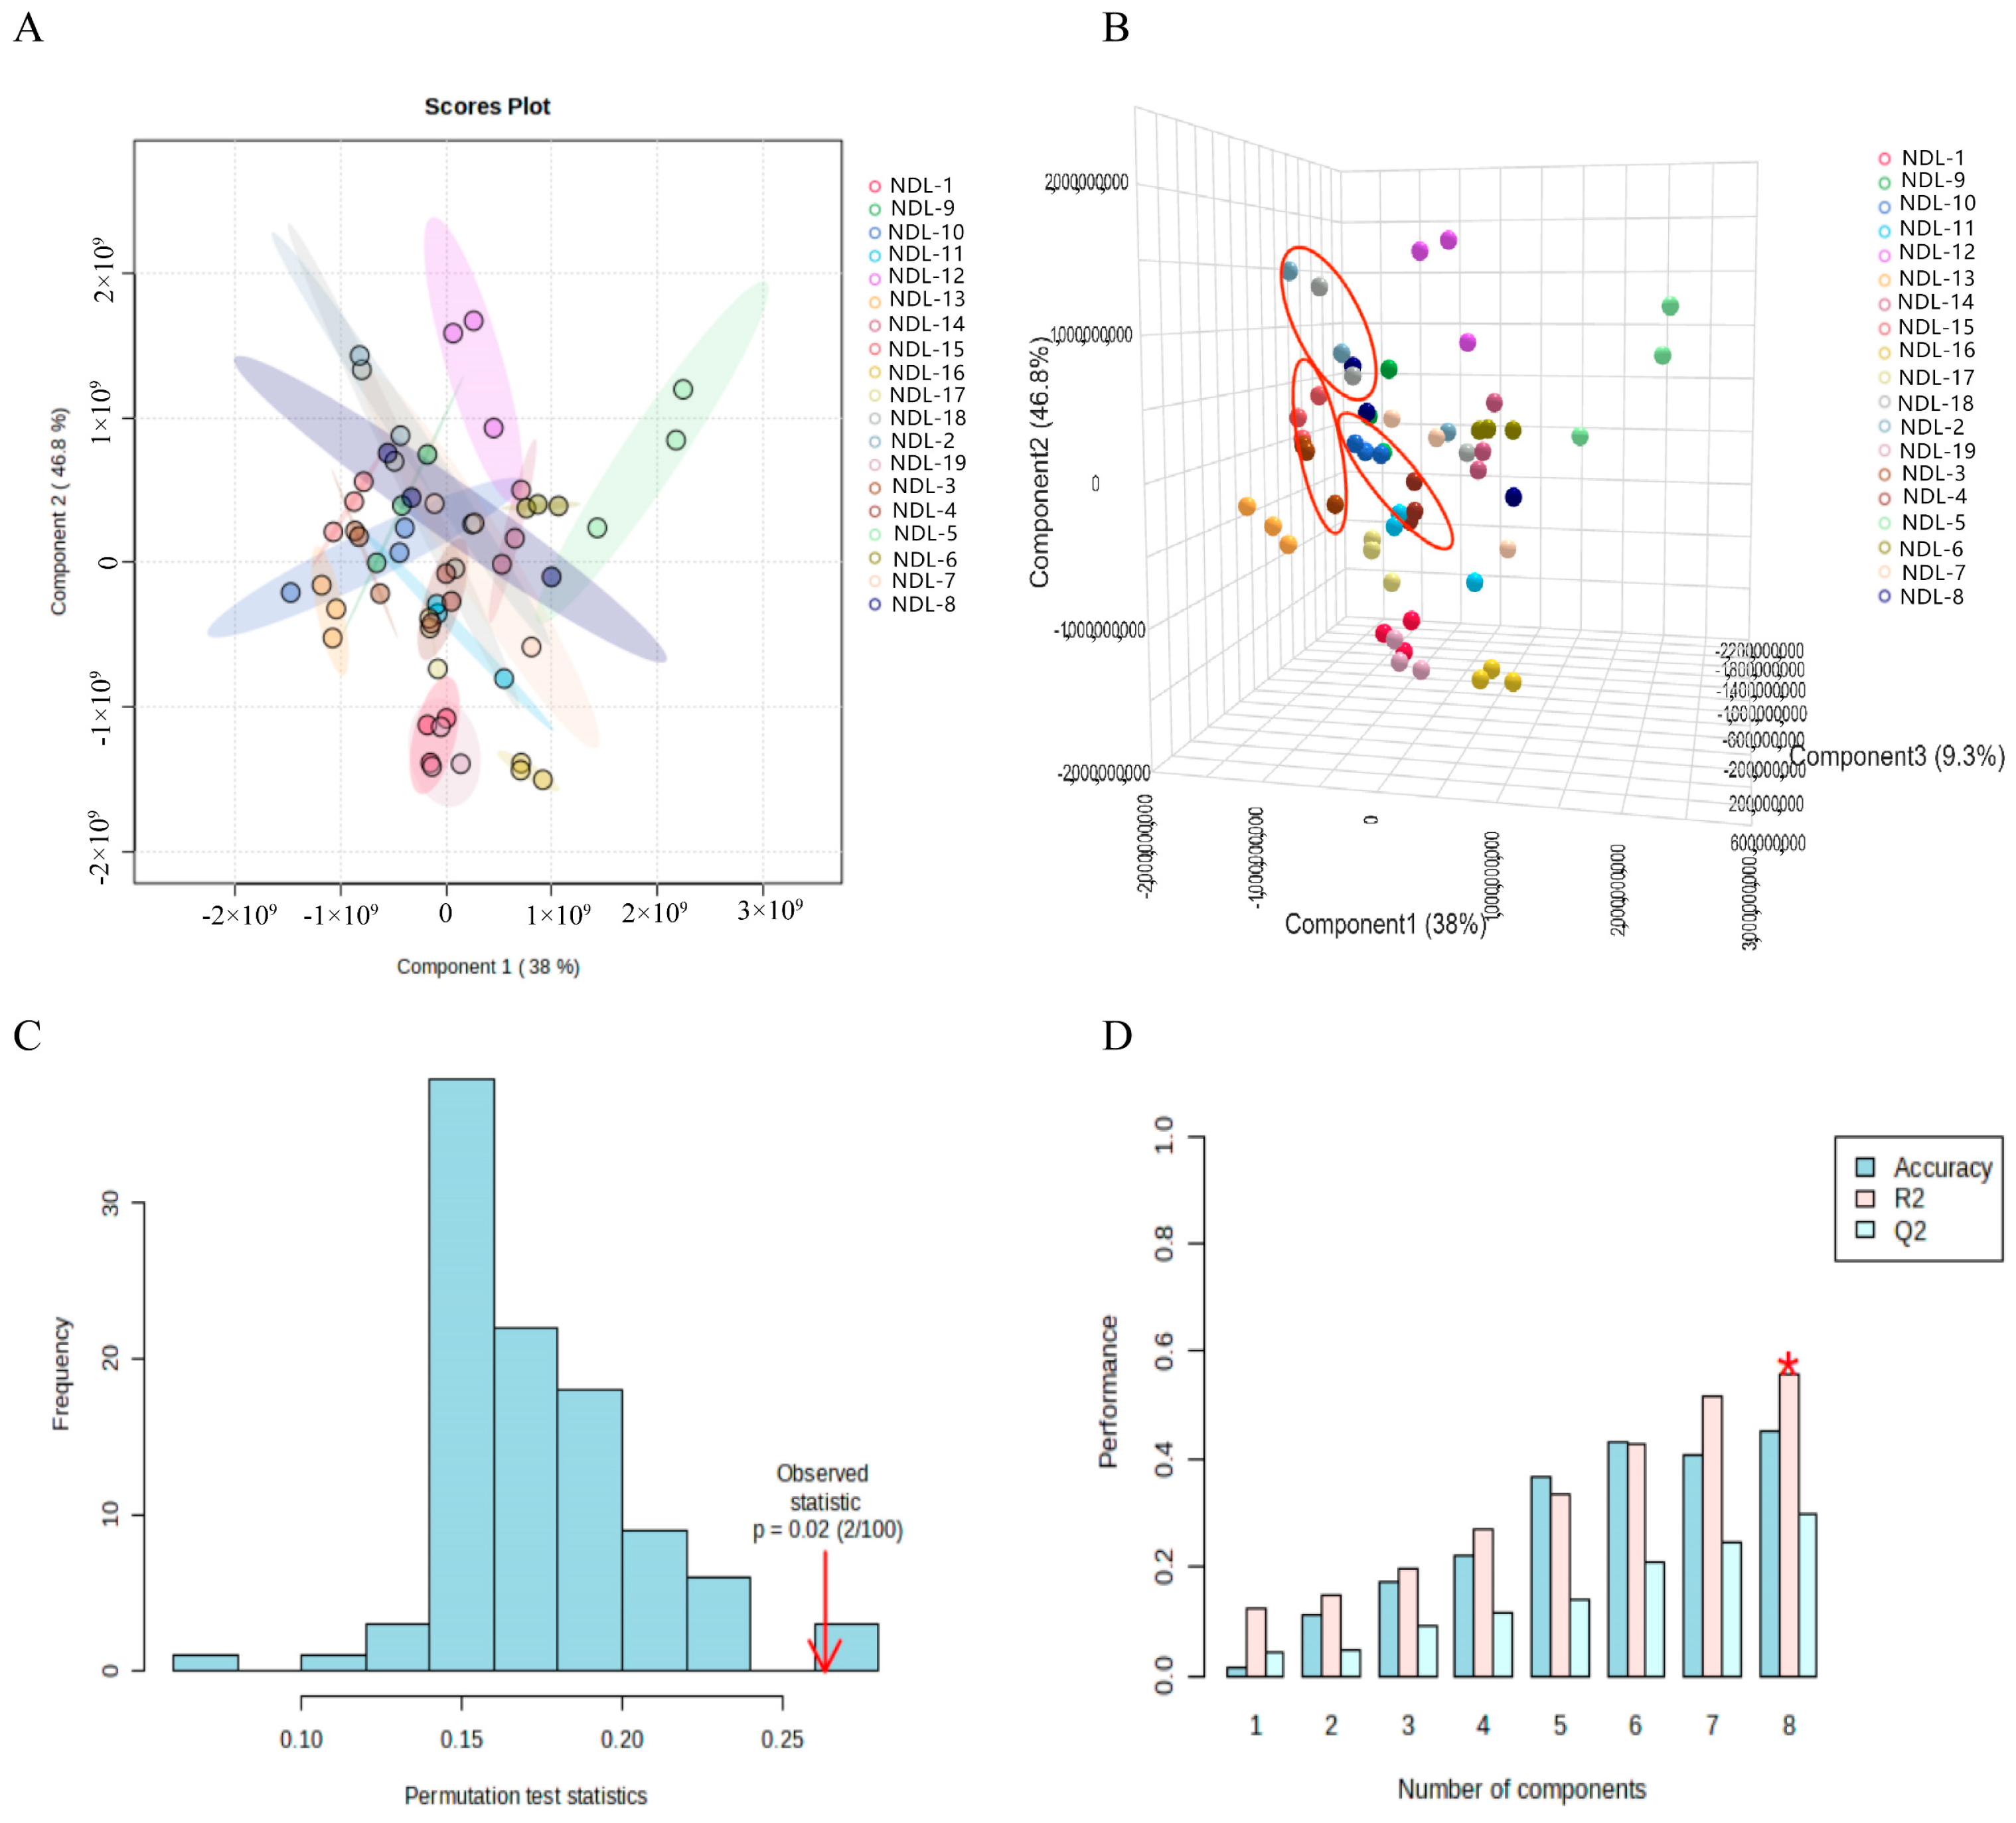
3.7.2. Principal Component Analysis (PCA) and Partial Least Squares Discriminant Analysis (PLS-DA)

Metabolomic analysis was conducted on 57 samples representing 19 N. speciosa germplasms (NDL1–NDL19). Base peak ion chromatograms (BPI) in positive ion mode were generated (Figure 6). Principal component analysis (PCA) was employed to reduce dimensionality and identify key data features. The first three principal components accounted for 59.2%, 28.4%, and 7.3% of the variance, respectively. Both 2D and 3D PCA plots (Figure 7A,B) revealed a significant overlap among germplasms, suggesting the limited group separation and challenges in identifying major metabolite differences.
To further investigate metabolite variations, partial least squares discriminant analysis (PLS-DA) was applied, yielding an R2 of 0.557 and a Q2 of 0.297 (Figure 8D). A permutation test (100 iterations) confirmed the model reliability (p = 0.02, p < 0.05) (Figure 8C). While 2D PLS-DA plots showed overlapping clusters, 3D PLS-DA plots (Figure 8A,B) effectively distinguished group differences, establishing PLS-DA as the superior method for metabolomic data analysis.

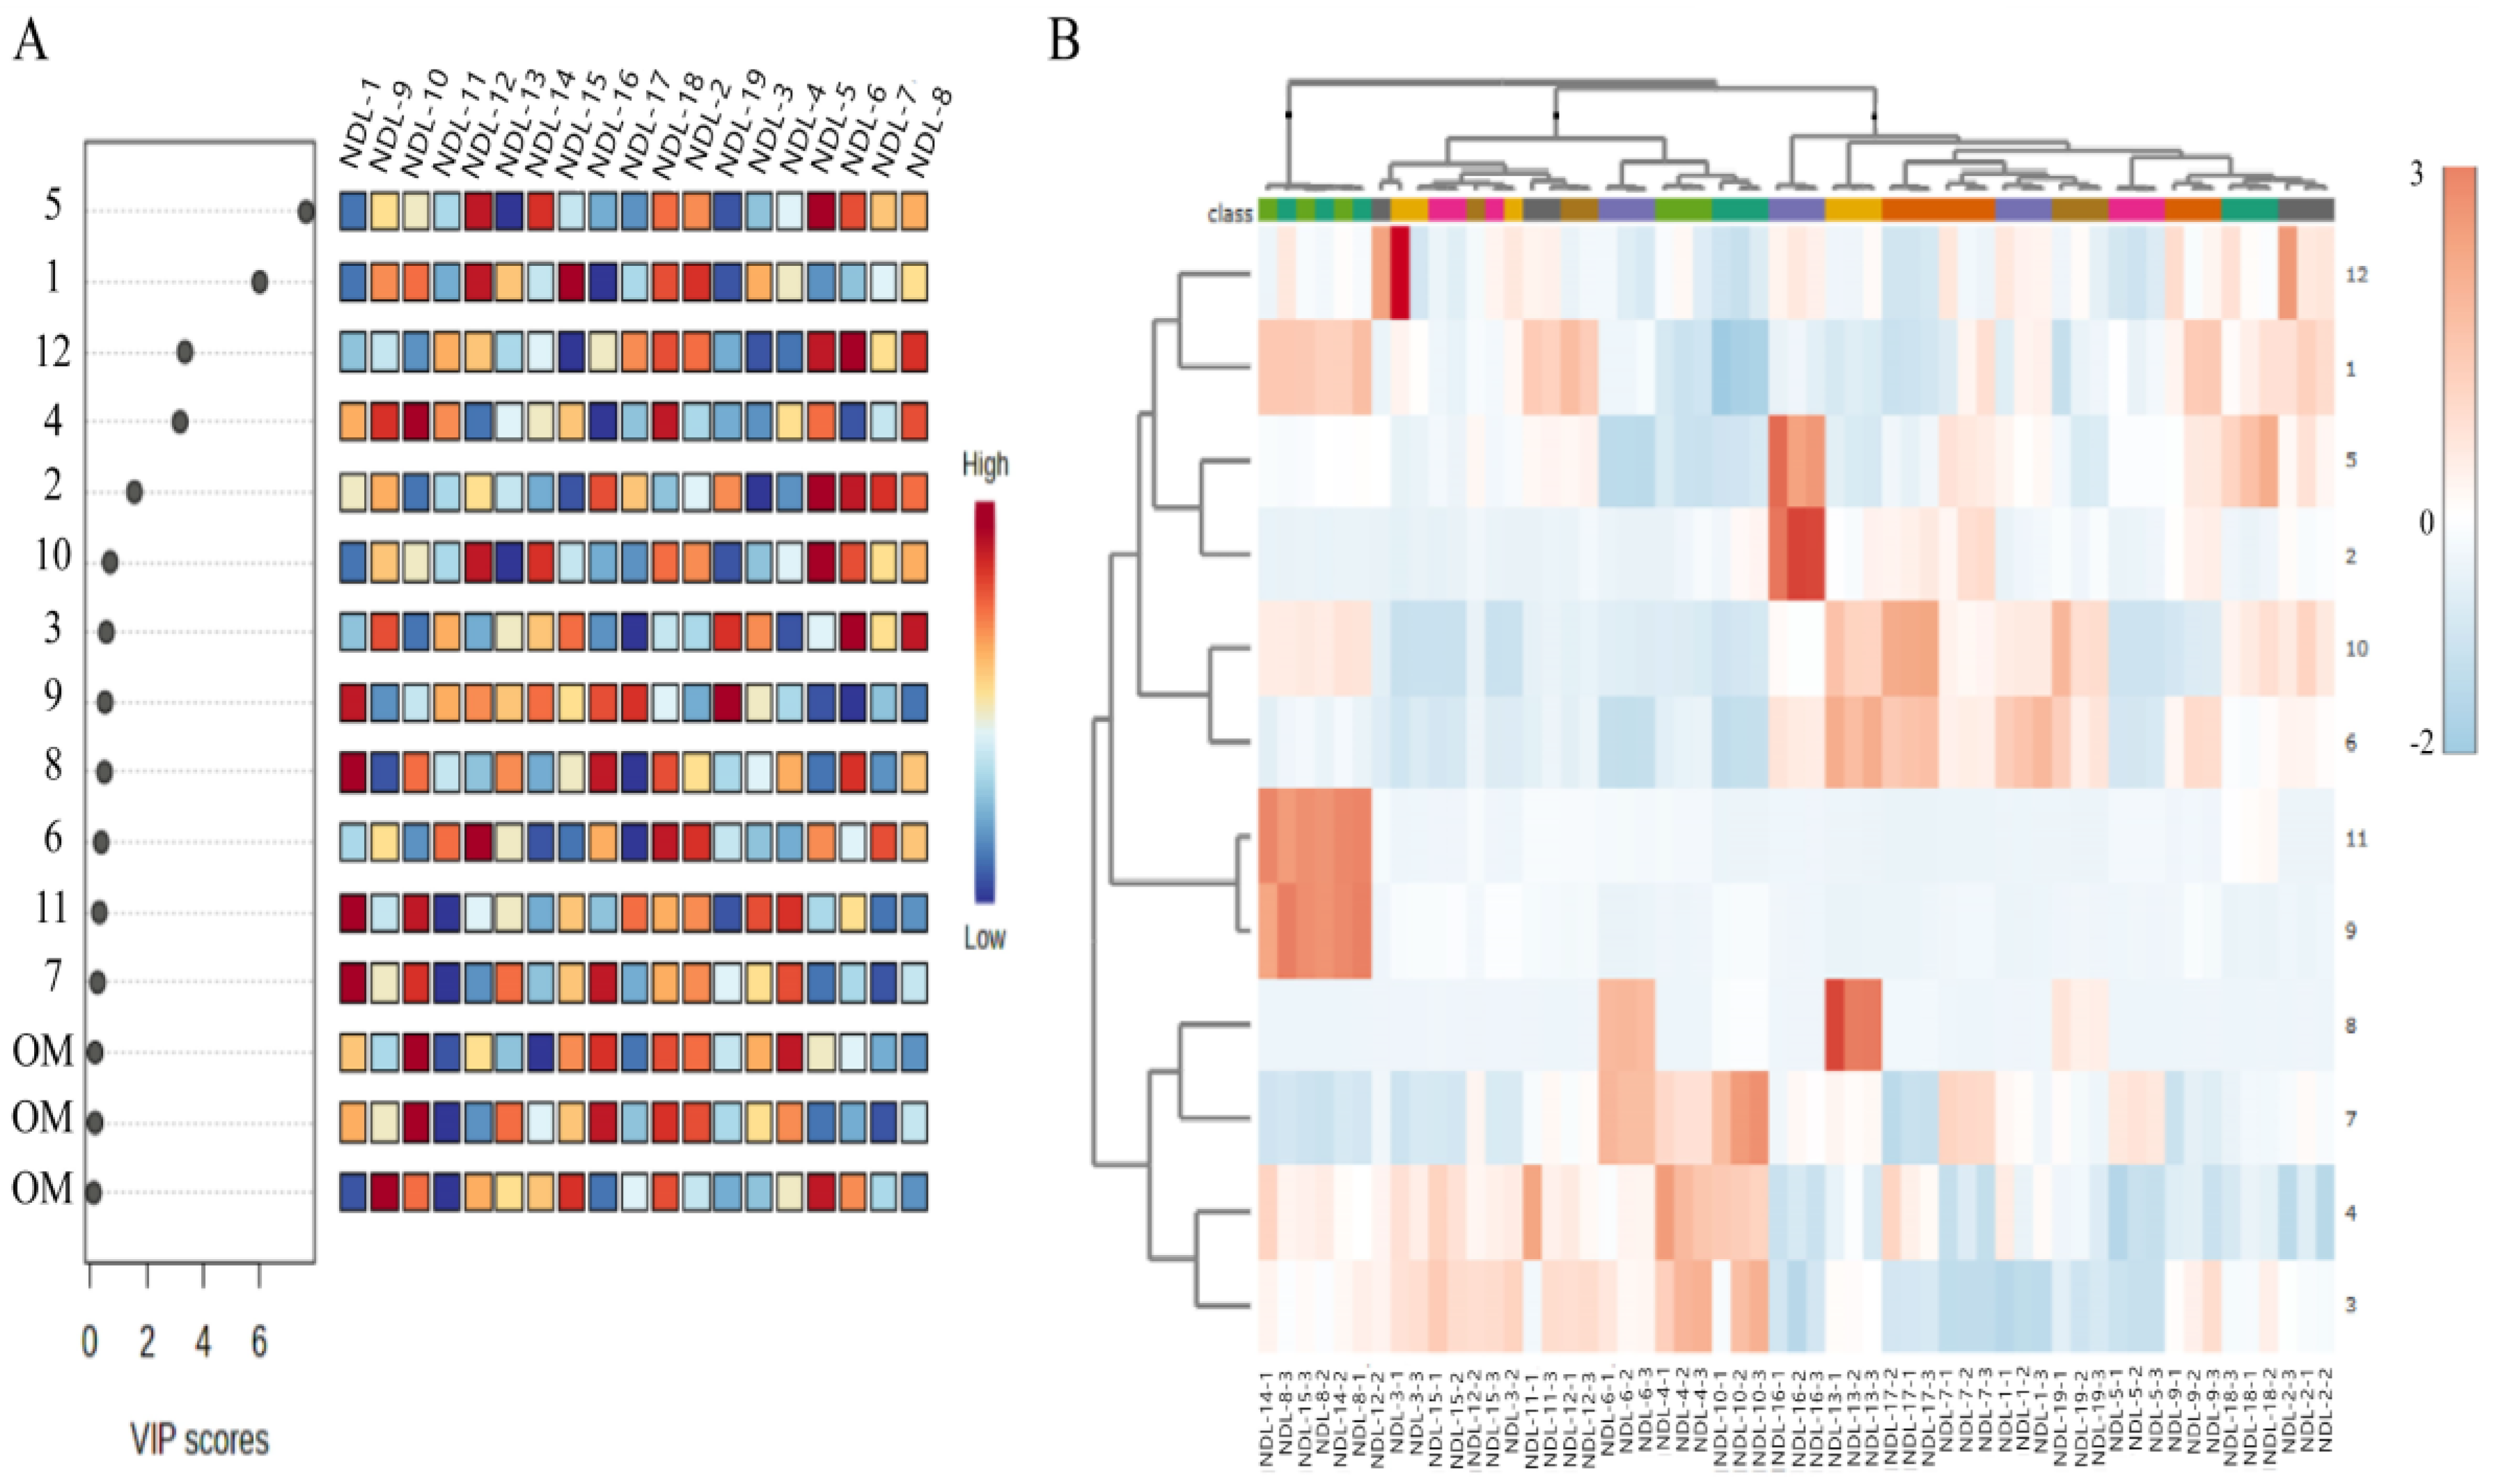
3.7.3. Determination of Key Metabolites and Assessment of Their Differential Abundance Through Heat Map Analysis in Professional Plant Metabolomics

Through comprehensive analysis of PLS-DA VIP scores and positive ion chromatograms, we identified 12 key metabolites that significantly contribute to the metabolic differentiation among 19 N. speciosa germplasms (Table 12, Figure 6). To elucidate the metabolic variation patterns, we performed hierarchical clustering analysis and visualized the results through heat map construction (Figure 9B). This heat map analysis revealed distinct clustering patterns among the 19 N. speciosa germplasms based on their metabolic profiles. Three major clusters were identified: Cluster I comprised NDL-15 and NDL-8, which exhibited remarkably similar metabolite profiles, suggesting a close genetic relationship; Cluster II included NDL-3, NDL-4, NDL-6, NDL-11, NDL-12, NDL-13, and NDL-16; while Cluster III contained the remaining germplasms.
Notably, we observed significant variations in metabolite abundance across different germplasms. Metabolites 9 (6-Methoxyflavanone) and 11 (−)-Maackiain) demonstrated the highest relative abundance in NDL-15 and NDL-8. In contrast, metabolites 2 (Citric acid) and 5 (Hypaphorine) showed significantly elevated levels in NDL-17 compared to other germplasms. Conversely, NDL-4 and NDL-11 exhibited a notably lower relative abundance of metabolites 1 (α,α-Trehalose) and 5 (Hypaphorine). These findings provide substantial evidence for the metabolic diversity among N. speciosa germplasms, offering valuable insights into their genetic relationships and biochemical variations. The differential abundance patterns of key metabolites may serve as potential biomarkers for germplasm characterization and selection in breeding programs.

3.8. Comprehensive Performance Evaluation and Analysis of Different Germplasms of N. speciosa

The evaluation of edible quality in N. speciosa germplasms was conducted based on six key indicators: leaf length, leaf width, root diameter, vitamin B3, protein, and total sugars (Table 13). The mean values (X) and standard deviations (σ) for these indicators were as follows: leaf length (6.25 ± 1.92 cm), leaf width (2.91 ± 1.35 cm), root diameter (1.04 ± 0.23 cm), vitamin B3 content (38.67 ± 11.09 mg/100 g), protein content (0.56 ± 0.26 g/100 g), and total sugars (108.55 ± 21.75 mg/g). The overall scores for edibility are presented in Table 13, with germplasms NDL-2, NDL-7, NDL-11, and NDL-18 exhibiting good edibility (Total score ≥ 20), and NDL-1, NDL-15, NDL-17, and NDL-19 showing inferior edibility (Total score ≤ 15).
For the evaluation of medicinal quality, the analysis focused on the vitamin B3 content, total sugars, total flavonoids, and the variable importance in projection (VIP) values of the selected metabolites (VIP > 5, totaling 2 metabolites) (Table 14). The mean values and standard deviations for these indicators were as follows: vitamin B3 content (38.67 ± 11.09 mg/100 g), total sugars (108.55 ± 21.75 mg/g), total flavonoids (0.91 ± 0.13 mg/g), VIP values (6.55 ± 0.83), and selected metabolites (total VIP score: 7.63 ± 0.77). The overall scores for medicinal properties are provided in Table 14, with germplasms NDL-2, NDL-12, and NDL-18 exhibiting excellent medicinal properties (Total score > 20), and NDL-1, NDL-13, and NDL-19 showing poor medicinal properties (Total score < 15).
The comprehensive evaluation revealed that germplasms NDL-2 and NDL-18 exhibited the highest overall performance in both edibility and medicinal properties. These germplasms were characterized by longer and wider leaves, larger root diameters, a higher vitamin B3 and protein content, elevated levels of total sugars and flavonoids, and significant VIP values for metabolites with medicinal potential. In contrast, germplasms NDL-1 and NDL-19 demonstrated inferior performance in both edibility and medicinal quality, as evidenced by shorter and narrower leaves, smaller root diameters, and lower levels of vitamin B3, protein, total sugars, total flavonoids, and VIP values.
This comprehensive evaluation provides critical insights for the selection of N. speciosa germplasms with optimal characteristics for both edibility and medicinal applications. The findings underscore the importance of integrating multiple quality indicators in the assessment of germplasm performance, thereby facilitating the identification of superior genotypes for targeted breeding programs and commercial utilization.

4. Discussion

The integration of multi-omics technologies has emerged as a transformative approach for enhancing the precision of plant germplasm identification and utilization. This study combines DNA barcoding, agronomic phenotyping, and untargeted metabolomics to systematically evaluate the intraspecific diversity in N. speciosa germplasms, addressing both the strengths and limitations of single-method approaches.

4.1. DNA Barcoding: Potential and Limitations

DNA barcoding is widely advocated as a tool for resolving taxonomic ambiguities in plant breeding, particularly in biodiversity-rich regions with limited taxonomic expertise [35,36]. It enables rapid species identification by targeting standardized gene regions, and it can also be utilized for intraspecific delineation. Sucher N.J., et al.’s identification of medicinal plants using DNA barcoding technology revealed intraspecific genetic differences to ensure the authenticity and quality control of medicinal materials [37]. Challenges arise from the inconsistent evolutionary rates between organellar and nuclear genomes, potential horizontal gene transfer, and insufficient data on the intraspecific sequence variation [38,39,40]. Critics argue that single-gene phylogenies may fail to reflect true evolutionary histories, necessitating complementary approaches for robust taxonomic revision [41,42].
In this study, atpF-atpH outperformed psbk-psbl in differentiating N. speciosa germplasms, with distinct genetic distances observed among germplasms (e.g., NDL-8 showed the highest variability). However, these findings align with concerns about relying solely on plastid markers, as nuclear–cytoplasmic discordance can obscure true genetic relationships [43]. For instance, nuclear loci such as ITS or low-copy nuclear genes often resolve discrepancies caused by incomplete lineage sorting in plastid barcodes [44], highlighting the need for multilocus analyses.

4.2. Multi-Omics Integration Enhances Germplasm Evaluation

To mitigate the limitations of DNA barcoding, we integrated agronomic phenotyping and metabolomics—a strategy supported by recent advances in multi-omics resource characterization [45]. Agronomic trait assessments play a vital role in cultivar identification and the evaluation of genetic resources [46,47]. In our study, agronomic traits, including leaf morphology and hypaphorine content, effectively distinguished germplasms such as NDL-2 and NDL-12, corroborating studies where the phenotypic diversity exceeded the molecular variation in crops like radish and soybean [48,49]. These traits reflect adaptive evolution under selection pressures, which may not always correlate with neutral genetic markers [50].
Untargeted metabolomics further resolved classification ambiguities. While DNA barcoding grouped NDL-8 and NDL-14 as genetically distant, metabolomic clustering placed them in the same subgroup, implying shared biochemical pathways despite genetic divergence. Such discrepancies may arise from the convergent evolution of metabolic traits under environmental stress or post-transcriptional regulation [51]. For example, the flavonoid biosynthesis in Dalbergia odorifera and terpenoid variation in Artemisia argyi were driven by ecological adaptation rather than phylogenetic relatedness [52,53]. In our study, the metabolite profiles of NDL-3, NDL-4, and NDL-11 clustered together, suggesting environmental or epigenetic influences on secondary metabolism that override sequence-based relationships.

4.3. Reconciling Molecular and Metabolic Classification Differences

From the phenotypic and biochemical clusters, the samples were divided into two clusters, in which the sample NDL-8 was in cluster I., and NDL-14 was in cluster II, and there was a significant difference between NDL-8 and other samples in cluster I, which was consistent with the phylogenetic tree where the sample NDL-8 formed cluster VI. The discordance between the DNA barcoding and metabolomic results underscores the complex interplay between genetic divergence and phenotypic plasticity. Three factors may explain this: (1) Evolutionary Rate Disparity: Plastid genes (e.g., atpF-atpH) evolve more slowly than metabolic pathways, leading to conserved sequences but divergent metabolomes under selection [54]; (2) Horizontal Gene Transfer (HGT): Microbial or endophytic gene transfer can introduce metabolic capabilities without altering host genomes, as observed in stress-adapted plants [55]; and (3) Epigenetic Regulation: DNA methylation and miRNA-mediated silencing can decouple metabolite production from genetic relatedness, as reported in medicinal plants with environment-dependent alkaloid synthesis [56].
These mechanisms highlight the necessity of multi-omics frameworks for a comprehensive germplasm characterization. For instance, integrating transcriptomics could bridge the DNA barcode data with metabolic phenotypes by identifying regulatory genes influencing both traits [57].

4.4. Implications for Breeding and Conservation

Our multi-omics approach identified NDL-2 and NDL-18 as superior germplasms for edible and medicinal use, whereas NDL-1 and NDL-19 exhibited undesirable traits for edible and medicinal use. This aligns with the growing emphasis on “phytochemical barcoding”, where metabolite profiles complement DNA data to predict bioactivity and adaptability [58]. Future studies should incorporate genomic selection models to prioritize germplasms with synergistic genetic and metabolic advantages [59]. By integrating DNA barcoding, phenotyping, and metabolomics, this study advances the systematic evaluation of N. speciosa germplasms. While atpF-atpH serves as a reliable molecular marker, metabolomics captures the functional diversity driven by ecological and epigenetic factors. The combined approach not only resolves taxonomic uncertainties but also provides actionable insights for breeding programs. To our knowledge, this is the first multi-omics investigation of N. speciosa, establishing a model for studying the genetic–chemical diversity in underutilized species.

5. Conclusions

By integrating DNA barcoding, phenotyping, and metabolomics, this study advances the systematic evaluation of N. speciosa germplasms, addressing both the potential and limitations of single-method approaches in plant resource characterization. atpF-atpH serves as a reliable molecular marker in resolving intraspecific genetic relationships among the 19 germplasms. Untargeted metabolomics based on UPLC-Q-Orbitrap/MS allows for the differentiation of germplasms using key metabolites. Clustering analysis, supported by metabolic data, successfully distinguishes N. speciosa germplasms, assisting in the assessment of quality. Our integrated analysis also showed that NDL-2 and NDL-18 are priority candidates (among these 19 N. speciosa germplasms) for breeding programs due to their edibility and medicinal properties, whereas NDL-1 and NDL-19 exhibited undesirable traits for edible and medicinal use.
This study contributes valuable insights into the genetic and chemical diversity of N. speciosa, and provides actionable insights for breeding programs. To our knowledge, this is the first multi-omics investigation of N. speciosa, establishing a model for studying the genetic–chemical diversity in underutilized species.

Supplementary Materials

The following supporting information can be downloaded at: https://www.mdpi.com/article/10.3390/agronomy15030508/s1, Figure S1: The physical image of Nanhaia speciosa. Table S1: Sequence information of Nanhaia speciosa related species. Table S2: Compounds identified in the methanol extract of N. speciosa by UPLC-Q-Orbitrap/MS.

Author Contributions

Conceptualization, J.Y. and W.D.; methodology, J.Y.; software, Y.Z., P.W. and G.C.; validation, N.L., R.J. and P.W.; formal analysis, N.L., Y.Z. and P.W.; investigation, N.L., R.J. and G.C.; resources, G.C.; data curation, N.L. and R.J.; writing—original draft preparation, J.Y. and N.L.; writing—review and editing, X.H. and W.D.; visualization, Y.Z.; supervision, X.H.; project administration, W.D.; funding acquisition, X.H. All authors have read and agreed to the published version of the manuscript.

Funding

This research was supported by the Project of the Traditional Chinese Medicine (southern medicinal herbs) Industry Innovation Team in Yunfu City in 2022 (YKSTB Letter [2022] No); and the Project of Universities (College) and Enterprise joint funding project of Guangzhou, China (SL2024A03J01134).

Data Availability Statement

The data are contained within the article.

Conflicts of Interest

Author Gantao Cheng was employed by the company Guangdong Xiaoyang Ecological Agriculture Co., Ltd. The remaining authors declare that the research was conducted in the absence of any commercial or financial relationships that could be construed as a potential conflict of interest.

Abbreviations

The following abbreviations are used in this manuscript:
N. speciosaNanhaia speciosa

References

  1. Su, Y.X.; He, C.M.; Wang, C. Research progress on cultivation and application of Nanhaia speciosa. Trop. For. 2019, 47, 26–29. (In Chinese) [Google Scholar]
  2. Wan, X.; Zhang, L. Global new species of vascular plants published in 2020. Biodivers. Sci. 2021, 29, 1003. [Google Scholar] [CrossRef]
  3. Mo, Y.; Zheng, H.; Huang, Y.; Li, P.; Cai, G.; Zeng, Q. Herbal Textual Research and Character Identification of Southern Medicine Nanhaia speciosa. Lishizhen Med. Mater. Med. Res. 2018, 29, 1361–1362. (In Chinese) [Google Scholar]
  4. Zu, B.; Jiang, J.; Long, L.; Liang, Y.; Tan, Z.; Lai, K. Research Overview of Edible Nanhaia speciosa Root Soup Products. Chin. Seas. 2020, 45, 133–136. (In Chinese) [Google Scholar]
  5. Niu, P.; Meng, Q.; He, X.; Wang, S.; Yi, Y.J.; Zhang, Y.J. Study on ultrasonic-assisted extraction process and antioxidant activity of total alkaloids from Millettia speciosa Champ. Food Sci. Technol. 2023, 48, 216–222. [Google Scholar]
  6. Wu, Y.R.; Peng, L.S.; Xiao, J. Research progress on main chemical constituents and pharmacological effects of Millettia speciosa Champ. J. Hunan Univ. Chin. Med. 2020, 40, 503–506. [Google Scholar]
  7. Zhang, C.; Mo, Y.Y.; Feng, S.S.; Meng, M.W.; Chen, S.Y.; Huang, H.M.; Ling, X.; Song, H.; Liang, Y.H.; Ou, S.F.; et al. Urinary metabonomics study of anti-depressive mechanisms of Millettia speciosa Champ on rats with chronic unpredictable mild stress-induced depression. J. Pharm. Biomed. Anal. 2021, 205, 114338. [Google Scholar] [CrossRef] [PubMed]
  8. Zhang, J.; Wang, J.; Wang, Y.; Chen, M.; Shi, X.; Zhou, X.; Zhang, Z. Phytochemistry and antioxidant activities of the rhizome and radix of Millettia speciosa based on UHPLC-Q-Exactive Orbitrap-MS. Molecules 2022, 27, 7398. [Google Scholar] [CrossRef]
  9. Chen, X.; Sun, W.; Xu, B.; Wu, E.; Cui, Y.; Hao, K.; Zhang, G.; Zhou, C.; Xu, Y.; Li, J.; et al. Polysaccharides from the roots of millettia speciosa champ modulate gut health and ameliorate cyclophosphamide-induced intestinal injury and immunosuppression. Front. Immunol. 2021, 12, 766296. [Google Scholar] [CrossRef] [PubMed]
  10. Wang, M.; Zhang, M.; Yang, Q.; Wang, Q.; Ma, B.; Li, Z.; Cheng, W.; Tang, H.; Feng, S.; Wang, Z. Metabolomic profiling of M. speciosa champ at different growth stages. Food Chem. 2022, 376, 131941. [Google Scholar] [CrossRef]
  11. Wang, M.Y.; Ma, W.Y.; Wang, Q.L.; Yang, Q.; Yan, X.X.; Tang, H.; Li, Z.Y.; Li, Y.Y.; Feng, S.X.; Wang, Z.N. Flavonoid-enriched extract from Millettia speciosa Champ prevents obesity by regulating thermogenesis and lipid metabolism in high-fat diet–induced obese C57BL/6 mice. Food Sci. Nutr. 2022, 10, 445–459. [Google Scholar] [CrossRef]
  12. Chen, C.; Liu, P.; Lou, N.; He, Y.; Zhang, Y.; Li, A. Overview of research on the consumption of Nanhaia speciosa. Food Res. Dev. 2016, 47, 168–172. (In Chinese) [Google Scholar]
  13. Yang, D.; Liu, X.; Fan, P.; Wu, Y. Traditional usage of wild edible plants reflecting the dietary habits and the awareness of health care of LI minority in Baoting and Lingshui, Hainan Island, China: An ethnobotanical approach. Bangladesh J. Bot. 2019, 48, 279–287. [Google Scholar] [CrossRef]
  14. Hang, Y.; Gong, L.; Dong, X.; Xue, D. Research Progress on Development and Utilization of Nanyao Nanhaia speciosa. Spec. Wild Econ. Anim. Plant Res. 2023, 1, 1–13. (In Chinese) [Google Scholar]
  15. Feng, Y.M.; Huang, C.Y.; Lin, Z.; Li, J.; Zhao, B. Research progress on cultivation of Millettia speciosa in Lingnan area. For. Sci. Technol. 2022, 6, 51–54. [Google Scholar]
  16. Gao, W.; Jiang, Z.T.; Mo, Y.L.; Jiang, X.J.; Wei, X.; Shi, Y.C. Effects of different cultivation measures on yield of Nanhaia speciosa. J. Guangxi Acad. Sci. 2023, 39, 71–77. (In Chinese) [Google Scholar]
  17. Boczkowska, M.; Łapiński, B.; Kordulasińska, I.; Dostatny, D.F.; Czembor, J.H. Promoting the use of common oat genetic resources through diversity analysis and core collection construction. PLoS ONE 2016, 11, 0167855. [Google Scholar] [CrossRef] [PubMed]
  18. Fallahi, F.; Abdossi, V.; Bagheri, M.; Ghanbari Jahromi, M.; Mozafari, H. Genetic diversity analysis of Eggplant Germplasm from Iran: Assessments by morphological and SSR markers. Mol. Biol. Rep. 2022, 49, 11705–11714. [Google Scholar] [CrossRef] [PubMed]
  19. Wu, W.; Lu, M.; Peng, J.; Lv, H.; Shi, J.; Zhang, S.; Liu, Z.; Duan, J.; Chen, D.; Dai, W.; et al. Nontargeted and targeted metabolomics analysis provides novel insight into nonvolatile metabolites in Jianghua Kucha tea germplasm (Camellia sinensis var. assamica cv. Jianghua). Food Chem. X 2022, 13, 100270. [Google Scholar] [CrossRef] [PubMed]
  20. Chapepa, B.; Mapuranga, R.; Manjeru, P. Characterisation of upland cotton grown in Zimbabwe using agronomical and morphological markers for Verticillium wilt tolerance. Cogent. Food Agric. 2020, 6, 1766734. [Google Scholar] [CrossRef]
  21. Hebert, P.D.; Cywinska, A.; Ball, S.L.; DeWaard, J.R. Biological identifications through DNA barcodes. Proc. R. Soc. Lond. B Biol. Sci. 2003, 270, 313–321. [Google Scholar] [CrossRef] [PubMed]
  22. Hajibabaei, M.; Singer, G.A.; Hebert, P.D.; Hickey, D.A. DNA barcoding: How it complements taxonomy, molecular phylogenetics and population genetics. Trends Genet. 2007, 23, 167–172. [Google Scholar] [CrossRef]
  23. Liang, L.; Li, Y.; Mao, X.; Wang, Y. Metabolomics applications for plant-based foods origin tracing, cultivars identification and processing: Feasibility and future aspects. Food Chem. 2024, 449, 139227. [Google Scholar] [CrossRef] [PubMed]
  24. Nkhoma, N.; Shimelis, H.; Laing, M.D.; Shayanowako, A.; Mathew, I. Assessing the genetic diversity of cowpea [Vigna unguiculata (L.) Walp.] germplasm collections using phenotypic traits and SNP markers. BMC Genet. 2020, 21, 110. [Google Scholar] [CrossRef]
  25. Kress, W.J.; Erickson, D.L.; Swenson, N.G.; Thompson, J.; Uriarte, M.; Zimmerman, J.K. DNA barcoding of invasive species in the flora of Ontario, Canada. Mol. Ecol. Resour. 2011, 11, 1012–1021. [Google Scholar]
  26. Arus, P.; Ortan, T.J. Inheritance patterns and linkage relationships of eight genes of celery. J. Hered. 1984, 75, 11–14. [Google Scholar] [CrossRef]
  27. Li, P.; Zhao, Z.; Li, Z.; Zeng, R.; Li, W. Distinguishing features of Prunus humilis, P. japonica, P. pedunculata seeds and their adulterant based on DNA barcoding, morphological characterization, and chemical profiles. Fitoterapia 2024, 175, 105942. [Google Scholar] [CrossRef] [PubMed]
  28. Oliveira, M.M.; Cruz-Tirado, J.P.; Barbin, D.F. Nontargeted analytical methods as a powerful tool for the authentication of spices and herbs: A review. Compr. Rev. Food Sci. Food Saf. 2019, 18, 670–689. [Google Scholar] [CrossRef]
  29. Shen, S.; Yang, Y.; Wang, J.; Chen, X.; Liu, T.; Zhuo, Q. Analysis of differences between unifloral honeys from different botanical origins based on non-targeted metabolomics by ultra-high performance liquid chromatography-quadrupole time-of-flight mass spectrometry. J. Chromatogr. 2021, 39, 291–300. [Google Scholar] [CrossRef] [PubMed]
  30. Esteki, M.; Shahsavari, Z.; Simal-Gandara, J. Gas chromatographic fingerprinting coupled to chemometrics for food authentication. Food Rev. Int. 2020, 36, 384–427. [Google Scholar] [CrossRef]
  31. Zhang, C.Y.; Zhou, Q.; Yang, J.; Hong, D.Y.; Zhang, D.Q. DNA barcoding of Paeonia (Paeoniaceae) using psbk-psbl and atpF-atpH spacer regions. PLoS ONE. 2012, 7, e41870. [Google Scholar]
  32. Guo, P. Research on Quality Standards of Nanhaia speciosa Medicinal Material. Master’s Thesis, Guangzhou University of Chinese Medicine, Guangzhou, China, 2019. (In Chinese). [Google Scholar]
  33. Kumar, S.; Sharma, V.; Chaudhary, S.; Tyagi, A.; Mishra, P.; Priyadarshini, A.; Singh, G.P. Evaluation of phenotypic and metabolic diversity in wheat genotypes under drought stress. Front. Plant Sci. 2020, 11, 553. [Google Scholar]
  34. Kim, M.J.; Moon, Y.; Tou, J.C.; Mou, B.; Waterland, N.L. Nutritional and phytochemical variability in lettuce cultivars: Implications for breeding and consumer health. Food Chem. 2016, 205, 375–383. [Google Scholar]
  35. Yu, J.; Wu, X.I.; Liu, C.; Newmaster, S.; Ragupathy, S.; Kress, W.J. Progress in the use of DNA barcodes in the identification and classification of medicinal plants. Ecotoxicol. Environ. Saf. 2021, 208, 111691. [Google Scholar] [CrossRef]
  36. Blaxter, M.L. The promise of a DNA taxonomy. Philos. Trans. R. Soc. Lond. B. Biol. Sci. 2004, 359, 669–679. [Google Scholar] [CrossRef]
  37. Sucher, N.J.; Carles, M.C. DNA barcoding of medicinal plant species for authentication and quality control. Planta Med. 2014, 80, 288–294. [Google Scholar]
  38. Little, D.P.; Stevenson, D.W. A comparison of algorithms for the identification of specimens using DNA barcodes: Examples from gymnosperms. Cladistics 2007, 23, 1–21. [Google Scholar] [CrossRef] [PubMed]
  39. Meier, R.; Shiyang, K.; Vaidya, G.; Ng, P.K. DNA barcoding and taxonomy in Diptera: A tale of high intraspecific variability and low identification success. Syst. Biol. 2006, 55, 715–728. [Google Scholar] [CrossRef] [PubMed]
  40. Moritz, C.; Cicero, C. DNA barcoding: Promise and pitfalls. PLoS Biol. 2004, 2, 354. [Google Scholar] [CrossRef]
  41. Will, K.W.; Rubinoff, D. Myth of the molecule: DNA barcodes for species cannot replace morphology for identification and classification. Cladistics 2004, 20, 47–55. [Google Scholar] [CrossRef] [PubMed]
  42. Will, K.W.; Mishler, B.D.; Wheeler, Q.D. The perils of DNA barcoding and the need for integrative taxonomy. Syst. Biol. 2005, 54, 844–851. [Google Scholar] [CrossRef] [PubMed]
  43. Rose, J.P.; Toledo, C.A.; Lemmon, E.M.; Lemmon, A.R.; Sytsma, K.J. Out of sight, out of mind: Widespread nuclear and plastid-nuclear discordance in the flowering plant genus Polemonium (Polemoniaceae) suggests widespread historical gene flow despite limited nuclear signal. Syst. Biol. 2021, 70, 162–180. [Google Scholar] [CrossRef]
  44. Hollingsworth, P.M.; Forrest, L.L.; Spouge, J.L.; Hajibabaei, M.; Ratnasingham, S.; van der Bank, M.; Chase, M.W.; Cowan, R.S.; Erickson, D.L.; Fazekas, A.J. Selecting barcoding loci for plants: Evaluation of seven candidate loci with species-level sampling in three divergent groups of land plants. Mol. Ecol. Resour. 2009, 9, 439–457. [Google Scholar] [CrossRef] [PubMed]
  45. Chen, W.; Gao, Y.; Xie, W.; Gong, L.; Lu, K.; Wang, W.; Li, Y.; Liu, X.; Zhang, H.; Dong, H. Multi-omics revolution in crop improvement: From data integration to predictive breeding. Trends Plant Sci. 2022, 27, 844–856. [Google Scholar]
  46. Hörandl, E.; Emadzade, K. Evolutionary classification: A case study on the diverse plant genus Ranunculus L.(Ranunculaceae). Perspect. Plant Ecol. Evol. Syst. 2012, 14, 310–324. [Google Scholar] [CrossRef]
  47. Drisya Ravi, R.S.; Nair, B.R.; Siril, E.A. Morphological diversity, phenotypic and genotypic variance and heritability estimates in Moringa oleifera Lam: A less used vegetable with substantial nutritional value. Genet. Resour. Crop Evol. 2021, 68, 3241–3256. [Google Scholar] [CrossRef]
  48. Huang, T.; Lu, J.; Zhang, W.; Wang, W.; Wan, Y.; Pei, Y.; Mao, F.; Wang, L.; Li, J. Evaluation of genetic variation of morphological and clubroot-resistance traits of radish and metabonomic analysis of clubroot-resistant cultivar. Sci. Hortic. 2023, 321, 112272. [Google Scholar] [CrossRef]
  49. Yang, C.; Yan, J.; Jiang, S.; Li, X.; Min, H.; Wang, X.; Hao, D. Resequencing 250 soybean accessions: New insights into genes associated with agronomic traits and genetic networks. Geno. Prot. Bioinform. 2022, 20, 29–41. [Google Scholar] [CrossRef]
  50. Lasky, J.R.; Des Marais, D.L.; McKay, J.K.; Richards, J.H.; Juenger, T.E.; Keitt, T.H. Characterizing genomic variation of Arabidopsis thaliana: The roles of geography and climate. Mol. Ecol. 2012, 21, 5512–5529. [Google Scholar] [CrossRef] [PubMed]
  51. Jacob, F.; Vernaldi, S.; Maekawa, T. The evolutionary origin of complex features in metabolites and enzymes. Nat Commun. 2022, 13, 7141. [Google Scholar]
  52. Li, M.; Liu, M.; Wang, B.; Shi, L. Metabolomics analysis of stem extracts from Dalbergia sissoo. Molecules 2022, 27, 1982. [Google Scholar] [CrossRef]
  53. Alami, M.M.; Ouyang, Z.; Zhang, Y.; Shu, S.; Yang, G.; Mei, Z.; Wang, X. The current developments in medicinal plant genomics enabled the diversification of secondary metabolites’ biosynthesis. Int. J. Mol. Sci. 2022, 23, 15932. [Google Scholar] [CrossRef] [PubMed]
  54. Pichersky, E.; Lewinsohn, E. Convergent evolution in plant specialized metabolism. Annu. Rev. Plant Biol. 2011, 62, 549–566. [Google Scholar] [CrossRef] [PubMed]
  55. Hacquard, S.; Spaepen, S.; Garrido-Oter, R.; Schulze-Lefert, P. Interplay between innate immunity and the plant microbiota. Annu. Rev. Phytopathol. 2017, 55, 565–589. [Google Scholar] [CrossRef] [PubMed]
  56. Strauss, J.; Reyes-Dominguez, Y. Regulation of secondary metabolism by chromatin structure and epigenetic codes. Fungal Genet. Biol. 2011, 48, 62–69. [Google Scholar] [CrossRef] [PubMed]
  57. Bose, U.; Juhász, A.; Broadbent, J.A.; Komatsu, S.; Colgrave, M.L. Multi-omics strategies for decoding smoke-assisted germination pathways and seed vigour. Int. J. Mol. Sci. 2020, 21, 7512. [Google Scholar] [CrossRef]
  58. Wolfender, J.L.; Marti, G.; Thomas, A.; Bertrand, S. Plant metabolomics: From holistic data to relevant biomarkers. Curr. Med. Chem. 2019, 26, 1925–1946. [Google Scholar]
  59. Crossa, J.; Pérez-Rodríguez, P.; Cuevas, J.; Montesinos-López, O.; Jarquín, D.; Campos, G.; Burgueño, J.; González-Camacho, J.M.; Pérez-Elizalde, S.; Beyene, Y. Genomic selection in plant breeding: Methods, models, and perspectives. Trends Plant Sci. 2017, 22, 961–975. [Google Scholar] [CrossRef] [PubMed]
Figure 1. (A) Agarose gel electrophoresis of psbk-psbl sequence from samples. (B) Agarose gel electrophoresis of atpF-atpH sequence from samples. 1–19 correspond to NDL-1 to NDL-19.
Agronomy 15 00508 g001
Figure 2. Phylogenetic tree constructed based on the atpF-atpH sequence. In the figure, I–VI represent different clusters.
Agronomy 15 00508 g002
Figure 3. (A) Correlation analysis of agronomic phenotypic traits and biochemical characteristics; and (B) principal component analysis of agronomic phenotypic traits and biochemical characteristics.
Agronomy 15 00508 g003
Figure 4. Euclidean distance clustering figure of agronomic phenotypic traits and biochemical characteristics. The red line in the diagram divides all germplasm into two clusters.
Agronomy 15 00508 g004
Figure 5. Composition chart of metabolite categories. Each color represents a metabolite category (the area of the sector indicates the proportion of that category).
Agronomy 15 00508 g005
Figure 6. Representative base peak ion chromatograms (BPI) in the positive ion mode were obtained for the QA ions. Peaks 1–12 correspond to the 12 key metabolites listed in Table 12.
Agronomy 15 00508 g006
Figure 7. (A) PCA 2D score plot. (B) PCA 3D score plot.
Agronomy 15 00508 g007
Figure 8. (A) PLS-DA 2D score plot. (B) PLS-DA 3D score plot. The red circle represents the clustering of the corresponding metabolites. (C) Cross-validation plot of 100 permutation tests of PLS-DA model. The red arrow indicates the confidence value. (D) Cross-validated variance histogram of 100 permutation tests for PLS-DA model. *, it means that there is a strong significance.
Agronomy 15 00508 g008
Figure 9. (A) Variable importance in projection (VIP) scores from PLS-DA. OM represents other metabolites. (B) Hierarchical clustering heat map of key metabolites. Number 1–12 correspond to the 12 key metabolites listed in Table 12.
Agronomy 15 00508 g009
Table 1. Naming and source of origin of plant materials.
NamingSource (Town, City, Province)GPS Positioning (North Latitude, East Longitude)
NDL-1Fulin, Yunfu, Guangdong22.6830161, 111.9125324
NDL-222.6939529, 111.9153171
NDL-3Xingping, Yangshuo, Guangxi24.9220809, 110.5309201
NDL-424.9396041, 110.5366816
NDL-5Yao Gu, Yunfu, Guangdong22.8870317, 112.2879645
NDL-622.8872130, 112.2874863
NDL-722.8504033, 112.3070249
NDL-822.8504489, 112.3072114
NDL-922.8485882, 112.3068318
NDL-1022.8469868, 112.3067984
NDL-11Gaoliang, Deqing, Guangdong23.1771246, 111.9555338
NDL-1223.2899006, 111.9535036
NDL-1323.2899567, 111.9535581
NDL-14Bolao, Lingshan, Guangxi22.1199661, 109.1271791
NDL-1522.1071753, 109.1192201
NDL-1622.1215900, 109.1172618
NDL-17Heshe, Danzhou, Hainan19.5938770, 109.7374584
NDL-18Heqing, Danzhou, Hainan19.5279646, 109.6673995
NDL-1919.5355961, 109.6783948
Table 2. Information of DNA barcodes and PCR reaction program.
DNA
Barcode
Forward and Reverse PrimersPrimer Sequences (5′–3′)PCR Reaction Program
psbk-psblpsbk-psbl-FTTAGCATTTGTTTGGCAAG95 °C, 3 min; 95 °C, 15 s, 49.6 °C, 15 s, and 72 °C, 90 s, 35×; 72 °C, 5 min
psbk-psbl-RAAAGTTTGAGAGTAAGCTA
atpF-atpHatpF-atpH-FACTCGCACACACTCCCTTTCC95 °C, 3 min; 95 °C, 15 s, 56.1 °C, 15 s, and 72 °C, 90 s, 35×; 72 °C, 5 min
atpF-atpH-RGCTTTTATGGAAGCTTTAACAAT
Table 3. Grading of observed values for agronomic traits.
LevelObserved Value
1X1 ≤ X − 2σ
2X − 2σ < X2 ≤ X − σ
3X − σ < X3 ≤ X
4X < X4 ≤ X + σ
5X + σ < X5 ≤ X + 2σ
6X6 > X + 2σ
Table 4. Scoring table of edible quality indicators.
LevelObserved ValueLeaflet LengthLeaflet WidthRoot
Diameter
Vitamin B3ProteinTotal
Sugars
1X1 ≤ X − 2σ0.50.51.01.01.01.0
2X − 2σ < X2 ≤ X − σ1.01.02.02.02.02.0
3X − σ < X3 ≤ X1.51.53.03.03.03.0
4X < X4 ≤ X + σ2.02.04.04.04.04.0
5X + σ < X5 ≤ X + 2σ2.52.55.05.05.05.0
6X6 > X + 2σ3.03.06.06.06.06.0
Table 5. Scoring table of medicinal quality indicators.
LevelObserved ValueVitamin B3Total SugarsTotal FlavonoidsVIP Score
α,α-
Trehalose
Hypaphorine
1X1 ≤ X − 2σ1.01.01.01.01.0
2X − 2σ < X2 ≤ X − σ2.02.02.02.02.0
3X − σ < X3 ≤ X3.03.03.03.03.0
4X < X4 ≤ X + σ4.04.04.04.04.0
5X + σ < X5 ≤ X + 2σ5.05.05.05.05.0
6X6 > X + 2σ6.06.06.06.06.0
Table 6. DNA barcoding sequence analysis.
SequenceAlignment Length (bp)GC
Content (%)
Conserved SiteConservation Index (%)Variability Index (%)Variable SitesParsimony Informative Sites
psbk-psbl44428.0542695.94.11810
atpF-atpH59925.0454791.38.75233
Table 7. Comparison of intraspecific and interspecific genetic distance differences of two candidate barcodes in N. speciosa.
SequenceIntraspecific Genetic DistanceInterspecific Genetic Distance
MinimumMaximumMeanMinimumMaximumMean
psbk-psbl00.00270.00210.00170.05680.0360
atpF-atpH00.07860.06440.17431.29370.7431
Table 8. Phenotypic trait variance analysis and biochemical characteristic variance analysis for agronomic traits.
SampleLeaf Length (cm)Leaflet Length (cm)Leaflet Width (cm)Root
Diameter (cm)
Vitamin B3 Content (μg/g)Protein
Content (mg/g)
Total
Sugars Content (mg/g)
Total
Flavonoids Content (mg/g)
Hypaphorine Content (mg/g)
NDL-119.7 ± 2.06 A8.97 ± 4.25 AB2.83 ± 1.30 BD0.70 ± 0.15 C29.25 ± 1.01 A0.89 ± 0.11 I43.00 ± 0.330.89 ± 0.071.94 ± 0.18 B
NDL-215.77 ± 1.72 ABC8.56 ± 2.20 ABC4.77 ± 1.45 A1.10 ± 0.36 ABC39.60 ± 0.50 C1.09 ± 0.14 J128.87 ± 0.81 A1.00 ± 0.02 E1.63 ± 0.09 A
NDL-312.26 ± 2.10 CD4.47 ± 0.38 E2.53 ± 0.45 C0.92 ± 0.22 ABC42.69 ± 0.75 D1.06 ± 0.07 J80.96 ± 1.94 D1.00 ± 0.03 F1.62 ± 0.11 A
NDL-47.77 ± 2.55 EF4.93 ± 0.45 DE1.70 ± 0.46 C1.17 ± 0.20 ABC43.51 ± 0.55 D0.36 ± 0.06 BC121.01 ± 0.23 E0.72 ± 0.08 A1.63 ± 0.14 A
NDL-512.70 ± 1.45 CD10.20 ± 1.97 A5.07 ± 1.45 A1.18 ± 0.36 ABC23.01 ± 0.480.62 ± 0.04 EF123.24 ± 0.270.86 ± 0.07 D1.93 ± 0.21 B
NDL-615.23 ± 2.00 BC6.06 ± 1.75 BCDE2.27 ± 0.45 C0.83 ± 0.35 BC36.50 ± 1.00 B0.59 ± 0.08 EF113.21 ± 0.480.80 ± 0.10 BC1.66 ± 0.54
NDL-712.63 ± 1.65 CD4.81 ± 0.48 E4.88 ± 0.16 A1.13 ± 0.24 ABC60.69 ± 0.770.51 ± 0.04 DE109.21 ± 0.190.79 ± 0.08 B1.78 ± 0.38
NDL-89.93 ± 1.08 DE8.93 ± 1.84 ABC1.60 ± 0.20 C1.52 ± 0.11 A11.57 ± 0.530.52 ± 0.03 DE122.58 ± 0.320.85 ± 0.011.91 ± 0.25 B
NDL-915.37 ± 1.35 BC6.08 ± 0.75 E1.81 ± 0.18 C0.73 ± 0.37 C43.83 ± 0.46 D0.84 ± 0.07 HI112.69 ± 0.570.83 ± 0.051.58 ± 0.13
NDL-107.68 ± 2.38 EF4.98 ± 0.58 DE1.75 ± 0.52 C1.21 ± 0.17 ABC45.10 ± 0.64 E0.54 ± 0.03 DE122.21 ± 0.13 E0.73 ± 0.06 A1.53 ± 0.28
NDL-114.83 ± 1.45 FG6.50 ± 2.10 BCDE4.97 ± 1.56 A1.31 ± 0.32 BC51.74 ± 0.620.37 ± 0.02 BC117.26 ± 0.36 B0.92 ± 0.10 E2.07 ± 0.33 C
NDL-129.73 ± 1.27 DE5.37 ± 1.90 CDE2.67 ± 0.65 C0.99 ± 0.31 ABC29.72 ± 0.50 A0.44 ± 0.02 CD109.42 ± 0.24 C1.04 ± 0.10 F1.96 ± 0.16 B
NDL-1312.53 ± 2.09 CD4.37 ± 1.20 DE1.60 ± 0.20 C0.97 ± 0.20 ABC29.92 ± 0.61 A0.67 ± 0.03 FG95.93 ± 0.250.91 ± 0.060.94 ± 0.11
NDL-143.78 ± 0.61 G7.73 ± 1.46 ABCD4.37 ± 1.42 AB1.42 ± 0.21 A47.78 ± 0.720.19 ± 0.05 A116.86 ± 0.66 B1.16 ± 0.09 F2.08 ± 0.34 C
NDL-1512.53 ± 1.70 CD4.20 ± 1.05 E2.53 ± 0.45 C0.91 ± 0.24 ABC28.84 ± 0.65 A0.19 ± 0.06 A81.34 ± 0.23 D0.81 ± 0.06 C1.02 ± 0.23
NDL-1617.07 ± 2.42 AB3.83 ± 0.35 E1.67 ± 0.21 C0.81 ± 0.20 BC49.66 ± 0.610.27 ± 0.03 AB137.76 ± 0.260.92 ± 0.11 E1.61 ± 0.14 A
NDL-175.67 ± 2.50 FG4.30 ± 0.95 DE1.50 ± 0.20 C0.96 ± 0.46 ABC45.00 ± 0.78 E0.29 ± 0.07 AB108.61 ± 0.36 C0.87 ± 0.09 D1.35 ± 0.25
NDL-1815.83 ± 1.67 ABC8.59 ± 2.21 ABC4.81 ± 1.47 A1.12 ± 0.37 ABC38.96 ± 0.77 C0.38 ± 0.05 BC129.42 ± 1.58 A1.23 ± 0.101.71 ± 0.26
NDL-197.77 ± 2.45 EF5.93 ± 0.65 E2.00 ± 0.10 C0.69 ± 0.27 C37.44 ± 0.44 B0.75 ± 0.06 GH88.91 ± 0.260.91 ± 0.07 E1.16 ± 0.13
Note: Values represent mean ± SD (n = 3). Capital letters indicate significant differences (p < 0.05, Tukey’s HSD) within columns.
Table 9. Variation parameters of agronomic and biochemical traits in N. speciosa germplasms.
TraitsMean ± SDRangeCV (%)
Morphological
Leaf length/cm11.51 ± 4.223.78–19.7036.66
Leaflet length/cm6.25 ± 1.873.83–10.2029.92
Leaflet width/cm2.92 ± 1.311.50–5.0744.86
Root diameter/cm1.03 ± 0.220.69–1.5221.36
Biochemical
Vitamin B3 content μg/g38.67 ± 11.0911.57–60.6928.68
Protein content mg/g0.56 ± 0.260.19–1.0948.43
Total sugar content mg/g108.55 ± 1.7543.00–137.7620.04
Total flavonoids content mg/g0.91 ± 0.130.72–1.2314.29
Hypaphorine content mg/g1.64 ± 0.321.02–2.0819.51
Table 10. Genetic diversity index and distribution frequency.
Traits and Biochemical
Characteristics
Distribution FrequencyH′
123456
Leaf length0.0000.2910.3510.3680.3280.0001.338
Leaflet length0.0000.3280.3640.2370.3280.1551.412
Leaflet width0.0000.2910.3540.1550.3640.0001.167
Root diameter0.0000.3280.3640.3640.2370.1551.211
Vitamin B3 content0.1550.1550.3510.3640.2370.1551.417
Protein content0.0000.3280.3680.3280.2910.1551.470
Total sugar content 0.1550.2370.2910.3160.2370.0001.236
Total flavonoids content0.0000.2370.3160.3280.2370.0001.118
Hypaphorine content0.1550.2370.3680.3680.2370.0001.365
Table 11. Principal component analysis of agronomic phenotypic traits and biochemical characteristics.
Traits and Biochemical
Characteristics
PCA
PC1PC2PC3
Vitamin B3 content0.057−0.4830.822
Protein content−0.2660.7120.139
Total sugars content0.532−0.4270.011
Total flavonoids content0.4970.2690.327
Hypaphorine content0.767−0.3100.362
Eigenvalue (λ)2.8622.1511.225
Contribution rate (%)31.80423.89513.614
Cumulative contribution rate (%)31.80455.69969.313
Leaf length−0.3080.7080.226
Leaflet length0.6260.667−0.269
Leaflet width0.7430.2700.406
Root diameter0.794−0.310−0.362
Table 12. Key metabolites of N. speciosa.
NumberKey Metabolite MarkersMolecular
Formula
Molecular WeightRetention Time (min)VIP Score
1α,α-TrehaloseC12H22O11342.11590.8816.5543
2Citric acidC6H8O7192.02691.2042.6019
32-Hydroxycinnamic acidC9H8O3164.04741.2210.7748
4trans-3-Indoleacrylic acidC11H9NO2187.06333.0753.6106
5HypaphorineC14H18N2O2246.13673.4967.6284
64′,6-Dimethoxyisoflavone-7-O-β-D-glucopyranosideC23H24O10460.13735.7660.1194
73-Hydroxybenzoic acidC7H6O3138.03165.7670.1050
81-Octen-3-yl-6-O-[(2R,3R,4R)-3,4-dihydroxy-4-(hydroxymethyl)tetrahydro-2-furanyl]-β-D-glucopyranosideC19H34O10422.21515.820.3250
96-MethoxyflavanoneC16H14O3254.09436.9530.6759
10FormononetinC16H12O4268.07367.4841.7185
11(−)-MaackiainC16H12O5284.06877.8860.1110
121,3:2,4-Bis(3,4-dimethylobenzylideno) sorbitolC24H30O6414.20459.1954.7971
Table 13. Total score table of edible quality indicators.
GermplasmLeaflet LengthLeaflet WidthRoot
Diameter
Vitamin B3ProteinTotal
Sugars
Total Score
NDL-12.51.52.01.05.01.013.0
NDL-22.52.54.04.06.04.023.0
NDL-31.51.53.04.05.02.017.0
NDL-41.51.54.04.03.04.018.0
NDL-52.52.54.02.04.04.019.0
NDL-61.51.53.03.04.04.017.0
NDL-71.52.54.05.03.04.020.0
NDL-82.51.56.01.03.04.018.0
NDL-91.51.52.04.05.04.018.0
NDL-101.51.54.04.03.04.018.0
NDL-112.02.55.05.03.04.021.5
NDL-121.51.53.03.03.04.016.0
NDL-131.51.53.03.04.03.016.0
NDL-142.02.55.04.02.04.019.5
NDL-151.01.53.03.02.02.012.5
NDL-161.01.52.05.02.05.016.5
NDL-171.01.03.04.02.04.015.0
NDL-182.52.54.04.03.04.020.0
NDL-191.51.52.03.04.03.015.0
Table 14. Total score table of medicinal quality indicators.
GermplasmVitamin B3Total
Sugars
Total
Flavonoids
VIP ScoreTotal Score
α,α-
Trehalose
Hypaphorine
NDL-11.01.03.02.04.011.0
NDL-24.04.04.06.03.021.0
NDL-34.02.04.04.03.017.0
NDL-44.04.02.03.03.016.0
NDL-52.04.03.02.04.015.0
NDL-63.04.03.02.04.016.0
NDL-75.04.03.02.04.018.0
NDL-81.04.03.03.04.015.0
NDL-94.04.03.04.03.018.0
NDL-104.04.02.04.03.017.0
NDL-115.04.04.02.05.020.0
NDL-123.04.05.06.05.023.0
NDL-133.03.04.03.01.014.0
NDL-144.04.05.02.05.020.0
NDL-153.02.03.06.02.016.0
NDL-165.05.04.01.03.018.0
NDL-174.04.03.02.03.016.0
NDL-184.04.06.05.05.024.0
NDL-193.03.03.01.02.012.0
Disclaimer/Publisher’s Note: The statements, opinions and data contained in all publications are solely those of the individual author(s) and contributor(s) and not of MDPI and/or the editor(s). MDPI and/or the editor(s) disclaim responsibility for any injury to people or property resulting from any ideas, methods, instructions or products referred to in the content.

