Article

Slope Position Modulates Soil Chemical Properties and Microbial Dynamics in Tea Plantation Ecosystems

1
College of Tea Science, Yunnan Agricultural University, Kunming 650201, China
2
Yunnan Organic Tea Industry Intelligent Engineering Research Center, Yunnan Agricultural University, Kunming 650201, China
3
College of Mechanical and Electrical Engineering, Yunnan Agricultural University, Kunming 650201, China
*
Author to whom correspondence should be addressed.
These authors contributed equally to this work.
Agronomy 2025, 15(3), 538; https://doi.org/10.3390/agronomy15030538
Submission received: 21 January 2025 / Revised: 20 February 2025 / Accepted: 21 February 2025 / Published: 23 February 2025
(This article belongs to the Section Soil and Plant Nutrition)

Abstract

:
As a perennial plant, the nutrient supply for tea bushes is predominantly dependent on the soil. Yunnan tea plantations exhibit significant topographic slope variations, yet the combined impact of slope positions on soil chemistry and microbial communities remains unexplored. This study investigated soil chemical properties and microbial community structures across three distinct slope areas within a single tea plantation. The results showed that the contents of organic matter (OM), total nitrogen (TN), and available nutrients (AN) at the top of the slope (TS) were significantly higher than those at the foot of the slope (FS) (p < 0.001), while the cation exchange capacity (CEC) and total potassium (TK) reached peak levels in the middle of the slope (MS), with FS having the lowest nutrient levels. Redundancy analysis (RDA) indicated that bacterial communities were primarily influenced by TK, magnesium (Mg), CEC, total phosphorus (TP), and pH, whereas fungal communities were mainly regulated by TK, Mg, and CEC, highlighting the role of soil chemical properties in shaping microbial diversity and distribution. Bacterial composition showed no significant slope-related differences, but fungal communities varied notably at the family/genus levels. MS exhibited the highest microbial network complexity, suggesting stronger species interactions. Bacterial metabolic functions and fungal trophic modes were conserved across regions, indicating functional stability independent of structural changes. This study reveals slope-driven soil-microbial dynamics in Yunnan tea plantations, offering insights into microbial assembly and adaptation under topographic gradients. These findings support precision fertilization, ecological conservation, and the sustainable management of slope tea plantations.

1. Introduction

As a globally significant cash crop, tea (Camellia sinensis) not only holds the history of human civilization but also plays a vital role in supporting regional economic development and ecological balance [1,2,3]. These factors are closely connected with the livelihoods of those in tea-producing regions. Yunnan Province, located in southwest China, possesses a unique topography and geomorphology. When combined with its diverse climate, these characteristics have collectively contributed to the development of a varied tea plantation ecosystem, establishing it as a center of tea tree diversity [4,5,6]. Over time, the microenvironments formed by different slopes have interacted with human activities, creating a complex ecological network within tea plantations. Topographic features are crucial in shaping the soil environment of tea plantations, with slope position acting as a visual marker of the topographic gradient that significantly impacts the physicochemical properties and biological activity of the soil by regulating water and heat distribution, nutrient transport, and erosion processes [7,8,9]. Studies have shown that variations in slope position can result in spatial heterogeneity in soil pH, organic matter content, and essential nutrients such as nitrogen, phosphorus, and potassium. This, in turn, influences the composition and functional expression of soil microorganisms [10,11,12]. For example, soils at the top of slopes often have a low organic matter content due to efficient drainage and rapid nutrient loss, while the middle and lower slopes can become nutrient-rich zones through material deposition, creating a more favorable substrate environment for microbial activity [13,14]. Therefore, studying the impact of slope position on soil ecosystems in tea gardens is crucial for optimizing soil management practices, implementing precise fertilizer applications, and enhancing tea quality and sustainability in sloping tea plantations.
As a perennial plant, the nutritional requirements of tea plants are predominantly sustained through soil resources [15]. The edaphic environment serves dual functions: not only does it furnish essential nutrients and moisture for tea plants, but it also modulates nutrient cycling and bioavailability through synergistic interactions between its chemical characteristics (including pH, organic matter composition, and available nutrients) and microbial communities [16,17]. These critical soil parameters fundamentally regulate the plant’s physiological processes, shape the organoleptic properties of tea leaves, and maintain ecosystem stability, collectively determining both yield and product quality [18,19]. Optimal growth occurs in moderately acidic soils (pH 4.0–5.5), which enhance organic matter retention and stimulate microbial dynamics [20,21,22]. Key macronutrients demonstrate distinct physiological roles: nitrogen enhances shoot initiation frequency and bud density; phosphorus strengthens root architecture, reproductive development, and abiotic stress tolerance; and potassium activates pivotal enzymes in photosynthetic and respiratory pathways, facilitating carbohydrate translocation. The synergistic interplay of these elements ensures robust plant development and premium tea production [23,24,25,26]. Furthermore, soil cation exchange capacity (CEC) correlates with organic matter levels, indicating nutrient retention potential. Specific micronutrients also contribute significantly: fluoride elevates chlorophyll content and antioxidant capacity while modulating secondary metabolism; zinc improves nitrogen/phosphorus uptake and enriches polyphenol/amino acid profiles; and magnesium, as the chlorophyll core constituent, participates in theanine biosynthesis and enhances photosynthetic efficiency, ultimately improving tea quality parameters [27,28,29,30].
Microorganisms play a pivotal role in tea garden ecosystems. They actively participate in biogeochemical cycles of nitrogen, phosphorus, and potassium to enhance soil fertility, regulate metabolic pathways in tea plants that influence the synthesis of secondary metabolites like polyphenols and amino acids, and improve plant resilience against biotic and abiotic stresses [31,32,33,34]. The diversity and stability of microbial communities further serve as critical indicators of soil ecosystem health and sustainability [31,35]. Notably, as the “biological engine” of soil ecosystems, microorganisms drive essential processes including organic matter decomposition, nutrient cycling, and pollutant degradation. Their dynamic interactions with soil chemical properties fundamentally determine the physiological metabolism and stress resistance of tea plants, consequently shaping key tea quality attributes such as morphology, flavor, and aroma [36,37].
However, current research lacks systematic analysis of the synergistic response mechanisms between soil chemical properties and microbial dynamics across slope positions, particularly in mountainous tea plantations with complex topography like those in Yunnan. This study investigated soil chemical characteristics and microbial community structures across different slope positions within a single tea plantation, examining their interactions and functional implications. Our findings not only elucidate slope-induced variations in soil chemistry and microbial composition but also provide practical guidance for slope-specific soil management, targeted fertilization, and sustainable cultivation practices in tea plantation ecosystems.

2. Materials and Methods

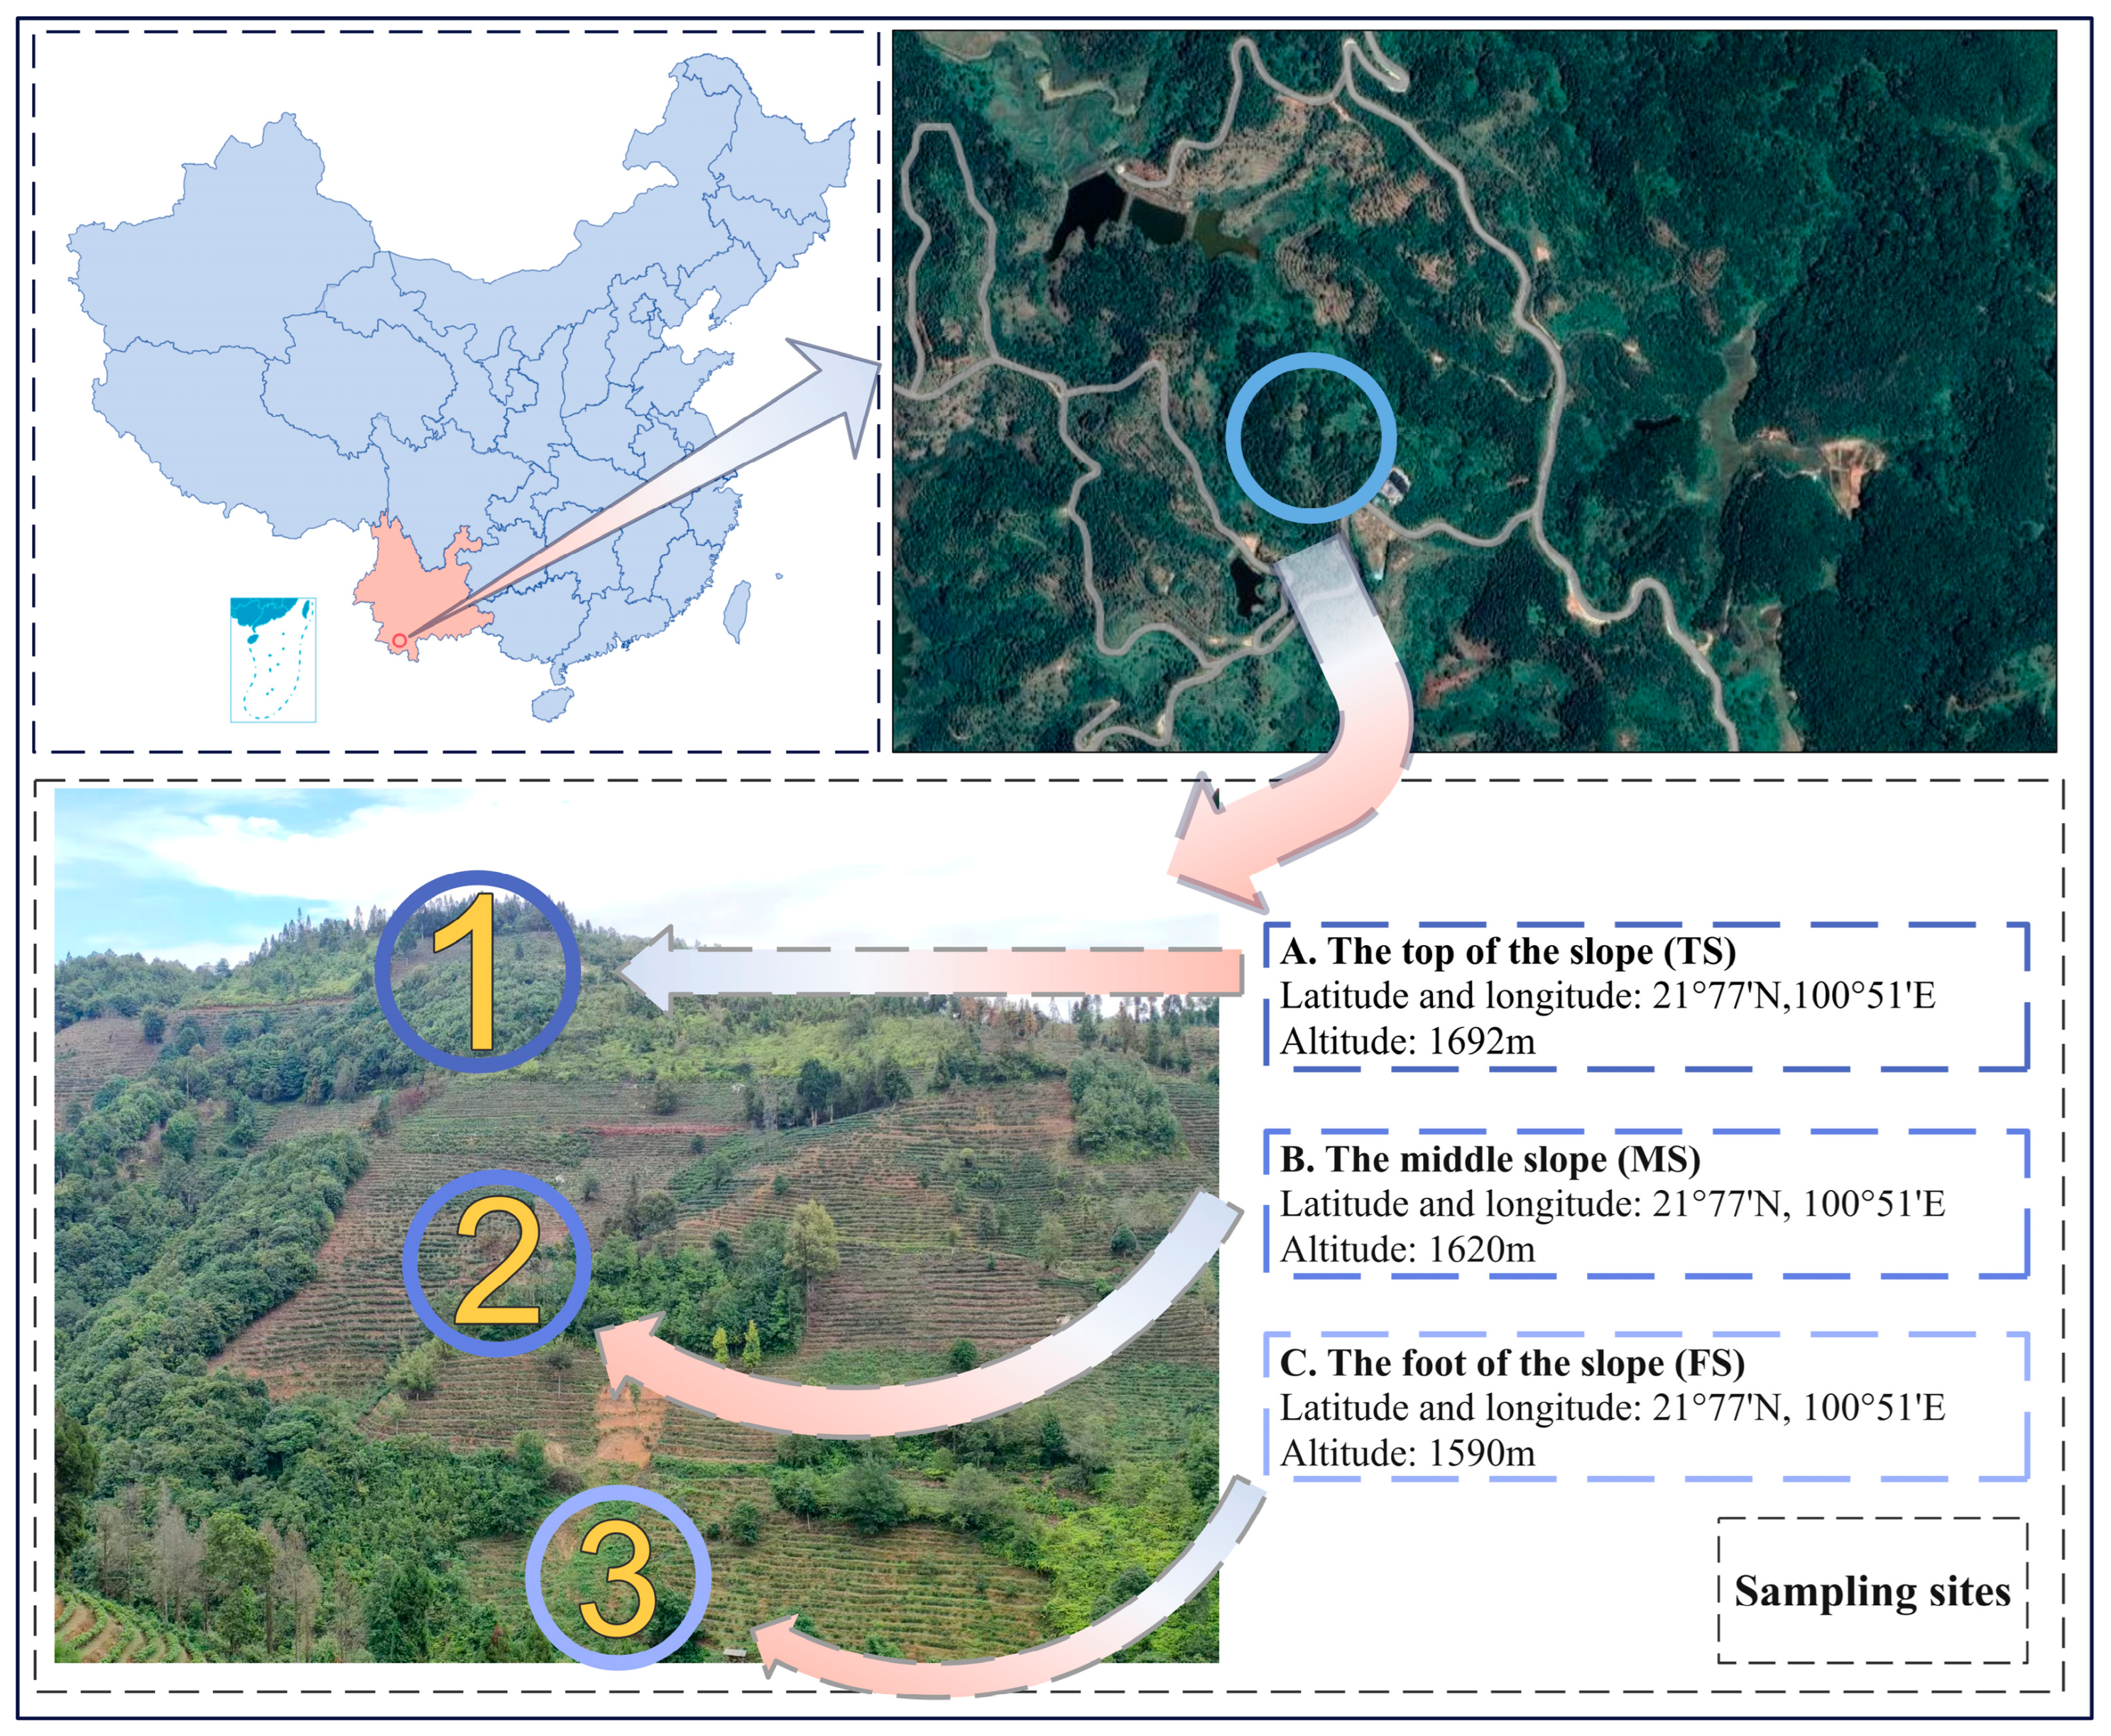
2.1. Overview of the Study Region

In Yunnan Province, tea cultivation is largely carried out south of 25° N latitude, primarily in mountainous and hilly regions at elevations between 1000 and 2000 m. Slopes generally exceed 25° and therefore tend to be sloping tea gardens. The experimental research was conducted in an organically managed tea plantation in Menghai County, Xishuangbanna Prefecture, Yunnan Province, China (100.85° E, 21.77° N). This plantation is representative of typical Camellia sinensis var. assamica cv. Mengku cultivation. Nestled within a ring of mountains, the region benefits from a unique geographical location, resulting in a warm and humid monsoon climate. The average annual temperature reaches 22 °C, and abundant sunshine coupled with frequent cloud cover have shaped the area’s distinctive ecological environment. The fertile soil, rich in various mineral elements, provides ideal nutritional conditions for tea cultivation. The soils of tea plantations in the study area are similar and the management and fertilization practices are consistent.

2.2. Research Methodology

2.2.1. Experimental Materials

Soil samples were collected in April 2021, from six points along a single mountain slope using an S-shaped sampling design. These points represented three distinct elevations: at the top of the slope (TS, 1692 m), in the middle of the slope (MS, 1620 m), and at the foot of the slope (FS, 1590 m). Using a hoe and spade as tools, the five-point sampling method was used to obtain the soil of the cultivated layer at the drip line of the tea tree at a depth of 20 cm, followed by mixing and then using the quadrat method to make the mixed soil samples stored up to about 1 kg. Samples were brought back to the room to remove gravel, roots, and other impurities and then mixed part was stored in the self-sealing bag at room temperature for the determination of soil chemical properties, and the other part was placed in a 50 mL centrifugal tube in the freezer at −80 °C and used for microbiological analysis. The same was repeated three times for each sample [18,38]. Figure 1 illustrates the environment of the sampling site.

2.2.2. Analysis of Soil Chemical Properties

Soil pH was determined as follows: soil and water were mixed in a ratio of 1:5 dry wt./v soil suspension was prepared, and the pH was measured using a pH meter after shaking [39,40]. Organic matter (OM) content was determined using a potassium dichromate–sulfuric acid oxidation method. Excess organic carbon was oxidized in an oil bath, followed by titration with o-phenanthroline [41]. Total nitrogen (TN) was quantified using an automated Kjeldahl method, with back-titration against sulfuric acid after high-temperature digestion [42]. Available nitrogen (AN) was determined by alkaline diffusion [43]. Total phosphorus (TP) and total potassium (TK) were determined by adding 2–3 drops of anhydrous ethanol and 2 g of solid sodium hydroxide to the soil sample. The mixture was then boiled in an oil bath, cooled, and the resulting melt dissolved in water. The solution was rinsed with sulfuric acid solution before TP concentration was measured using a UV–Vis spectrophotometer and TK concentration was measured using a flame photometer [40]. Available phosphorus (AP) was determined using NaHCO3 extraction, followed by molybdenum blue colorimetric analysis [44]. Available potassium (AK) was determined by flame photometry after ammonium acetate extraction [45]. Cation exchange capacity (CEC) was determined using the ammonium acetate exchange method [46]. Fluoride determination was carried out by the Ion Selective Electrode Method [47]. Zinc (Zn) content was determined by flame atomic absorption spectrometry [48]. Magnesium (Mg) content was determined by inductively coupled plasma optical emission spectrometry (ICP-OES) after alkaline fusion, acid digestion, and nebulization [38].

2.2.3. Sequencing of Microbial Amplicons

A total of 250 mg of soil DNA was extracted using the E.Z.N.A.® Soil DNA Kit (OMEGA Bio-Tek, Norcross, GA, USA). The V3-V4 hypervariable region of the 16S rRNA gene was amplified using universal primers 338F (5′-ACTCCTACGGGGAGGCAGCAG-3′) and 806R (5′-GGACTACHVGGGTWTCTAAT-3′) [49,50]. Fungal amplification was performed with ITS primers ITS1F (CTTGGTCATTTAGAGGAAGTAA) and ITS2R (GCTGCGTTCTTCATCGATGC) [51]. Amplicon products were confirmed by 2% agarose gel electrophoresis and quantified using a Quantus™ fluorometer [52]. Sequencing libraries were prepared using the NEXTFLEX Rapid DNA-Seq Kit and sequenced on an Illumina MiSeq platform using PE300 chemistry [53,54]. Raw sequence data underwent quality filtering, denoising, merging, and chimera checking using QIIME2. Operational taxonomic units (OTUs) were clustered, and representative sequences were taxonomically classified against the Greengenes database (version 13_8) for bacteria and the UNITE database (version 8.2) for fungi.

2.3. Statistical Analysis

Data analysis commenced with preliminary exploration using Microsoft Excel. Statistical significance testing (p < 0.05) was then performed using SPSS version 21.0. Percentage stacked bar graphs were generated using the BioScience Cloud Platform (https://www.bioincloud.tech, accessed on 4 January 2025). Beta diversity was investigated using principal coordinate analysis (PCoA) and non-metric multidimensional scaling (NMDS), both based on Bray–Curtis dissimilarity matrices [55]. Alpha diversity was analyzed with GraphPad Prism version 9.5. Principal component analysis (PCA) was conducted using the OmicShare platform (https://www.omicshare.com, accessed on 6 January 2025) [56]. Network analysis and visualization were performed using Gephi (version 0.9.1), characterizing network complexity via parameters including node and edge counts, average degree, proximity centrality, and harmonic centrality [57]. Redundancy analysis (RDA) assessed the correlation between microbial community composition (genus level) and soil chemical properties. Finally, microbial functional analysis was conducted using GenesCloud (https://www.genescloud.cn/home, accessed on 6 January 2025).

3. Results

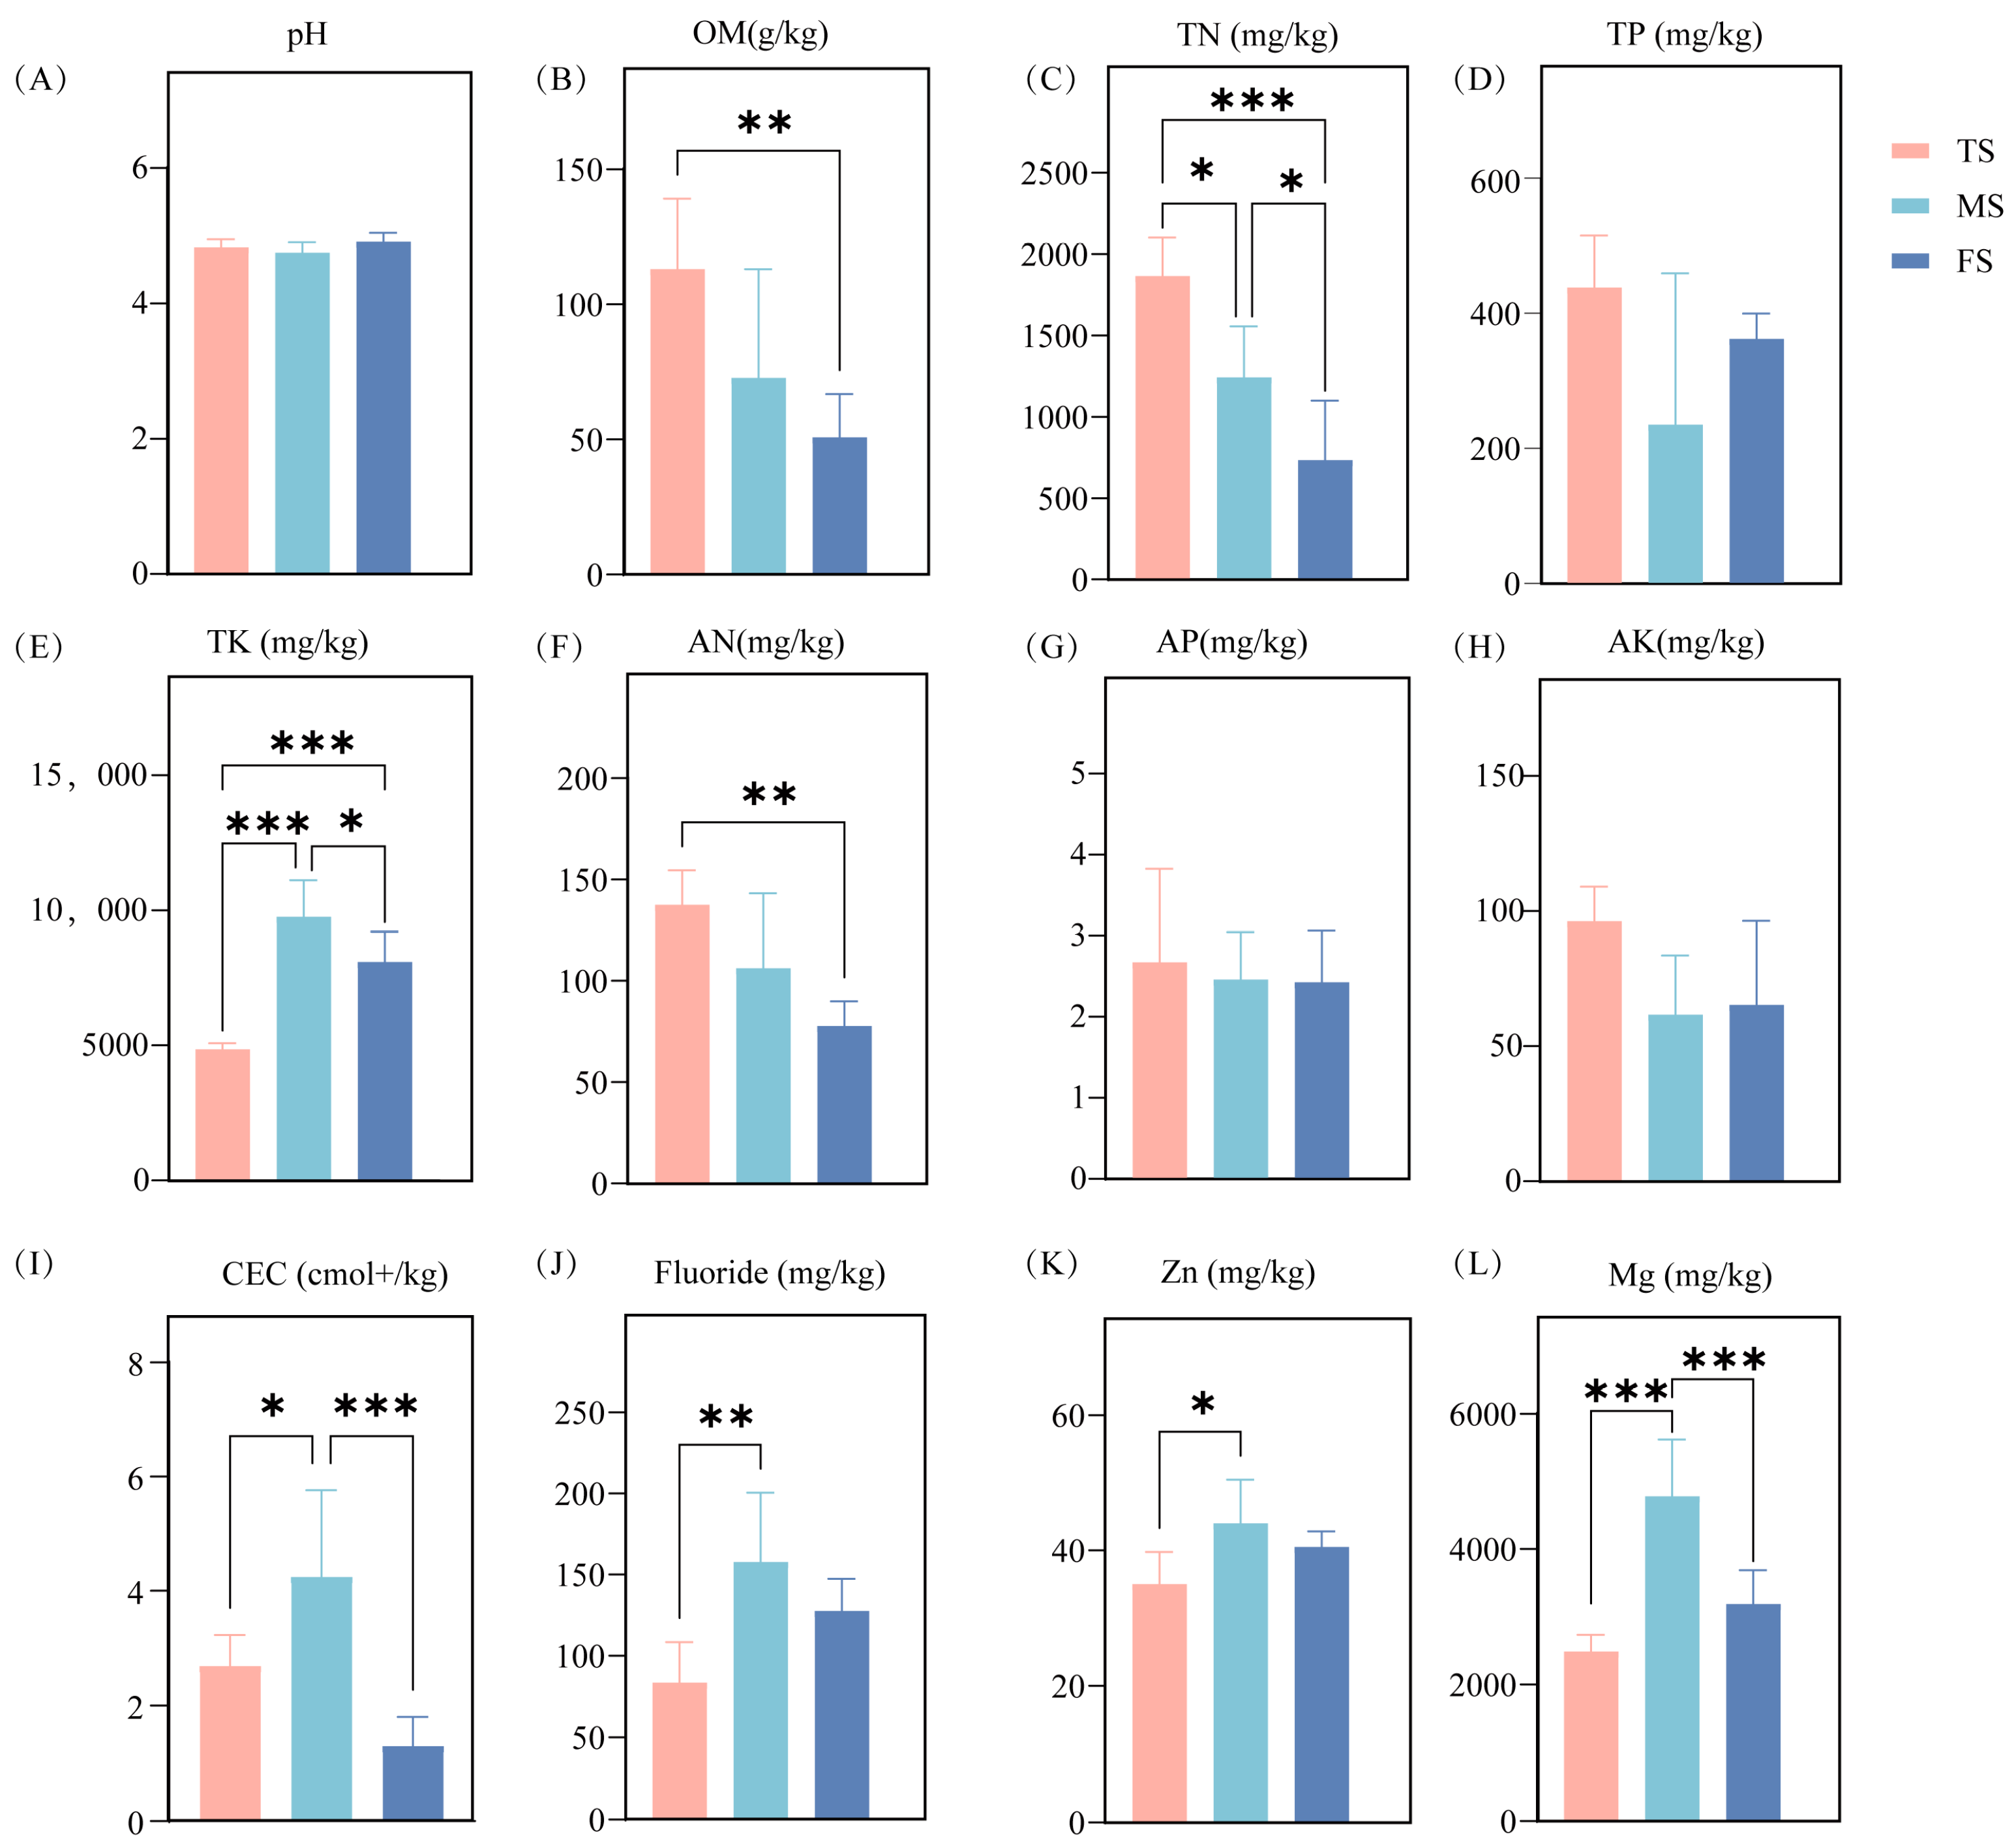
3.1. Soil Chemistry Across Slopes

Soil chemical properties were measured in different study areas, the results of which are presented in Figure 2. Soil pH ranged from 4.51 to 5.11, showing no significant differences among areas. Organic matter (OM) content was significantly higher in the TS area (113.05 g/kg) than in the FS area (50.76 g/kg), representing a 2.22-fold increase. The TS area also exhibited the highest TN content (1865 ± 238.39 mg/kg) and significantly higher AN content than the FS area (p < 0.001). Furthermore, TP, AP, and AK concentrations were higher in the TS area than in the other areas, indicating greater soil phosphorus and nitrogen availability in this region. The MS area had the highest TK content (9771.66 mg/kg), 2.01 times that of the TS area (4856.66 mg/kg). CEC, a key indicator of soil fertility, was highest in the MS area, suggesting enhanced nutrient retention in this region. Fluoride and zinc concentrations were significantly higher in the MS area than in the TS area, while magnesium concentration was significantly higher in the MS area than in both the TS and FS areas. In summary, the FS area exhibited the lowest soil nutrient content compared to the TS and MS areas.

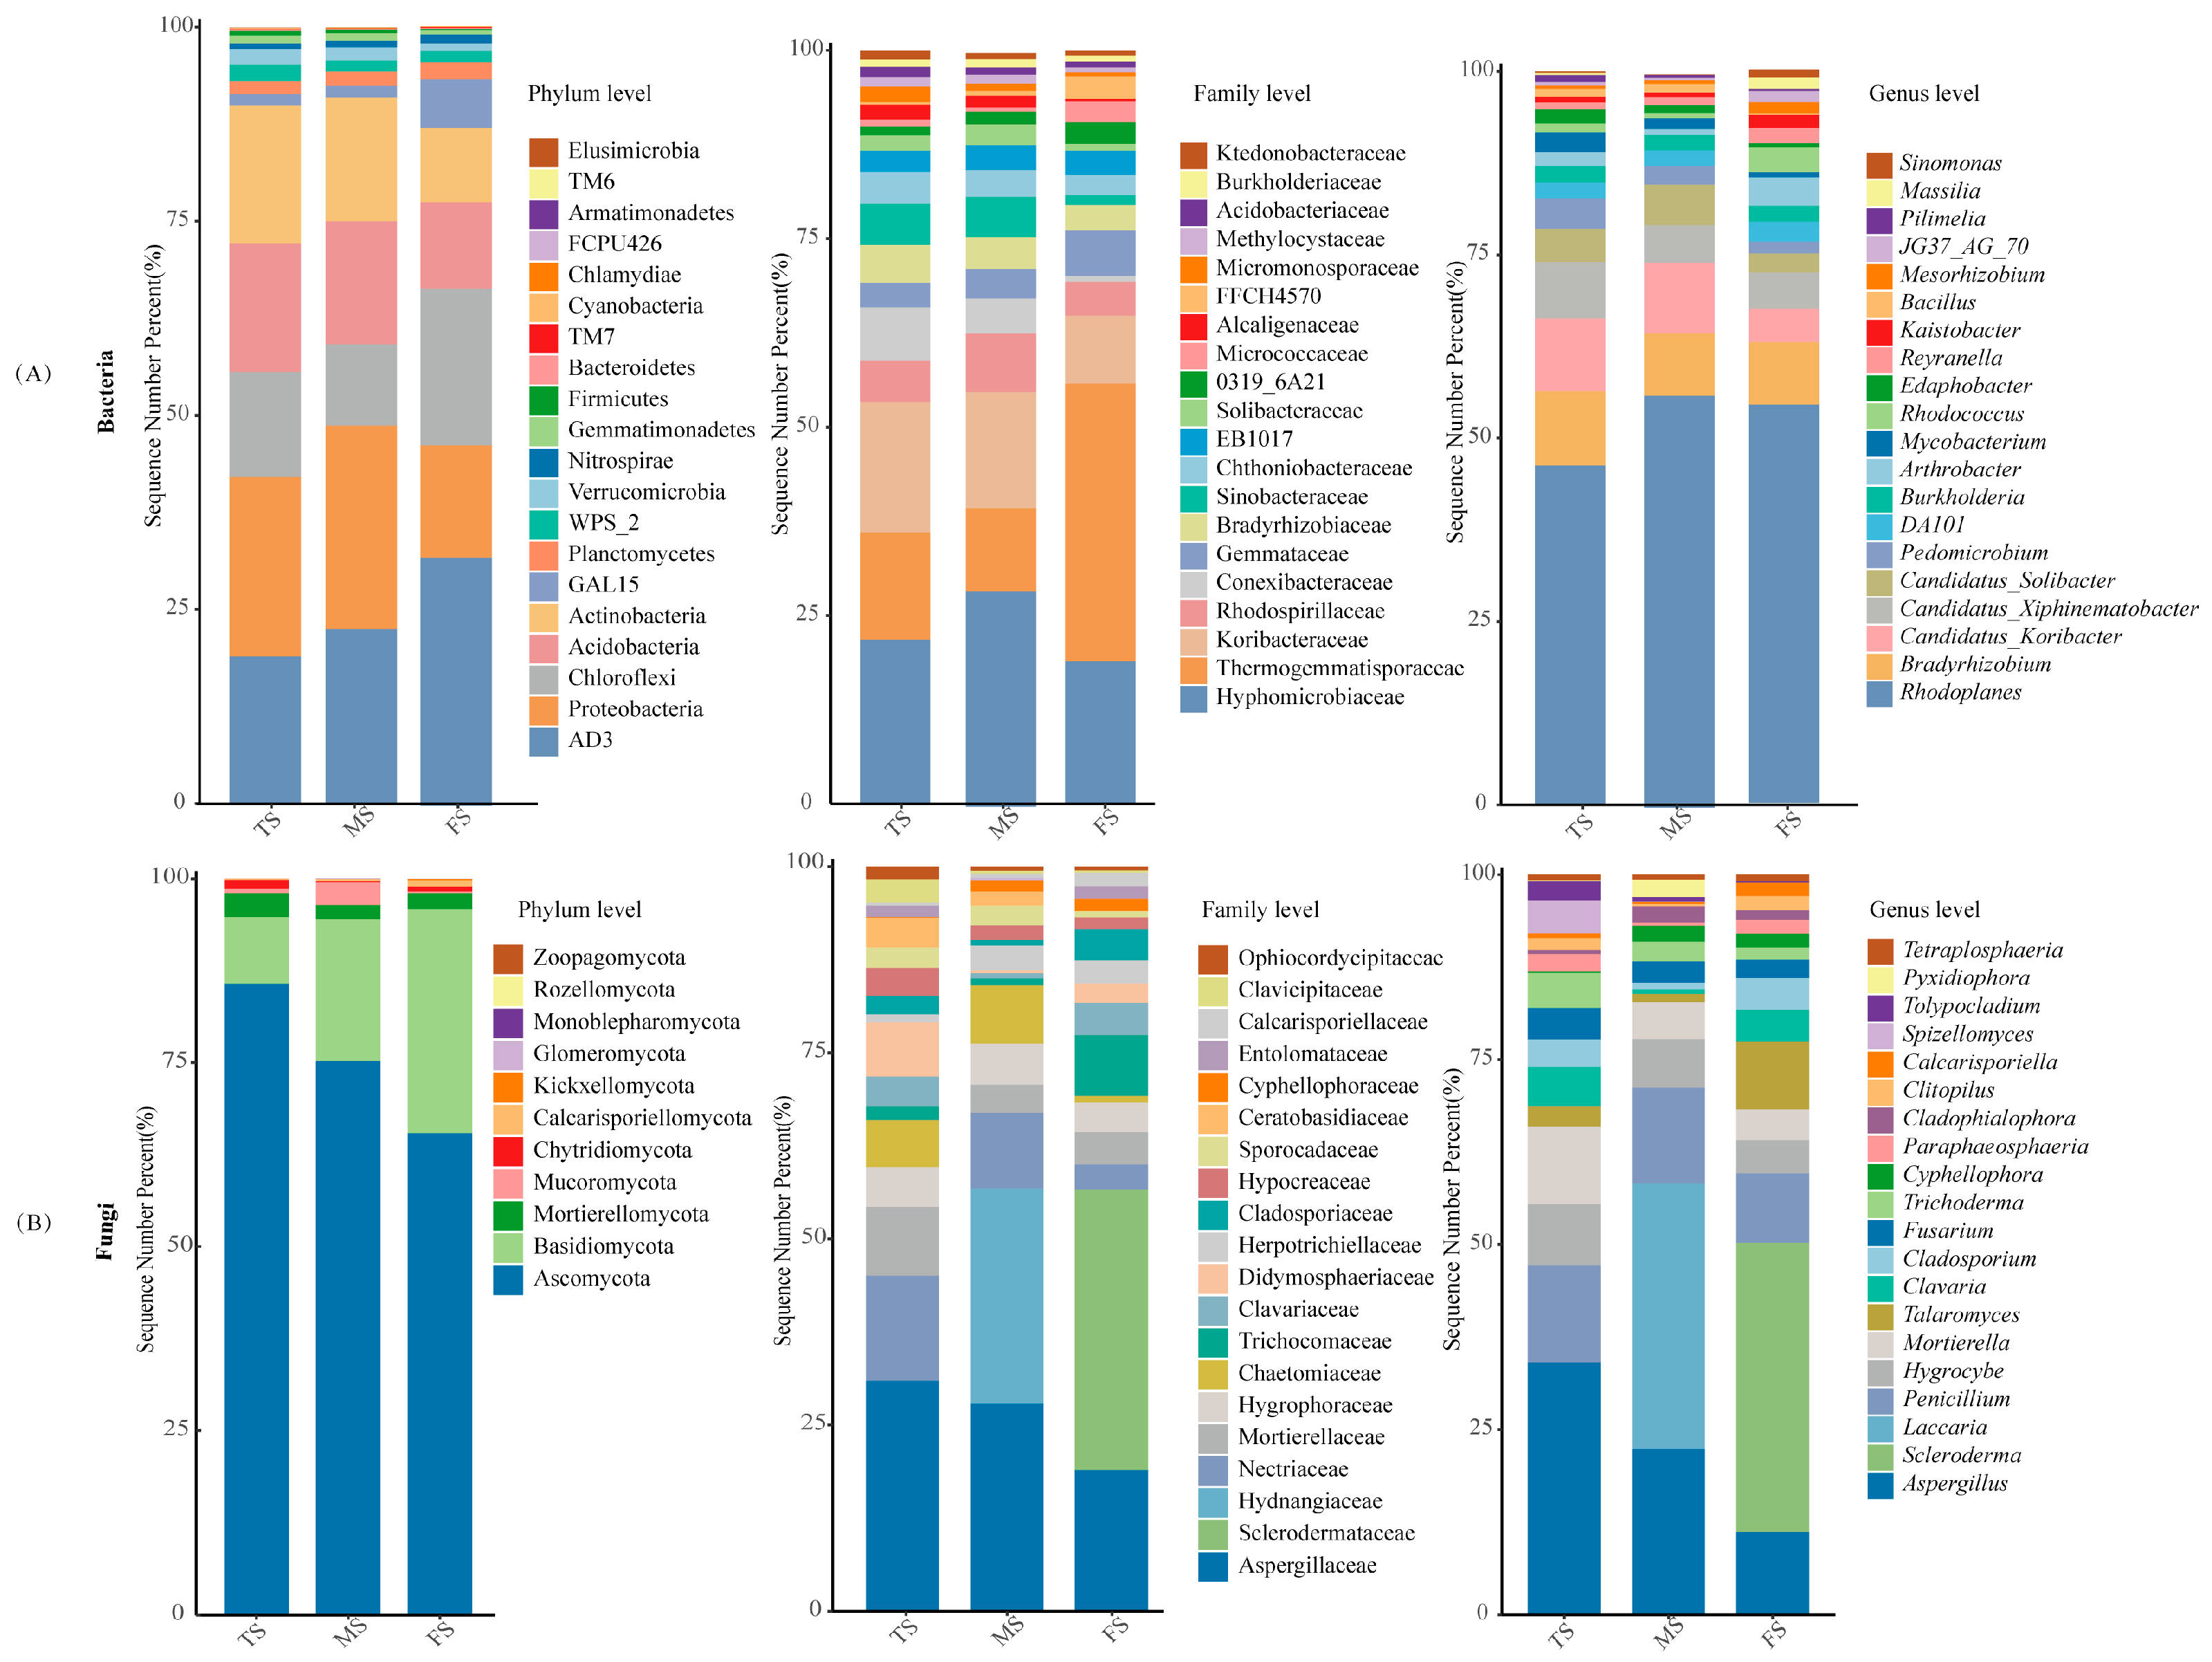
3.2. Microbial Community Composition Across Regions

A total of 18 samples yielded 609,100 optimized bacterial 16S and 953,666 fungal ITS sequences. Alpha diversity rarefaction curves indicated sufficient sequencing depth, as they reached saturation, thereby minimizing underestimation of operational taxonomic unit (OTU) richness. On this basis, the microbial community composition across three regions was analyzed, with results presented in Figure 3. Figure 3A demonstrates that bacterial communities at the phylum, family, and genus levels maintained consistent compositional patterns across slope positions, though significant abundance variations were observed. Dominant phyla identified were AD3 (24.69%), Proteobacteria (20.74%), Chloroflexi (14.94%), and Acidobacteria (14.27%), showing regional specificity: Proteobacteria predominated in TS (23.03%) and MS (25.70%), while AD3 (30.84%) and Chloroflexi (20.06%) dominated in FS. At the family level, Hyphomicrobiaceae (9.66%), Thermogemmatisporaceae (8.38%), and Koribacteraceae (5.87%) emerged as dominant taxa. Hyphomicrobiaceae showed primary dominance in MS (9.66%) and TS (10.11%), whereas Thermogemmatisporaceae prevailed in FS. As shown in Figure 3B, genus-level analysis revealed Rhodococcus (9.10%), Bradyrhizobium (1.59%), Candidatus Koribacter (1.46%), and Candidatus Xiphinematobacter (1.05%) as predominant genera. Rhodoplanes maintained dominance across all regions, exhibiting an abundance gradient of MS > FS > TS.
Figure 3B shows the fungal community composition, dominated by Ascomycota (73.54%), Basidiomycota (19.09%), and Mortierellomycota (0.43%) at the phylum level. Within this, Sclerodermataceae (13.72%) was endemic to FS, and Hydnangiaceae (10.05%) to MS. The dominant genera across the three regions included Aspergillus (18.34%), Penicillium (10.51%), and Hygrocybe (5.53%), with Scleroderma (16.38%) endemic to FS and Laccaria (10.66%) to MS. The composition of the fungal communities differed not only at the family and genus levels, but also significantly at the abundance level.

3.3. Microbial Diversity Analysis

Alpha diversity analysis showed differences in soil bacterial communities in tea gardens at different slope positions, as shown in Figure 4A. Among them, the Chao index, which reflects the microbial abundance, and the diversity indexes—the Shannon index, Simpson index, and Observed_OTUs—were higher in TS and MS communities than in FS, which indicated that the bacterial richness in TS and MS was higher and the diversity was higher. The faith_pd index was higher in FS, suggesting a more even bacterial distribution. Fungal communities exhibited the highest abundance in MS and the highest diversity in TS, mirroring the trend of greater fungal diversity and abundance in TS and MS compared to FS (Figure 4B). The β-diversity analysis of microorganisms in different regions is shown in Figure 4C,D, and the results of the analysis showed a significant separation of soil microbial communities in FS from TS and MS regions. The results of PCA analysis of different regions showed that FS was significantly separated from the other two regions (p < 0.001). This was further confirmed by principal coordinate analysis (PCoA), which showed that the bacterial community in FS was significantly different from the other two regions (R2 = 0.708, p = 0.001), and the fungal community also showed a significant difference (R2 = 0.311, p = 0.001). The nonmetric multidimensional scaling (NMDS) analytical plots showed that the bacterial community composition of FS differed significantly from that of TS and MS (stress = 0.041, p = 0.001), and the fungal community had similar characteristics (stress = 0.041, p = 0.001). In summary, the soil bacterial and fungal community composition in the FS region was significantly different from the other two regions.

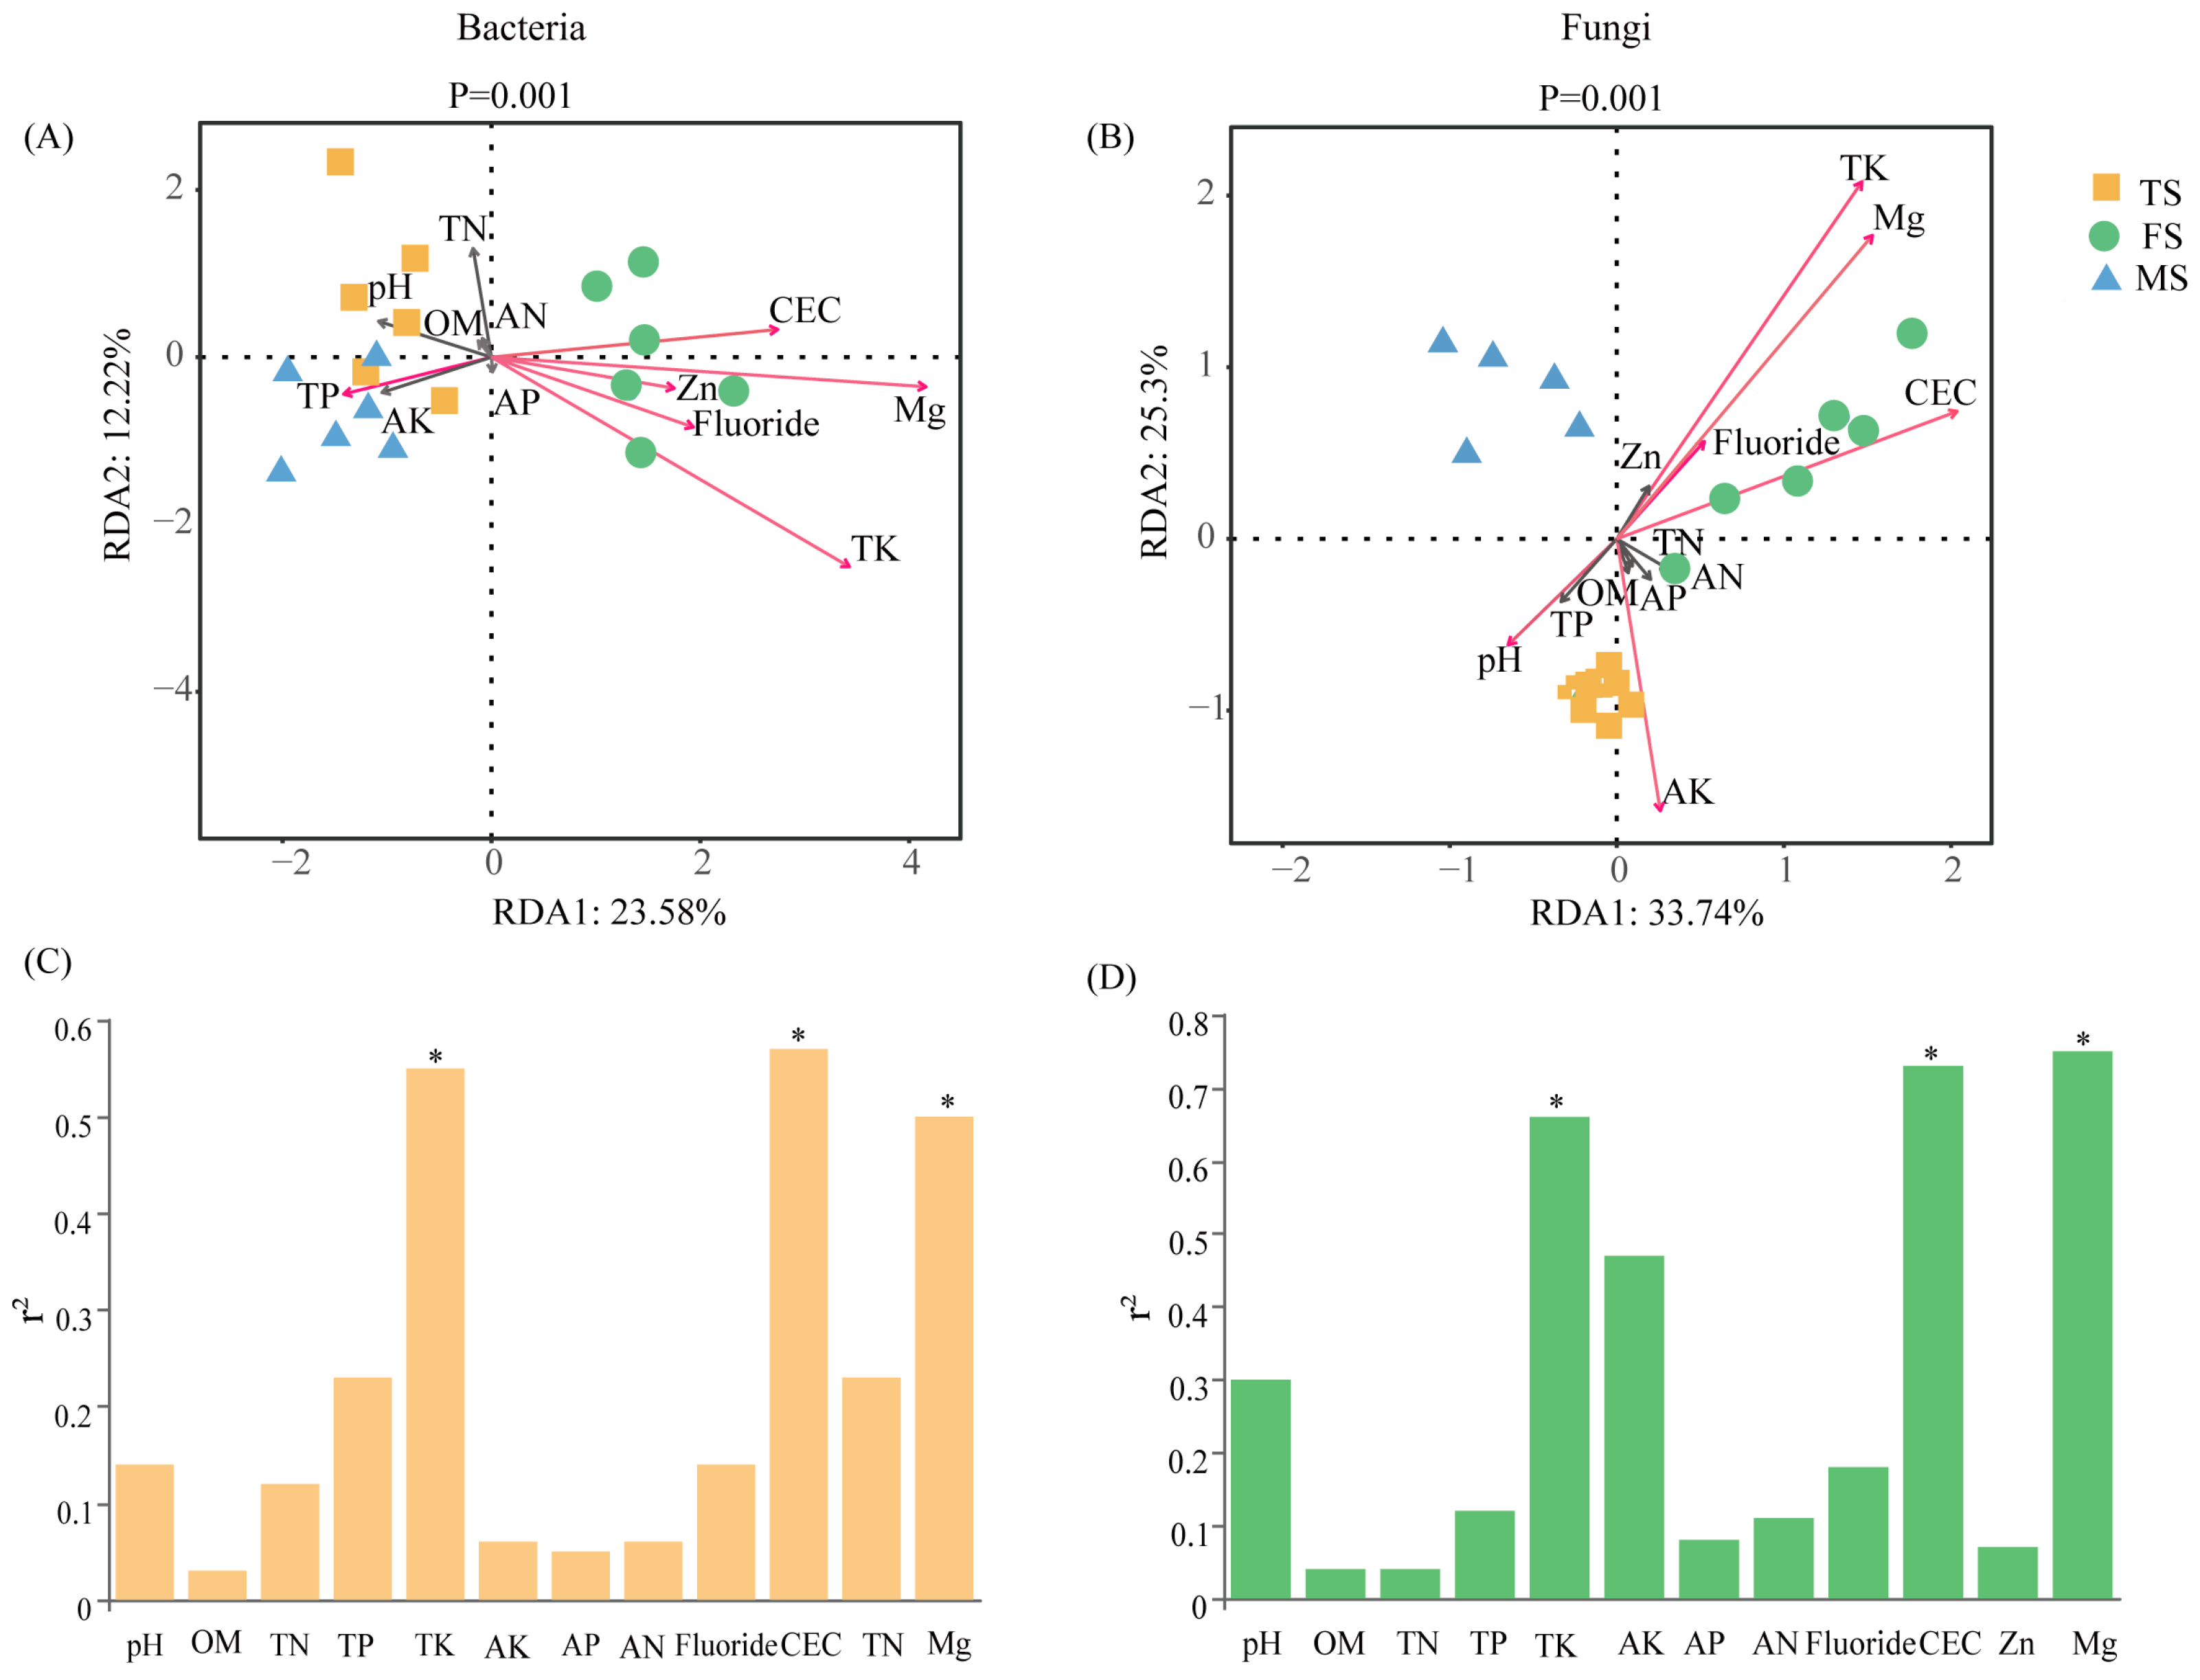
3.4. Soil Composition’s Contribution to Microorganisms

Redundancy analysis (RDA) was used to investigate the relationships between the soil microbial community composition (genus level) and chemical factors of the soil environment, as shown in Figure 5. The analysis revealed distinct spatial patterns in microbial community structure. In the FS region, microbial communities clustered primarily in the second RDA quadrant, while those in the TS and MS regions were predominantly located in the first and third quadrants, respectively. The first two RDA axes (RDA1 and RDA2) explained 23.58% and 12.22% of the variation in bacterial community structure (p = 0.001), and up to 35.8% of the bacterial community variation. Key environmental drivers varied geographically; TK, Mg, CEC, and zinc (Zn) were most influential in FS, whereas TP, pH, AK, and AN were more important in TS and MS (Figure 5A). Similarly, significant spatial variation was observed in fungal community structure, with RDA1 and RDA2 explaining 33.74% and 25.30% of the variation; the fungal mutation rate was 59.04%. In FS, TK, Mg, and CEC were the primary environmental drivers of fungal community structure; in TS, pH and TP were the most influential; and environmental influences were weaker in MS (Figure 5B). Figure 5C,D, based on the degree of interpretation of environmental factors, showed that TK, CEC, and Mg had the most significant effect on the soil microbial community.

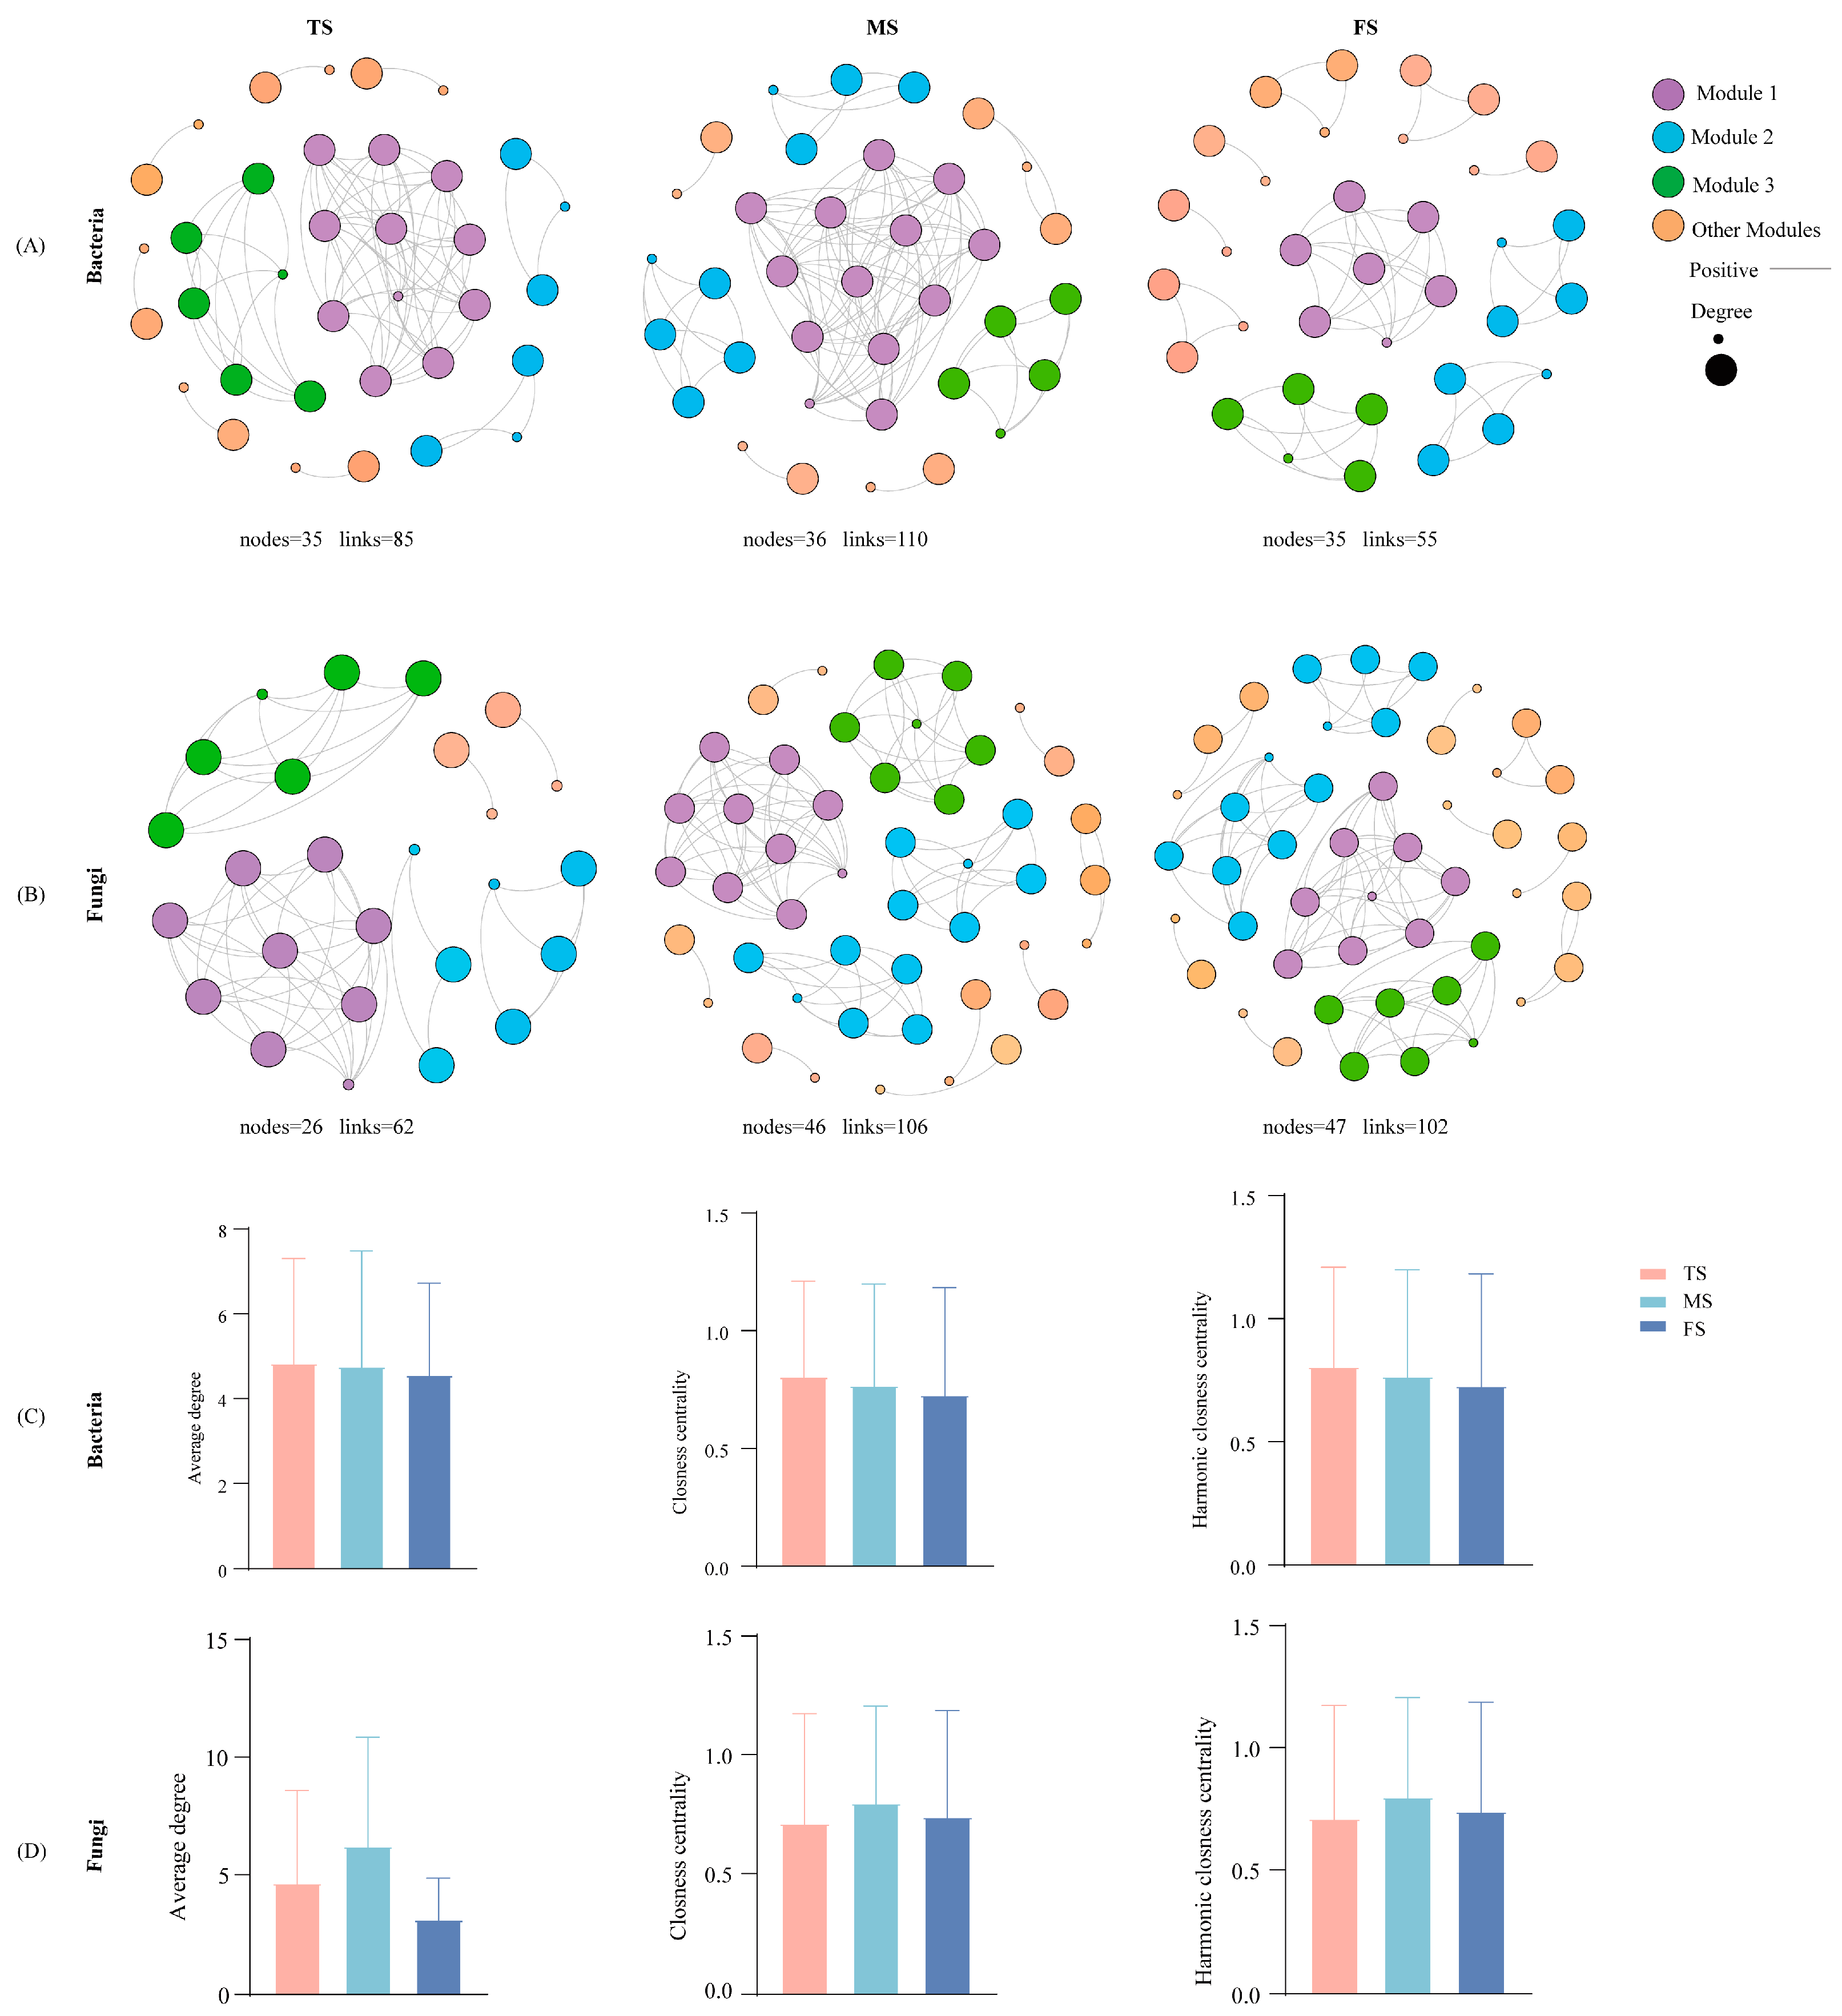
3.5. Slope Difference Drove Differences in Microbial Community Network Structure

Gephi 0.9.2 software was utilized to calculate the cooccurrence network of different sample microorganisms (Figure 6A,B). The bacterial networks comprised 35, 36, and 35 nodes, respectively, showing no significant difference in node number. However, the MS network had twice as many edges as the FS network. The fungal network node and edge counts did not differ significantly between the MS and FS regions, and no positive correlation existed between nodes and edges in either network; TS exhibited the lowest values. These three networks displayed distinct topological properties, with the MS region exhibiting greater inter-microbial connectivity. An analysis of network topology (Figure 6C,D) revealed that the average node degree, closeness centrality, and betweenness centrality in bacterial networks followed the trend TS > MS > FS, though these differences were not significant. The MS fungal network showed the highest average node degree, closeness centrality, and betweenness centrality, indicating closer interactions within the soil fungal community of that region.

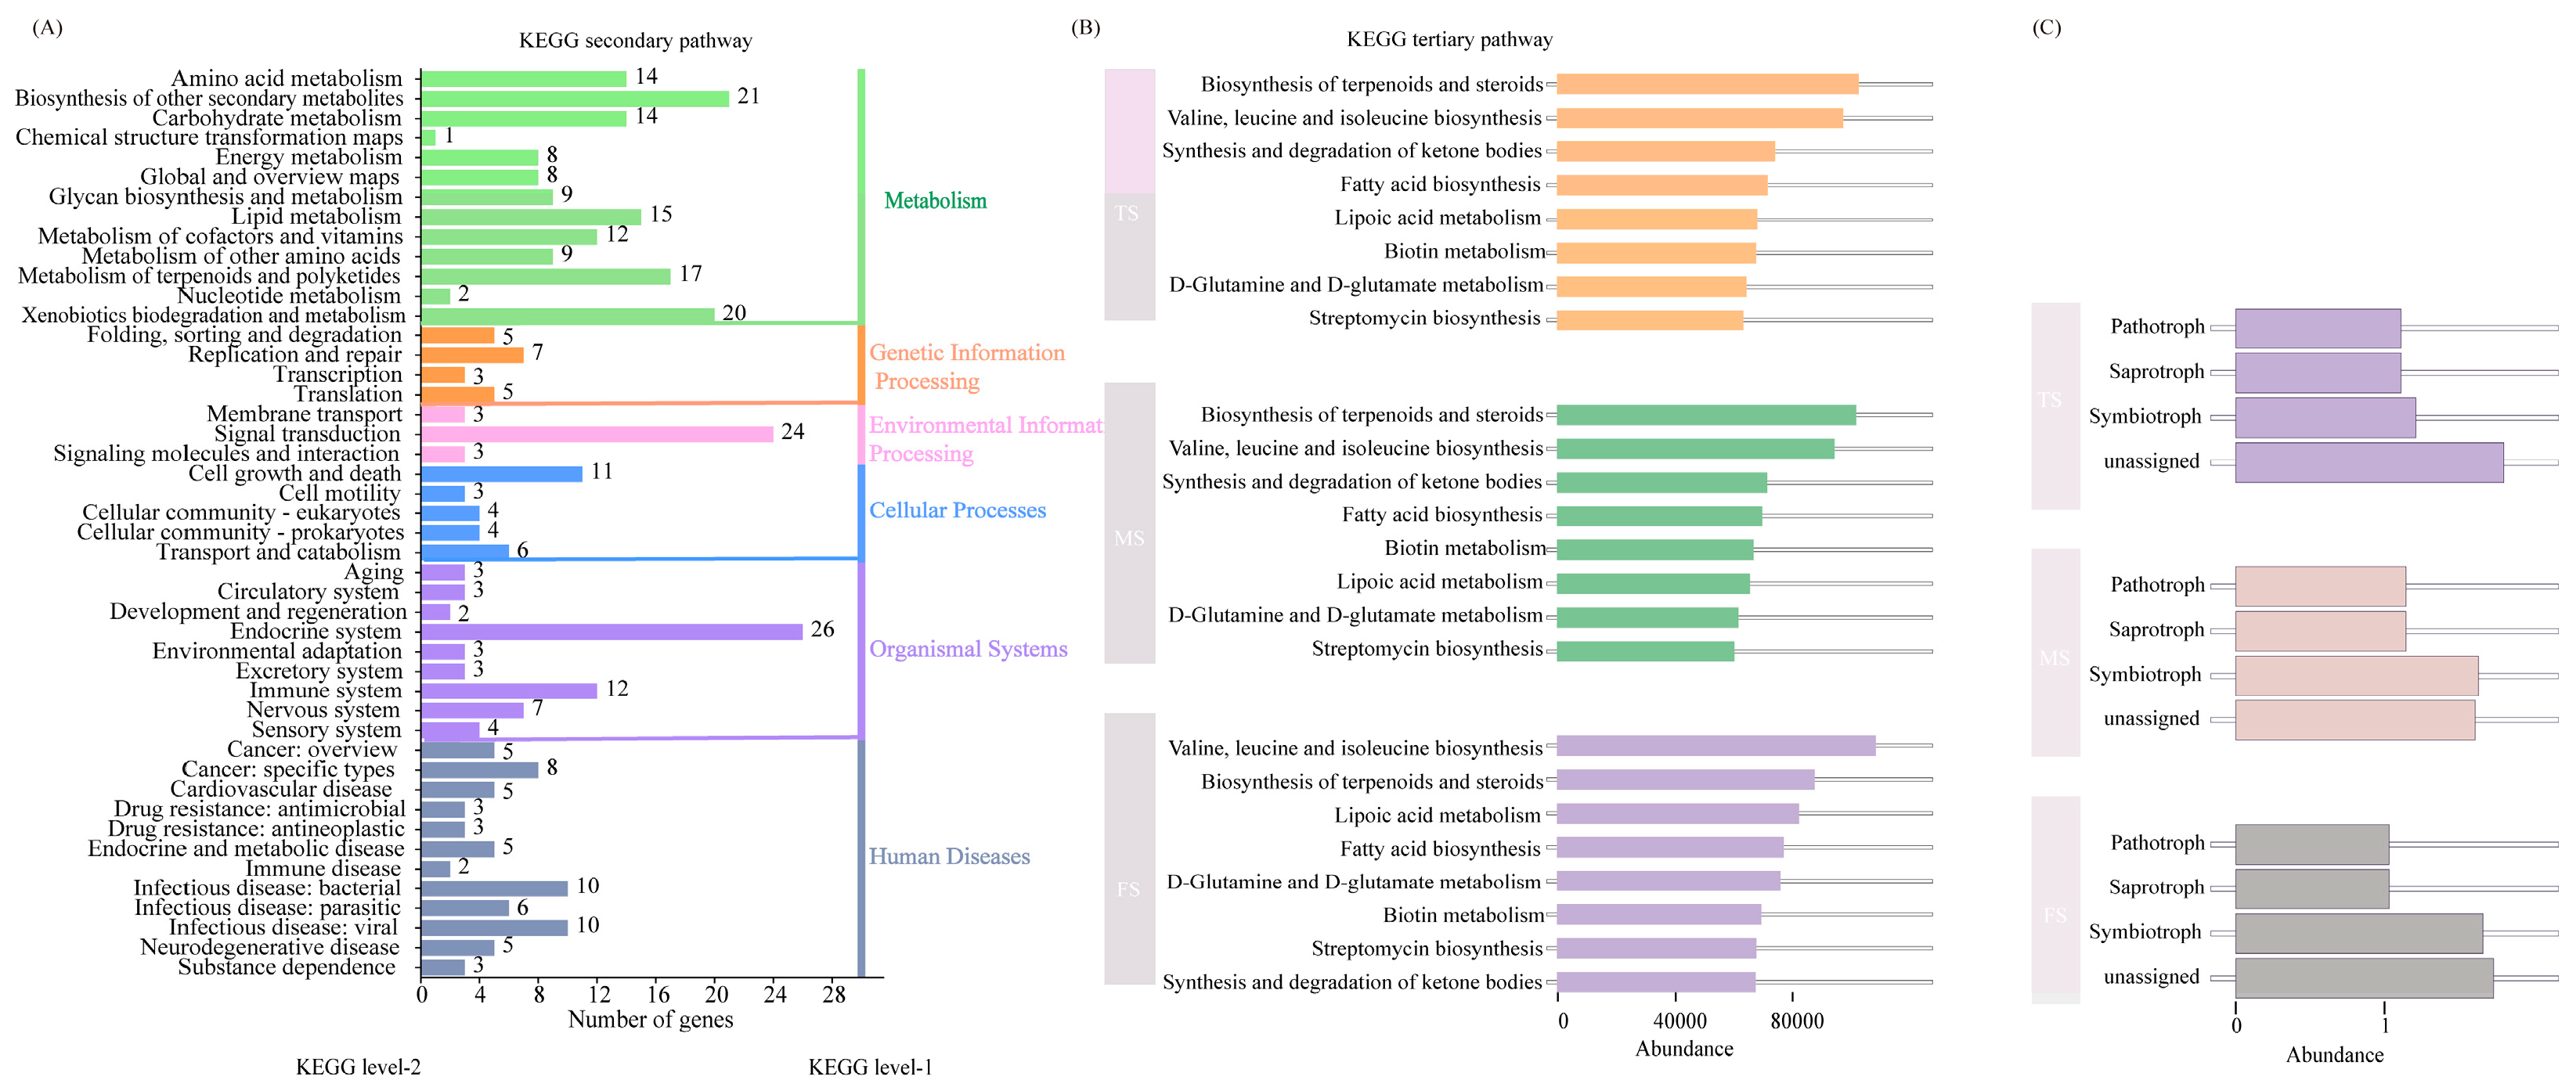
3.6. Microbiological Predictive Functional Analysis

To further understand the function of microbial communities in different regions, the microorganisms were analyzed for predictive functional analysis. Soil bacteria KEGG functional pathways are annotated in Figure 7A,B. At the first level of pathways, a total of six categories of biometabolic pathways were involved, which were metabolism with the largest proportion, followed by human diseases, organismal systems, cellular processes, genetic information processing, and environmental information processing, which accounted for the smallest proportion. There were 46 pathways in the secondary level, in which the dominant metabolic pathway is the endocrine system involving 26 related genes, followed by signal transduction involving 24 related genes and the biosynthesis of other secondary metabolites involving 21, and xenobiotics biodegradation and metabolism which involved 20, suggesting that several of the above pathways influence microbial growth and activity changes. The first eight dominant tertiary pathways are shown in Figure 7B, from which it can be observed that the tertiary pathways of bacteria from different regions do not differ in composition but in relative abundance, with the largest abundance of biosynthesis of terpenoids and steroids in the regions of TS and MS, and the largest abundance of valine, leucine, and isoleucine biosynthesis in FS. Amino acid metabolism increases microbial growth and activity in the FS region, providing a source of carbon and energy for microorganisms.
The FunGuild database was used to predict the trophic modes of fungi, and the results are shown in Figure 7C. The sample fungal communities could be categorized into four different classes, namely Saprotroph, Pathotroph, Symbiotroph, and Unassigned, with Unassigned being the dominant trophic mode, followed by Symbiotroph. The differences between the different study areas were not significant.

4. Discussion

4.1. Slope Variation in Soil Chemical Properties of Tea Plantations

Tea tree, a perennial evergreen shrub, has specific soil chemical property requirements, including pH, nutrient content, and organic matter levels [58]. This study systematically analyzed soil chemical properties on various slopes of typical tea gardens in Yunnan, revealing spatial heterogeneity. Soil OM, TN, TP, AN, and AK levels were significantly higher at the top of the slope compared to the middle and foot, following a gradient pattern of TS > MS > FS (p < 0.05). This indicates spatial heterogeneity in tea garden soil chemical properties across slopes, with slope influencing soil nutrient redistribution in tea plantations. Previous studies have shown that slope variation affects soil properties, with soil phosphorus peaking in the middle slope region due to favorable soil climatic conditions for phosphorus weathering and an active microbial community [59]. In Ethiopian agricultural areas, soil organic carbon (SOC), TN, and CEC were higher in downslope locations compared to the tops of the slopes, attributed to sedimentation effects. The C:N ratio decreased with decreasing slope, indicating the influence of the slope on soil drainage patterns and erosion processes by wind and rain [60]. The organic carbon content increased in low-slope areas and horizontal depressions due to rainwater erosion and deposition [61]. Conversely, Moges et al. [62] found lower levels of TN, CEC, Ca, and Mg in low slopes compared to the top and middle slopes in a highly eroded semi-arid zone. This may be due to lateral nutrient migration from runoff scouring during the monsoon season, leading to foot slope degradation through gully erosion and sediment accumulation. The findings of this study align with these observations, suggesting that intense precipitation events cause substantial rainfall at the foot of the slope, resulting in soil nutrient loss and depletion through hydraulic erosion, leading to a relatively low nutrient content in sloping soils.

4.2. Slope Differences in Soil Microbial Community Composition

Soil microorganisms play a crucial role in maintaining ecosystem functions, including facilitating nutrient cycling, participating in organic matter decomposition, and regulating plant growth and development [63]. Previous studies have demonstrated significant variations in soil microbial community composition across different slope gradients, which exhibit strong correlations with soil pH, carbon-to-nitrogen ratio, and total organic carbon (TOC) content [43]. This study reveals distinct differences in soil microbial community composition among tea plantation areas with varying slope positions. While bacterial communities demonstrated compositional similarities across different slope positions, significant variations were observed in abundance levels, which may be closely linked to slope-induced differences in soil chemical properties. The relatively higher organic matter and nitrogen content in TS and MS areas might provide more favorable conditions for Proteobacteria, whereas the lower nutrient availability in FS areas could potentially enhance the relative dominance of AD3 and Chloroflexi [64]. In contrast, fungal communities exhibited higher dynamism across slope positions, a pattern potentially associated with fungal sensitivity to soil pH, organic matter content, and nutrient availability [65]. Bacteria generally possess greater metabolic diversity and adaptability, enabling their survival and proliferation in diverse soil environments. Comparatively, fungi demonstrate a heightened sensitivity to variations in soil chemical properties and environmental conditions [66]. These differential responses may exert significant impacts on the stability and functionality of tea plantation ecosystems. On the one hand, bacterial stability contributes to maintaining soil fertility and the continuity of nutrient cycling. On the other hand, fungal dynamism may confer greater flexibility in responding to environmental changes [65,67]. However, this dynamism could also lead to fungal community instability, potentially affecting soil structure and the efficiency of organic matter decomposition [68].

4.3. Slope Variations in Soil Microbial Co-Occurrence Networks

This study revealed significant differences in the interaction patterns of soil microbial communities across slope positions by constructing bacterial and fungal co-occurrence networks. The results indicated that microbial relationships were predominantly positive, suggesting widespread synergistic interactions within microbial communities. In the SM area, bacterial networks exhibited higher connectivity and fungal communities demonstrated more frequent ecological interactions, likely closely associated with the favorable soil nutrient conditions in this region. Similarly, studies on alpine grasslands have reported distinct microbial interaction networks across elevation gradients, predominantly characterized by positive correlations [69]. Additionally, research on soils in the eastern Tibetan Plateau identified predominantly positive microbial associations, consistent with our findings [70]. It has been proposed that microbial communities with higher species richness generally possess greater functional potential [71]. In this study, the bacterial community composition showed no significant differences across slope positions, indicating high functional similarity. In contrast, fungal communities exhibited significant compositional variations at both family and genus levels, accompanied by differences in species abundance. Despite these compositional differences, fungal communities maintained consistent primary nutritional modes. This phenomenon aligns with functional predictions of microbial communities along elevation gradients in arid valleys, suggesting relatively minor variations in fungal contributions to soil processes across topographic gradients [72]. These findings may imply that fungal communities exhibit certain conservative responses to environmental changes, while bacterial communities demonstrate higher adaptability and stability.

5. Conclusions

This study systematically elucidated the coupling relationships between soil chemical properties and microbial communities across different slope positions in tea plantations, and revealed, for the first time from a topographic gradient perspective, the mechanisms by which slope position differences influence tea plantation ecosystem functions. The key findings demonstrated significant spatial heterogeneity in soil chemical properties (OM, TN, TK, and CEC) and microbial community characteristics (compositional structure, co-occurrence networks) among slope positions. Such spatial differentiation was shown to ultimately affect tea plantation productivity and ecological health by influencing tea plant nutrient uptake efficiency and microbial interaction patterns. Specifically, the TS area exhibited potential as a premium tea production zone due to its superior soil fertility, while the MS area demonstrated enhanced ecological stability through its complex microbial network. Conversely, the FS area displayed reduced soil nutrient retention caused by summer rainfall erosion. To optimize hillside tea plantation yields, differentiated management strategies are proposed: intercropping with green manure crops (e.g., Chinese milk vetch) in TS areas to sustain organic matter levels, implementing shallow tillage in MS areas to preserve surface litter as microbial carbon sources, and intensifying base and topdressing fertilizer applications in FS areas. These findings not only provide direct guidance for sustainable tea plantation management but also establish a theoretical framework for developing a dynamic “topography–soil–microorganism” trinity regulation system. Future research could integrate machine-learning models to optimize fertilization strategies, achieving yield enhancement while maintaining microbial network stability.

Author Contributions

Conceptualization, writing—original draft, L.L. and L.C.; conceptualization, software implementation and support, H.L.; methodology, validation, visualization, H.W.; investigation, methodology, project administration, W.Y.; visualization, formal analysis, M.Z.; review, editing, supervision, visualization, Q.W.; writing—review, editing, refinement, L.C. and Q.W.; data curation, formal analysis, interpretation of results, Y.X. and J.T.; resources, supervision, funding acquisition, B.W. All authors have read and agreed to the published version of the manuscript.

Funding

This research was supported by the Study of Yunnan Big Leaf Tea Tree Phenotypic Plasticity Characteristics Selection Mechanism Based on AI-driven Data Fusion (202301AS070083), the grants for the Development and Demonstration of Intelligent Agriculture Data Sensing Technology and Equipment in Plateau Mountainous Areas (202302AE09002001), the Innovative Team for AI and Big Data Applications in Yunnan’s Tea Industry (202405AS350025), the Smart Tea Industry Technology Task of Menghai County, Yunnan Province (202304BI090013), and the Research on Key Technologies for Coherent Control of Whole Scene Canopy Detection and Harvesting by Plateau Mountain Tea Harvesting Robots (32460782).

Data Availability Statement

The data recorded in the current study are available in the figures and tables in this manuscript.

Conflicts of Interest

The authors declare no conflicts of interest.

References

  1. Yu, J.; Wang, Q.; Wang, W.; Ma, R.; Ding, C.; Wei, K.; Wang, L.; Ge, S.; Shi, Y.; Li, X. Transcriptomic and metabolomic insights into temperature-dependent changes in catechin and anthocyanin accumulation in tea plants with different leaf colors. Plant Stress 2024, 14, 100705. [Google Scholar] [CrossRef]
  2. Karlsson, B.G. The imperial weight of tea: On the politics of plants, plantations and science. Geoforum 2022, 130, 105–114. [Google Scholar] [CrossRef]
  3. Dai, Y. The overlap of suitable tea plant habitat with Asian elephant (Elephus maximus) distribution in southwestern China and its potential impact on species conservation and local economy. Environ. Sci. Pollut. Res. 2021, 29, 5960–5970. [Google Scholar] [CrossRef] [PubMed]
  4. Wang, S.; Liu, Q.; Liu, Z.; Chen, W.; Zhao, X.; Zhang, J.; Bao, L.; Zhang, N. Distribution and soil threshold of selenium in the cropland of southwest mountainous areas in China. Sci. Rep. 2024, 14, 16923. [Google Scholar] [CrossRef] [PubMed]
  5. Huang, X.; Wang, B.; Li, P.; Chen, A.; Cui, J.; Chen, Y.; Gao, W. Organic management promotes nitrogen transformation in tea plantations soil: A case study from southwestern China. Appl. Soil Ecol. 2025, 206, 105878. [Google Scholar] [CrossRef]
  6. Yang, H.; Suntornvongsagul, K.; Wang, J.; Wang, Q.; Zhang, W. Indigenous knowledge in the sustainable management of a biodiversity-based millennium-old tea forest in the highlands of Yunnan Province, southwestern China. Biodiversity 2024, 25, 142–152. [Google Scholar] [CrossRef]
  7. Pennino, A.; Strahm, B.D.; McGuire, K.J.; Bower, J.A.; Bailey, S.W.; Schreiber, M.E.; Ross, D.S.; Duston, S.A.; Benton, J.R. Forest catchment structure mediates shallow subsurface flow and soil base cation fluxes. Geoderma 2024, 450, 117045. [Google Scholar] [CrossRef]
  8. Xu, L. The Relationship Between Vegetation and Terrain Factor Based on Topographic Correction. Acad. J. Sci. Technol. 2023, 6, 162–167. [Google Scholar] [CrossRef]
  9. Hancock, G.R.; Murphy, D.; Evans, K.G. Hillslope and catchment scale soil organic carbon concentration: An assessment of the role of geomorphology and soil erosion in an undisturbed environment. Geoderma 2010, 155, 36–45. [Google Scholar] [CrossRef]
  10. Bardgett, R.D.; van der Putten, W.H. Belowground biodiversity and ecosystem functioning. Nature 2014, 515, 505–511. [Google Scholar] [CrossRef] [PubMed]
  11. Guo, L.; Li, J.; Fu, F.; Zhang, B.; Zhu, S.; Liu, Y.; Li, J.; Chen, G.; Zhang, Y. Correlations and stoichiometric characteristics of C, N, and P contents in Juniperus saltuaria plants, litter, and soil in the Sygera Mountains, southeastern Xizang, China. J. Mt. Sci. 2024, 21, 4254–4268. [Google Scholar] [CrossRef]
  12. Zhang, Q.; Zhou, Z.; Zhao, W.; Huang, G.; Liu, G.; Li, X.; Wu, J. Effect of slope position on leaf and fine root C, N and P stoichiometry and rhizosphere soil properties in Tectona grandis plantations. J. For. Res. 2023, 34, 1997–2009. [Google Scholar] [CrossRef]
  13. Cheraghi, J.; Heydari, M.; Rostaminia, M.; Rostaminia, M.; Omidipour, R.; Kooch, Y.; Dey, D.C. Spatial Variability of Soil Properties and Quality along Different Hillslope Sequences in a Protected Semiarid Oak Forest: The Role of Landscape Position and Shape. J. Earth Sci. 2023. [Google Scholar] [CrossRef]
  14. Sigua, G.C.; Coleman, S.W. Spatial distribution of soil carbon in pastures with cow-calf operation: Effects of slope aspect and slope position. J. Soils Sediments 2009, 10, 240–247. [Google Scholar] [CrossRef]
  15. Huang, A.; Wang, Z.; Yang, D.; Yang, S.; Bai, W.; Wu, N.; Lu, X.; Liu, Z. Effects of tea oil camellia (Camellia oleifera Abel.) shell-based organic fertilizers on the physicochemical property and microbial community structure of the rhizosphere soil. Front. Microbiol. 2023, 14, 1231978. [Google Scholar] [CrossRef] [PubMed]
  16. Yan, P.; Shen, C.; Zou, Z.; Fu, J.; Li, X.; Zhang, L.; Zhang, L.; Han, W.; Fan, L. Biochar stimulates tea growth by improving nutrients in acidic soil. Sci. Hortic. 2021, 283, 110078. [Google Scholar] [CrossRef]
  17. Miao, P.; Pang, X.; Zhang, M.; Cheng, W.; Zhou, Z.; Li, Y.; Wang, H.; Jia, X.; Ye, J.; Zhang, Q. Enhancing Soil Health and Tea Plant Quality Through Integrated Organic and Chemical Fertilization Strategies. Horticulturae 2024, 10, 1311. [Google Scholar] [CrossRef]
  18. Wang, H.; Yuan, W.; Wang, Q.; Xia, Y.; Chun, W.; Li, H.; Peng, G.; Huang, W.; Wang, B. Comprehensive Assessment of the Correlation Between Ancient Tea Garden Soil Chemical Properties and Tea Quality. Horticulturae 2024, 10, 1207. [Google Scholar] [CrossRef]
  19. Singh, A.K.; Chauhan, R.K.; Kumar, C.; Bera, B. Sustaining Darjeeling Organic Tea (Camellia sinensis L) Production and Tea Quality Through Organic Inputs in the Himalayan Foothills. J. Soil Sci. Plant Nutr. 2023, 23, 1774–1796. [Google Scholar] [CrossRef]
  20. Pradhan, D.; Bharose, R.; Thomas, T. Assessment of Physico-Chemical Properties of Tea Garden Soils of Darjeeling, West Bengal, India. J. Adv. Biol. Biotechnol. 2024, 27, 920–928. [Google Scholar] [CrossRef]
  21. Sarkar, I.; Kar, P.; Sen, G.; Chhetri, S.; Bhattacharya, M.; Bhattacharyya, S.; Sen, A. Metagenomic outlooks of microbial dynamics influenced by organic manure in tea garden soils of North Bengal, India. Arch. Microbiol. 2022, 204, 33. [Google Scholar] [CrossRef] [PubMed]
  22. Yin, R.; Li, L.; Liu, H.; Yao, J.; Ma, C.; Pu, L.; Lei, Z. Biochar, Organic Fertilizer, and Bio-Organic Fertilizer Improve Soil Fertility and Tea Quality. Agronomy 2024, 14, 2339. [Google Scholar] [CrossRef]
  23. Cai, J.; Qiu, Z.; Liao, J.; Li, A.; Chen, J.; Wu, Z.; Khan, W.; Sun, B.; Liu, S.; Zheng, P. Comprehensive Analysis of the Yield and Leaf Quality of Fresh Tea (Camellia sinensis cv. Jin Xuan) under Different Nitrogen Fertilization Levels. Foods 2024, 13, 2091. [Google Scholar] [CrossRef]
  24. Liu, D. Root developmental responses to phosphorus nutrition. J. Integr. Plant Biol. 2021, 63, 1065–1090. [Google Scholar] [CrossRef] [PubMed]
  25. Carstensen, A.; Herdean, A.; Schmidt, S.B.; Sharma, A.; Spetea, C.; Pribil, M.; Husted, S. The Impacts of Phosphorus Deficiency on the Photosynthetic Electron Transport Chain. Plant Physiol. 2018, 177, 271–284. [Google Scholar] [CrossRef] [PubMed]
  26. Sitienei, K.; Home, P.G.; Kamau, D.M.; Wanyoko, J.K. Nitrogen and Potassium Dynamics in Tea Cultivation as Influenced by Fertilizer Type and Application Rates. Am. J. Plant Sci. 2013, 04, 59–65. [Google Scholar] [CrossRef]
  27. Bai, R.; Liu, H.; Liu, Y.; Yong, J.W.H. Effects of Foliar Application of Magnesium Fertilizer on Photosynthesis and Growth in Grapes. Agronomy 2024, 14, 2659. [Google Scholar] [CrossRef]
  28. Xian, X.; Sun, W.; Zhang, Z.; Gao, Y.; Li, C.; Ding, L.; Wang, Y. Effects of combined application of phosphorus and zinc on growth and physiological characteristics of apple rootstock M9-T337 seedlings (Malus domestica Borkh.). BMC Plant Biol. 2024, 24, 998. [Google Scholar] [CrossRef]
  29. Trukhachev, V.; Velikii, A.V.; Skuratov, A.; Shitikova, A.; Migunov, R.; Abbas, R.Z. The effectiveness of the combined use of zinc, boron, and magnesium on tea plantations in the humid subtropics of Russia. BIO Web Conf. 2024, 139, 04001. [Google Scholar] [CrossRef]
  30. Anh-Dao, L.-T.; Minh-Huy, D.; Thu-Huong, N.; Tuong-Thu, V.-T.; Kim-Sinh, N.-T.; Thanh-Nho, N.; Cong-Hau, N. An optimized smartphone-based colorimetric detection method for evaluating the fluoride released in tea extracts from different brewing conditions. J. Iran. Chem. Soc. 2024, 21, 2137–2146. [Google Scholar] [CrossRef]
  31. Jibola-Shittu, M.Y.; Heng, Z.; Keyhani, N.O.; Dang, Y.; Chen, R.; Liu, S.; Lin, Y.; Lai, P.; Chen, J.; Yang, C.; et al. Understanding and exploring the diversity of soil microorganisms in tea (Camellia sinensis) gardens: Toward sustainable tea production. Front. Microbiol. 2024, 15, 1379879. [Google Scholar] [CrossRef]
  32. Bag, S.; Mondal, A.; Banik, A. Exploring tea (Camellia sinensis) microbiome: Insights into the functional characteristics and their impact on tea growth promotion. Microbiol. Res. 2022, 254, 126890. [Google Scholar] [CrossRef]
  33. Bora, S.S.; Hazarika, D.J.; Gogoi, R.; Dullah, S.; Gogoi, M.; Barooah, M. Long-term pruning modulates microbial community structure and their functional potential in Tea (Camellia sinensis L.) soils. Appl. Soil Ecol. 2022, 176, 104483. [Google Scholar] [CrossRef]
  34. Bora, P.; Chandra Bora, L.; Bhuyan, R.P.; Hashem, A.; Fathi Abd-Allah, E. Bioagent consortia assisted suppression in grey blight disease with enhanced leaf nutrients and biochemical properties of tea (Camellia sinensis). Biol. Control 2022, 170, 104907. [Google Scholar] [CrossRef]
  35. Długosz, J.; Dębska, B.; Piotrowska-Długosz, A. The Effect of Soil Tillage Systems on the Soil Microbial and Enzymatic Properties Under Soybean (Glycine max L. Merrill) Cultivation—Implications for Sustainable Soil Management. Sustainability 2024, 16, 11140. [Google Scholar] [CrossRef]
  36. Lei, Y.; Ding, D.; Duan, J.; Luo, Y.; Huang, F.; Kang, Y.; Chen, Y.; Li, S. Soil Microbial Community Characteristics and Their Effect on Tea Quality under Different Fertilization Treatments in Two Tea Plantations. Genes 2024, 15, 610. [Google Scholar] [CrossRef] [PubMed]
  37. Song, L.; Niu, Z.; Cao, S.; Chen, S.; Zhao, S.; Zi, Q.; Yu, W.; Xu, H.; Zhao, D.; Qing, M. Effects of pea-tea intercropping on rhizosphere soil microbial communities. Plant Soil 2023, 506, 125–135. [Google Scholar] [CrossRef]
  38. Li, H.; Wang, Q.; Wang, H.; Li, L.; Wang, X.; Wu, T.; Wang, C.; Qian, Y.; Wang, X.; Xia, Y.; et al. LCLN-CA: A Survival Regression Analysis-Based Prediction Method for Catechin Content in Yunnan Sun-Dried Tea. Horticulturae 2024, 10, 1321. [Google Scholar] [CrossRef]
  39. Liu, Y.; Li, Y.; Luo, W.; Liu, S.; Chen, W.; Chen, C.; Jiao, S.; Wei, G. Soil potassium is correlated with root secondary metabolites and root-associated core bacteria in licorice of different ages. Plant Soil 2020, 456, 61–79. [Google Scholar] [CrossRef] [PubMed]
  40. Shu, X.; Zhang, K.; Zhang, Q.; Wang, W. Changes in the composition of rhizosphere bacterial communities in response to soil types and acid rain. J. Environ. Manag. 2023, 325, 116493. [Google Scholar] [CrossRef] [PubMed]
  41. Zebec, V.; Rastija, D.; Lončarić, Z.; Bensa, A.; Popović, B.; Ivezić, V. Comparison of Chemical Extraction Methods for Determination of Soil Potassium in Different Soil Types. Eurasian Soil Sci. 2018, 50, 1420–1427. [Google Scholar] [CrossRef]
  42. Sáez-Plaza, P.; Michałowski, T.; Navas, M.J.; Asuero, A.G.; Wybraniec, S. An Overview of the Kjeldahl Method of Nitrogen Determination. Part I. Early History, Chemistry of the Procedure, and Titrimetric Finish. Crit. Rev. Anal. Chem. 2013, 43, 178–223. [Google Scholar] [CrossRef]
  43. Shen, C.; Xiong, J.; Zhang, H.; Feng, Y.; Lin, X.; Li, X.; Liang, W.; Chu, H. Soil pH drives the spatial distribution of bacterial communities along elevation on Changbai Mountain. Soil Biol. Biochem. 2013, 57, 204–211. [Google Scholar] [CrossRef]
  44. Loftus, S.; Sauer, A.M.; Schneider, E.M.; Erugoti, L.K.; Tharanya, M.; Rötter, R.P.; Kholová, J.; Ahmed, M.A.; Dippold, M.A. Distinct water and phosphorus extraction patterns are key to maintaining the productivity of sorghum under drought and limited soil resources. Sci. Rep. 2025, 15, 4949. [Google Scholar] [CrossRef] [PubMed]
  45. Ullah, R.; Abbas, Z.; Bilal, M.; Habib, F.; Iqbal, J.; Bashir, F.; Noor, S.; Qazi, M.A.; Niaz, A.; Baig, K.S.; et al. Method development and validation for the determination of potassium (K2O) in fertilizer samples by flame photometry technique. J. King Saud Univ. Sci. 2022, 34, 102070. [Google Scholar] [CrossRef]
  46. Goda, D.A.; El-Gamal, E.H.; Rashad, M.; Abdel-Fattah, Y.R. The optimization of calcareous soil cation exchange capacity via the feather hydrolysate and N-P fertilizers integration. Sci. Rep. 2025, 15, 4676. [Google Scholar] [CrossRef]
  47. GB/T 22104-2008; Soil Quality—Analysis of Fluoride—Ion Selective Electrometry. General Administration of Quality Supervision, Inspection and Quarantine of the People’s Republic of China: Beijing, China, 2008.
  48. Fierer, N.; Jackson, R.B. Robert.The diversity and biogeography of soil bacterial communities. Proc. Natl. Acad. Sci. USA 2006, 103, 626–631. [Google Scholar] [CrossRef] [PubMed]
  49. Ye, Q.; Wu, Y.; Liu, X.; Wu, J.; Wu, P.; Wu, W. Microplastics abundance associated with farmland use types and the impact on soil microbial communities: A case study in Southern China. J. Hazard. Mater. 2024, 480, 136477. [Google Scholar] [CrossRef] [PubMed]
  50. Janda, J.M.; Abbott, S.L. 16S rRNA Gene Sequencing for Bacterial Identification in the Diagnostic Laboratory: Pluses, Perils, and Pitfalls. J. Clin. Microbiol. 2007, 45, 2761–2764. [Google Scholar] [CrossRef]
  51. Neilan, B.; Op De Beeck, M.; Lievens, B.; Busschaert, P.; Declerck, S.; Vangronsveld, J.; Colpaert, J.V. Comparison and Validation of Some ITS Primer Pairs Useful for Fungal Metabarcoding Studies. PLoS ONE 2014, 9, e97629. [Google Scholar] [CrossRef]
  52. Xiao, X.; Chen, W.; Zong, L.; Yang, J.; Jiao, S.; Lin, Y.; Wang, E.; Wei, G. Two cultivated legume plants reveal the enrichment process of the microbiome in the rhizocompartments. Mol. Ecol. 2017, 26, 1641–1651. [Google Scholar] [CrossRef] [PubMed]
  53. Wu, D.; Zhao, P.; Wang, C.; Huasai, S.; Chen, H.; Chen, A. Differences in the intestinal microbiota and association of host metabolism with hair coat status in cattle. Front. Microbiol. 2024, 15, 1296602. [Google Scholar] [CrossRef] [PubMed]
  54. Wu, D.; Wang, C.; Simujide, H.; Liu, B.; Chen, Z.; Zhao, P.; Huangfu, M.; Liu, J.; Gao, X.; Wu, Y.; et al. Reproductive Hormones Mediate Intestinal Microbiota Shifts during Estrus Synchronization in Grazing Simmental Cows. Animals 2022, 12, 1751. [Google Scholar] [CrossRef] [PubMed]
  55. Zhao, Y.; Zhang, N.; Chen, J.; Ran, W.; Zhao, Z.; Song, Y. Interpretation of bacterial composition patterns and community assembly processes in the rhizosphere soil of tea trees in karst areas. BMC Microbiol. 2024, 24, 492. [Google Scholar] [CrossRef] [PubMed]
  56. Niu, J.; Yang, K.; Tang, Z.; Wang, Y. Relationships between Soil Crust Development and Soil Properties in the Desert Region of North China. Sustainability 2017, 9, 725. [Google Scholar] [CrossRef]
  57. Zheng, X.; Wu, Y.; Xu, A.; Lin, C.; Wang, H.; Yu, J.; Ding, H.; Zhang, Y. Response of Soil Microbial Communities and Functions to Long-Term Tea (Camellia sinensis L.) Planting in a Subtropical Region. Forests 2023, 14, 1288. [Google Scholar] [CrossRef]
  58. Lv, X.; Kong, H.; Luo, Y.; Dong, D.; Liu, W.; Wu, D.; Ye, Z.; Ma, J.; Liu, D. The Impact of Magnesium on the Growth, Physiology and Quality of Tea (Camellia sinensis L.) Plants under Acid Stress. Agronomy 2024, 14, 767. [Google Scholar] [CrossRef]
  59. Li, J.; Wu, B.; Zhang, D.; Cheng, X. Elevational variation in soil phosphorus pools and controlling factors in alpine areas of Southwest China. Geoderma 2023, 431, 116361. [Google Scholar] [CrossRef]
  60. Dessalegn, D.; Beyene, S.; Ram, N.; Walley, F.; Gala, T.S. Effects of topography and land use on soil characteristics along the toposequence of Ele watershed in southern Ethiopia. Catena 2014, 115, 47–54. [Google Scholar] [CrossRef]
  61. Miheretu, B.A.; Yimer, A.A. Spatial variability of selected soil properties in relation to land use and slope position in Gelana sub-watershed, Northern highlands of Ethiopia. Phys. Geogr. 2017, 39, 230–245. [Google Scholar] [CrossRef]
  62. Moges, A.; Holden, N.M. Soil Fertility in Relation to Slope Position and Agricultural Land Use: A Case Study of Umbulo Catchment in Southern Ethiopia. Environ. Manag. 2008, 42, 753–763. [Google Scholar] [CrossRef] [PubMed]
  63. Zheng, Y.; Cao, X.; Zhou, Y.; Li, Z.; Yang, Y.; Zhao, D.; Li, Y.; Xu, Z.; Zhang, C.-S. Effect of planting salt-tolerant legumes on coastal saline soil nutrient availability and microbial communities. J. Environ. Manag. 2023, 345, 118574. [Google Scholar] [CrossRef] [PubMed]
  64. Krause, H.-M.; Mueller, R.C.; Lori, M.; Mayer, J.; Mäder, P.; Hartmann, M. Organic cropping systems alter metabolic potential and carbon, nitrogen and phosphorus cycling capacity of soil microbial communities. Soil Biol. Biochem. 2025, 203, 109737. [Google Scholar] [CrossRef]
  65. Macdonald, C.A.; Clark, I.M.; Zhao, F.-J.; Hirsch, P.R.; Singh, B.K.; McGrath, S.P. Long-term impacts of zinc and copper enriched sewage sludge additions on bacterial, archaeal and fungal communities in arable and grassland soils. Soil Biol. Biochem. 2011, 43, 932–941. [Google Scholar] [CrossRef]
  66. Gou, X.; Kong, W.; Sadowsky, M.J.; Chang, X.; Qiu, L.; Liu, W.; Shao, M.; Wei, X. Global responses of soil bacteria and fungi to inoculation with arbuscular mycorrhizal fungi. Catena 2024, 237, 107817. [Google Scholar] [CrossRef]
  67. Yu, Y.; Pan, J.; Wu, H.; Zhu, J.; Zong, N.; An, H.; Wang, C.; Zuo, X.; Wei, C.; Zhang, F.; et al. Factors controlling the contributions of bacterial and fungal residue carbon to soil organic carbon in grassland ecosystems. Catena 2024, 241, 108006. [Google Scholar] [CrossRef]
  68. Silar, P. Phenotypic instability in fungi. Adv. Appl. Microbiol. 2019, 107, 141–187. [Google Scholar] [PubMed]
  69. Duan, Y.; Lian, J.; Wang, L.; Wang, X.; Luo, Y.; Wang, W.; Wu, F.; Zhao, J.; Ding, Y.; Ma, J.; et al. Variation in Soil Microbial Communities Along an Elevational Gradient in Alpine Meadows of the Qilian Mountains, China. Front. Microbiol. 2021, 12, 684386. [Google Scholar] [CrossRef] [PubMed]
  70. Shi, Y.; Fan, K.; Li, Y.; Yang, T.; He, J.S.; Chu, H. Archaea Enhance the Robustness of Microbial Co-occurrence Networks in Tibetan Plateau Soils. Soil Sci. Soc. Am. J. 2019, 83, 1093–1099. [Google Scholar] [CrossRef]
  71. Bittleston, L.S. Connecting microbial community assembly and function. Curr. Opin. Microbiol. 2024, 80, 102512. [Google Scholar] [CrossRef] [PubMed]
  72. Zhang, R.; Tian, X.; Xiang, Q.; Penttinen, P.; Gu, Y. Response of soil microbial community structure and function to different altitudes in arid valley in Panzhihua, China. BMC Microbiol. 2022, 22, 86. [Google Scholar] [CrossRef] [PubMed]
Figure 1. Map of sampling area. The geographical information of the study area is presented through a three-level spatial scale: the upper sub-figure shows the geographical locations of sampling points within China, accompanied by a Google Earth satellite image with a scale of 1:50,000 (1 cm represents 500 m); the main figures (1–3) below correspond to on-site environmental photos of sampling points A–C, specifically displaying the terrain features of each sampling point.
Agronomy 15 00538 g001
Figure 2. Soil chemical properties. (AL) Indicators of soil chemical properties in different study areas. The asterisks above the bars indicate statistically significant differences at that slope position. The horizontal line above the bar graph is the error line, indicating the standard deviation. TS (the top of the slope), MS (the middle of the slope), and FS (the foot of the slope). * p < 0.05, ** p < 0.002, *** p < 0.001.
Agronomy 15 00538 g002
Figure 3. Stacked diagrams of microbial community composition. (A) Bacterial community composition and abundance differences at the phylum level; bacterial community composition and abundance differences at the family level; and bacterial community composition and abundance differences at the genus level are shown, respectively. (B) The composition and abundance differences of fungal communities at the phylum level; the composition and abundance differences of fungal communities at the family level; and the composition and abundance differences of fungal communities at the genus level are shown sequentially. TS (the top of the slope), MS (the middle of the slope), and FS (the foot of the slope).
Agronomy 15 00538 g003
Figure 4. Microbial diversity analysis. Box plots of the five metrics (Chao 1, faith_pd, Observed_OTUs, Shannon, and Simpson) represent the microbial alpha diversity values for each set. The Chao index reflects the abundance of the microbial community; the Shannon index, Simpson index, and Observed_OTUs reflect the diversity of the microbial community; and the faith_pd index reflects the evenness. (A) Bacterial alpha diversity; (B) Fungal alpha diversity; (C) Bacterial beta diversity (PCA analyses, PCoA analyses based on Bray–Curtis distances, and NMDS analyses are shown in turn); (D) Fungal beta diversity. TS (the top of the slope), MS (the middle of the slope), and FS (the foot of the slope). * p < 0.05.
Agronomy 15 00538 g004
Figure 5. RDA analysis of soil microbial community structure and environmental factors. (A) RDA plots of bacteria versus soil composition; (B) RDA plots of fungi versus soil composition; (C) Weighting of environmental factors in bacterial redundancy analysis; (D) Weighting of environmental factors in fungal redundancy analysis. TS (the top of the slope), MS (the middle of the slope), and FS (the foot of the slope). * p < 0.05.
Agronomy 15 00538 g005
Figure 6. Network analysis and network topology of soil microbial communities. (A) Network structure at the level of bacterial phylum, family, and genus; (B) Network structure at the level of fungal phylum, family, and genus. Node size represents the size of harmony centrality, and the number of nodes is colored according to different classifications; (C) Network topology at the level of bacterial phylum, family, and genus; (D) Network topology at the fungal phylum, family, and genus level. Average degree: the average of the degrees of all nodes in the network; Closeness centrality: a measure of node importance; Harmonic closeness centrality: a measure of node importance that emphasizes a node’s ability to act as a connection point in the network. The horizontal line above the bar graph is the error line, indicating the standard deviation. TS (the top of the slope), MS (the middle of the slope), and FS (the foot of the slope).
Agronomy 15 00538 g006
Figure 7. Microbiological predictive functional analysis. (A) Bar chart of predicted secondary and tertiary pathways of bacterial KEGG. Vertical coordinates are the first- and second-level categories of KEGG metabolic pathways and horizontal coordinates are the number of compounds annotated to the pathway. Colors of the bars indicate different metabolic pathway categories; (B) Top 8 dominant pathways in the tertiary metabolic pathway of bacterial KEGG; (C) Bar diagram of fungal trophic mode prediction. TS (the top of the slope), MS (the middle of the slope), and FS (the foot of the slope).
Agronomy 15 00538 g007
Disclaimer/Publisher’s Note: The statements, opinions and data contained in all publications are solely those of the individual author(s) and contributor(s) and not of MDPI and/or the editor(s). MDPI and/or the editor(s) disclaim responsibility for any injury to people or property resulting from any ideas, methods, instructions or products referred to in the content.

