Article

Projected Bioclimatic Changes in Portugal: Assessing Maize Future Suitability

LEAF—Linking Landscape, Environment, Agriculture and Food Research Center, Associate Laboratory TERRA, Instituto Superior de Agronomia, Universidade de Lisboa, Tapada da Ajuda, 1349-017 Lisboa, Portugal
*
Author to whom correspondence should be addressed.
Agronomy 2025, 15(3), 592; https://doi.org/10.3390/agronomy15030592
Submission received: 1 February 2025 / Revised: 22 February 2025 / Accepted: 25 February 2025 / Published: 27 February 2025
(This article belongs to the Section Water Use and Irrigation)

Abstract

:
In Portugal, maize is a major crop, occupying about 40% of the cereals area. The present study aimed to assess future bioclimatic conditions that could affect maize production in Portugal. For this purpose, a set of indicators was selected including dry spells (DSs) and the aridity index (AI). Two additional indicators were included, one related to the soil water reservoir available for maize (RAW) and the other related to the maize thermal unit (MTU), which were designed to assess the suitability of land for growing different varieties of maize. The analysis focused on historical (1971–2000) and future (2011–2070; 2041–2070; 2071–2100) climate scenarios (RCP4.5 and RCP8.5) using a four-member ensemble of global climate models. The results for the more distant and severe scenario suggest that there will be an overall increasing tendency in the AI, i.e., higher aridity, namely in the southern part of Portugal compared to the north (0.65 vs. 0.45). The soils in the south are characterized by a lower average RAW (<35 mm) than in the north (>50 mm), which leads to a lower irrigation frequency requirement in the north. As a result of the increased MTU, maize production will shift, allowing for varieties with higher thermal requirements and the conversion of areas traditionally used for silage maize to grain maize production areas. Adaptation measures to improve the climate resilience of maize are discussed.

1. Introduction

Maize (Zea mays L.) is one of the world’s most important cereal crops, being cultivated on approximately 200 million hectares [1] and representing 14% of the world’s arable land [2]. Although maize was domesticated more than 9000 years ago in the Americas—southern Mexico and Central America [3,4]—it has rapidly spread throughout the world and is the most widely produced cereal [5]. The European Union is currently the fourth largest producer of maize [6]. In Portugal, maize is the most important food crop [7] and is mainly grown for animal feed. In 2023, maize was grown in Portugal on 75,387 ha, representing 40% of the cereals area [8]. The main grain maize production regions are currently in the central and southern parts of the country [8,9,10], accounting for about 85% of its grain production. In contrast, silage maize is traditionally grown in the cooler regions in the north of the country [11], accounting for about 66% of the country’s silage production [8]. According to the same dataset, in 2023, the grain maize productivity under irrigation ranged from 6.1 to 14.6 t ha−1, while the productivity of silage maize varied between 26 and 55 t ha−1, depending on the Portuguese region [8].
Climate change (CC) is a major concern for agricultural and livestock systems, with agriculture being one of the most affected sectors due to its dependence on the climate [12,13,14]. CC is projected to have an impact on maize production worldwide, and its effects on maize yield have been extensively studied [15,16,17,18]. Studies predict a general decline in the future maize yields in various producing countries such as Spain [19], Ukraine [20], Pakistan [21], and the USA [22]. In Italy, maize yields are projected to decrease uniformly from north to south [15]. However, yields are projected to increase in India [16] and Lithuania [23]. This shift in production suitability patterns requires the development of effective adaptation strategies, including the use of new crop varieties [24,25,26], improved water use [25,27,28] and fertilizer management [24,29], cropping system changes [24,30], and farmer support [13,31], to ensure food security in the face of uncertainty.
Portugal is located on the Iberian Peninsula in southwestern Europe and much of the country has a temperate Mediterranean climate with rainy winters and dry, hot summers. Future projections from the IPCC [32] indicate an increase in air temperature and a decrease in precipitation, especially in spring, with a higher incidence of extreme events. Due to its characteristics, Portugal is considered a hotspot for climate change [33,34,35,36]. This future climate variability may affect crop production [37], with potential implications for farmers and at the global market level [38], requiring adaptation to new crop management strategies.
The projected temperature increases during the maize growing season, particularly heat waves, could be damaging during key growth stages of the crop [39,40,41,42]. Conversely, increases in temperature mean that the crops will develop faster, allowing for double cropping [43,44,45] and providing new opportunities for farmers to improve their incomes [37,46]. In addition, increases in temperature intensify the climatic demand conditions (ETo, reference crop evapotranspiration) and therefore increase the crop irrigation requirements [10,47,48,49,50,51,52,53,54]. The increase in irrigation demand associated with higher climate variability leads to a reduction in precipitation, putting further pressure on water resources and, consequently, on improving irrigation efficiency and water productivity [27,55,56,57,58].
Several studies have pointed out that Portugal is prone to extreme events, such as droughts [59,60,61,62,63] and heat waves, which are predicted to increase in frequency and intensity [64,65]. The latter affects the productivity of maize [19,66,67,68,69], while the former mainly affects the availability of water resources in cropped areas.
In the context of CC, it is crucial to evaluate the suitability of a region for a specific crop. Several bioclimatic indicators derived from climate projections using global climate models (GCMs) have been developed and are commonly used to assess the increasing imbalance in precipitation and rising temperatures. These include the aridity index (AI), dry spells (DSs), dry days (DDs), frost days (FDs), summer days (SDs), and growing degree days (GDDs). Most studies in the literature focus on the analysis of climate change signals [70,71] and may include other indicators to further improve their assessment. Examples of applications of these are the studies developed by Noce et al. [72], Sobh et al. [73], Hamed et al. [74], and Gaitán et al. [75] using GCMs.
From an agronomic point of view, the selection of bioclimatic indicators requires, on the one hand, the adjustment of the threshold temperatures based on the phenology of the crop and, on the other hand, the consideration of critical periods in the crop cycle when it is most susceptible to environmental influences that may affect its yield. In the case of maize, the SDs indicator has to be considered in the sense that a maximum temperature above 36 °C during the flowering period will affect the pollen viability [5,40,76,77] and will reduce the crop yield. The GDD estimate must also take into account a ceiling or upper-temperature threshold, which, for maize, is 32 °C [78,79]. Other indicators such as the surface energy, evaporation indicators, Köeppen–Geiger class [80,81], and wind speed are also proposed by C3S [82], but only a few agronomic applications are available in the literature.
The use of the bioclimatic indicators approach to assess the future suitability of a particular crop has been explored worldwide. For example, there are several studies for vineyards [75,83,84] and olives orchards [85,86,87]. Few studies have assessed the effects of climate change on annual crops, such as wheat, rice, and/or soybean [53,88,89,90,91,92]. For maize, there are many studies available in the literature that use bioclimatic indicators [77,93,94]. Charalampopoulos [95] studied the impact of CC on rainfed maize production in the Balkan region, and reported a clear ability to extend maize production to northern areas.
In Portugal, most studies focus on orchards [84,96,97,98,99,100,101] as they are more resilient to climate variability and have increased importance in the country in recent years. Most of these studies report that the northern regions will be more suitable for agriculture than the southern regions [71,100,101,102]. Studies on annual crops mainly cover a few crops and generally focus on specific regions [103]. Despite the available studies, a better understanding of the impact of climate change on mainland Portugal is needed, especially on the suitability of various regions for maize production. This information can improve the support and awareness of farmers and other stakeholders by increasing knowledge to support the implementation of adaptation measures [31,104] and minimize risks and uncertainties [105].
The main research goal of the current study is to investigate the knowledge gap regarding the suitability of maize production in a Mediterranean-type climate in order to support the decision-making of farmers and other stakeholders. The specific objectives include: (1) the selection of a set of bioclimatic indicators that can characterize the suitability of maize and assess the changes in climatic conditions that could hinder maize production; (2) the provision of very high-resolution maps (~1 km) of these indicators for the current conditions and future scenarios.

2. Materials and Methods

Figure 1 shows the flowchart of the methodological approach used in the current study. It was focused on determining the spatial distribution of bioclimatic conditions for maize crop growth, using a set of six indicators. These indicators are the following, addressing maize crop specificities: average temperature (AT), mean precipitation (MP), dry spells (DSs), aridity index (AI), maize thermal units (MTUs), and an indicator related to the soil properties and the soil water available to the crop called readily available water (RAW) [71,106]. RAW represents the soil water that is available to maize without the crop suffering from water stress. These complementary indices reflect the main climatic factors that commonly affect maize growth and development.
Three databases were used to obtain the required data: (i) Statistics Portugal [8] for detailed information on maize production areas in Portuguese regions at the NUTS II; (ii) the INFOSOLO georeferenced database [107], which includes soil water-holding characteristics based on observations, allowing the estimation of RAW; and (iii) the BIOCLI-MATE_1km_CMIP5 (version 1.0, r1i1p1 ensemble member), available from the Copernicus Climate Change Service [82], which is a climate change dataset for the period from 1950 to 2100 that has a spatial resolution of 1 km × 1 km. Further information is provided in the following sections.

2.1. Maize Cropping at NUTS II Regions

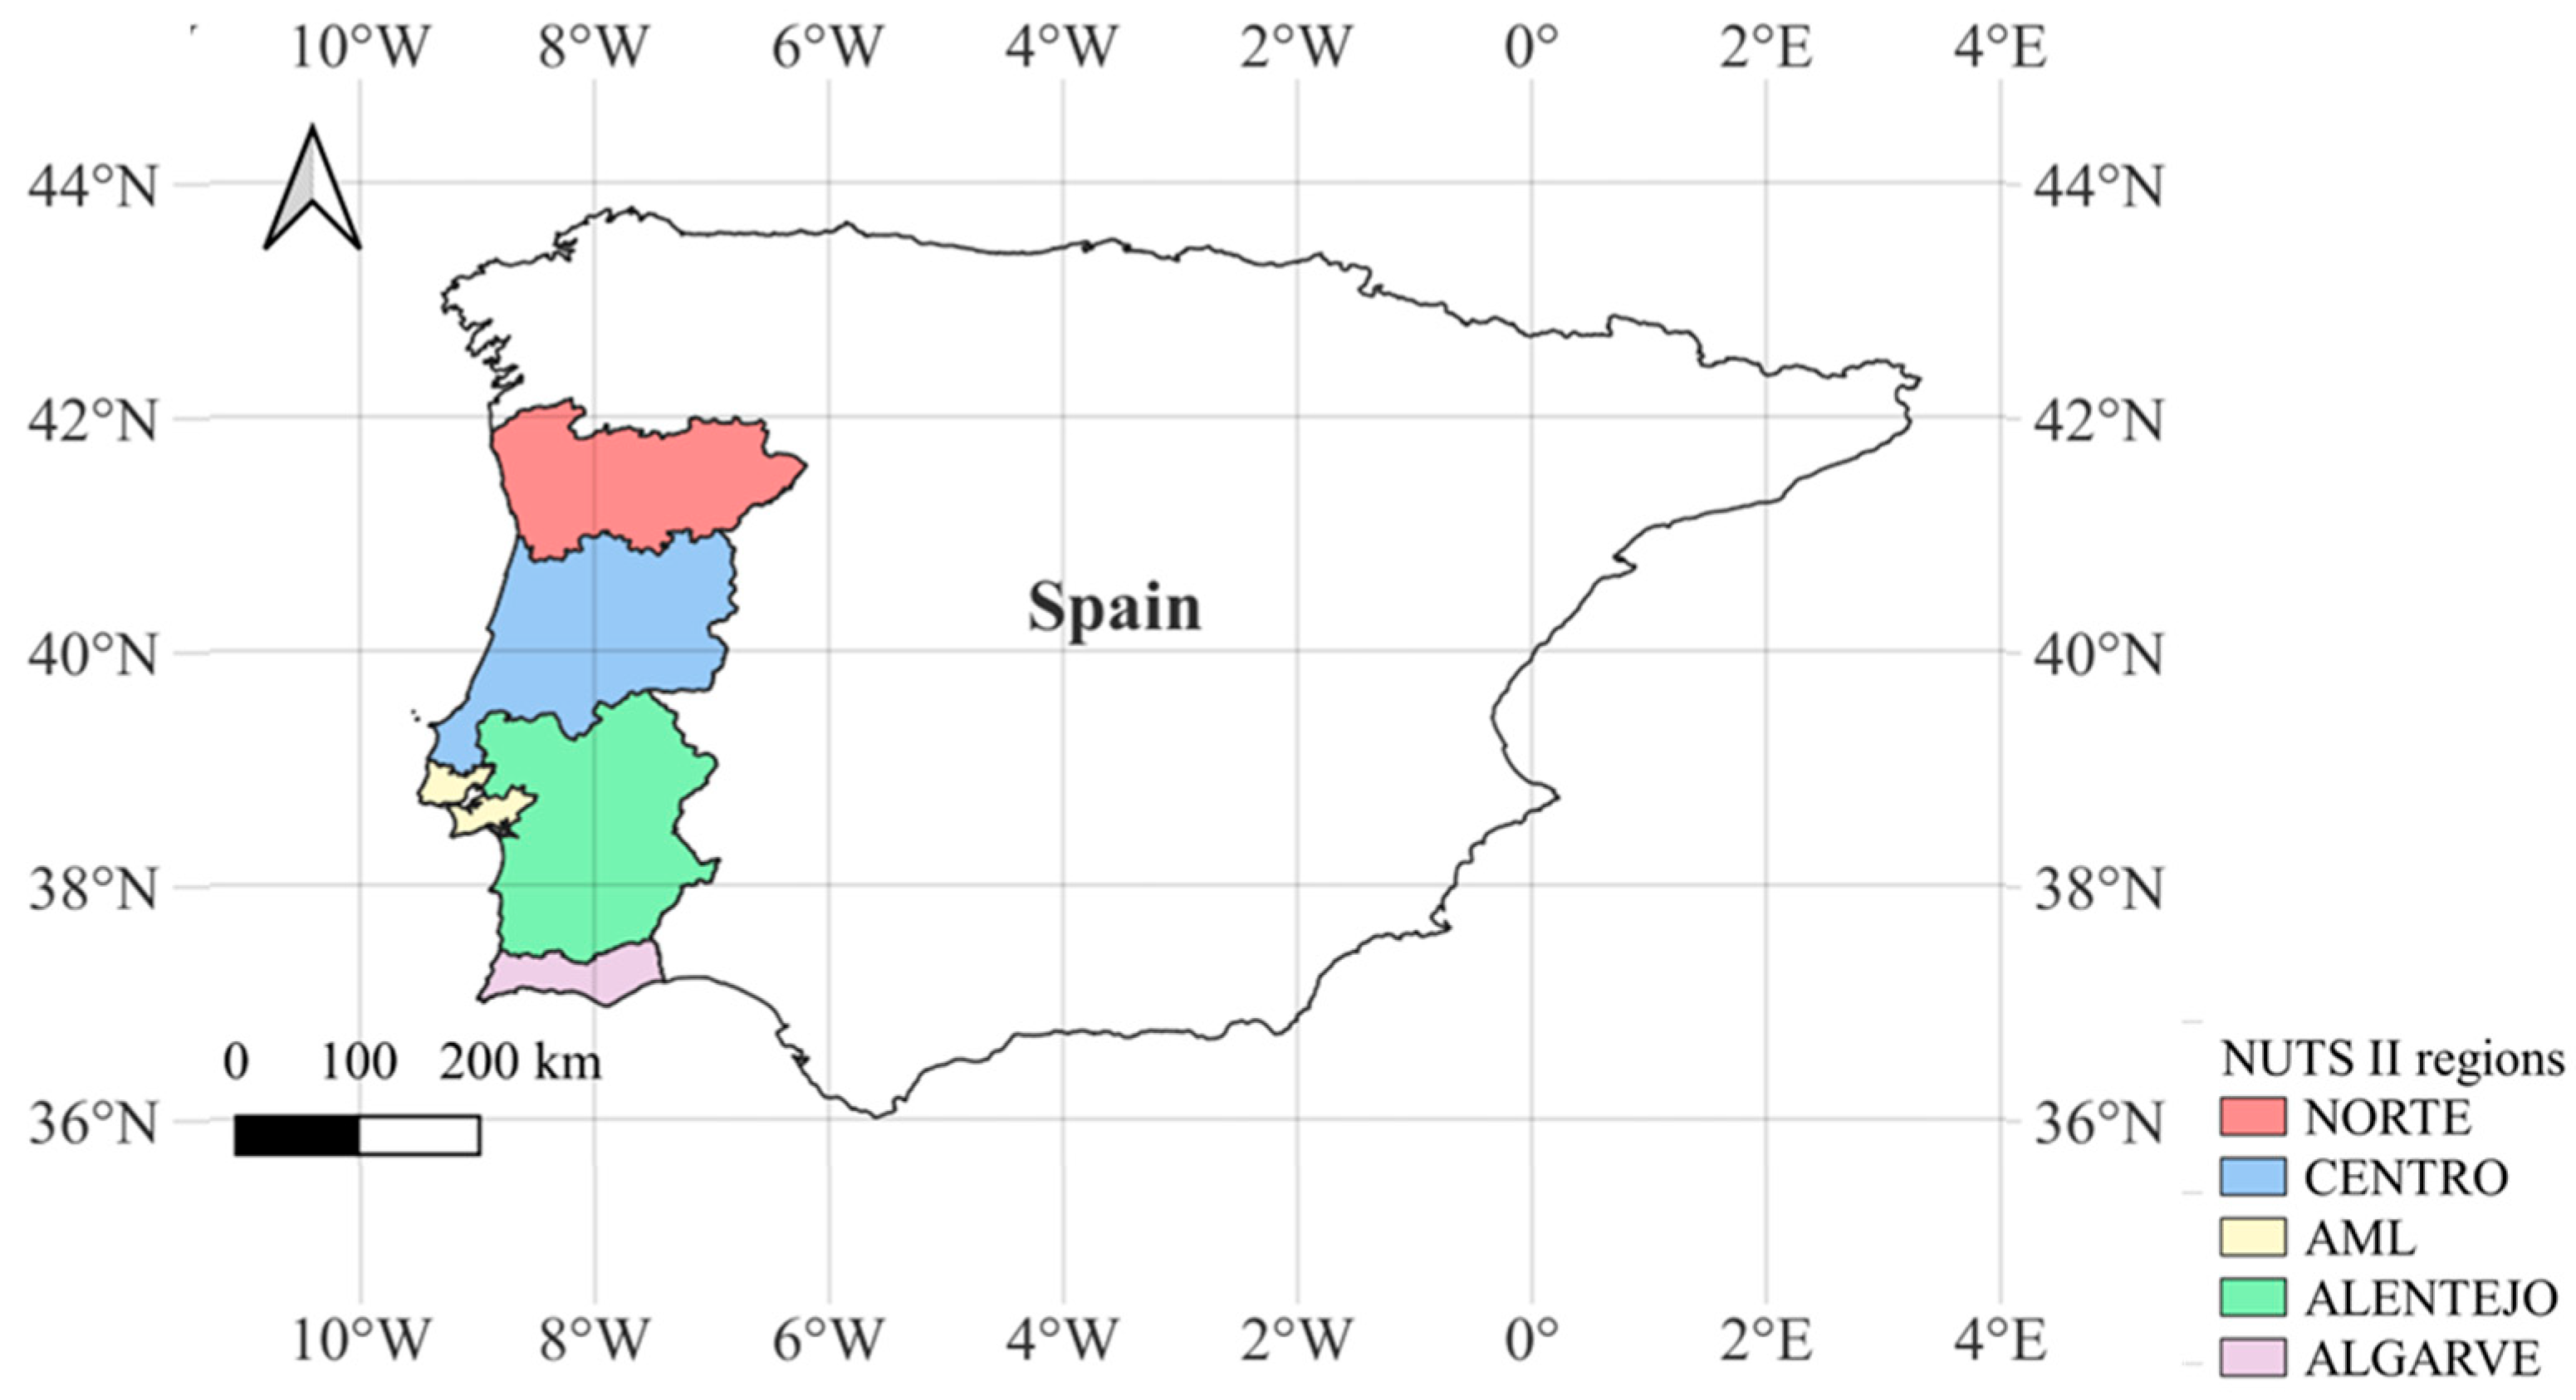
The analysis of the future sustainability of maize in Portugal was carried out at the level of the NUTS II regions of Portugal—Norte, Centro, Área Metropolitana de Lisboa (AML), Alentejo and Algarve (Figure 2). Data on agricultural area, maize cropping area, and maize production in each of these regions were obtained from the Estatísticas Agrícolas for the period 2011–2022 [8]. In previous years, data on maize silage and maize grain were reported as a single value in the national statistics, rather than being presented separately. Productivity (t ha−1) has been calculated as the ratio between the production and the area in order to compare the different regions.
According to the Köppen–Geiger climate classification [108], continental Portugal has two primary climate types, both characteristic of a subhumid Mediterranean-type climate. These are, respectively, a warm temperate climate with dry, hot summers (Csa) or with dry, warm summers (Csb). In both cases, most of the precipitation occurs between October and April, although there is considerable interannual variability.
Analyzing the period of 2011–2022, the Norte and Centro regions received an average annual precipitation of 1017 mm (±247 mm) and 897 mm (±233 mm), respectively. The Norte region recorded the lowest mean temperature of 14.7 °C (±0.4 °C), while the Centro region was slightly warmer at 15.1 °C (±0.4 °C). In contrast, the other regions have a Csa climate. The AML region recorded, for the same period, an average temperature of 17.6 °C (±0.9 °C), while its annual precipitation decreased to 618 mm (±182 mm). The Alentejo region had a similar average temperature of 17.0 °C (±0.5 °C), but slightly lower precipitation of 615 mm (±150 mm). The Algarve region was the warmest, with an average temperature of 18.6 °C (±0.4 °C), but received the least precipitation, with an average of 406 mm (±121 mm).

2.2. Bioclimatic Indicators

The “BIOCLIMATE_1km_CMIP5” dataset [82], which provides data from 1950 to 2100, was produced by the Copernicus Climate Change Service using the following methodology: (i) input data selection (considering CMIP5 data (C3S, 2018), using two representative concentration pathways—RCP4.5 and 8.5); (ii) bias correction (considering ERA5 as the baseline [109] and the Delta Quantile Mapping (DQM) approach to calibrate the future climate variables); (iii) indicator calculation (monthly, annual, and 20-year window statistics); (iv) downscaling (the bioclimatic indicators were downscaled from the native coarse resolution of the climate products to ~1 km); and (v) indicator delta change correction (applied to the high-resolution indicators to minimize the differences between the two datasets preserved by the DQM correction). Validation procedures were considered for CMPI5 and ERA5 data, as well as for bioclimatic indicators [82].
Models were selected based on the GCMs available on C3S [60] that were simultaneously accessible for all selected downscaled bioclimatic indicators (i.e., mean temperature, mean precipitation, aridity index, and dry spells). Thus, four GCMs were selected (Table 1) to create an ensemble in order to reduce single-model uncertainties [98,100,101].
Two future anthropogenic radiative forcing scenarios were considered in this study—RCP4.5 and RCP8.5. RCP4.5 corresponds to a medium-emissions pathway with an increase in radiative forcing of about 4.5 W m−2. RCP8.5 is a high-emissions path with an increase in the radiative forcing of about 8.5 W m−2. These two climate scenarios are widely used in CC impact assessment studies, as they reflect moderate and pessimistic trends in greenhouse gas emissions.
From the indicators available in the “BIOCLIMATE_1km_CMIP5” dataset, those that could affect maize yield and water requirements were selected. Four out of the six bioclimatic indicators used in the current study were selected and downloaded from BIOCLIMATE_1km_CMIP5 (Table 2), while the remaining two, maize thermal unit (MTU) and readily available water (RAW), were calculated from the mean temperature and the soil properties data, respectively.
After selecting the indicators and the period—baseline (1971–2000), near-term future (2011–2040), medium term future (2041–2070), and long-term future (2071–2100)—in the BIOCLIMATE_1km_CMIP5 database, data from four GCMs were downloaded. The climate dataset for Portugal’s mainland was then extracted using a Python tool (v.3.10.0). The GCM data were merged, and the median value was calculated [71] and applied to each region. Finally, all the indicators were integrated into a georeferenced database using QGIS software (v.3.38.5), which allows the screening of raster data and the production of the maps presented in the Results section.
a.
The aridity index (AI) is calculated as [110,111]:
A I m o n t h = min 1 , max 0 , 1 P m o n t h P E T m o n t h
where P is the monthly precipitation (mm), and PET is the potential evaporation (mm).
AI values range between 0 and 1, with values close to 0 indicating a humid climate and those close to 1 indicating an arid environment [110]. The AI is associated with specific thresholds: an AI of around 0.54 marks the onset of declining vegetation productivity and photosynthetic activity; an AI of around 0.7 indicates the onset of soil disturbance; and an AI approaching 0.8 indicates a severe reduction in plant cover, ultimately leading to ecosystem collapse [111].
b.
The mean length of dry spells with a minimum of 5 days (DS) can be calculated as Equation (2):
D S y e a r m e a n = i = 1 # d a y s _ i n _ y e a r C D D 5 i D S y e a r s u m
CDD5i is the cumulative sum of dry days for dry spells lasting at least 5 days, and DSyearsum corresponds to the cumulative number of dry spells lasting at least 5 days a year.
c.
The maize thermal unit (MTU) represents the cumulative sum of the average temperatures above the base temperature threshold (Tbase), which is the lower temperature limit above which crop development begins. The estimate was also constrained by considering an upper-temperature limit (Tupper), above which the development is assumed to cease [112,113]. MTU values were computed as:
M T U = 0 ,     T a v g 10     T a v g T b a s e ,       10 < T a v g < 32 32 10 ,       T a v g 32
where Tavg is the average monthly temperature.
The MTU has been calculated for the period from April to October, as this corresponds to the main maize-growing season throughout the country.
d.
The readily available water (RAW) in the soil is estimated as
R A W = T A W p
where TAW is the total available soil water (mm) and p is the soil water depletion fraction for no stress (dimensionless), which is 0.50 for maize [111].
TAW is the difference between the soil moisture at field capacity (θFC, m3 m−3) and that at the wilting point (θWP, m3 m−3) relative to the maximum rooting depth (Zr, m). In this study, some simplifications were performed relative to the Zr value. Thus, for soils with a depth of less than 1 m, the actual soil depth was taken into account, while, for soil depths greater than 1 m, Zr was taken as 1 m.

2.3. Data Trends Analysis

In order to accurately interpret the results from Statistics Portugal—area, production, and productivity, the Kendall library of the R Studio software (v.2024.04.2+764) was used to analyze possible trends in the data. The trend analysis [114] is based on the null hypothesis H0 (assuming no significant trend) and the alternative hypothesis H1 (assuming a significant trend) at a significance level of α = 0.05.

2.4. Coruche Region as a Case Study

Coruche is an important maize-producing region in Portugal, accounting for about 6% of the national maize area in 2023 [8]. In recent years, maize productivity in this region has increased to approximately 16 t ha⁻¹, according to the National Maize Farmers Association (ANPROMIS, pers. comm.), mainly due to the adoption of new technologies. In this context, stakeholders have become increasingly aware of and responsive to climate change information to support their decision-making. Therefore, Coruche was selected as a case study, and the results were further analyzed.

3. Results and Discussion

3.1. Maize Production Characterization

As already mentioned, maize is grown throughout the country, with a higher prevalence in the Norte and Centro regions (Figure 3a), which account for 8% and 12% of the country’s agricultural area, respectively. Figure 3 shows a general trend of decreasing grain maize production between 2011 and 2022 (Table 3), especially in the main production areas. A similar pattern is observed for the silage maize production areas (Figure 3c).
In terms of production (Figure 3b), the decline is most marked in the AML and Algarve regions. In the Centro region, however, the total grain maize production has remained stable over the period considered. Conversely, silage maize production shows a decreasing trend in all regions (Figure 3c, Table 3). These results are consistent with those reported by Revilla et al. [7] for the period between 1998 and 2018.
Regarding the changes in the area of maize production, the Norte, Centro, AML, and Algarve regions show statistically significant negative trends (p-value < 0.05), which means that the area of maize production is decreasing. In the Alentejo region, there is a negative trend, but it is not statistically significant (p-value = 0.09). In terms of the trends in maize production, the AML region is the only region to show a statistically significant decrease (p-value = 0.01), confirming a steady reduction in production over time. The other regions also show decreasing trends. However, their p-values are above 0.05, indicating that these declines are not statistically significant at the 95% confidence level.
During the study period (2011–2022), the grain maize productivity varied between regions. The Norte region recorded 3.8 t ha⁻¹, while the Centro region reached 8.3 t ha⁻¹. The AML had a higher value of 12.4 t ha⁻¹, with the Alentejo region exceeding this with 12.9 t ha⁻¹ and the Algarve reaching 9.3 t ha⁻¹. For silage maize, the Norte region achieved a productivity of 47.1 t ha⁻¹, while the Centro region had a lower value of 27.6 t ha⁻¹. The highest productivity was observed in the AML with 56.4 t ha⁻¹, followed by the Alentejo with 53.4 t ha⁻¹ and the Algarve region with 41.5 t ha⁻¹.
From a statistical point of view, the maize productivity showed a positive trend in all regions except AML (Table 3). However, only the Centro region showed a statistically significant trend (p < 0.05), confirming that productivity improvements in this location are due to advances in agricultural practices, such as fertilization and phytosanitary treatments, as well as technological advances, including the introduction of new crop varieties [115] and the adoption of precision agriculture [116].

3.2. Climatic Projection

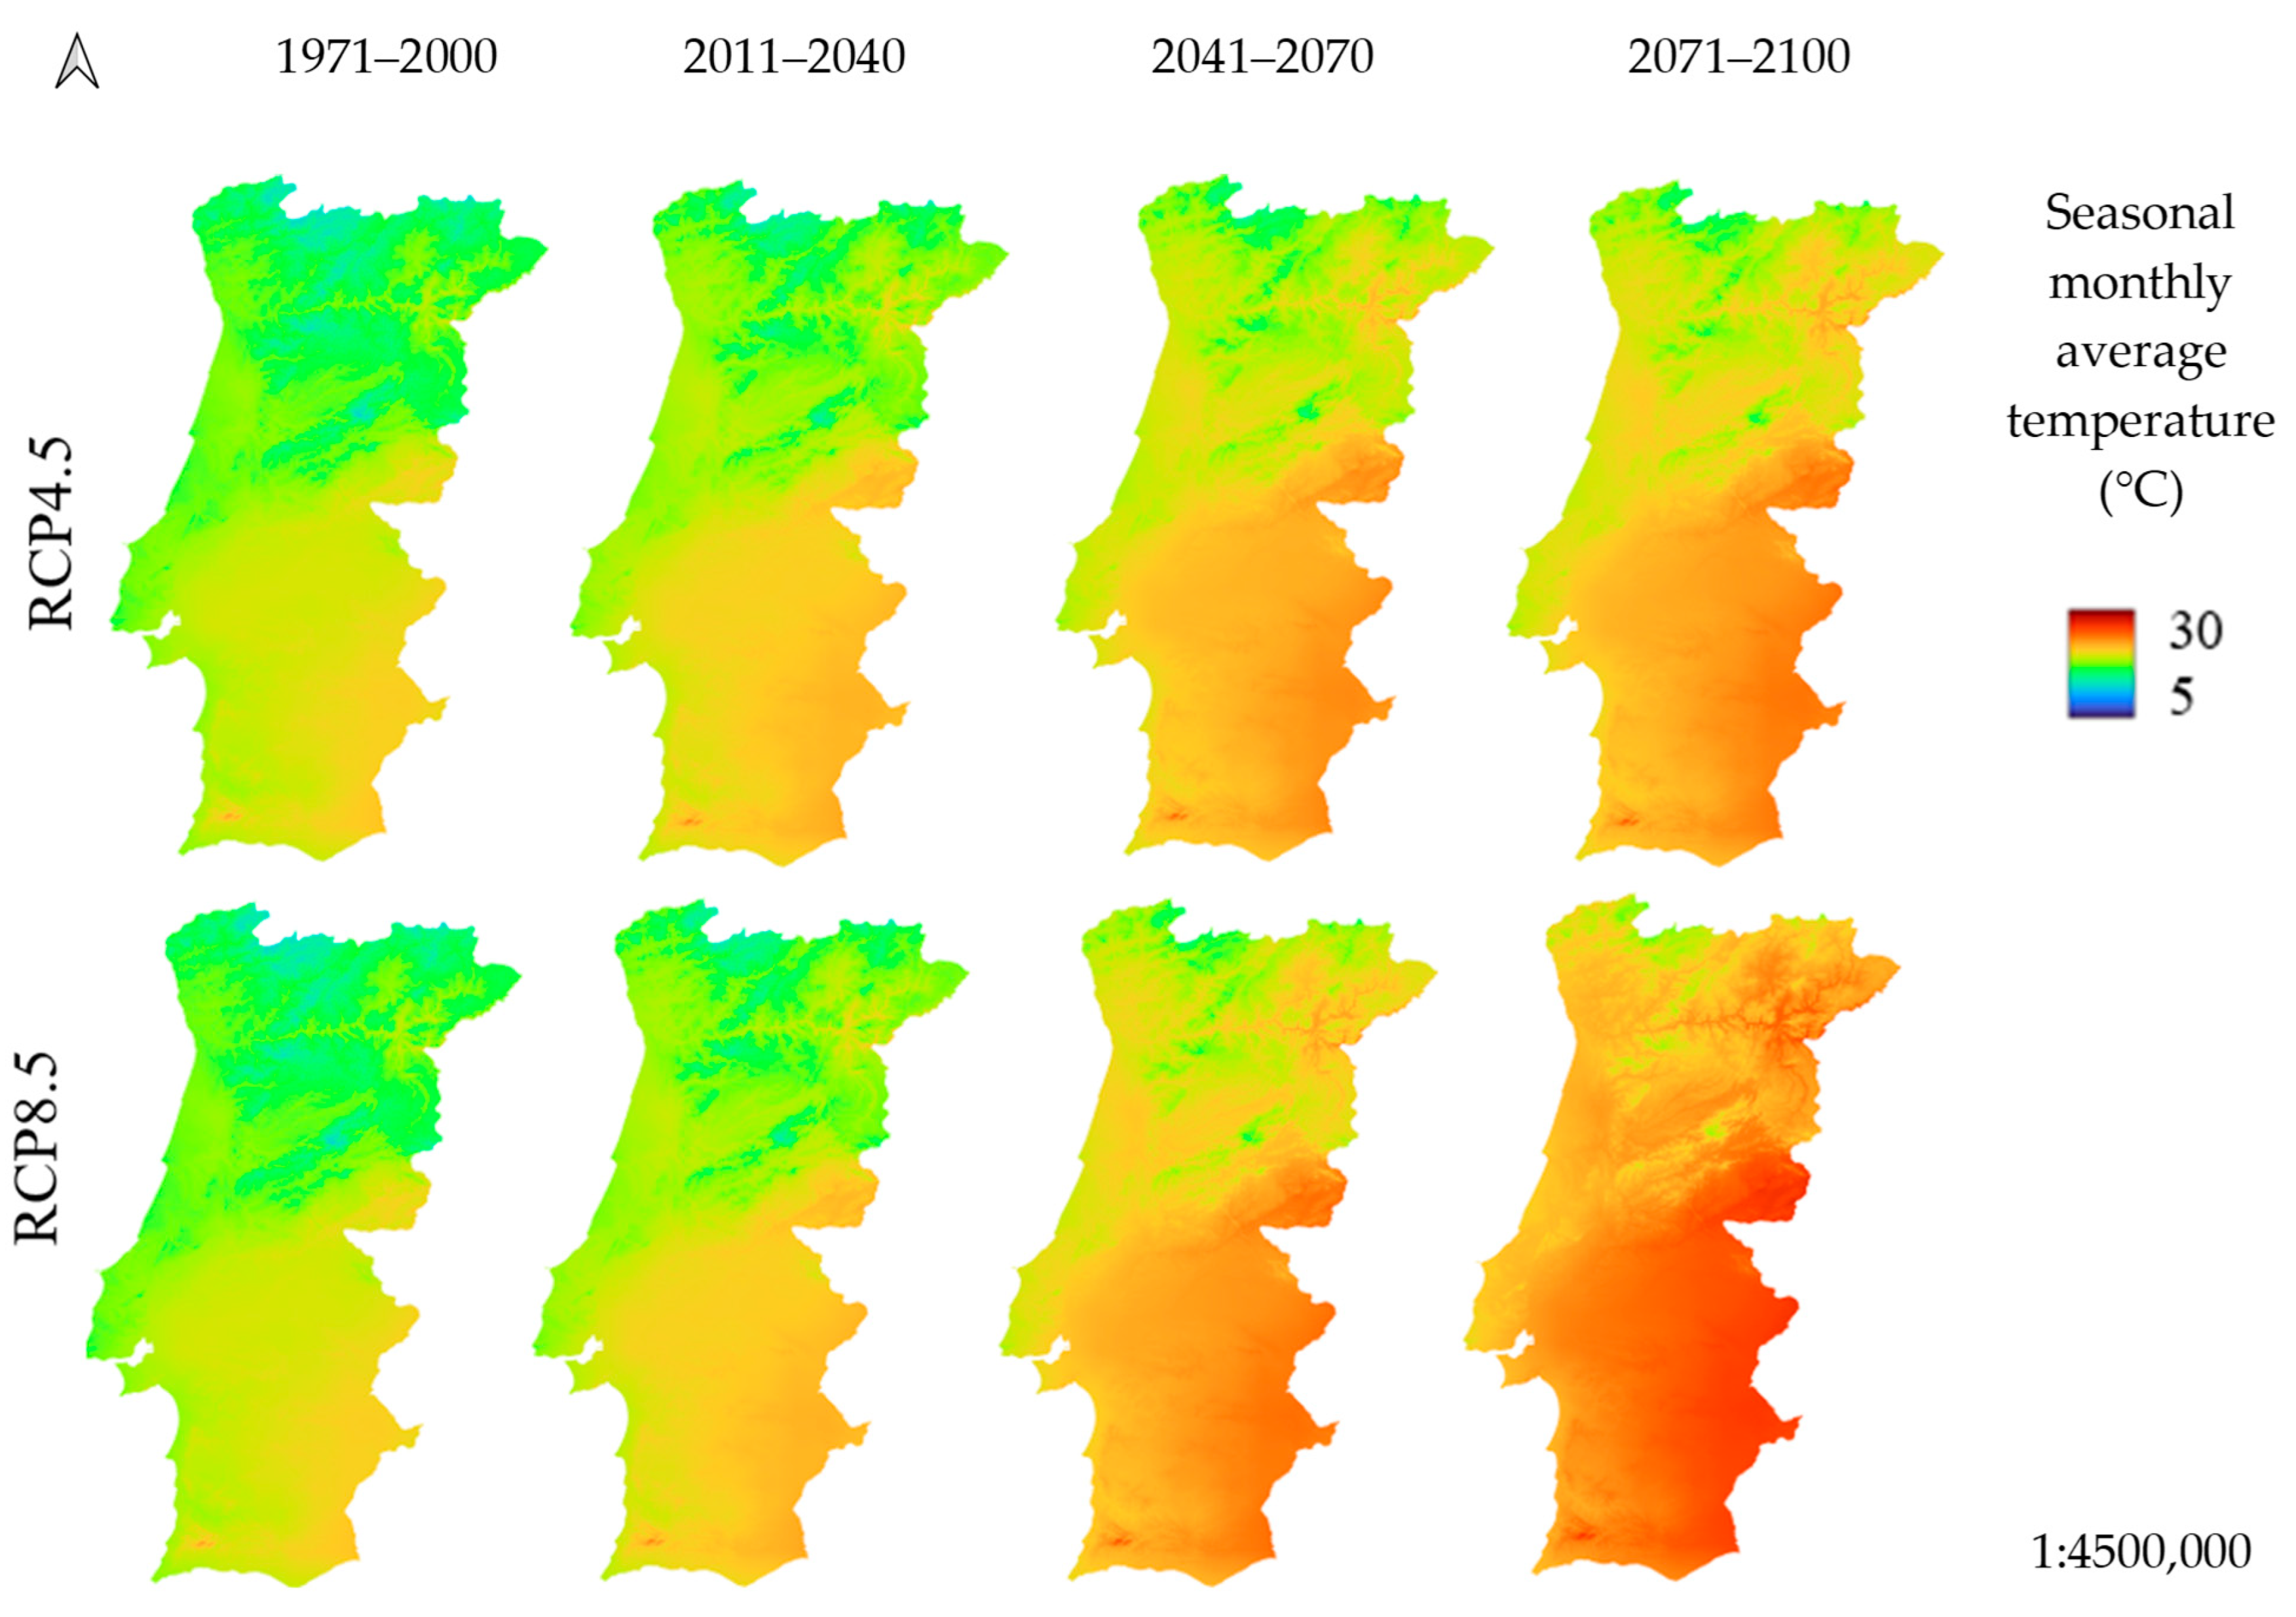
This subsection presents the climatic characterization of Portugal based on data from the Copernicus Climate Change Service for Portugal, including the seasonal mean monthly temperature and seasonal accumulated precipitation, derived from monthly means. Figure 4 shows the results for the AT indicator during the maize growing season for different periods and climate scenarios. As expected, the baseline period (1971–2000) shows lower AT values, especially in the northern regions and higher altitudes, with averages of 16 °C in the Norte region, 18 °C in the Centro and AML regions, and 20 °C in the southern regions. Under the RCP4.5 scenario, a gradual increase in temperature is observed over time. During the period of 2011–2040, most regions have average temperatures ranging between 17 °C (Norte) and 21 °C (Algarve and Alentejo). Towards the middle of the century (2041–2070), the average temperatures continue to increase, ranging from 19 °C (in the Norte) to 22 °C (in the Alentejo and Algarve regions). By the end of the century, most of the country is projected to have average temperatures above 20 °C, with the southern regions (Alentejo and Algarve) reaching around 23 °C. In contrast, under the more pessimistic scenario (RCP8.5), all regions exceed 19 °C by the middle of the century (2041–2070), with averages ranging from 19 °C (Norte) to 23 °C (Alentejo and Algarve). By the end of the century (2071–2100), almost the entire country is projected to reach or exceed 22 °C, with the Alentejo and Algarve regions experiencing the highest temperatures of 25 °C and 24 °C, respectively. The largest increases are observed in the southern regions, indicating a clear warming trend, which has also been reported for Spain [117] and the Iberian Peninsula as a whole [118]. The Centro region shows the highest variance, for both RCPs and periods, implying that the AT in this region shows greater fluctuations over time.
The results confirm a consistent temperature increase across the country, particularly in the pessimistic scenario. Comparing the period of 2071–2100 with the baseline, under RCP4.5, the AT is projected to increase from +2.2 to +3.0 °C in the AML and Centro regions, respectively. However, under RCP8.5, the temperature increases range from +3.8 to +5.1 °C in the AML and Norte/Centro regions, respectively. These results are consistent with previous studies, such as those by Pires et al. [119] and Branquinho et al. [51], which report an increase of approximately +4.3 °C for the whole country and +3.8 °C for Beja (Alentejo region) under the RCP8.5. The anomaly values obtained for both climate scenarios are also in line with the IPCC projections [32], which estimate a warming limit of 3 °C under RCP4.5 and an exceedance of 4 °C under RCP8.5.
Rising temperatures are expected to shorten crop cycles and reduce productivity due to increased metabolic activity [5,10,66,120,121], with the Centro region being among the most affected regions. However, a shorter crop growing cycle may also allow for multiple cropping [43,44,45], allowing farmers to take advantage of an extended growing season with favorable temperatures, potentially improving their economic returns [122].
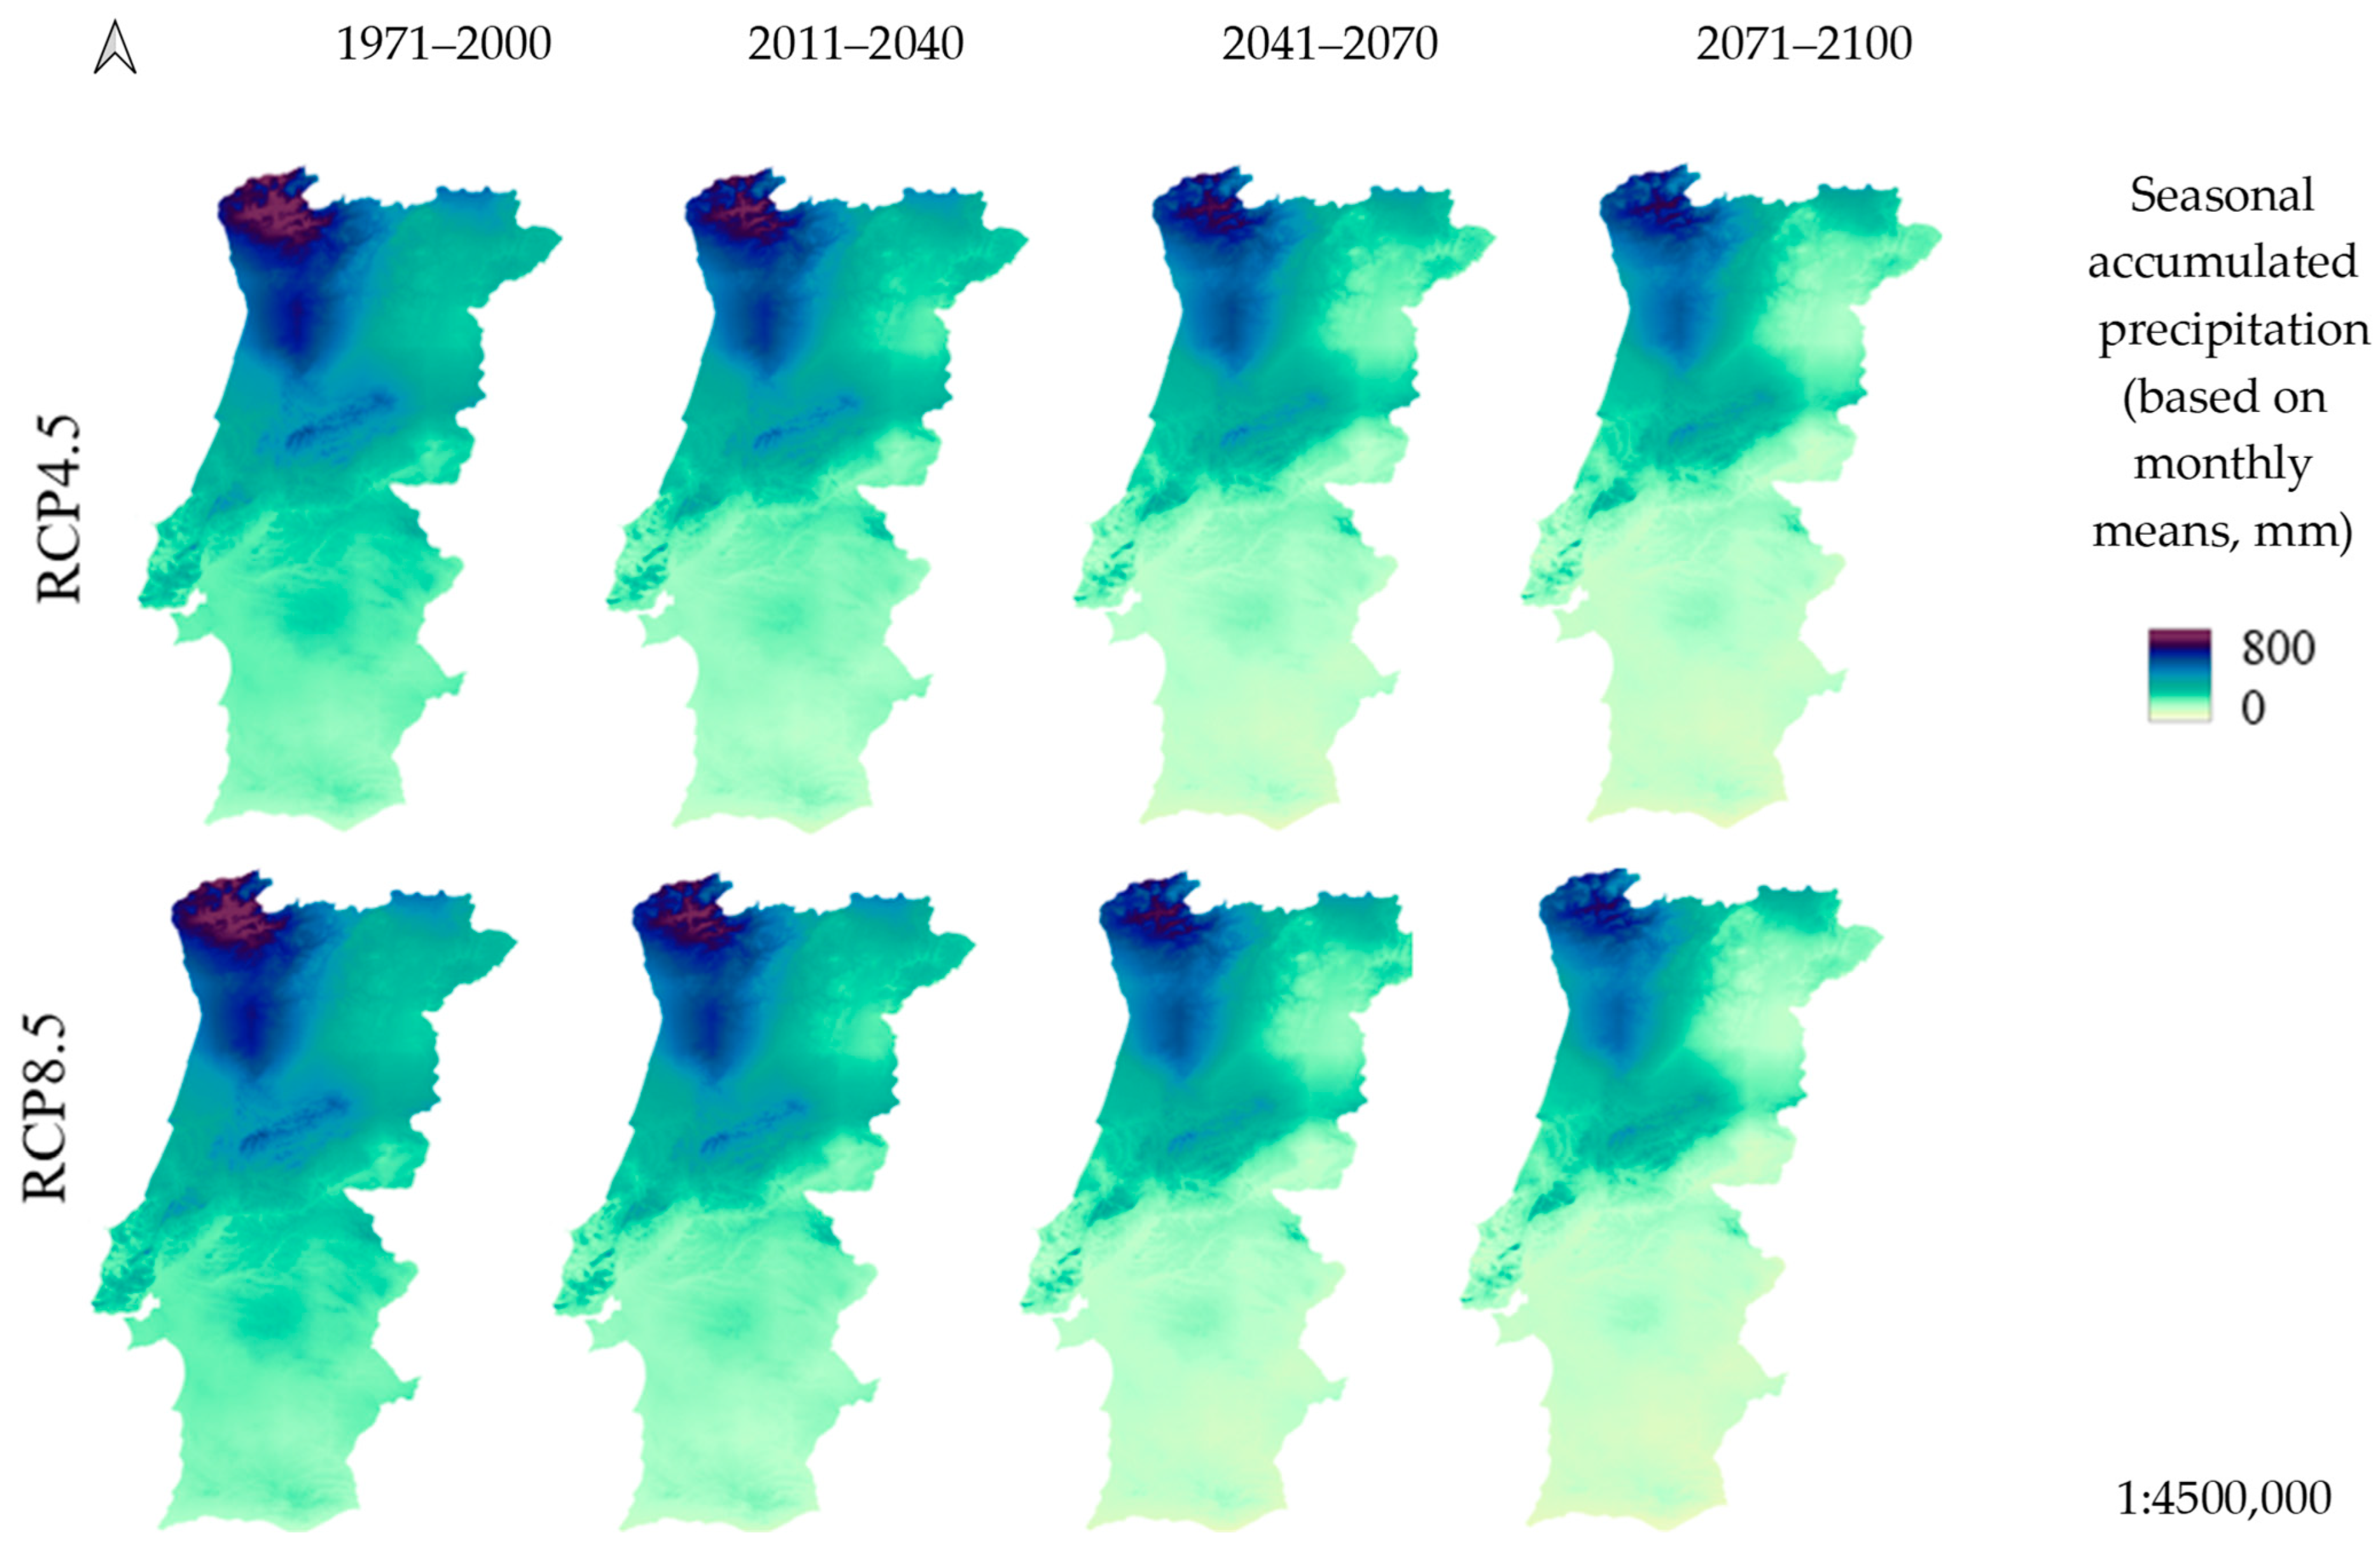
Figure 5 shows the accumulated precipitation (MP) during the maize growing season (from April to October) for different periods and climate scenarios. During 1971–2000, the highest average precipitation was observed in the Norte region, reaching 460 ± 145 mm, followed by the Centro (341 ± 83 mm), AML (217 ± 30 mm), Alentejo (206 ± 27 mm), and Algarve (160 ± 18 mm) regions. In terms of climate, the Norte region is heterogeneous, with the highest variance, indicating a greater dispersion of rainfall patterns.
In the moderate climate scenario, the precipitation gradually decreases over time. In the near-term future period (2011–2040), a significant decrease is observed, with mean values ranging from 135 ± 18 mm (−25 mm) in the Algarve region to 420 ± 144 mm (−40 mm) in the Norte region. This downward trend becomes even more pronounced for the mid-century period (2041–2070), with precipitation levels ranging from 110 ± 17 mm (−50 mm) in the Algarve region to 380 ± 145 mm (−80 mm) in the Norte region. By the end of the century, precipitation is projected to decrease further, reaching 100 ± 18 mm in the Algarve region and 350 ± 143 mm in the Norte region, which represents a decrease of −38% and −24%, respectively. During this period, the Centro and Alentejo regions are expected to receive 237 ± 78 (−104 mm) and 128 ± 20 mm (−78 mm), respectively.
In the RCP8.5 scenario, the decrease in precipitation is even more pronounced. In the near-term future (2011–2040), precipitation levels are projected to range from 140 ± 18 mm in the Algarve region to 420 ± 143 mm in the Norte region, a decrease of 20 mm and 40 mm, respectively, compared to the baseline. By the middle of the century (2041–2070), precipitation during the maize growing season is projected to decrease further, ranging from 110 ± 17 mm in the Algarve region to 370 ± 145 mm in the Norte region. At the end of the century (2071–2100), these reductions will be even more pronounced, with values falling to 90 ± 17 mm (−70 mm) in the Algarve region and 330 ± 144 mm (−130 mm) in the Norte region. During this period, the Centro and Alentejo regions are projected to receive 225 ± 78 mm (−116 mm) and 118 ± 20 mm (−88 mm), respectively.
These projections highlight a clear trend towards increasingly drier conditions, particularly under the RCP8.5 scenario in the long-term period, with the southern regions experiencing the largest reductions in precipitation of about −44%.
The results for the maize growing season (April–October) show a significant reduction in MP compared to the baseline in all regions and climate scenarios, with rainfed maize being particularly affected. By the end of the century, under the RCP4.5 scenario, the percentage reduction is expected to range from −38% in the AML region to −24% in the Norte region. Under the most pessimistic scenario (RCP8.5), the reductions are projected to range from −44% in the Algarve region to −27% in the Norte region.
The reductions observed in the projections presented in this study are higher than those in other studies [50,51,119] for mainland Portugal, as well as for the Iberian Peninsula [118]. This discrepancy is probably due to the baseline data used (ERA5) and the uncertainties associated with CMIP5 [82]. Although the ERA5 database has good agreement with ground truth data [82,123,124], it should be bias-corrected [125], as suggested in previous studies [126,127,128,129], to ensure results that are as close to reality as possible.
Regardless of the correction methods used, the reduction in precipitation, coupled with an increase in the frequency and intensity of extreme events, across the country is a well-proven fact. Reduced precipitation affects water availability, particularly for irrigation [130], and can contribute to increased soil salinity, which affects the ability of plants to extract water, ultimately reducing plant growth and crop yields. In more severe cases, this can lead to crop failure [131]. These findings highlight the need to implement water-saving strategies to mitigate the impacts of climate change on agricultural systems.

3.3. Pedoclimatic Zoning

Two dryness indicators—dry spells (DSs) and the aridity index (AI)—were used together with the MTU and RAW to assess future optimal conditions for maize growth.
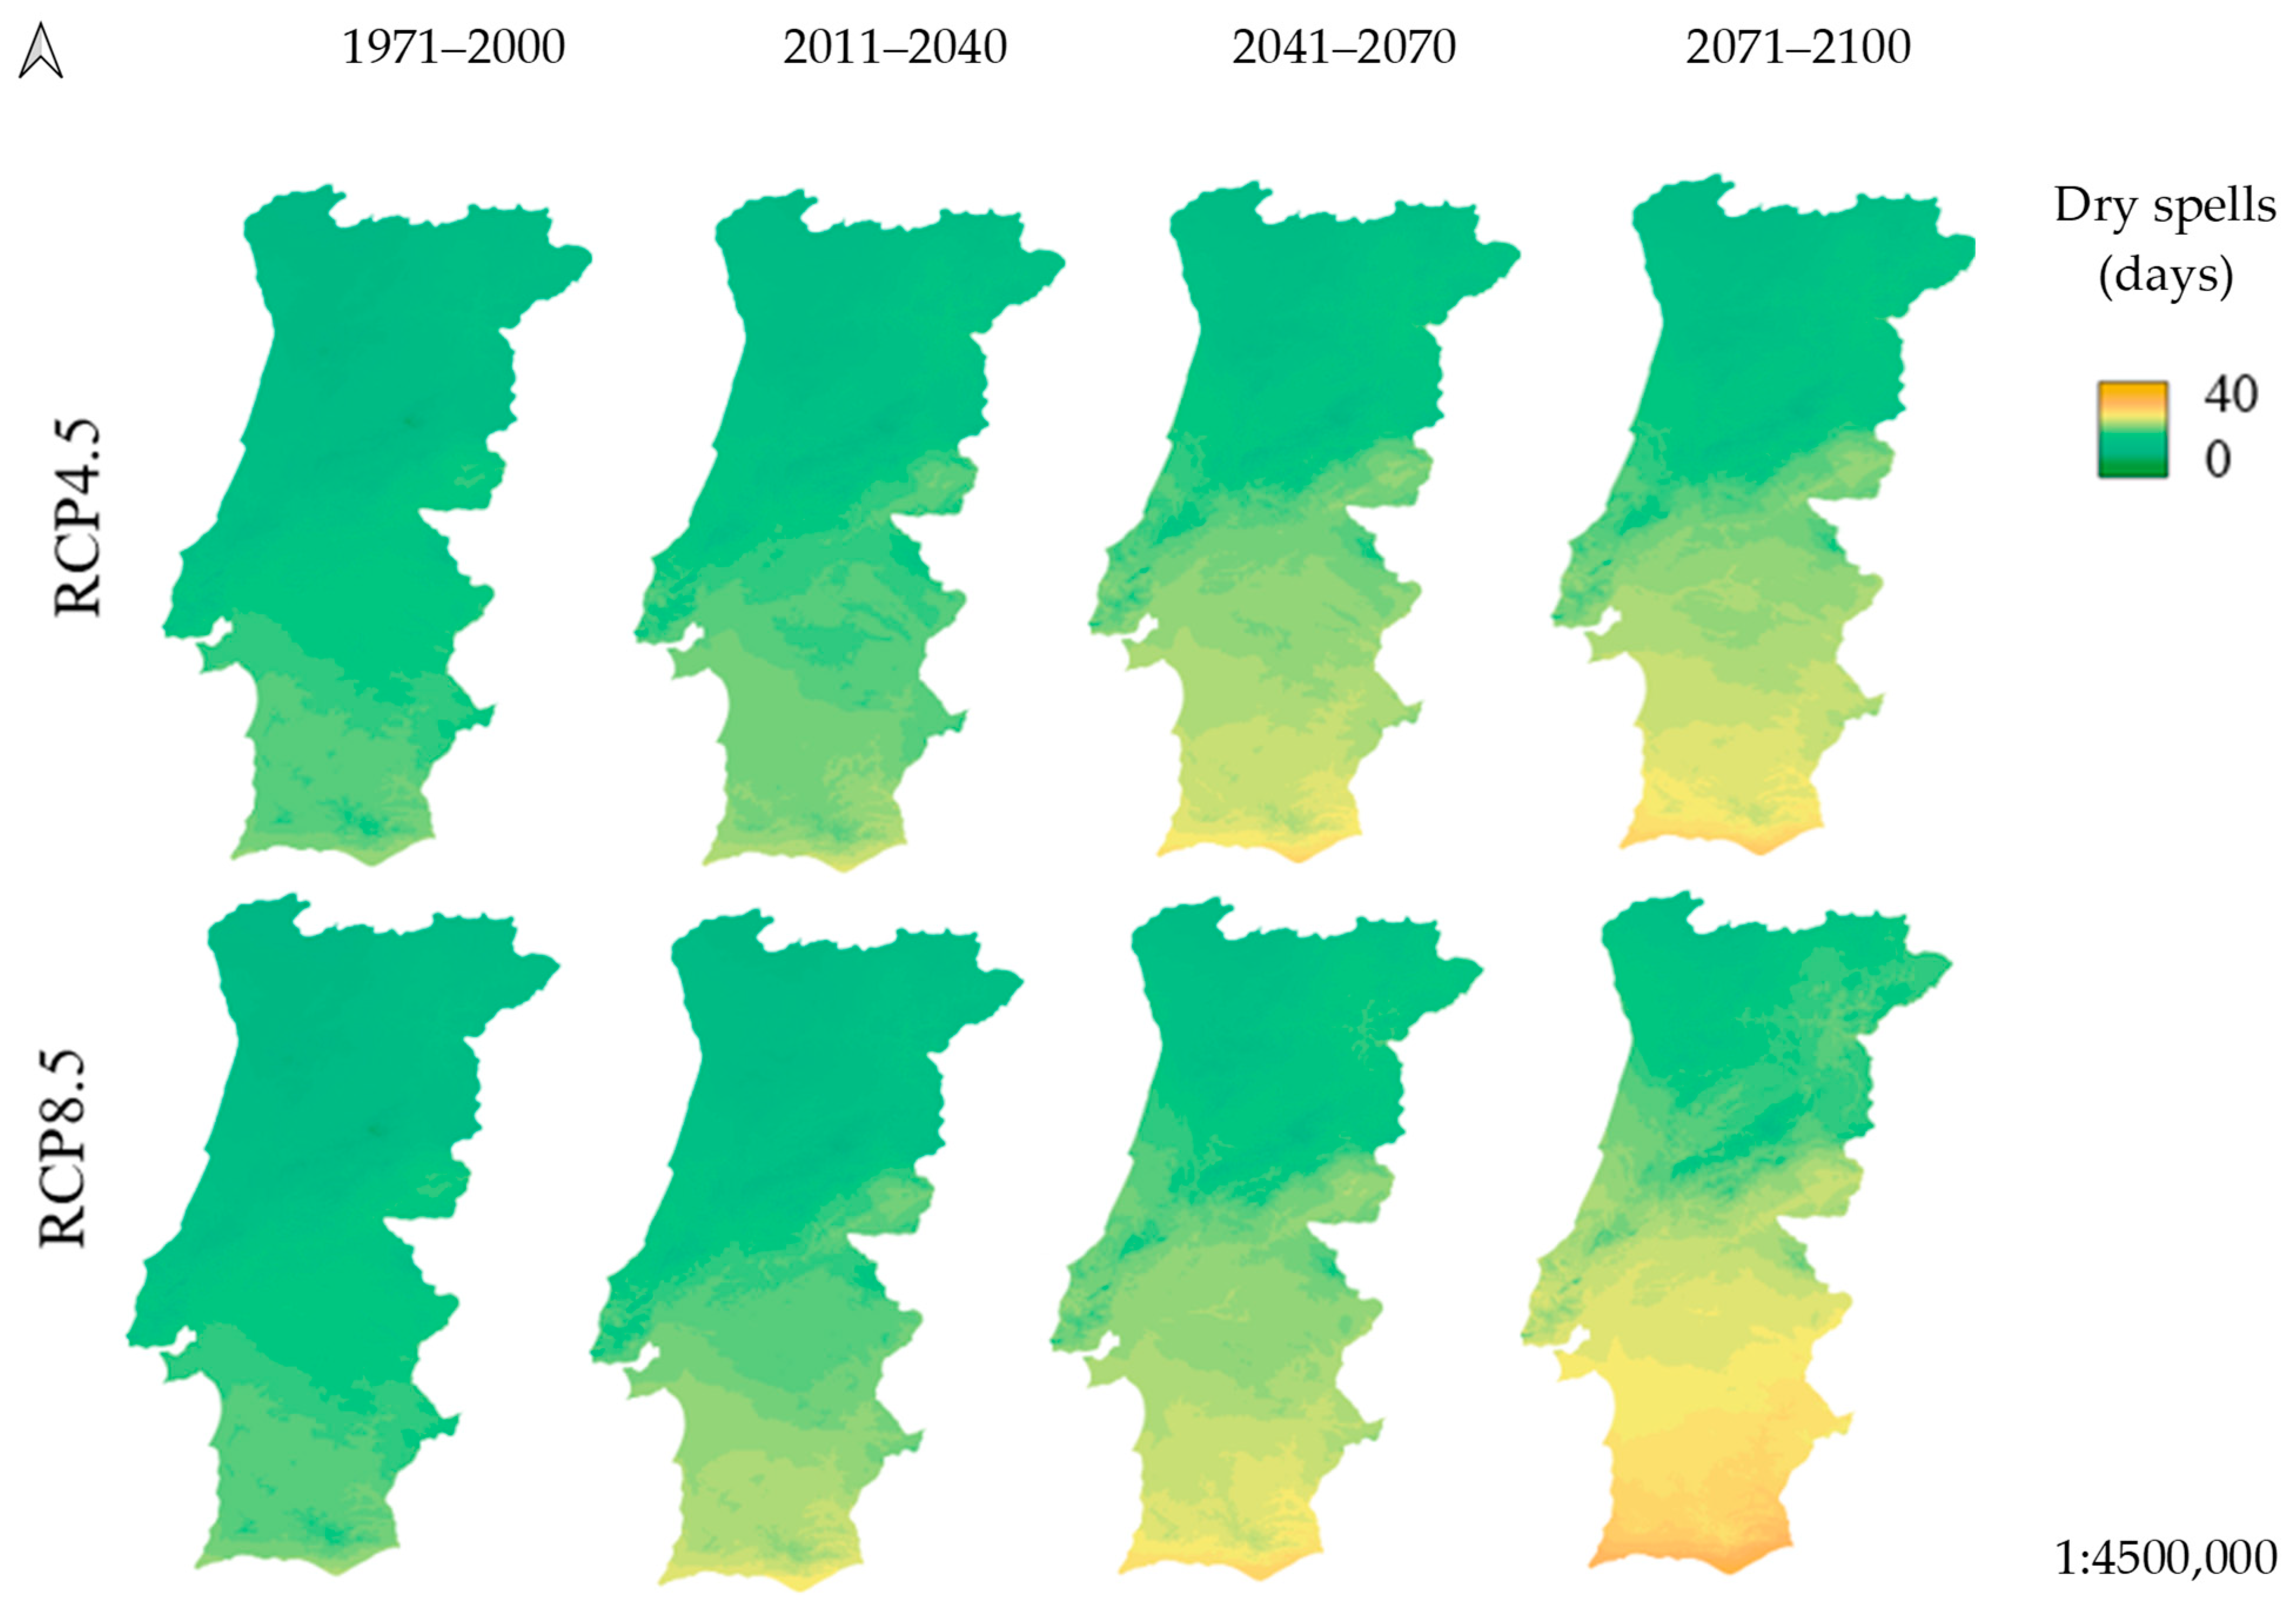
Figure 6 shows the DS values for different time periods and climate scenarios. During the baseline period, the average number of days without rainfall (dry days) i.e., the DS length, was recorded as follows: 13 in the Norte region, 15 in the Centro region, 18 in the AML region, 19 in the Alentejo region, and 21 in the Algarve region. These values indicate a clear increase in the dryness conditions from the north to the south of the country, a trend that is consistent with the precipitation results discussed earlier (Section 3.2).
Under the RCP4.5 scenario, in the near-term future period (2011–2040), all regions experience a slight increase in DS length, with values ranging from 15 days in the Norte region to 22 days in the Algarve region. Towards the middle of the century (2041–2070), this increase becomes more pronounced, with the Algarve region averaging 25 dry days, and the Norte region 16. By the end of the century, the average number of consecutive dry days will continue to increase, reaching 27 days in the Algarve region and 23 days in the Alentejo region, an increase of 6 and 4 days, respectively.
Under the more pessimistic RCP8.5 scenario for the period of 2011–2040, the DS duration is projected to increase to 24 days in the Algarve region and 14 days in the Norte region. By the middle of the century, the DS length will continue to increase, reaching 26 dry days in the Algarve region and 23 days in the Alentejo region. Between 2071 and 2100, the increase is particularly marked in the southern regions, with the DS lengths averaging 30 days in the Algarve region and 26 in the Alentejo region, an increase of 9 and 7 days respectively.
Thus, under both climate scenarios, the Algarve region is projected to be the Portuguese region that is most at risk of prolonged dryness conditions during the maize growing season, followed by the Alentejo and Centro regions, which may compromise maize production in these areas. The data show an important increase in the average DS length compared with that in the baseline period in all regions and climate scenarios. By the end of the century (2071–2100), under the RCP4.5 scenario, the percentage increase in DSs is projected to range from +16% in the Norte region to +22% in the Algarve region, corresponding to an increase of 2 and 6 dry days, respectively. Under the more pessimistic RCP8.5 scenario, the increase is more pronounced, ranging from +37% in the Norte and AML regions to +44% in the Algarve region, corresponding to increases of 5, 7, and 9 dry days, respectively.
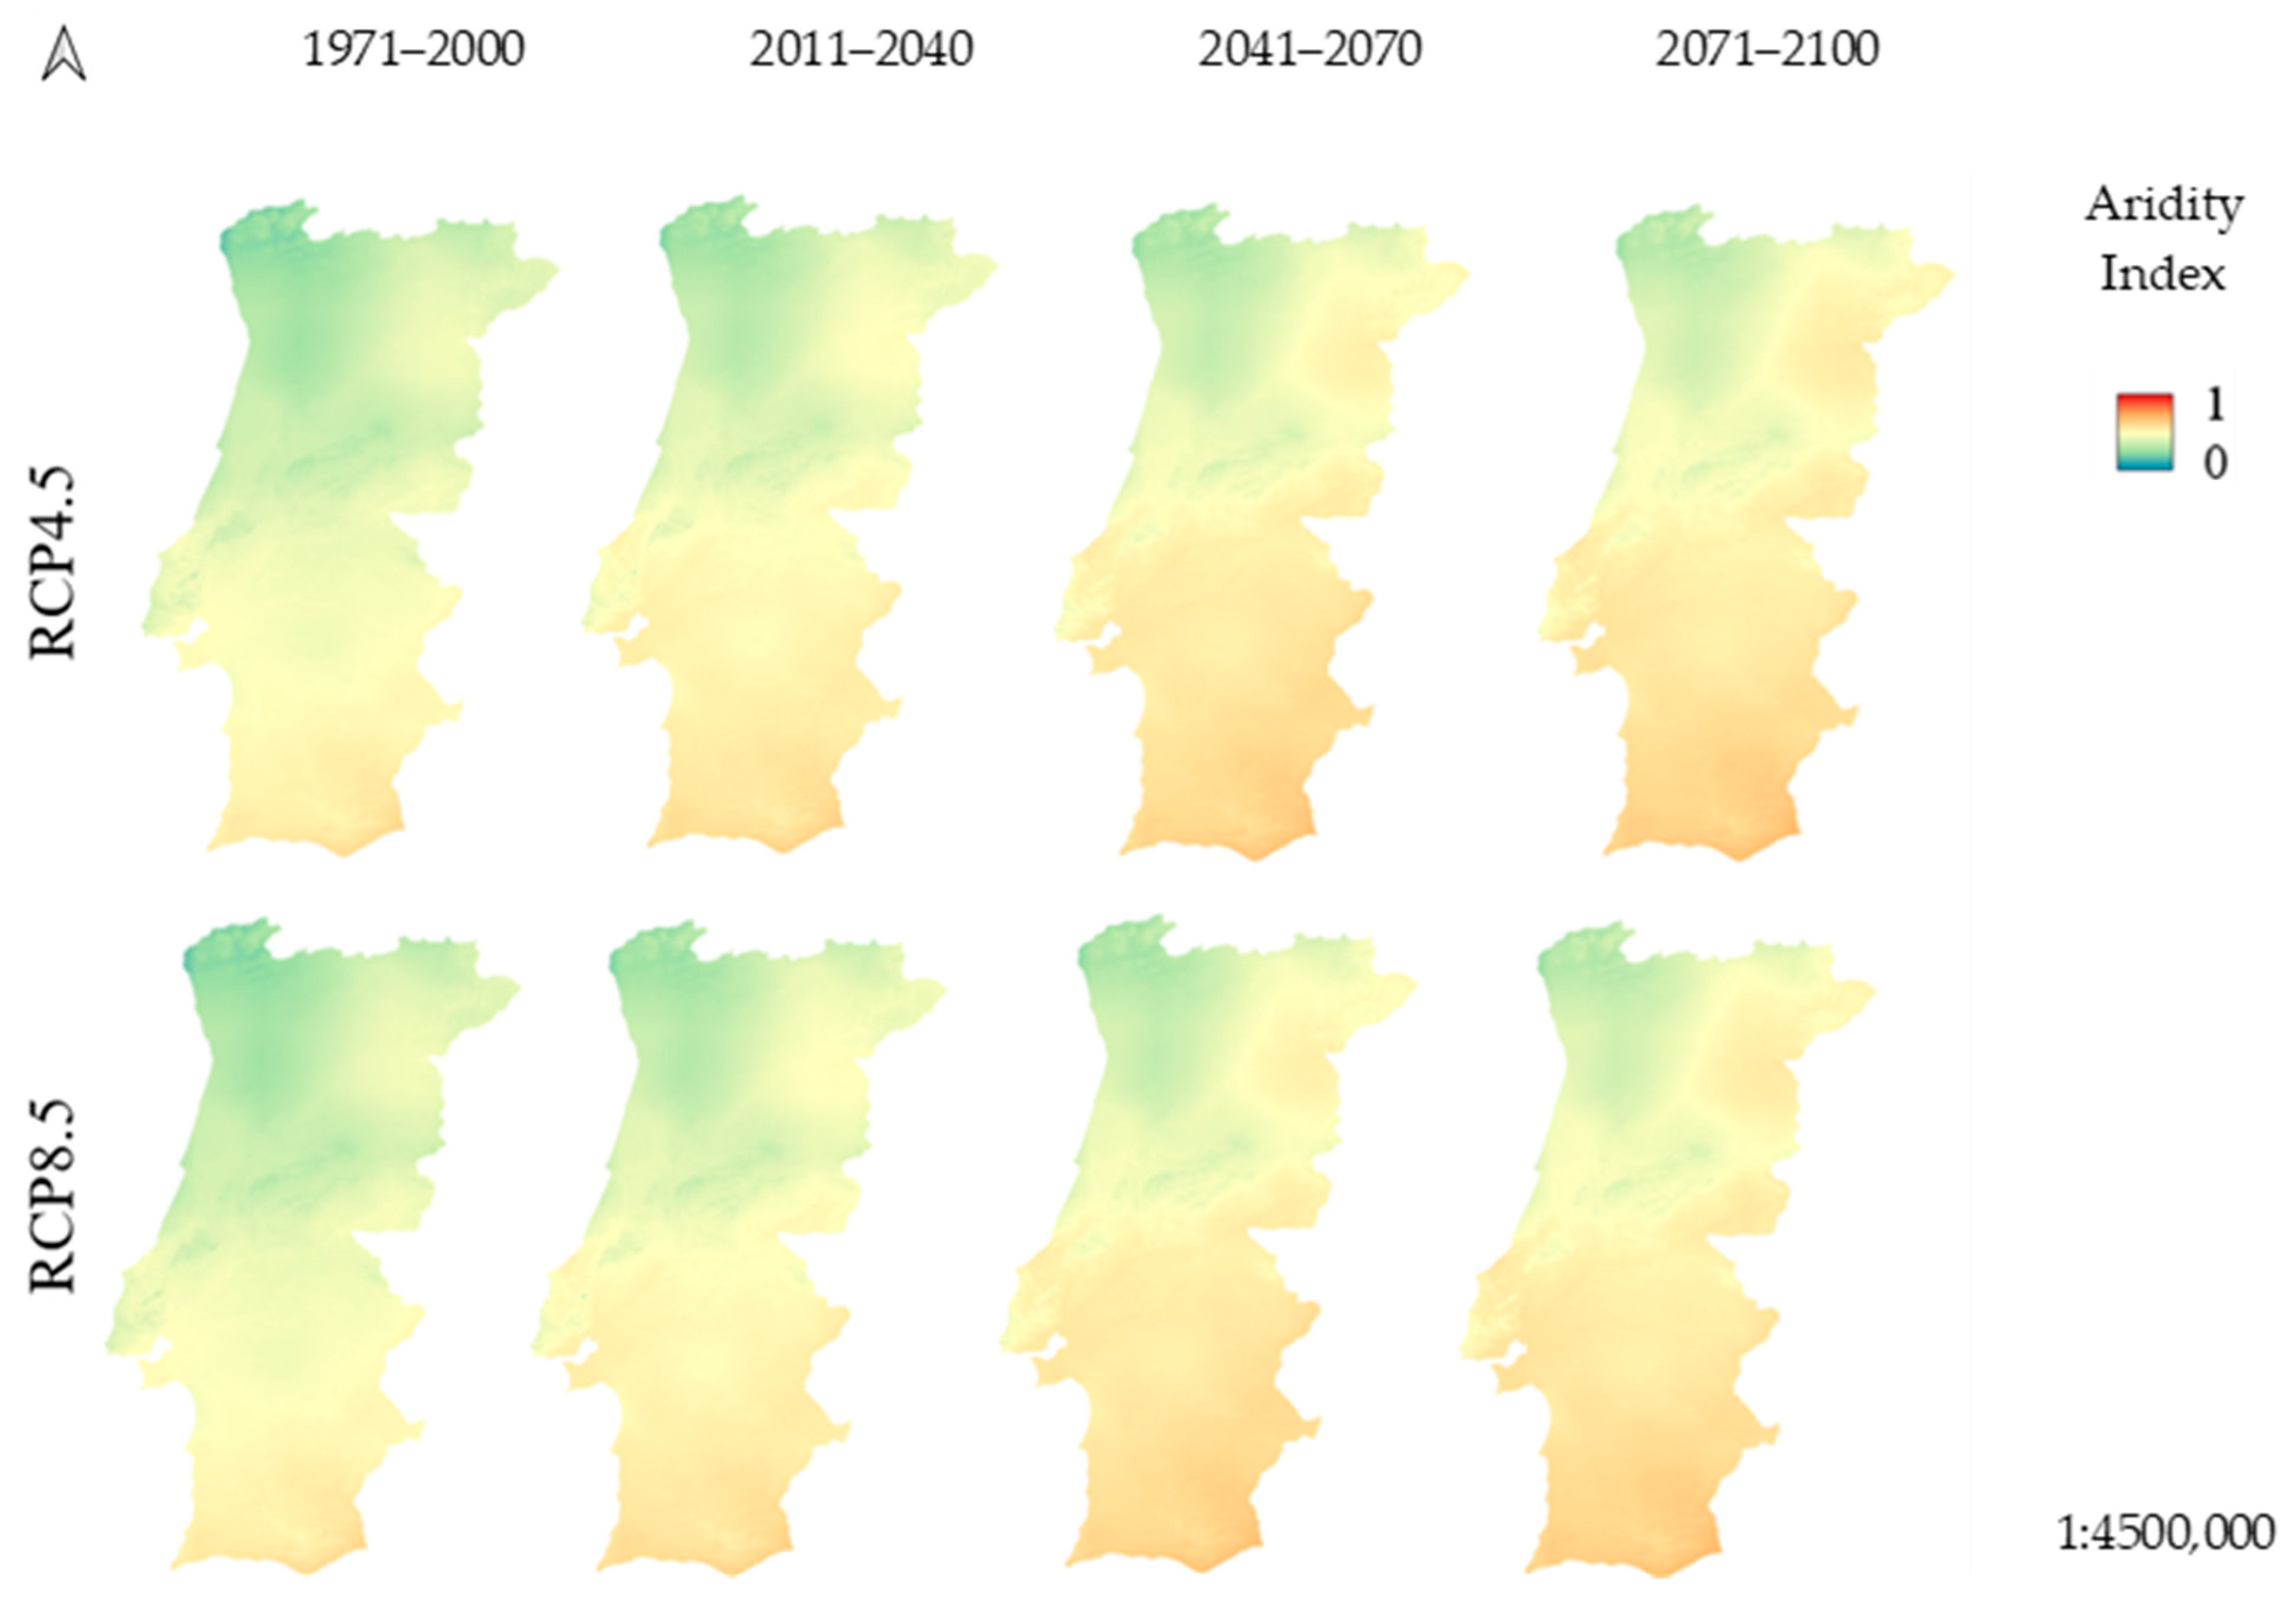
The evolution of the aridity index (AI) in different periods and climate scenarios is shown in Figure 7. During the baseline period, the AI is generally higher in the southern regions, with the Algarve region recording the highest value (0.57), indicating more arid conditions, while the northern regions show lower AI values, such as 0.35 in Norte, indicating less arid conditions. The Centro, AML, and Alentejo regions have intermediate values of 0.41, 0.48, and 0.50, respectively.
Under both RCP scenarios, a gradual increase in aridity is observed over time, which is in line with studies developed for the Mediterranean region [132] and, especially, for Spain [133] which indicate an increase in AI due to changes in precipitation and potential evapotranspiration. Between 2011 and 2040, the AI is projected to increase slightly, ranging from 0.39 in Norte to 0.60 in the Algarve region, while Alentejo reaches 0.54, AML 0.53, and Centro 0.45. By the middle of the century (2041–2070), the AI is projected to continue to increase, reaching 0.64 in the Algarve region, 0.58 in the Alentejo region, 0.55 in the AML region, and 0.49 in the Centro region, reflecting the increasing pressure of aridity in these regions. By the end of the century, the AI is projected to stabilize but remain higher than the baseline, with values of 0.65 in the Algarve region, 0.58 in both the Alentejo and AML regions, 0.50 in the Centro region, and 0.45 in the Norte region. These results underline the increasing challenges that the central and southern regions, including AML, Alentejo, and Algarve, will face in coping with increasing aridity conditions.
From a statistical point of view, the Norte region has the highest variance in AI, indicating a greater dispersion of data between the Northwest (NW) and Northeast (NE) subregions, probably due to the dispersion of precipitation (Figure 5). As AI values are influenced by precipitation (Equation (1)), these results are in line with the findings presented in Section 3.2, reinforcing the strong relationship between decreasing precipitation amounts and increasing aridity conditions.
Under both climate scenarios, the Algarve region is projected to have the highest risk of prolonged dryness in Portugal, as indicated by the DS indicator, followed by the Alentejo and Centro regions. At the same time, the Algarve, Alentejo, and AML regions are expected to have the highest aridity index, which will exceed 0.45 for the country as a whole. According to the study developed by Berdugo et al. [111], an AI value above 0.54 leads to soil degradation and a rapid decline in vegetation. This suggests that the maize production in the Alentejo, Algarve, and AML regions will be negatively affected under all of the projected scenarios. In contrast, the Norte and Centro regions are projected to be less affected due to higher rainfall and lower temperatures compared to other regions. As dryness induces physiological and biological stress in plants [109], the adoption of water stress-tolerant or drought-tolerant cultivars and the implementation of low planting densities could help mitigate the adverse effects of climate change [63,134]. Therefore, the combined analysis of DS and AI indicators consistently indicates a drier future, in line with the results of previous studies in Portugal [36,71,127].
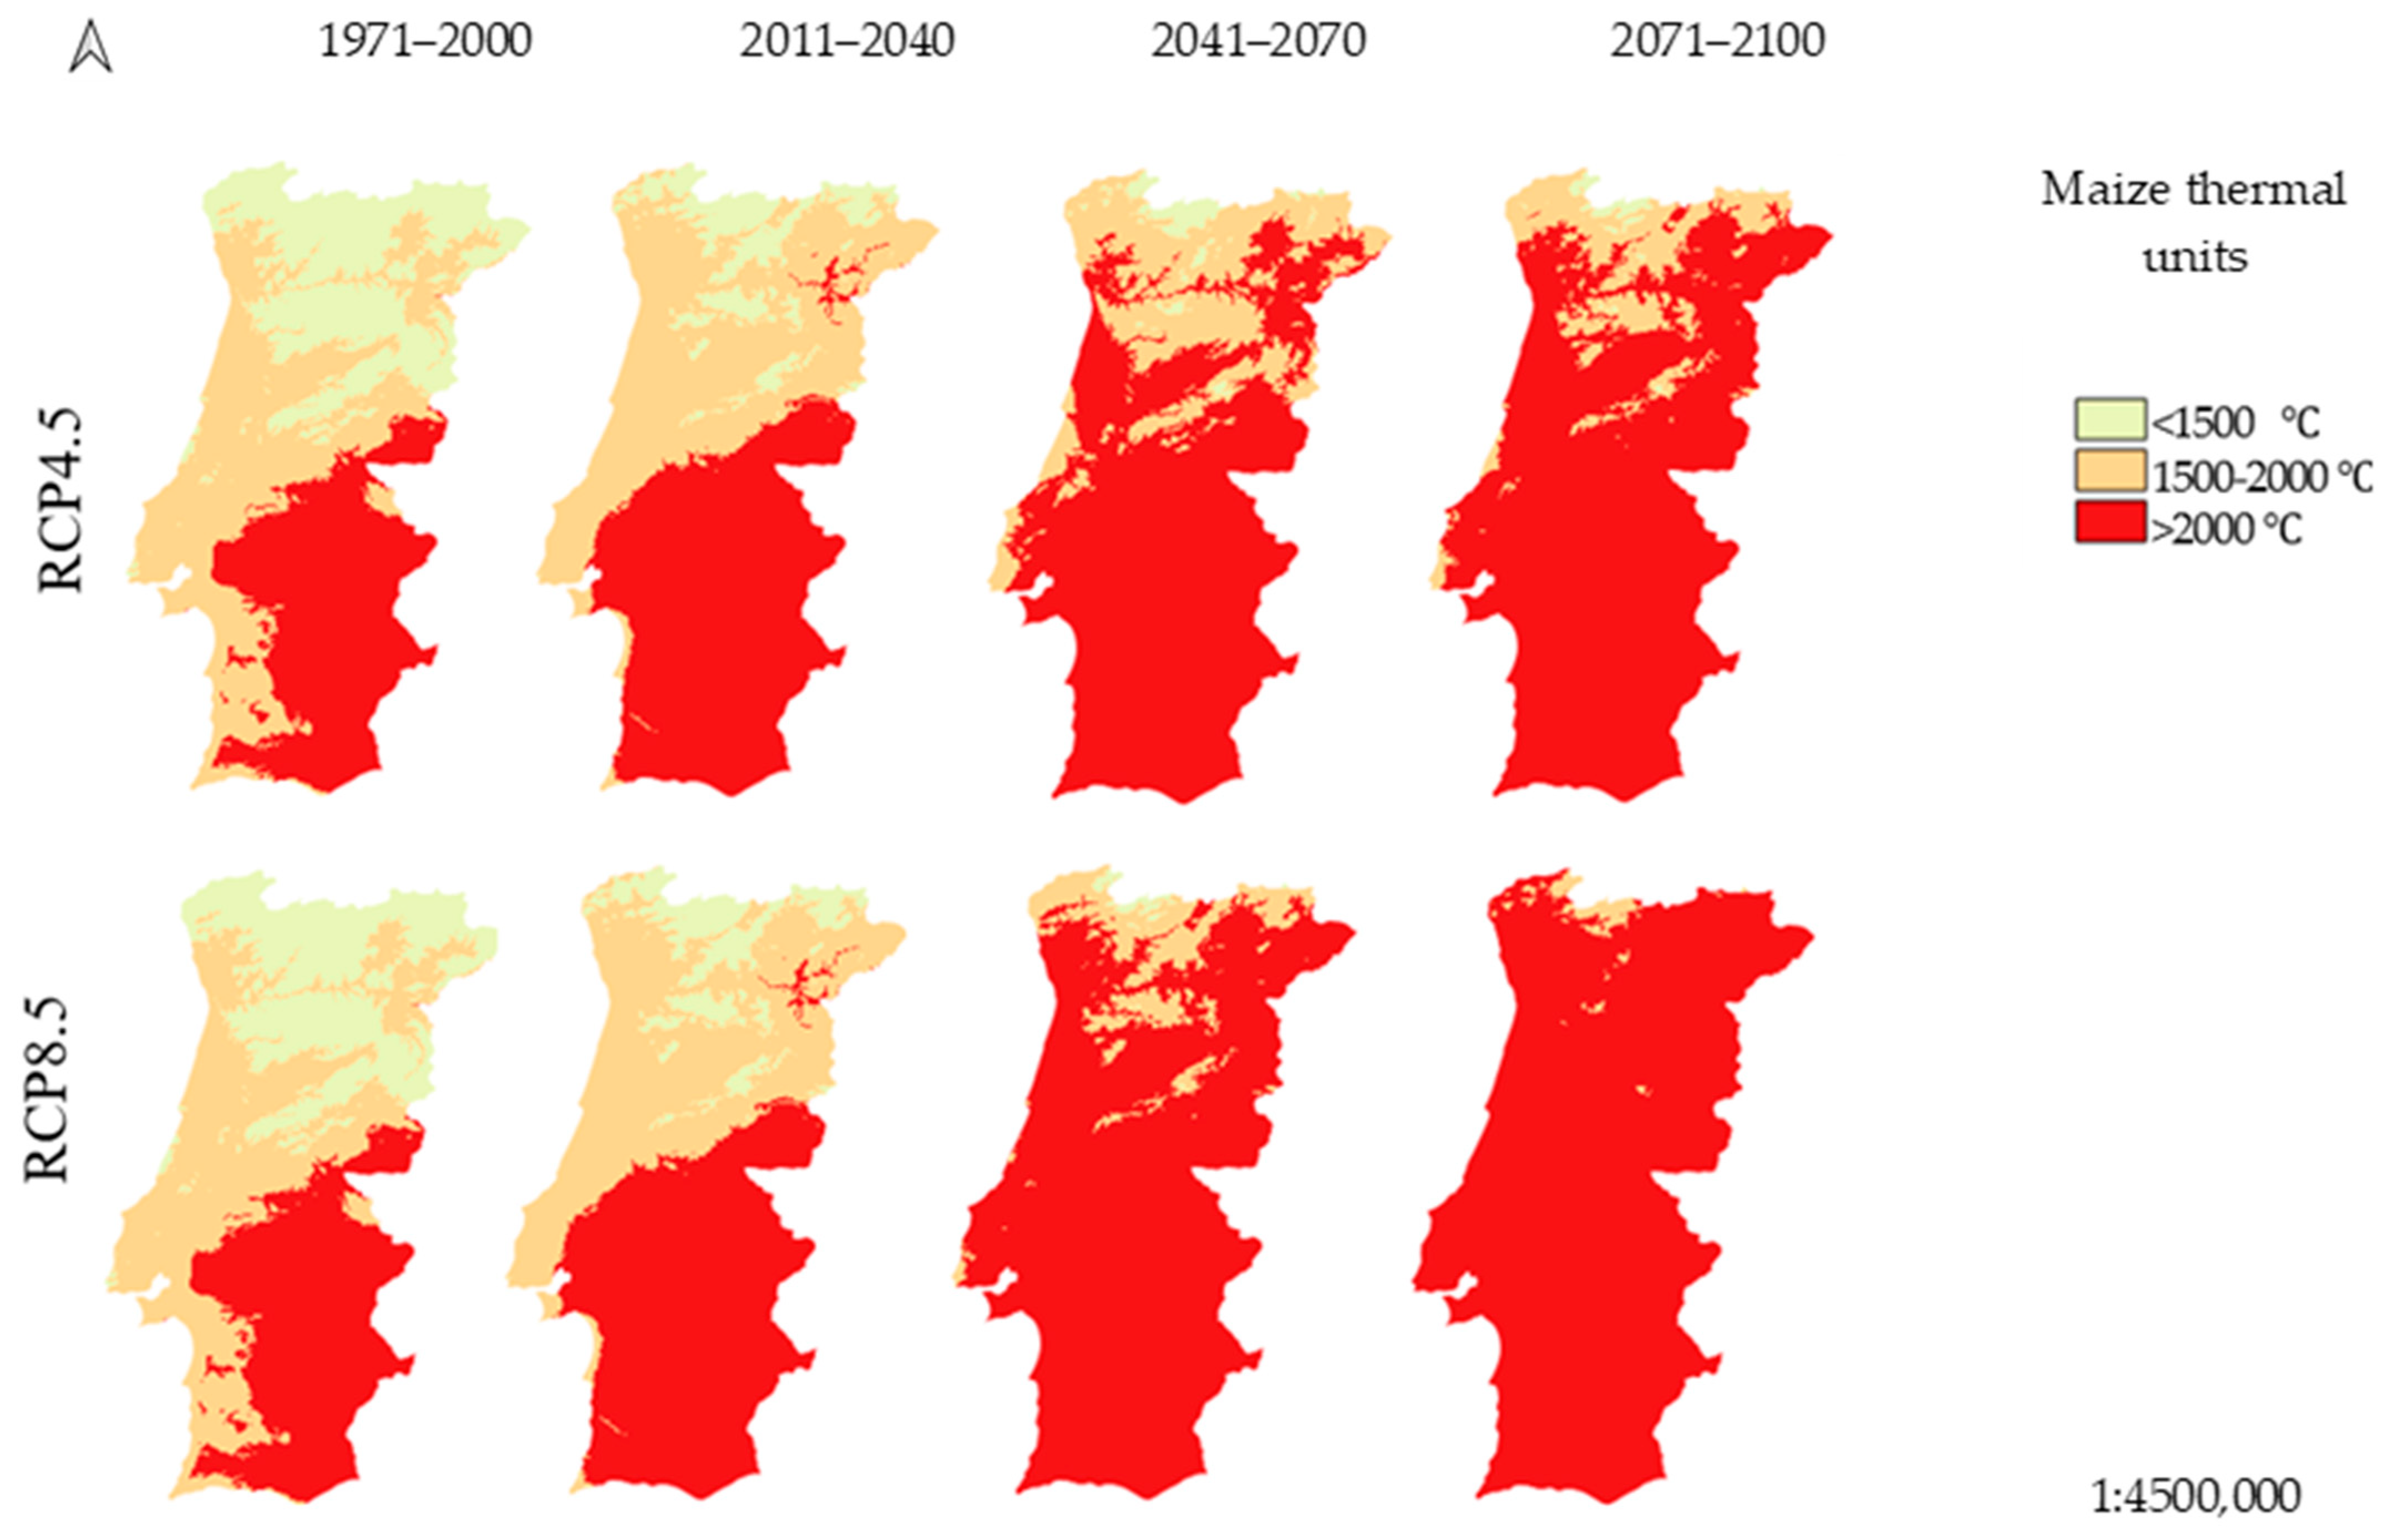
Figure 8 illustrates the evolution of the maize thermal unit (MTU) during the maize growing season (April–October) in the different time periods and climate scenarios, highlighting the regional implications for maize production (Table 4).
During the baseline period, the Norte region, with an MTU value of 1357 ± 228 °C, was limited to short-cycle varieties, mainly for silage production. In contrast, the Centro and AML regions, with average MTU values above 1500 °C, had the potential for maize grain production. The Alentejo and Algarve regions recorded the highest MTU values, with 2063 ± 125 °C and 2111 ± 167 °C, respectively, making them well-suited for long-cycle grain production. These regions also offer the potential for flexible sowing dates as an adaptation strategy.
Under the RCP4.5 scenario, the MTU increases in all regions compared to the baseline. During the period of 2011–2040, the Norte region (with an average MTU of 1585 °C, ranging between 769 and 2449 °C) is expected to become suitable for grain maize in some areas. By the middle of the century (2041–2070), the projected increase becomes more pronounced, with the Centro region reaching 2135 ± 260 °C, allowing the cultivation of long-cycle maize varieties and offering flexibility in sowing dates. By the end of the century (2071–2100), all regions are projected to exceed an average MTU of 2000 °C, creating favorable conditions for delayed planting and double cropping, except for the Norte region, which is projected to reach an average of 1980 ± 259 °C. Nevertheless, the Norte region consolidates its suitability for grain maize over most of the region. Under the more intense climate scenario, the heat accumulation increases more rapidly. In the near-term future (2011–2040), all regions are projected to reach MTU levels suitable for grain maize production, with the Alentejo and Algarve regions exceeding 2000 °C. The Norte region is projected to become suitable for maize grain production, with an average MTU of 1581 °C (ranging from 765 °C to 2445 °C). By 2041–2070, all regions are projected to exceed an average MTU of 2000 °C, further supporting delayed sowing and double cropping as key adaptation practices.
As expected, the MTU indicator shows an increase compared to the baseline period in all regions and climate scenarios. Under the RCP4.5 scenario, the percentage increase ranges from +26% in the AML and Algarve regions to +46% in the Norte region by the end of the century. Under the more pessimistic RCP8.5 scenario, the increase is even more pronounced, ranging from +43% in the Algarve region to +80% in the Norte region. These results point to a shift that will allow the cultivation of maize varieties with longer cycles throughout the country, potentially expanding the grain maize production in regions that are traditionally used for silage maize, such as the Norte region.
These results are consistent with those reported in studies on olives [71], fruit orchards [101], and vineyards [84] in mainland Portugal and on maize in the Balkan region [95]. The increase in the MTU increases the suitability for maize grain production, particularly in the Norte region, which has traditionally been used for silage maize due to temperature constraints. Over time, its climatic conditions are projected to resemble those of the south from a few decades ago. Under the RCP8.5 scenario, all regions are projected to become suitable for maize production (MTU > 2000 °C), allowing farmers to implement various adaptation measures to mitigate the effects of climate change and improve their maize yields. In this context, potential adaptation strategies include: (i) adjusting the sowing dates [26,135,136], (ii) adopting double cropping systems [43], and (iii) using adapted maize varieties to compensate for yield losses [24,25,48].
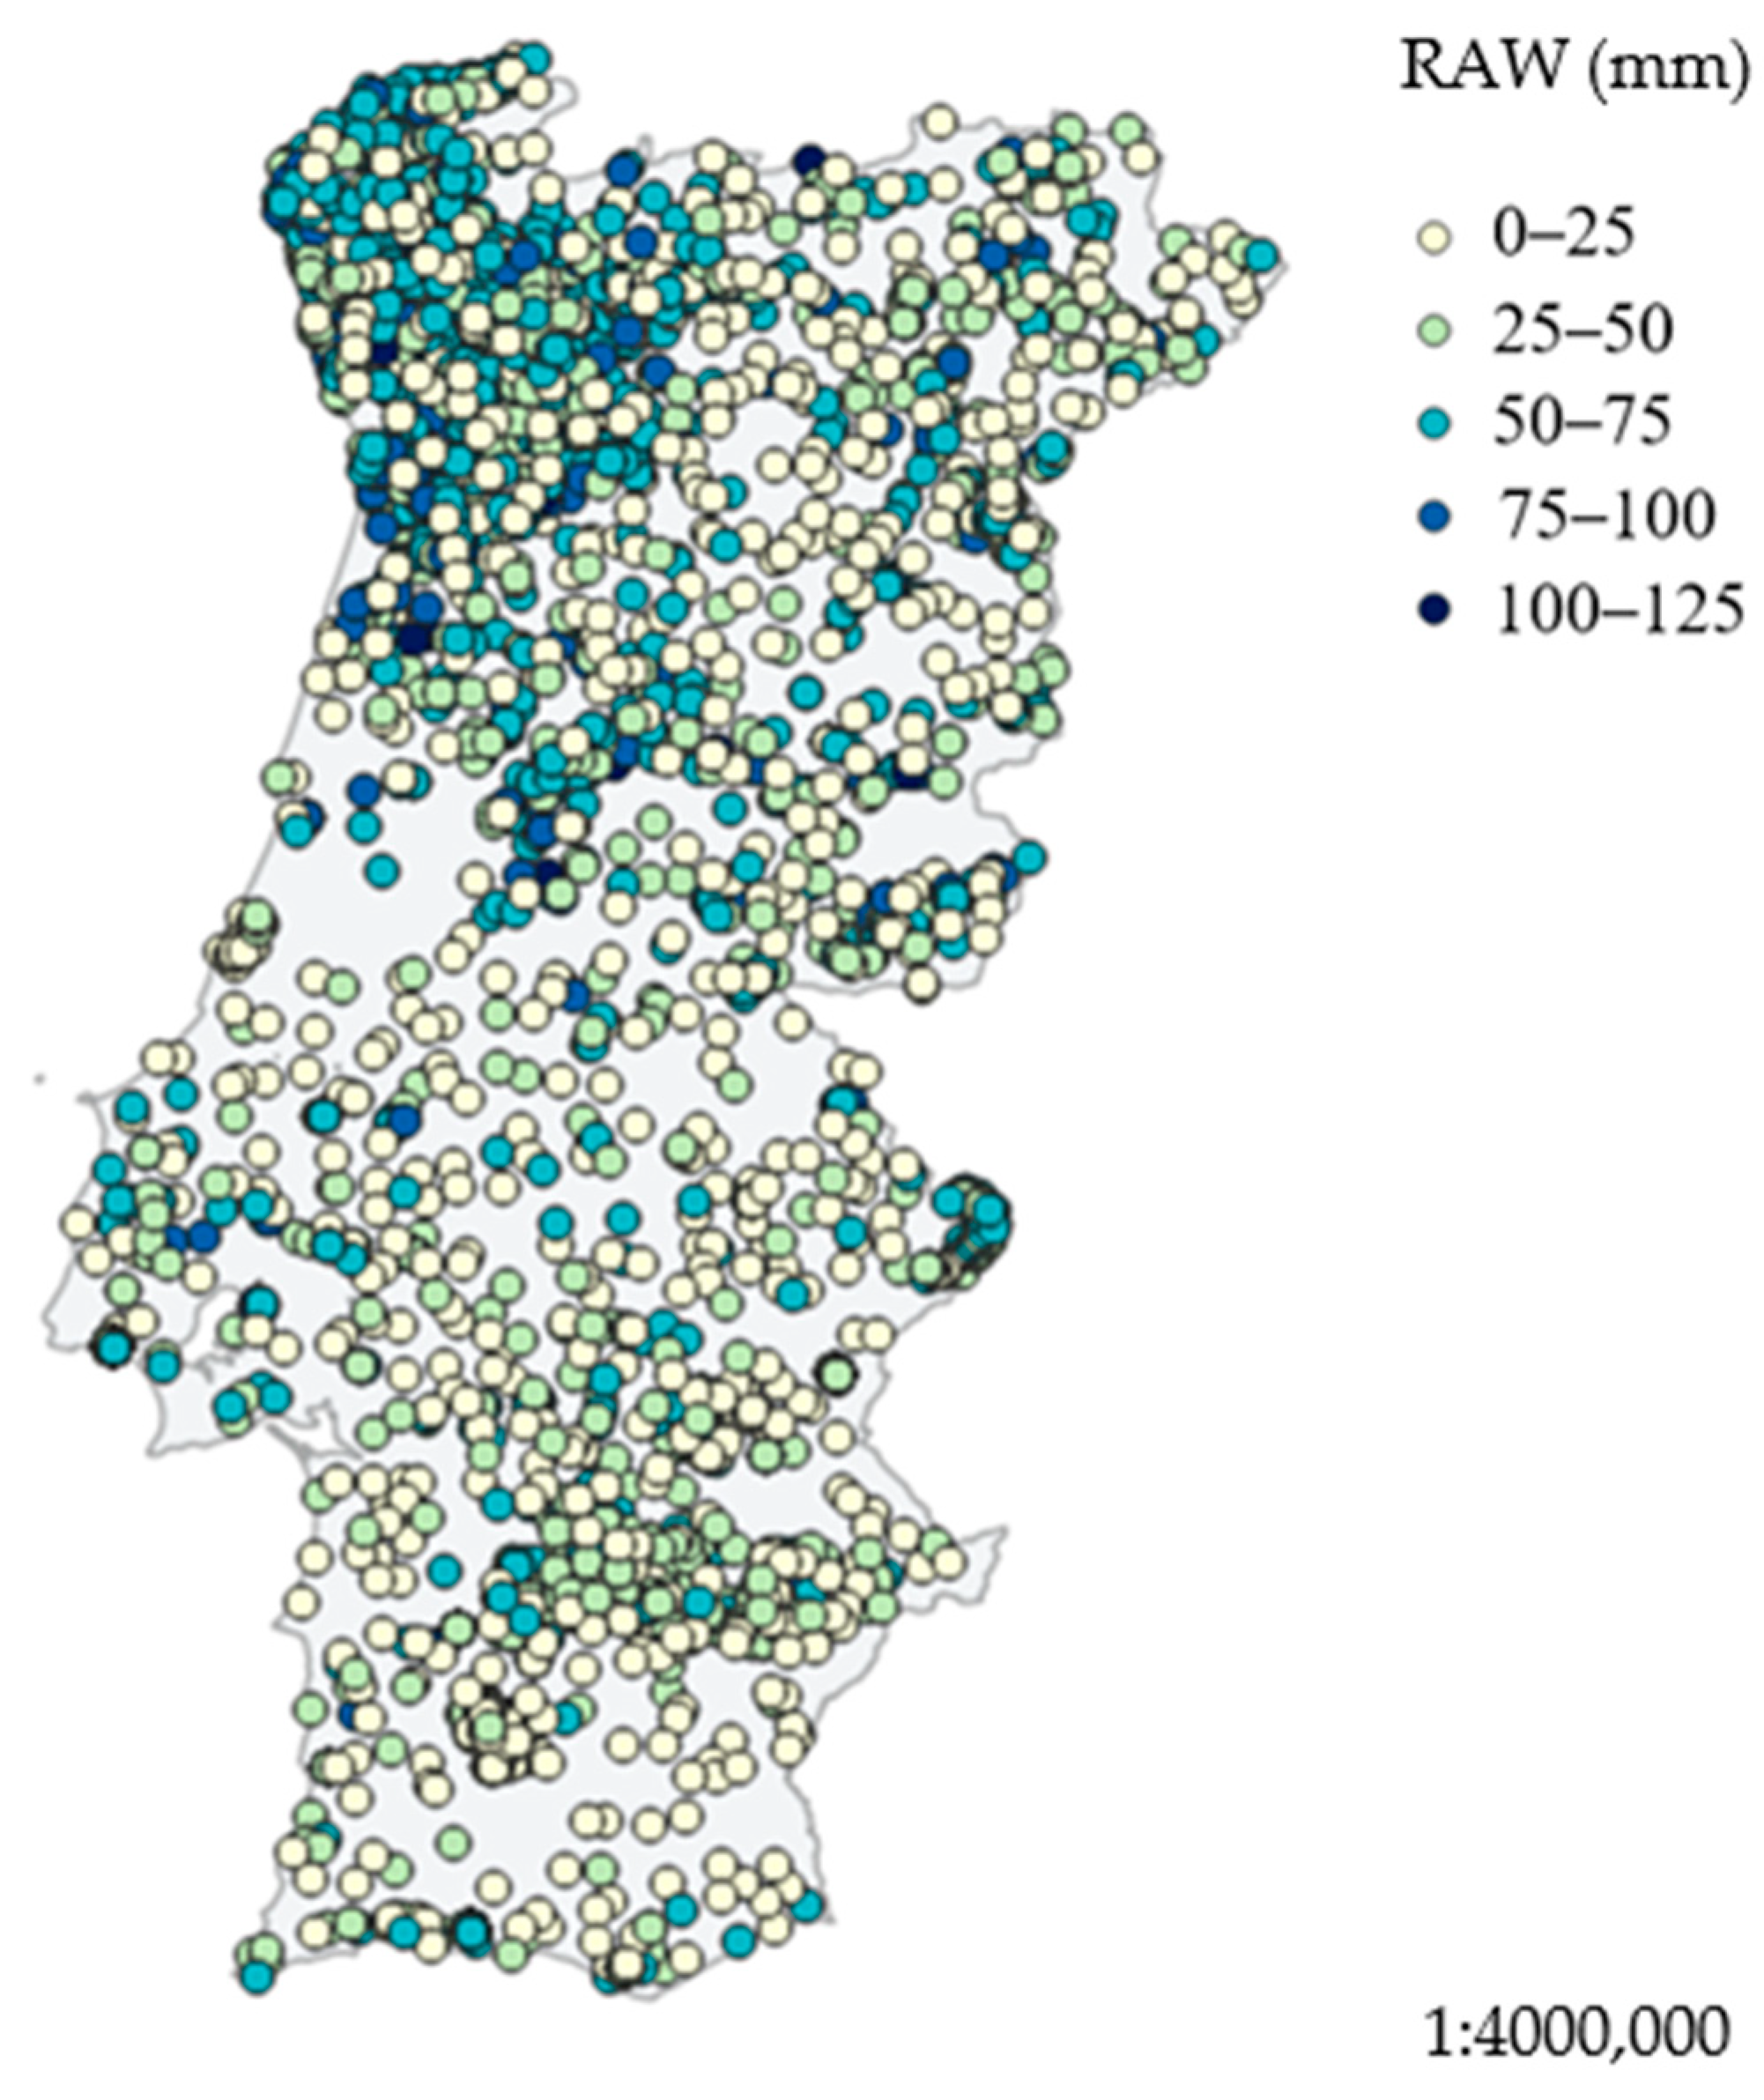
The distribution of the readily available soil water (RAW) is shown in Figure 9. The RAW represents the capacity of the soil to store water and make it available to plants without causing water stress. This means that maize grown in regions with a lower RAW is likely to require more frequent irrigation. The mean RAW values vary between the different regions, with the highest mean value recorded in the Norte region, at 50 mm, and the lowest in the Alentejo region, at 33 mm. Similarly, the Algarve and AML regions have average RAW values close to those of Alentejo, at 36 mm and 34 mm, respectively. The Centro region has an average RAW value of around 42 mm, although it has the highest variance. The Norte region also has a high standard deviation of 23 mm, while the AML region has the lowest dispersion, with a standard deviation of 18 mm. These results suggest that maize crops in Centro, AML, Alentejo, and Algarve will be more dependent on frequent irrigation than those in the Norte region.
As reported by Freitas et al. [71] for olive orchards, the northern region has high RAW values, while the southern regions, particularly the Alentejo region, have low RAW values. This suggests that soils in the Norte region can store and supply more water to crops than those in the south. The soils in the Norte region, therefore, have the advantage of being able to store more precipitation, reducing the risk of water stress and reducing the need for frequent irrigation. In contrast, in the Alentejo region, the lower water-holding capacity of the soil means that more frequent irrigations are needed, increasing the pressure on water resources and energy costs. Soil erosion can also be expected from extreme precipitation events due to high surface runoff values [137,138]. In areas where the RAW is low, practices such as on-farm rainwater harvesting for irrigation [139] could be used as a strategy to mitigate water scarcity, especially during the most difficult periods.
A comparison of data on the current distribution of maize production areas (INE data [8], 2011–2022) and the suitability of regions based on bioclimatic indicators (2011–2040), under the RCP4.5 scenario shows a good correspondence between the two. This is the case for the Norte and Centro regions, which have the highest production areas (silage), as reported by Statistics Portugal [8] and as defined by the bioclimatic suitability indicators.

3.4. Coruche as Case Study

The bioclimatic indicators for the Coruche region show major changes between the baseline period and the future climate projections (Table 5). During the maize growing season period, the average temperature (AT) indicator is projected to increase by about 1 °C in 2011–2040 under both the RCP4.5 and RCP8.5 scenarios. This warming trend is projected to intensify in 2041–2070, reaching 21.7 °C under RCP4.5 and 22.4 °C under RCP8.5. In the long-term future, the AT is projected to increase further, reaching 22.2 °C (RCP4.5) and 24.0 °C (RCP8.5), an increase of +3 °C and +4 °C, respectively, compared to the baseline. However, these values remain below the IPCC [32] projections.
The mean precipitation (MP) (from April to October) is projected to decrease significantly. From 214 mm in the baseline period, the MP decreases to 173 mm (RCP4.5) and 175 mm (RCP8.5) in the near-term future. This downward pattern continues into the medium term, with the projected MP values ranging from 146 mm (RCP4.5) to 130 mm (RCP8.5). By the end of the century, the precipitation is projected to decrease even further, reaching 124 mm (RCP8.5) and 129 mm (RCP4.5)—reductions of 42% and 40%, respectively. This sharp decline will increase dependence on irrigation for maize production.
Under both climate scenarios, the aridity index (AI) is projected to increase from 0.50 in the baseline to 0.60 in 2100, leading to reduced vegetation cover and an impaired photosynthetic activity of maize [111]. The dry spell (DS) length indicator is also projected to increase. The DS length is projected to increase from 19 days in the baseline period to 21 days (RCP4.5) and 22 days (RCP8.5) in the near-term future period (2011–2040), and this upward trend continues, with projections indicating 23 days without rain in the medium-term period under both climate scenarios and up to 26 days by the end of the 21st century under the more pessimistic RCP8.5 scenario.
The maize thermal units (MTUs) are projected to increase over time, rising from 2038 °C in the baseline period to 2249 °C (RCP4.5) and 2259 °C (RCP 8.5) in the 2011–2040 period. In the medium term, the MTUs are expected to reach 2500 °C (RCP4.5) and 2648 °C (RCP8.5). In the long term, the MTUs will continue to rise to 2600 °C under RCP4.5 and to 2997 °C under RCP8.5. As the MTU exceeds 2000 °C during the April–October period, farmers could implement various adaptation measures, as described in Section 3.3. These projections highlight the urgent need for adaptation and mitigation strategies to address the increasing climate challenges in the Coruche region.

4. Strengths and Limitations of This Study

The current study has several strengths that make it a valuable contribution to the understanding of the challenges projected for maize production in Portugal. It is the first piece of research to provide very high-resolution maps (~1 km) of a comprehensive set of bioclimatic indicators to assess Portugal’s suitability for maize production at the NUTS II region level. Another key strength is the detailed analysis carried out in a highly productive agricultural region, where farmers are more likely to adopt new tools and technologies to cope with water scarcity and climate change. In addition, this study proposes practical adaptation measures that farmers can implement to increase their incomes and mitigate climate risks.
However, some limitations must be acknowledged. As this study was carried out at a national scale, certain simplifications were necessary. In addition, the use of downscaled data, while providing higher spatial resolution, may introduce some uncertainties [140], especially in regions with high climate variability, which may affect the robustness of the results. Nevertheless, the use of multiple models and climate scenarios helps to address the uncertainties in the projected climate data.
Future studies should refine and extend this research in terms of:
(i)
The use of maximum and minimum temperature data to analyze their impact on critical maize growth stages (e.g., germination and flowering) based on crop-specific temperature thresholds;
(ii)
Applying climate data correction methods to improve the accuracy of projections;
(iii)
The use of daily precipitation data to assess the ability of the soil to store water, especially during extreme precipitation events, and to consider the availability of the retained water for crop development, allowing for a more detailed exploration of the RAW concept, which can be addressed using a soil water balance model;
(iv)
Investigate the impacts of specific agricultural practices under different climate scenarios, thereby contributing to the development of more robust adaptation strategies;
(v)
Exploring the interactive effects of multiple abiotic stressors on maize production, using crop growth models;
(vi)
Further analyzing the results in terms of spatial resolution, as the NUT II areas are large. In the southern regions, this level is sufficient, but the Norte region shows high variability in the bioclimatic indicators between the coast and the interior, suggesting the need for subdivision.
By addressing these issues, future research could further improve the accuracy of climate impact assessments and provide more targeted adaptation recommendations for maize production in Portugal.

5. Conclusions

This study characterized the maize production in Portugal, analyzing historical trends (2011–2022) and future projections under different climate scenarios by using bioclimatic indicators from the Copernicus Climate Change Service portal. The analysis of historical data confirmed a decline in the maize cropping area and production over time, despite an increase in productivity. This suggests improvements in agricultural practices and the adoption of innovative technologies. Future bioclimatic indicators highlight the significant impacts of climate change, particularly under the RCP8.5 scenario, where the temperature increases could exceed 5 °C in some regions, accompanied by a sharp reduction in precipitation during the maize growing season. These climatic shifts are likely to shorten crop cycles, potentially affecting productivity. Considering the set of bioclimatic indicators as a whole, the results suggest that climate change may create new opportunities for maize production, particularly in regions that are traditionally dedicated to silage maize, such as the Norte region, where conditions may become more favorable for grain maize cultivation, not only because the required MTU is met, but also because of the greater availability of water compared to other mainland regions. In addition, in regions historically associated with grain maize production (Centro and Alentejo), double cropping could become a viable option due to higher average temperatures. However, the availability of water for irrigation needs to be carefully considered given the increased frequency of dry spells and droughts and the increased aridity predicted for these areas.
This study compares well with previous research on the impacts of climate change on different crops, highlighting the northern regions (mainly NW) as having significant potential for agricultural expansion.
In conclusion, while climate change presents both challenges and opportunities for maize production in Portugal, regional adaptation strategies focusing on water management, farmer support, and rural development will be essential to maximize maize productivity and mitigate the adverse effects of CC. In addition, policy makers should integrate climate projections and spatial variability into their agricultural planning to optimize water use. Future research should focus on addressing the limitations identified in this study and refining the methodology, as suggested, to improve its accuracy and deepen the assessment of the effects of CC on maize phenology and yield. The active engagement of different stakeholders will be crucial in the selection and implementation of strategies that integrate socio-economic factors, which may improve the adoption of selected strategies and thus contribute to the long-term sustainability of maize production in Portugal. Furthermore, the methodology developed in this study could be adapted and implemented to assess the production potential of maize or other crops in other countries, providing a valuable tool for global agricultural planning under changing climatic conditions.

Author Contributions

Conceptualization, P.P., T.A.P. and J.R.; methodology, D.S. and P.P.; software, D.S. and J.R.; validation, D.S. and P.P.; resources, P.P.; formal analysis and data curation, D.S.; writing—original draft preparation, D.S.; writing—review and editing, P.P., T.A.P. and J.R.; supervision, P.P., T.A.P. and J.R. All authors have read and agreed to the published version of the manuscript.

Funding

This research was funded by the Fundação para a Ciência e Tecnologia (FCT) through the researcher fellowship contract with Daniela Soares 2022.10607.BD.

Data Availability Statement

The original contributions presented in this study are included in the article. Further inquiries can be directed to the corresponding author.

Acknowledgments

The authors want to thank the Portuguese Maize Farmers Association (ANPROMIS) for all the data and support that was provided for this study. The support of FCT—Fundação para a Ciência e a Tecnologia, I.P., under the projects WaterQB “Integrated web-based platform for supporting irrigation management aiming at coping with climate variability and changes” project (PTDC/AGR-AAM/04553/2022, https://doi.org/10.54499/2022.04553.PTDC), UIDB/04129/2020 of LEAF-Linking Landscape, Environment, Agriculture and Food, Research Unit and LA/P/0092/2020 of Associate Laboratory TERRA is also acknowledged. The authors also wish to express their gratitude to Teresa Freitas for her support regarding the spatialized soil dataset.

Conflicts of Interest

The authors declare no conflicts of interest.

References

  1. Erenstein, O.; Jaleta, M.; Sonder, K.; Mottaleb, K.; Prasanna, B.M. Global Maize Production, Consumption and Trade: Trends and R&D Implications. Food Secur. 2022, 14, 1295–1319. [Google Scholar] [CrossRef]
  2. World Bank. Arable Land (Hectares)—World. 2025. Available online: https://data.worldbank.org/indicator/AG.LND.ARBL.HA?locations=1W (accessed on 12 January 2025).
  3. Kennett, D.J.; Prufer, K.M.; Culleton, B.J.; George, R.J.; Robinson, M.; Trask, W.R.; Buckley, G.M.; Moes, E.; Kate, E.J.; Harper, T.K.; et al. Early Isotopic Evidence for Maize as a Staple Grain in the Americas. Sci. Adv. 2020, 6, eaba3245. [Google Scholar] [CrossRef]
  4. Awika, J.M. Major cereal grains production and use around the world. In Advances in Cereal Science: Implications to Food Processing and Health Promotion; Awika, J.M., Piironen, V., Bean, S., Eds.; American Chemical Society: Washington, DC, USA, 2011; Volume 1089, pp. 1–13. [Google Scholar] [CrossRef]
  5. Lizaso, J.I.; Ruiz-Ramos, M.; Rodríguez, L.; Gabaldon-Leal, C.; Oliveira, J.A.; Lorite, I.J.; Sánchez, D.; García, E.; Rodríguez, A. Impact of High Temperatures in Maize: Phenology and Yield Components. Field Crops Res. 2018, 216, 129–140. [Google Scholar] [CrossRef]
  6. USDA. Production—Corn. 2025. Available online: https://www.fas.usda.gov/data/production/commodity/0440000 (accessed on 5 January 2025).
  7. Revilla, P.; Alves, M.L.; Andelković, V.; Balconi, C.; Dinis, I.; Mendes-Moreira, P.; Redaelli, R.; Ruiz De Galarreta, J.I.; Vaz Patto, M.C.; Žilić, S.; et al. Traditional Foods From Maize (Zea mays L.) in Europe. Front. Nutr. 2022, 8, 683399. [Google Scholar] [CrossRef] [PubMed]
  8. Instituto Nacional de Estatística (INE). Estatísticas Agrícolas (2011–2022). Lisboa, Portugal: Instituto Nacional de Estatística. 2024. Available online: https://www.ine.pt/ (accessed on 5 January 2025).
  9. Viana, C.M.; Freire, D.; Abrantes, P.; Rocha, J. Evolution of agricultural production in Portugal during 1850–2018: A geographical and historical perspective. Land 2021, 10, 776. [Google Scholar] [CrossRef]
  10. Yang, C.; Fraga, H.; Ieperen, W.V.; Santos, J.A. Assessment of Irrigated Maize Yield Response to Climate Change Scenarios in Portugal. Agric. Water Manag. 2017, 184, 178–190. [Google Scholar] [CrossRef]
  11. Miedaner, T.; Juroszek, P. Global Warming and Increasing Maize Cultivation Demand Comprehensive Efforts in Disease and Insect Resistance Breeding in North-western Europe. Plant Pathol. 2021, 70, 1032–1046. [Google Scholar] [CrossRef]
  12. Fawzy, S.; Osman, A.I.; Doran, J.; Rooney, D.W. Strategies for Mitigation of Climate Change: A Review. Environ. Chem. Lett. 2020, 18, 2069–2094. [Google Scholar] [CrossRef]
  13. Markou, M.; Moraiti, C.A.; Stylianou, A.; Papadavid, G. Addressing Climate Change Impacts on Agriculture: Adaptation Measures For Six Crops in Cyprus. Atmosphere 2020, 11, 483. [Google Scholar] [CrossRef]
  14. Saleem, A.; Anwar, S.; Nawaz, T.; Fahad, S.; Saud, S.; Ur Rahman, T.; Rasheed Khan, M.N.; Nawaz, T. Securing a sustainable future: The climate change threat to agriculture, food security, and sustainable development goals. J. Umm Al-Qura Univ. Appll. Sci. 2024. [Google Scholar] [CrossRef]
  15. Mereu, V.; Gallo, A.; Trabucco, A.; Carboni, G.; Spano, D. Modeling High-Resolution Climate Change Impacts on Wheat and Maize in Italy. Clim. Risk Manag. 2021, 33, 100339. [Google Scholar] [CrossRef]
  16. Srivastava, R.K.; Panda, R.K.; Chakraborty, A. Assessment of Climate Change Impact on Maize Yield and Yield Attributes under Different Climate Change Scenarios in Eastern India. Ecol. Indic. 2021, 120, 106881. [Google Scholar] [CrossRef]
  17. Farooq, A.; Farooq, N.; Akbar, H.; Hassan, Z.U.; Gheewala, S.H. A Critical Review of Climate Change Impact at a Global Scale on Cereal Crop Production. Agronomy 2023, 13, 162. [Google Scholar] [CrossRef]
  18. Wu, Y.; Leng, P.; Ren, C. Assessing Net Irrigation Needs in Maize–Wheat Rotation Farmlands on the North China Plain: Implications for Future Climate Scenarios. Agronomy 2024, 14, 1144. [Google Scholar] [CrossRef]
  19. Gabaldón-Leal, C.; Lorite, I.; Mínguez, M.; Lizaso, J.; Dosio, A.; Sanchez, E.; Ruiz-Ramos, M. Strategies for Adapting Maize to Climate Change and Extreme Temperatures in Andalusia, Spain. Clim. Res. 2015, 65, 159–173. [Google Scholar] [CrossRef]
  20. Supit, I.; Van Diepen, C.A.; De Wit, A.J.W.; Wolf, J.; Kabat, P.; Baruth, B.; Ludwig, F. Assessing Climate Change Effects on European Crop Yields Using the Crop Growth Monitoring System and a Weather Generator. Agric. For. Meteorol. 2012, 164, 96–111. [Google Scholar] [CrossRef]
  21. Abbas, G.; Ahmed, M.; Fatima, Z.; Hussain, S.; Kheir, A.M.S.; Ercişli, S.; Ahmad, S. Modeling the Potential Impact of Climate Change on Maize-Maize Cropping System in Semi-Arid Environment and Designing of Adaptation Options. Agric. For. Meteorol. 2023, 341, 109674. [Google Scholar] [CrossRef]
  22. Xu, H.; Twine, T.E.; Girvetz, E. Climate Change and Maize Yield in Iowa. PLoS ONE 2016, 11, e0156083. [Google Scholar] [CrossRef]
  23. Žydelis, R.; Weihermüller, L.; Herbst, M. Future Climate Change Will Accelerate Maize Phenological Development and Increase Yield in the Nemoral Climate. Sci. Total Environ. 2021, 784, 147175. [Google Scholar] [CrossRef]
  24. Zhao, J.; Bindi, M.; Eitzinger, J.; Ferrise, R.; Gaile, Z.; Gobin, A.; Holzkämper, A.; Kersebaum, K.-C.; Kozyra, J.; Kriaučiūnienė, Z.; et al. Priority for Climate Adaptation Measures in European Crop Production Systems. Eur. J. Agron. 2022, 138, 126516. [Google Scholar] [CrossRef]
  25. Pérez-Lucas, G.; Navarro, G.; Navarro, S. Adapting Agriculture and Pesticide Use in Mediterranean Regions under Climate Change Scenarios: A Comprehensive Review. Eur. J. Agron. 2024, 161, 127337. [Google Scholar] [CrossRef]
  26. Koimbori, J.K.; Wang, S.; Pan, J.; Guo, L.; Li, K. Yield Response of Spring Maize under Future Climate and the Effects of Adaptation Measures in Northeast China. Plants 2022, 11, 1634. [Google Scholar] [CrossRef] [PubMed]
  27. Iglesias, A.; Santillán, D.; Garrote, L. On the Barriers to Adaption to Less Water under Climate Change: Policy Choices in Mediterranean Countries. Water Resour. Manag. 2018, 32, 4819–4832. [Google Scholar] [CrossRef]
  28. Monistrol, A.; Vallejo, A.; García-Gutiérrez, S.; Hermoso-Peralo, R.; Montoya, M.; Atencia-Payares, L.K.; Aguilera, E.; Guardia, G. Interaction between Burial Depth and N Source in Drip-Fertigated Maize: Agronomic Performance and Correlation with Spectral Indices. Agric. Water Manag. 2024, 301, 108951. [Google Scholar] [CrossRef]
  29. Haefele, S.M.; Gregory, A.S.; Poulton, P.R.; Hernandez-Allica, J.; White, R.P.; McGrath, S.P. Can Grain P Concentration Be Used as an Indicator of Fertilizer Requirements in Winter Wheat? Field Crops Res. 2025, 322, 109691. [Google Scholar] [CrossRef]
  30. Grigorieva, E.; Livenets, A.; Stelmakh, E. Adaptation of Agriculture to Climate Change: A Scoping Review. Climate 2023, 11, 202. [Google Scholar] [CrossRef]
  31. Cruz Maceín, J.L.; Gonzalez-Fernandez, I.; Barrutieta, A.; Bermejo-Bermejo, V.; Zamorano Rodríguez, J.P. Adaptation Strategies for Dealing with Global Atmospheric Change in Mediterranean Agriculture: A Triple Helix Approach to the Spanish Case Study. Reg. Environ. Change 2023, 23, 142. [Google Scholar] [CrossRef]
  32. Intergovernmental Panel On Climate Change (IPCC) Climate Change 2022—Impacts, Adaptation and Vulnerability: Working Group II Contribution to the Sixth Assessment Report of the Intergovernmental Panel on Climate Change, 1st ed.; Cambridge University Press: Cambridge, UK, 2023; ISBN 978-1-009-32584-4.
  33. Giorgi, F.; Meleux, F. Modelling the Regional Effects of Climate Change on Air Quality. Comptes Rendus Géosci. 2007, 339, 721–733. [Google Scholar] [CrossRef]
  34. Drobinski, P.; Da Silva, N.; Bastin, S.; Mailler, S.; Muller, C.; Ahrens, B.; Christensen, O.B.; Lionello, P. How Warmer and Drier Will the Mediterranean Region Be at the End of the Twenty-First Century? Reg. Environ. Change 2020, 20, 78. [Google Scholar] [CrossRef]
  35. Lima, D.C.A.; Bento, V.A.; Lemos, G.; Nogueira, M.; Soares, P.M.M. A Multi-Variable Constrained Ensemble of Regional Climate Projections under Multi-Scenarios for Portugal—Part II: Sectoral Climate Indices. Clim. Serv. 2023, 30, 100377. [Google Scholar] [CrossRef]
  36. Soares, P.M.M.; Lima, D.C.A. Water Scarcity down to Earth Surface in a Mediterranean Climate: The Extreme Future of Soil Moisture in Portugal. J. Hydrol. 2022, 615, 128731. [Google Scholar] [CrossRef]
  37. Shahzad, A.; Ullah, S.; Dar, A.A.; Sardar, M.F.; Mehmood, T.; Tufail, M.A.; Shakoor, A.; Haris, M. Nexus on Climate Change: Agriculture and Possible Solution to Cope Future Climate Change Stresses. Environ. Sci. Pollut. Res. 2021, 28, 14211–14232. [Google Scholar] [CrossRef] [PubMed]
  38. Stella, T.; Webber, H.; Olesen, J.E.; Ruane, A.C.; Fronzek, S.; Bregaglio, S.; Mamidanna, S.; Bindi, M.; Collins, B.; Faye, B.; et al. Methodology to Assess the Changing Risk of Yield Failure Due to Heat and Drought Stress under Climate Change. Environ. Res. Lett. 2021, 16, 104033. [Google Scholar] [CrossRef]
  39. Prasad, P.V.V.; Bheemanahalli, R.; Jagadish, S.V.K. Field Crops and the Fear of Heat Stress—Opportunities, Challenges and Future Directions. Field Crops Res. 2017, 200, 114–121. [Google Scholar] [CrossRef]
  40. Wang, Y.; Tao, H.; Tian, B.; Sheng, D.; Xu, C.; Zhou, H.; Huang, S.; Wang, P. Flowering Dynamics, Pollen, and Pistil Contribution to Grain Yield in Response to High Temperature during Maize Flowering. Environ. Exp. Bot. 2019, 158, 80–88. [Google Scholar] [CrossRef]
  41. Ribeiro, A.F.S.; Russo, A.; Gouveia, C.M.; Páscoa, P.; Zscheischler, J. Risk of Crop Failure Due to Compound Dry and Hot Extremes Estimated with Nested Copulas. Biogeosciences 2020, 17, 4815–4830. [Google Scholar] [CrossRef]
  42. Wang, C.; Guo, E.; Wang, Y.; Jirigala, B.; Kang, Y.; Zhang, Y. Spatiotemporal Variations in Drought and Waterlogging and Their Effects on Maize Yields at Different Growth Stages in Jilin Province, China. Nat. Hazards 2023, 118, 155–180. [Google Scholar] [CrossRef]
  43. Castaño-Sánchez, J.P.; Karsten, H.D.; Rotz, C.A. Double Cropping and Manure Management Mitigate the Environmental Impact of a Dairy Farm under Present and Future Climate. Agric. Syst. 2022, 196, 103326. [Google Scholar] [CrossRef]
  44. Minoli, S.; Jägermeyr, J.; Asseng, S.; Urfels, A.; Müller, C. Global Crop Yields Can Be Lifted by Timely Adaptation of Growing Periods to Climate Change. Nat. Commun. 2022, 13, 7079. [Google Scholar] [CrossRef]
  45. Gammans, M.; Mérel, P.; Ortiz-Bobea, A. Double Cropping as an Adaptation to Climate Change in the United States. Am. J. Agric. Econ. 2024, 107, ajae.12491. [Google Scholar] [CrossRef]
  46. Meza, F.J.; Silva, D.; Vigil, H. Climate Change Impacts on Irrigated Maize in Mediterranean Climates: Evaluation of Double Cropping as an Emerging Adaptation Alternative. Agric. Syst. 2008, 98, 21–30. [Google Scholar] [CrossRef]
  47. Karandish, F.; Kalanaki, M.; Saberali, S.F. Projected Impacts of Global Warming on Cropping Calendar and Water Requirement of Maize in a Humid Climate. Arch. Agron. Soil. Sci. 2017, 63, 1–13. [Google Scholar] [CrossRef]
  48. Rolim, J.; Teixeira, J.L.; Catalão, J.; Shahidian, S. The Impacts of Climate Change on Irrigated Agriculture in Southern Portugal: Impacts of Climate Change on Irrigated Agriculture. Irrig. Drain. 2017, 66, 3–18. [Google Scholar] [CrossRef]
  49. Masia, S.; Sušnik, J.; Marras, S.; Mereu, S.; Spano, D.; Trabucco, A. Assessment of Irrigated Agriculture Vulnerability under Climate Change in Southern Italy. Water 2018, 10, 209. [Google Scholar] [CrossRef]
  50. Soares, D.; Rolim, J.; Fradinho, M.J.; Paço, T.A.D. Climate Change Impacts on Irrigation Requirements of Preserved Forage for Horses under Mediterranean Conditions. Agronomy 2020, 10, 1758. [Google Scholar] [CrossRef]
  51. Branquinho, S.; Rolim, J.; Teixeira, J.L. Climate Change Adaptation Measures in the Irrigation of a Super-Intensive Olive Orchard in the South of Portugal. Agronomy 2021, 11, 1658. [Google Scholar] [CrossRef]
  52. Masia, S.; Trabucco, A.; Spano, D.; Snyder, R.L.; Sušnik, J.; Marras, S. A Modelling Platform for Climate Change Impact on Local and Regional Crop Water Requirements. Agric. Water Manag. 2021, 255, 107005. [Google Scholar] [CrossRef]
  53. Kheiri, M.; Kambouzia, J.; Rahimi-Moghaddam, S.; Moghaddam, S.M.; Vasa, L.; Azadi, H. Effects of Agro-Climatic Indices on Wheat Yield in Arid, Semi-Arid, and Sub-Humid Regions of Iran. Reg. Environ. Change 2024, 24, 10. [Google Scholar] [CrossRef]
  54. Shiferaw, Y.G.; Ebstu, E.T.; Lohani, T.K. Representative Concentration Pathways (RCPs) Used as a Tool to Evaluate Climate Change Impact on Maize Crop Production in the Woybo Catchment of Ethiopia. J. Water Clim. Change 2024, 15, 2714–2730. [Google Scholar] [CrossRef]
  55. Fader, M.; Shi, S.; Von Bloh, W.; Bondeau, A.; Cramer, W. Mediterranean Irrigation under Climate Change: More Efficient Irrigation Needed to Compensate for Increases in Irrigation Water Requirements. Hydrol. Earth Syst. Sci. 2016, 20, 953–973. [Google Scholar] [CrossRef]
  56. Hatfield, J.L.; Dold, C. Water-Use Efficiency: Advances and Challenges in a Changing Climate. Front. Plant Sci. 2019, 10, 103. [Google Scholar] [CrossRef]
  57. Islam, A.T.; Islam, A.S.; Islam, G.T.; Bala, S.K.; Salehin, M.; Choudhury, A.K.; Dey, N.C.; Hossain, A. Adaptation Strategies to Increase Water Productivity of Wheat under Changing Climate. Agric. Water Manag. 2022, 264, 107499. [Google Scholar] [CrossRef]
  58. Ferreira, A.; Rolim, J.; Paredes, P.; Cameira, M.D.R. Methodologies for Water Accounting at the Collective Irrigation System Scale Aiming at Optimizing Water Productivity. Agronomy 2023, 13, 1938. [Google Scholar] [CrossRef]
  59. Paulo, A.A.; Rosa, R.D.; Pereira, L.S. Climate Trends and Behaviour of Drought Indices Based on Precipitation and Evapotranspiration in Portugal. Nat. Hazards Earth Syst. Sci. 2012, 12, 1481–1491. [Google Scholar] [CrossRef]
  60. Vicente-Serrano, S.M.; Lopez-Moreno, J.-I.; Beguería, S.; Lorenzo-Lacruz, J.; Sanchez-Lorenzo, A.; García-Ruiz, J.M.; Azorin-Molina, C.; Morán-Tejeda, E.; Revuelto, J.; Trigo, R.; et al. Evidence of Increasing Drought Severity Caused by Temperature Rise in Southern Europe. Environ. Res. Lett. 2014, 9, 044001. [Google Scholar] [CrossRef]
  61. Páscoa, P.; Russo, A.; Gouveia, C.M.; Soares, P.M.M.; Cardoso, R.M.; Careto, J.A.M.; Ribeiro, A.F.S. A High-Resolution View of the Recent Drought Trends over the Iberian Peninsula. Weather Clim. Extrem. 2021, 32, 100320. [Google Scholar] [CrossRef]
  62. Soares, P.M.M.; Careto, J.A.M.; Russo, A.; Lima, D.C.A. The Future of Iberian Droughts: A Deeper Analysis Based on Multi-Scenario and a Multi-Model Ensemble Approach. Nat. Hazards 2023, 117, 2001–2028. [Google Scholar] [CrossRef]
  63. Soares, D.; Paço, T.A.; Rolim, J. Assessing Climate Change Impacts on Irrigation Water Requirements under Mediterranean Conditions—A Review of the Methodological Approaches Focusing on Maize Crop. Agronomy 2022, 13, 117. [Google Scholar] [CrossRef]
  64. Cardoso, R.M.; Soares, P.M.M.; Lima, D.C.A.; Miranda, P.M.A. Mean and Extreme Temperatures in a Warming Climate: EURO CORDEX and WRF Regional Climate High-Resolution Projections for Portugal. Clim. Dyn. 2019, 52, 129–157. [Google Scholar] [CrossRef]
  65. Spinoni, J.; Naumann, G.; Vogt, J.V. Pan-European Seasonal Trends and Recent Changes of Drought Frequency and Severity. Glob. Planet. Change 2017, 148, 113–130. [Google Scholar] [CrossRef]
  66. Webber, H.; Ewert, F.; Olesen, J.E.; Müller, C.; Fronzek, S.; Ruane, A.C.; Bourgault, M.; Martre, P.; Ababaei, B.; Bindi, M.; et al. Diverging Importance of Drought Stress for Maize and Winter Wheat in Europe. Nat. Commun. 2018, 9, 4249. [Google Scholar] [CrossRef]
  67. Lizaso, J.I.; Ruiz-Ramos, M.; Rodríguez, L.; Gabaldon-Leal, C.; Oliveira, J.A.; Lorite, I.J.; Rodríguez, A.; Maddonni, G.A.; Otegui, M.E. Modeling the Response of Maize Phenology, Kernel Set, and Yield Components to Heat Stress and Heat Shock with CSM-IXIM. Field Crops Res. 2017, 214, 239–254. [Google Scholar] [CrossRef]
  68. Kamali, B.; Lorite, I.J.; Webber, H.A.; Rezaei, E.E.; Gabaldon-Leal, C.; Nendel, C.; Siebert, S.; Ramirez-Cuesta, J.M.; Ewert, F.; Ojeda, J.J. Uncertainty in Climate Change Impact Studies for Irrigated Maize Cropping Systems in Southern Spain. Sci. Rep. 2022, 12, 4049. [Google Scholar] [CrossRef] [PubMed]
  69. Gabaldón-Leal, C.; Webber, H.; Otegui, M.E.; Slafer, G.A.; Ordóñez, R.A.; Gaiser, T.; Lorite, I.J.; Ruiz-Ramos, M.; Ewert, F. Modelling the Impact of Heat Stress on Maize Yield Formation. Field Crops Res. 2016, 198, 226–237. [Google Scholar] [CrossRef]
  70. Hadi Pour, S.; Abd Wahab, A.; Shahid, S.; Wang, X. Spatial Pattern of the Unidirectional Trends in Thermal Bioclimatic Indicators in Iran. Sustainability 2019, 11, 2287. [Google Scholar] [CrossRef]
  71. Freitas, T.R.; Santos, J.A.; Paredes, P.; Fraga, H. Future Aridity and Drought Risk for Traditional and Super-Intensive Olive Orchards in Portugal. Clim. Change 2024, 177, 155. [Google Scholar] [CrossRef]
  72. Noce, S.; Caporaso, L.; Santini, M. A New Global Dataset of Bioclimatic Indicators. Sci. Data 2020, 7, 398. [Google Scholar] [CrossRef]
  73. Sobh, M.T.; Hamed, M.M.; Nashwan, M.S.; Shahid, S. Future Projection of Precipitation Bioclimatic Indicators over Southeast Asia Using CMIP6. Sustainability 2022, 14, 13596. [Google Scholar] [CrossRef]
  74. Hamed, M.M.; Nashwan, M.S.; Shahid, S.; Ismail, T.B.; Dewan, A.; Asaduzzaman, M. Thermal Bioclimatic Indicators over Southeast Asia: Present Status and Future Projection Using CMIP6. Environ. Sci. Pollut. Res. 2022, 29, 91212–91231. [Google Scholar] [CrossRef]
  75. Gaitán, E.; Pino-Otín, M.R. Using Bioclimatic Indicators to Assess Climate Change Impacts on the Spanish Wine Sector. Atmos. Res. 2023, 286, 106660. [Google Scholar] [CrossRef]
  76. Hatfield, J.L.; Boote, K.J.; Kimball, B.A.; Ziska, L.H.; Izaurralde, R.C.; Ort, D.; Thomson, A.M.; Wolfe, D. Climate Impacts on Agriculture: Implications for Crop Production. Agron. J. 2011, 103, 351–370. [Google Scholar] [CrossRef]
  77. Zhang, Z.; Yang, X.; Liu, Z.; Bai, F.; Sun, S.; Nie, J.; Gao, J.; Ming, B.; Xie, R.; Li, S. Spatio-Temporal Characteristics of Agro-Climatic Indices and Extreme Weather Events during the Growing Season for Summer Maize (Zea mays L.) in Huanghuaihai Region, China. Int. J. Biometeorol. 2020, 64, 827–839. [Google Scholar] [CrossRef] [PubMed]
  78. Raes, D.; Steduto, P.; Hsiao, T.C.; Fereres, E. Crop Water Productivity. Calculation Procedures and Calibration Guidance, AquaCrop version 4.0; FAO: Rome, Italy, 2012. [Google Scholar]
  79. Pereira, L.S.; Allen, R.; Paredes, P.; Smith, M.; Raes, D.; Salman, M. FAO Irrigation & Drainage paper 56rev, Rome. 2025; in press. [Google Scholar]
  80. Beck, H.E.; Zimmermann, N.E.; McVicar, T.R.; Vergopolan, N.; Berg, A.; Wood, E.F. Present and Future Köppen-Geiger Climate Classification Maps at 1-Km Resolution. Sci. Data 2018, 5, 180214. [Google Scholar] [CrossRef] [PubMed]
  81. Andrade, C.; Fonseca, A.; Santos, J.A.; Bois, B.; Jones, G.V. Historic Changes and Future Projections in Köppen–Geiger Climate Classifications in Major Wine Regions Worldwide. Climate 2024, 12, 94. [Google Scholar] [CrossRef]
  82. Wouters, H.; Berckmans, J.; Maes, R.; Vanuytrecht, E.; De Ridder, K. Downscaled Bioclimatic Indicators for Selected Regions from 1950 to 2100 Derived from Climate Projections. Copernicus Climate Change Service (C3S) Climate Data Store (CDS). 2021. Available online: https://cds.climate.copernicus.eu/datasets/sis-biodiversity-cmip5-regional?tab=overview (accessed on 13 December 2024).
  83. Cabré, M.F.; Quénol, H.; Nuñez, M. Regional Climate Change Scenarios Applied to Viticultural Zoning in Mendoza, Argentina. Int. J. Biometeorol. 2016, 60, 1325–1340. [Google Scholar] [CrossRef]
  84. Adão, F.; Campos, J.C.; Santos, J.A.; Malheiro, A.C.; Fraga, H. Relocation of Bioclimatic Suitability of Portuguese Grapevine Varieties under Climate Change Scenarios. Front. Plant Sci. 2023, 14, 974020. [Google Scholar] [CrossRef]
  85. Rodrigo-Comino, J.; Salvia, R.; Quaranta, G.; Cudlín, P.; Salvati, L.; Gimenez-Morera, A. Climate Aridity and the Geographical Shift of Olive Trees in a Mediterranean Northern Region. Climate 2021, 9, 64. [Google Scholar] [CrossRef]
  86. Chou, C.; Marcos-Matamoros, R.; López-Nevado, J.; López-Feria, S.; González-Reviriego, N. Comparison of Five Strategies for Seasonal Prediction of Bioclimatic Indicators in the Olive Sector. Clim. Serv. 2023, 30, 100345. [Google Scholar] [CrossRef]
  87. Özdel, M.M.; Ustaoğlu, B.; Cürebal, İ. Modeling of the Potential Distribution Areas Suitable for Olive (Olea europaea L.) in Türkiye from a Climate Change Perspective. Agriculture 2024, 14, 1629. [Google Scholar] [CrossRef]
  88. Yue, Y.; Zhang, P.; Shang, Y. The Potential Global Distribution and Dynamics of Wheat under Multiple Climate Change Scenarios. Sci. Total Environ. 2019, 688, 1308–1318. [Google Scholar] [CrossRef]
  89. Olfert, O.; Weiss, R.M.; Catton, H.; Cárcamo, H.; Meers, S. Bioclimatic Assessment of Abiotic Factors Affecting Relative Abundance and Distribution of Wheat Stem Sawfly (Hymenoptera: Cephidae) in Western Canada. Can. Entomol. 2019, 151, 16–33. [Google Scholar] [CrossRef]
  90. Akpoti, K.; Groen, T.; Dossou-Yovo, E.; Kabo-bah, A.T.; Zwart, S.J. Climate Change-Induced Reduction in Agricultural Land Suitability of West-Africa’s Inland Valley Landscapes. Agric. Syst. 2022, 200, 103429. [Google Scholar] [CrossRef]
  91. Kamruzzaman, M.; Shariot-Ullah, M.; Islam, R.; Amin, M.G.M.; Islam, H.M.T.; Ahmed, S.; Yildiz, S.; Muktadir, A.; Shahid, S. Projections of Future Bioclimatic Indicators Using Bias-Corrected CMIP6 Models: A Case Study in a Tropical Monsoon Region. Environ. Sci. Pollut. Res. 2024, 31, 64596–64627. [Google Scholar] [CrossRef] [PubMed]
  92. Feng, L.; Wang, H.; Ma, X.; Peng, H.; Shan, J. Modeling the Current Land Suitability and Future Dynamics of Global Soybean Cultivation under Climate Change Scenarios. Field Crops Res. 2021, 263, 108069. [Google Scholar] [CrossRef]
  93. Villa-Falfán, C.; Valdés-Rodríguez, O.A.; Vázquez-Aguirre, J.L.; Salas-Martínez, F. Climate Indices and Their Impact on Maize Yield in Veracruz, Mexico. Atmosphere 2023, 14, 778. [Google Scholar] [CrossRef]
  94. Correia, C.D.N.C.; Amraoui, M.; Santos, J.C.A. Impacts of Climate Change on Agriculture in Angola: Analysis of Agroclimatic and Bioclimatic Indicators. 2024. Available online: https://www.preprints.org/manuscript/202403.0723/v1 (accessed on 5 January 2025).
  95. Charalampopoulos, I. Agrometeorological Conditions and Agroclimatic Trends for the Maize and Wheat Crops in the Balkan Region. Atmosphere 2021, 12, 671. [Google Scholar] [CrossRef]
  96. Fraga, H.; Malheiro, A.C.; Moutinho-Pereira, J.; Jones, G.V.; Alves, F.; Pinto, J.G.; Santos, J.A. Very High Resolution Bioclimatic Zoning of Portuguese Wine Regions: Present and Future Scenarios. Reg. Environ. Change 2014, 14, 295–306. [Google Scholar] [CrossRef]
  97. Blanco-Ward, D.; Ribeiro, A.; Barreales, D.; Castro, J.; Verdial, J.; Feliciano, M.; Viceto, C.; Rocha, A.; Carlos, C.; Silveira, C.; et al. Climate Change Potential Effects on Grapevine Bioclimatic Indices: A Case Study for the Portuguese Demarcated Douro Region (Portugal). BIO Web Conf. 2019, 12, 01013. [Google Scholar] [CrossRef]
  98. Freitas, T.R.; Santos, J.A.; Silva, A.P.; Fraga, H. Modelo regional da previsão da produção da amêndoa na região agrária de Trás-os-Montes. Rev. Ciências Agrárias 2023, 46, 117–124. [Google Scholar] [CrossRef]
  99. Silveira, C.; Almeida, A.; Ribeiro, A.C. How Can a Changing Climate Influence the Productivity of Traditional Olive Orchards? Regression Analysis Applied to a Local Case Study in Portugal. Climate 2023, 11, 123. [Google Scholar] [CrossRef]
  100. Freitas, T.R.; Santos, J.A.; Silva, A.P.; Martins, J.; Fraga, H. Climate Change Projections for Bioclimatic Distribution of Castanea Sativa in Portugal. Agronomy 2022, 12, 1137. [Google Scholar] [CrossRef]
  101. Santos, J.A.; Costa, R.; Fraga, H. Climate Change Impacts on Thermal Growing Conditions of Main Fruit Species in Portugal. Clim. Change 2017, 140, 273–286. [Google Scholar] [CrossRef]
  102. Andrade, C.; Fonseca, A.; Santos, J.A. Are Land Use Options in Viticulture and Oliviculture in Agreement with Bioclimatic Shifts in Portugal? Land 2021, 10, 869. [Google Scholar] [CrossRef]
  103. Fraga, H.; Guimarães, N.; Santos, J. Future Changes in Rice Bioclimatic Growing Conditions in Portugal. Agronomy 2019, 9, 674. [Google Scholar] [CrossRef]
  104. Nguyen, T.P.L.; Seddaiu, G.; Roggero, P.P. Declarative or Procedural Knowledge? Knowledge for Enhancing Farmers’ Mitigation and Adaptation Behaviour to Climate Change. J. Rural Stud. 2019, 67, 46–56. [Google Scholar] [CrossRef]
  105. Leip, A.; Wollgast, J.; Kugelberg, S.; Leite, J.C.; Maas, R.J.; Mason, K.E.; Sutton, M.A. Appetite for Change: Food System Options for Nitrogen, Environment & Health. In European Nitrogen Assessment Special Report on Nitrogen & Food; UK Centre for Ecology & Hydrology: Edinburgh, UK, 2023; Volume 2, ISBN 978-1-906698-83-6. [Google Scholar]
  106. Pereira, L.S.; Paredes, P.; Hunsaker, D.J.; López-Urrea, R.; Mohammadi Shad, Z. Standard Single and Basal Crop Coefficients for Field Crops. Updates and Advances to the FAO56 Crop Water Requirements Method. Agric. Water Manag. 2021, 243, 106466. [Google Scholar] [CrossRef]
  107. Ramos, T.B.; Horta, A.; Gonçalves, M.C.; Pires, F.P.; Duffy, D.; Martins, J.C. The INFOSOLO Database as a First Step towards the Development of a Soil Information System in Portugal. CATENA 2017, 158, 390–412. [Google Scholar] [CrossRef]
  108. Kottek, M.; Grieser, J.; Beck, C.; Rudolf, B.; Rubel, F. World Map of the Köppen-Geiger Climate Classification Updated. Meterol 2006, 15, 259–263. [Google Scholar] [CrossRef]
  109. Hersbach, H.; Bell, B.; Berrisford, P.; Hirahara, S.; Horányi, A.; Muñoz-Sabater, J.; Nicolas, J.; Peubey, C.; Radu, R.; Schepers, D.; et al. The ERA5 global reanalysis. Q. J. R. Meteorol. Soc. 2020, 146, 1999–2049. [Google Scholar] [CrossRef]
  110. Wouters, H.; Berckmans, J.; Maes, R.; Vanuytrecht, E.; De Ridder, K. Global Bioclimatic Indicators from 1950 to 2100 Derived from Climate Projections. Copernicus Climate Change Service (C3S) Climate Data Store (CDS). 2021. Available online: https://cds.climate.copernicus.eu/datasets/sis-biodiversity-cmip5-global?tab=overview (accessed on 5 January 2025).
  111. Berdugo, M.; Delgado-Baquerizo, M.; Soliveres, S.; Hernández-Clemente, R.; Zhao, Y.; Gaitán, J.J.; Gross, N.; Saiz, H.; Maire, V.; Lehmann, A.; et al. Global Ecosystem Thresholds Driven by Aridity. Science 2020, 367, 787–790. [Google Scholar] [CrossRef]
  112. Mcmaster, G. Growing Degree-Days: One Equation, Two Interpretations. Agric. For. Meteorol. 1997, 87, 291–300. [Google Scholar] [CrossRef]
  113. Steduto, P.; Hsiao, T.C.; Fereres, E.; Raes, D. Crop Yield Response to Water. In FAO Irrigation and Drainage Paper 66; FAO: Rome, Italy, 2012; p. 500. [Google Scholar]
  114. Kendall, M.G. A New Measure of Rank Correlation. Biometrika 1938, 30, 81–93. [Google Scholar] [CrossRef]
  115. Barros, J.F.C.; Calado, J.G. A Cultura do Milho; Universidade de Évora: Évora, Portugal, 2014; Volume 1, pp. 1–52. Available online: http://hdl.handle.net/10174/10804 (accessed on 5 January 2025).
  116. Norberto, M.; Sillero, N.; Coimbra, J.; Cunha, M. Filling the Maize Yield Gap Based on Precision Agriculture—A MaxEnt Approach. Comput. Electron. Agric. 2023, 211, 107970. [Google Scholar] [CrossRef]
  117. Giménez, P.O.; García-Galiano, S.G. Assessing Regional Climate Models (RCMs) Ensemble-Driven Reference Evapotranspiration over Spain. Water 2018, 10, 1181. [Google Scholar] [CrossRef]
  118. Pereira, S.C.; Carvalho, D.; Rocha, A. Temperature and Precipitation Extremes over the Iberian Peninsula under Climate Change Scenarios: A Review. Climate 2021, 9, 139. [Google Scholar] [CrossRef]
  119. Pires, V.; Cota, T.M.; Silva, A. Observações alteradas no clima atual e cenários climáticos em Portugal Continental-influência no setor agrícola. Cultivar 2018, 12, 57–67. [Google Scholar]
  120. Hussain, A.; Bangash, R. Impact of Climate Change on Crops’ Productivity across Selected Agro-Ecological Zones in Pakistan. Pak. Dev. Rev. 2017, 56, 163–187. [Google Scholar]
  121. Maitah, M.; Malec, K.; Maitah, K. Influence of Precipitation and Temperature on Maize Production in the Czech Republic from 2002 to 2019. Sci. Rep. 2021, 11, 10467. [Google Scholar] [CrossRef]
  122. Shahzad, M.; Hussain, M.; Farooq, M.; Farooq, S.; Jabran, K.; Nawaz, A. Economic Assessment of Conventional and Conservation Tillage Practices in Different Wheat-Based Cropping Systems of Punjab, Pakistan. Environ. Sci. Pollut. Res. 2017, 24, 24634–24643. [Google Scholar] [CrossRef]
  123. Espinosa, L.A.; Portela, M.M.; Gharbia, S. Assessing Changes in Exceptional Rainfall in Portugal Using ERA5-Land Reanalysis Data (1981/1982–2022/2023). Water 2024, 16, 628. [Google Scholar] [CrossRef]
  124. Lavers, D.A.; Simmons, A.; Vamborg, F.; Rodwell, M.J. An Evaluation of ERA5 Precipitation for Climate Monitoring. Q. J. R. Meteorol. Soc. 2022, 148, 3152–3165. [Google Scholar] [CrossRef]
  125. Malayeri, A.K.; Saghafian, B.; Raziei, T. Performance Evaluation of ERA5 Precipitation Estimates across Iran. Arab. J. Geosci. 2021, 14, 2676. [Google Scholar] [CrossRef]
  126. Yang, C.; Fraga, H.; Van Ieperen, W.; Trindade, H.; Santos, J.A. Effects of Climate Change and Adaptation Options on Winter Wheat Yield under Rainfed Mediterranean Conditions in Southern Portugal. Clim. Change 2019, 154, 159–178. [Google Scholar] [CrossRef]
  127. Claro, A.M.; Fonseca, A.; Fraga, H.; Santos, J.A. Susceptibility of Iberia to Extreme Precipitation and Aridity: A New High-Resolution Analysis over an Extended Historical Period. Water 2023, 15, 3840. [Google Scholar] [CrossRef]
  128. Irwandi, H.; Rosid, M.S.; Mart, T. Effects of Climate Change on Temperature and Precipitation in the Lake Toba Region, Indonesia, Based on ERA5-Land Data with Quantile Mapping Bias Correction. Sci. Rep. 2023, 13, 2542. [Google Scholar] [CrossRef]
  129. Fonseca, A.; Cruz, J.; Fraga, H.; Andrade, C.; Valente, J.; Alves, F.; Neto, A.C.; Flores, R.; Santos, J.A. Vineyard Microclimatic Zoning as a Tool to Promote Sustainable Viticulture under Climate Change. Sustainability 2024, 16, 3477. [Google Scholar] [CrossRef]
  130. Rocha, J.; Carvalho-Santos, C.; Diogo, P.; Beça, P.; Keizer, J.J.; Nunes, J.P. Impacts of Climate Change on Reservoir Water Availability, Quality and Irrigation Needs in a Water Scarce Mediterranean Region (Southern Portugal). Sci. Total Environ. 2020, 736, 139477. [Google Scholar] [CrossRef]
  131. Corwin, D.L. Climate Change Impacts on Soil Salinity in Agricultural Areas. Eur. J. Soil Sci. 2021, 72, 842–862. [Google Scholar] [CrossRef]
  132. Carvalho, D.; Pereira, S.C.; Silva, R.; Rocha, A. Aridity and Desertification in the Mediterranean under EURO-CORDEX Future Climate Change Scenarios. Clim. Change 2022, 174, 28. [Google Scholar] [CrossRef]
  133. Moral, F.J.; Aguirado, C.; Alberdi, V.; Paniagua, L.L.; García-Martín, A.; Rebollo, F.J. Future Scenarios for Aridity under Conditions of Global Climate Change in Extremadura, Southwestern Spain. Land 2023, 12, 536. [Google Scholar] [CrossRef]
  134. Kogo, B.K.; Kumar, L.; Koech, R. Climate Change and Variability in Kenya: A Review of Impacts on Agriculture and Food Security. Environ. Dev. Sustain. 2021, 23, 23–43. [Google Scholar] [CrossRef]
  135. Xu, F.; Wang, B.; He, C.; Liu, D.L.; Feng, P.; Yao, N.; Zhang, R.; Xu, S.; Xue, J.; Feng, H.; et al. Optimizing Sowing Date and Planting Density Can Mitigate the Impacts of Future Climate on Maize Yield: A Case Study in the Guanzhong Plain of China. Agronomy 2021, 11, 1452. [Google Scholar] [CrossRef]
  136. He, Y.; Xiong, W.; Hu, P.; Huang, D.; Feurtado, J.A.; Zhang, T.; Hao, C.; DePauw, R.; Zheng, B.; Hoogenboom, G.; et al. Climate Change Enhances Stability of Wheat-Flowering-Date. Sci. Total Environ. 2024, 917, 170305. [Google Scholar] [CrossRef] [PubMed]
  137. Samela, C.; Imbrenda, V.; Coluzzi, R.; Pace, L.; Simoniello, T.; Lanfredi, M. Multi-Decadal Assessment of Soil Loss in a Mediterranean Region Characterized by Contrasting Local Climates. Land 2022, 11, 1010. [Google Scholar] [CrossRef]
  138. Busico, G.; Grilli, E.; Carvalho, S.C.P.; Mastrocicco, M.; Castaldi, S. Assessing Soil Erosion Susceptibility for Past and Future Scenarios in Semiarid Mediterranean Agroecosystems. Sustainability 2023, 15, 12992. [Google Scholar] [CrossRef]
  139. Pari, L.; Cozzolino, L.; Bergonzoli, S. Rainwater: Harvesting and Storage through a Flexible Storage System to Enhance Agricultural Resilience. Agriculture 2023, 13, 2289. [Google Scholar] [CrossRef]
  140. Kheir, A.M.S.; Elnashar, A.; Mosad, A.; Govind, A. An Improved Deep Learning Procedure for Statistical Downscaling of Climate Data. Heliyon 2023, 9, e18200. [Google Scholar] [CrossRef]
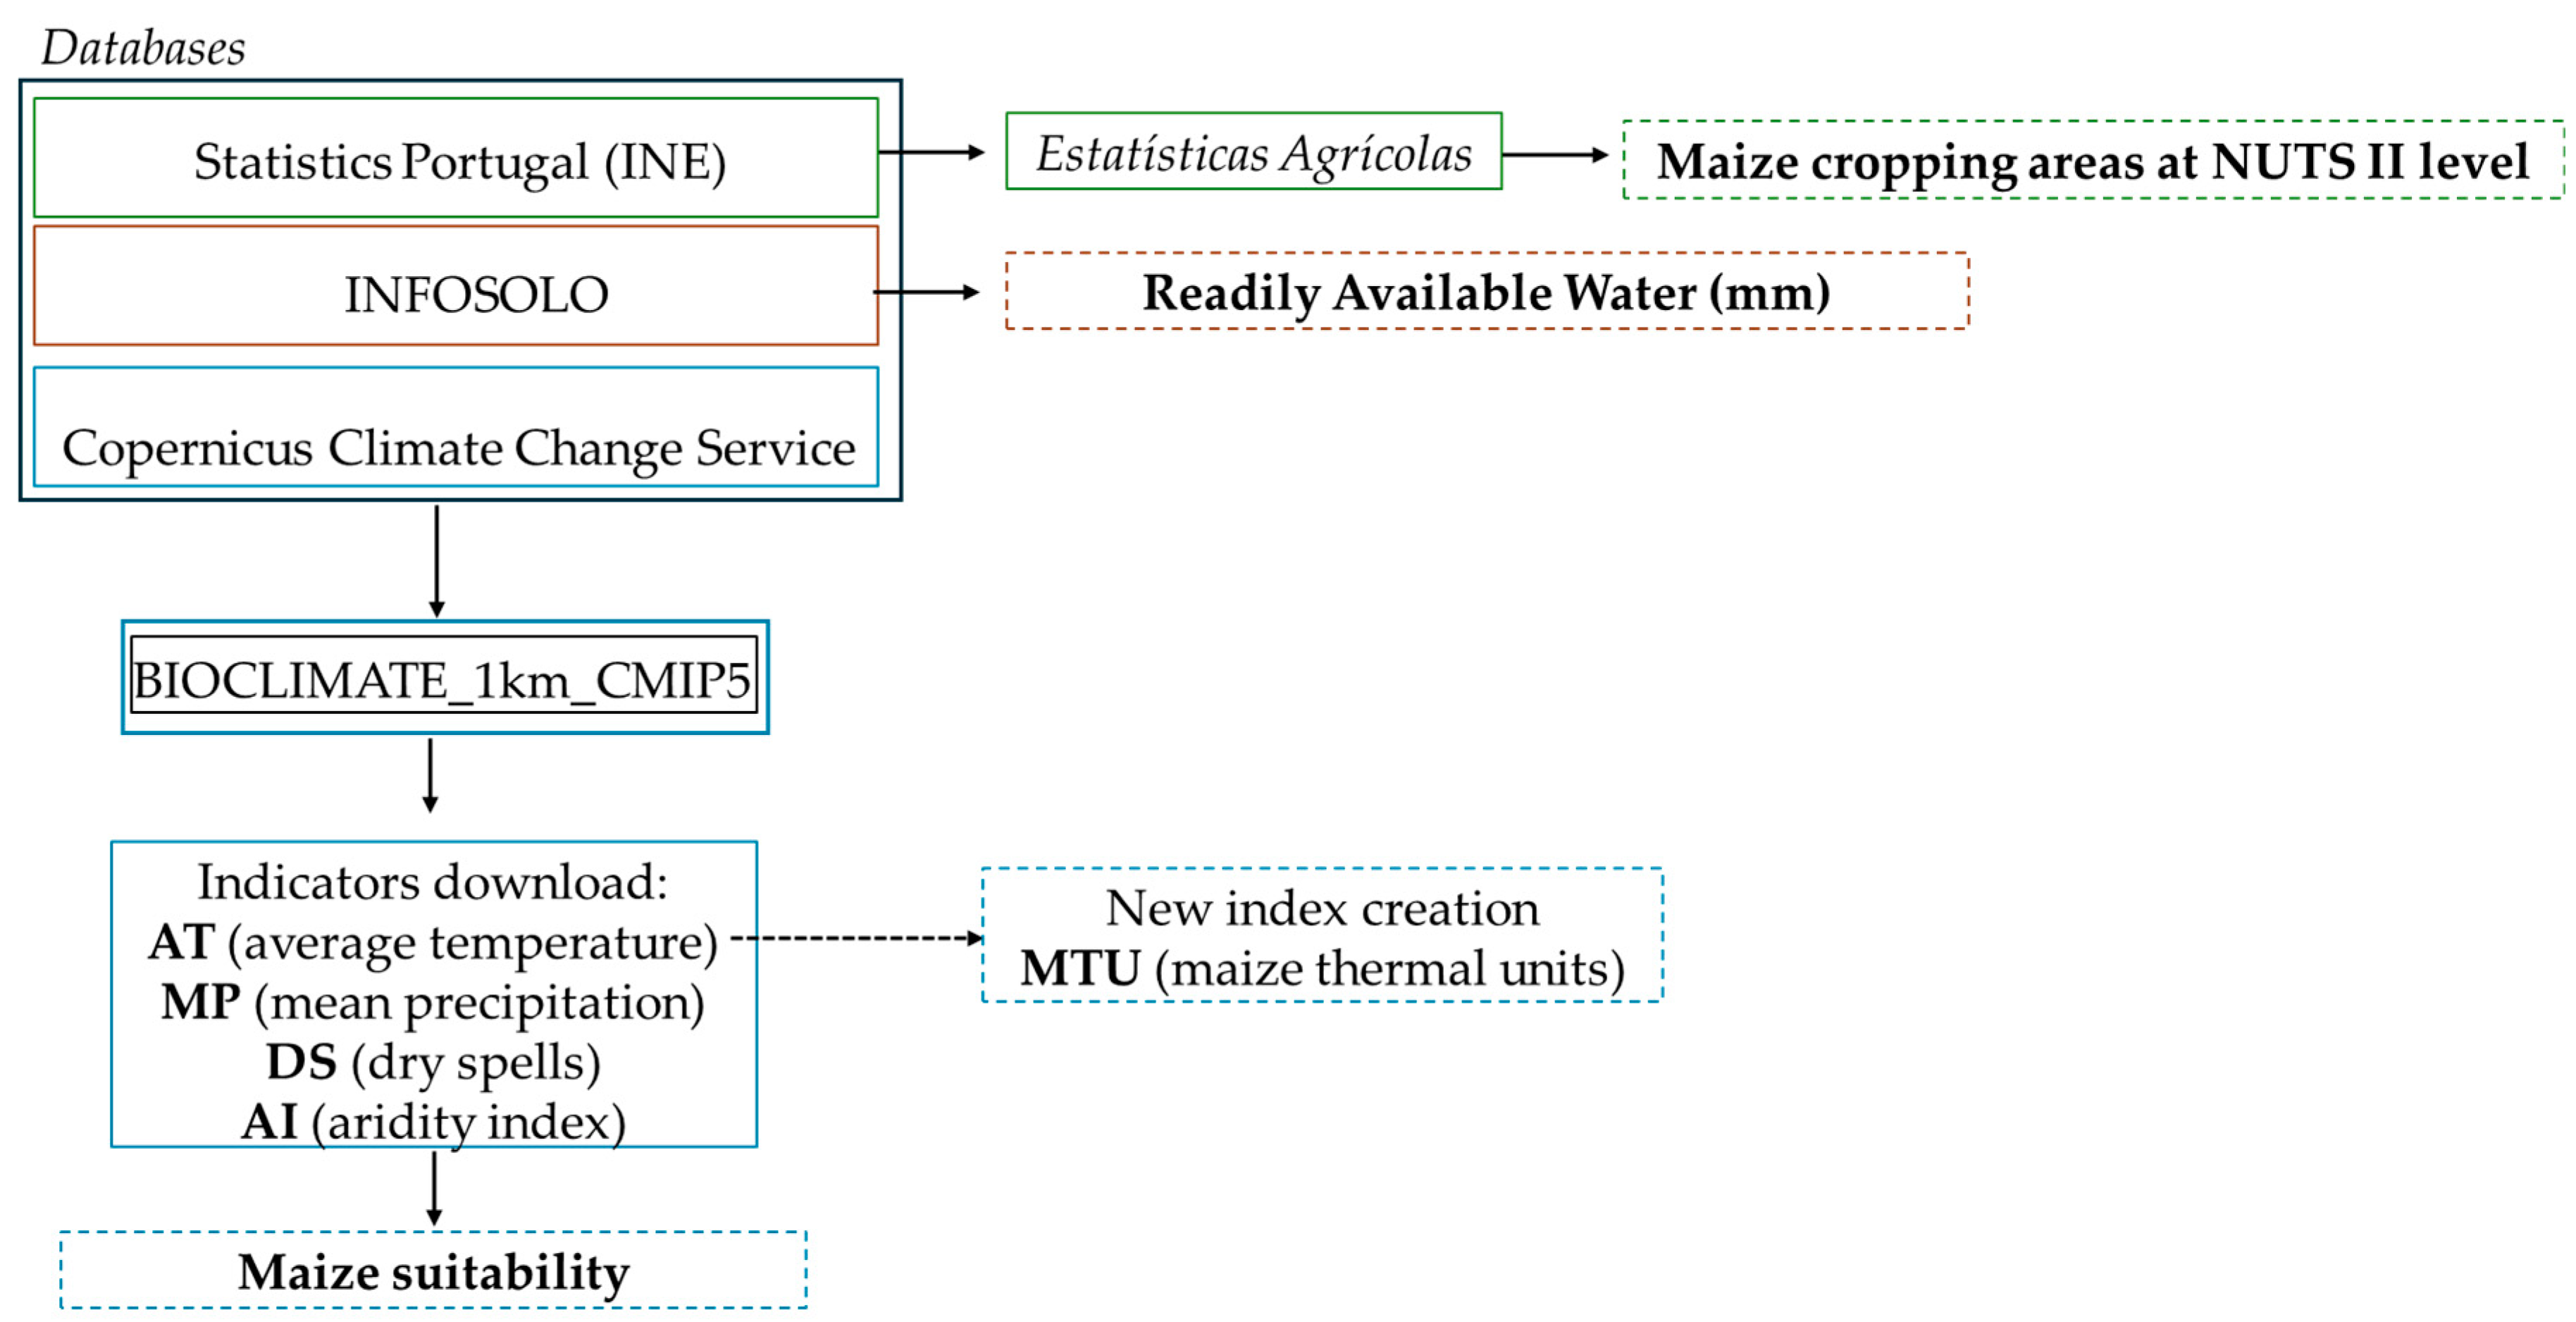
Figure 1. Flowchart of the designed methodology.
Agronomy 15 00592 g001
Figure 2. Location of mainland Portugal and its NUT II regions.
Agronomy 15 00592 g002
Figure 3. Overview of the average maize (grain and silage) area as a percentage of the total agricultural area in each NUT II region of Portugal (a); evolution of the grain maize (b) and silage maize (c) area and production (lines) in the NUT II regions of Portugal, 2011–2022.
Agronomy 15 00592 g003
Figure 4. Monthly mean average temperature (AT) from April to October for the baseline (1971–2000); near-term future (2011–2040); medium-term future (2040–2070); and long-term future (2071–2100) periods and representative concentration pathways (RCP4.5 and RCP8.5) under study.
Agronomy 15 00592 g004
Figure 5. Seasonal accumulated precipitation (MP) based on monthly means from April to October (maize growing season) for the periods (baseline (1971–2000); near-term future (2011–2040); medium-term future (2040–2070); long-term future (2071–2100)) and representative concentration pathways (RCP4.5 and RCP8.5) under study.
Agronomy 15 00592 g005
Figure 6. Dry spells (DSs) for the baseline (1971–2000); near-term future (2011–2040); medium-term future (2040–2070); and long-term future (2071–2100) periods and representative concentration pathways (RCP4.5 and RCP8.5) under study.
Agronomy 15 00592 g006
Figure 7. Aridity index (AI) for the baseline (1971–2000); near-term future (2011–2040); medium-term future (2040–2070); and long-term future (2071–2100) periods and representative concentration pathways (RCP4.5 and RCP8.5) under study.
Agronomy 15 00592 g007
Figure 8. Maize thermal units (MTUs) considering the maize growing season for the periods (baseline (1971–2000); near-term future (2011–2040); medium-term future (2040–2070); long-term future (2071–2100)) and representative concentration pathways (RCP4.5 and RCP8.5) under study.
Agronomy 15 00592 g008
Figure 9. Readily available soil water (RAW) for Portugal, adapted from the INFOSOLO database.
Agronomy 15 00592 g009
Table 1. Ensemble of GCMs designated for the study.
Global Circulation ModelInstitute
ACCESS1-0Bureau of Meteorology & CSIRO, Australia
CSIRO-Mk3.6.0CSIRO, Australia
HadGEM2-CCMet Office, UK
GFDL-ESM2MNOAA, USA
Table 2. Description of bioclimatic indicators retrieved from BIOCLIMATE_1km_CMIP5 [110].
IndicatorAcronymDescription
Mean precipitationMPAverage over the daily mean precipitation.
Average temperatureATThe monthly mean of the daily mean temperature at 2 m above the surface.
Aridity IndexAIMonthly potential evapotranspiration is divided by the monthly mean precipitation averaged over the year.
Dry spellsDSMean length of dry spells with a minimum of 5 days within a year.
Table 3. Results of the trend test for different Portuguese regions, at each NUT II level, for production, area, and productivity from 2011 to 2022.
RegionStatistics (Tau)p-Value
Area (ha)Norte−0.930.00
Centro−0.530.03
AML−0.530.03
Alentejo−0.420.09 a
Algarve−0.530.03
Production (t)Norte−0.450.06 a
Centro−0.021.00 a
AML−0.600.01
Alentejo−0.420.09 a
Algarve−0.200.44 a
Productivity (t ha−1)Norte0.350.16 a
Centro0.750.00
AML−0.090.76 a
Alentejo0.310.21 a
Algarve0.420.09 a
a indicates that the p-value is close to the 0.05 significance threshold, suggesting a trend that is not statistically significant at the 95% confidence level; AML means Área Metropolitana de Lisboa.
Table 4. Maize thermal units and their correspondence to FAO maize varieties. Adapted from Pereira et al. 2025 [79].
MTU (°C)FAO VarietyMaize Production
<1500<FAO 400 (short varieties)Mainly silage
1500–2000All above Grain
>2000All above *Grain
* corresponds to a scenario where different adaptation measures such as sowing dates can be applied.
Table 5. Bioclimatic indicator results for the Coruche region as a case study, considering the periods and the representative concentration pathways under study.
Average RCP4.5RCP8.5
1971–20002011–20402041–20702071–21002011–20402041–20702071–2100
AT (°C)19.520.521.722.220.522.424.0
MP (mm)214.4173.2146.0129.1174.8138.8124.0
IA0.50.50.60.60.50.60.6
DS (days)19.021.023.023.022.023.026.0
MTU (°C)2037.62249.02500.02603.52258.62647.62996.5
RAW (mm)39.3
AT—average temperature during the maize growing season; MP—accumulated mean precipitation during the maize growing season; IA—aridity index; DS—dry spells; MTU—maize thermal units; RAW—readily available water.
Disclaimer/Publisher’s Note: The statements, opinions and data contained in all publications are solely those of the individual author(s) and contributor(s) and not of MDPI and/or the editor(s). MDPI and/or the editor(s) disclaim responsibility for any injury to people or property resulting from any ideas, methods, instructions or products referred to in the content.