Abstract
Rice (Oryza sativa L.), a staple crop vital to global food security, faces escalating threats from climate change and inefficient nitrogen management. This study employed least absolute shrinkage and selection operator (LASSO) regression to analyze the stage-specific impacts of nitrogen application, temperature, and rainfall on rice yield and nitrogen use efficiency (NUE) across three growing seasons (2020–2022) in Jiangsu Province, China. The key findings revealed the following: (1) the reproductive stages (flowering and filling stages) exhibited extreme thermal sensitivity, with high temperatures (>35 °C) causing substantial yield losses (33.1% average) and reducing nitrogen recovery efficiency (NRE: 22.4–60.5% loss) and the nitrogen translocation ratio (NTR: 26.3–61.6% loss); (2) the vegetative stages (tillering and jointing and booting stages) were highly rainfall-sensitive, with rainfall during tillering (2.1–9.7 mm/day) influencing 50% of the traits, including four NUE types; (3) appropriate nitrogen management (250–350 kgN·ha−1) mitigated the heat-induced losses, increasing physiological nitrogen use efficiency (PNUE) by 30.0–41.8% under extreme heat and alleviating the losses of yield. This study further verified the generalizability of LASSO. Compared with the traditional models, LASSO overcomes the issue of multicollinearity and can more effectively identify the key factors driving climate change across different spatial gradients. These findings provide actionable insights for optimizing nitrogen application timing, improving climate-resilient breeding, and developing stage-specific adaptation strategies to safeguard rice productivity under global warming.
1. Introduction
Climate change has become one of the most pressing environmental challenges facing the world today. The data show that from 1951 to 2021, the average annual temperature in China increased by 1.82 °C, with the frequency of high-temperature disasters in rice growing areas, especially in the middle and lower reaches of the Yangtze River, significantly increasing. High-temperature stress, particularly during the flowering stage, has become a common issue for rice production [1]. The primary drivers of climate change are human activities that result in the excessive emission of greenhouse gases, such as carbon dioxide, methane, and nitrous oxide, into the atmosphere. Agriculture is one of the major sources of greenhouse gas emissions, with methane and nitrous oxide accounting for about 50% and 60% of global anthropogenic emissions, respectively. Without effective mitigation measures, it is estimated that by 2030, methane and nitrous oxide emissions from agriculture will increase by 40–60% and 35–60%, respectively, compared to the levels in 2005 [2]. The application of fertilizers, especially nitrogen fertilizers, is a major source of greenhouse gas emissions in agricultural fields, with the greenhouse gas emission coefficient for nitrogen fertilizer being more than three times higher than those of phosphorus and potassium fertilizers [3]. Additionally, excessive nitrogen fertilizer application can lead to environmental problems, such as groundwater contamination [4]. Therefore, finding ways to reduce greenhouse gas emissions, while improving agricultural productivity, especially in the context of climate change, has become a significant global challenge for agriculture.
Under global warming, rice production faces increased uncertainty. High temperatures not only directly affect rice yield [5] and quality [6,7], but also indirectly reduce NUE by affecting rice’s ability to absorb and utilize nitrogen fertilizers [8]. The effect of nitrogen fertilizer application combined with high temperatures on rice yield is complex. Moderate nitrogen fertilization can mitigate the negative effects of high temperatures [9]. Liu et al. [10] compared rice yield indicators under four nitrogen levels and found that high temperatures during flowering reduced the grain yield by 10.5%, while at higher nitrogen levels, the number of grains per panicle increased by 7.6%, indicating that increasing nitrogen fertilization can alleviate the yield loss caused by high temperatures during flowering. It has been reported that nitrogen supply and temperature can influence the rate-limiting steps of photosynthesis by altering the ratio of the maximum electron transport rate to the maximum Rubisco carboxylation capacity [11]. Under high-nitrogen conditions, a temperature increase also increases leaf hydraulic conductivity, maintaining leaf water potential and stomatal conductance, whereas no such changes occur under low-nitrogen conditions [12].
While nitrogen fertilization remains essential for yield improvement, its environmental impacts under climate change require innovative management strategies. Particularly under high temperatures, enhancing NUE faces dual challenges: maintaining yield stability, while reducing environmental pollution. While other studies have explored the impact of climate change on rice yield, such as using machine learning and deep learning methods to integrate multisource data for predicting rice yield in China [13] and optimizing nitrogen fertilization based on machine learning algorithms [14], there is a lack of detailed analysis of climate–NUE interactions across different growth stages, which is the core of our research. Previous research shows that LASSO is the best model to study the effect of climatic factors on rice yield prediction [15]. To address this gap, we conducted a three-year field experiment (2020–2022) with 15 japonica rice varieties from Jiangsu Province, a region experiencing rapid climate warming. Using four nitrogen application rates, we applied LASSO regression to identify the key growth stages when the climate factors most strongly influence NUE. This method effectively handles correlated weather variables, while pinpointing critical stages, overcoming the limitations of the traditional statistical approaches. This study has the following goals: (1) to explore the possibility of applying the LASSO regression method to identify the key climatic factors affecting rice yield and NUE; (2) to precisely quantify the impacts of temperature and rainfall at the different growth stages on rice yield, NUE, and other growth traits; and (3) to providing guidance for farmers and agricultural practitioners to optimize rice production in the context of climate change.
2. Materials and Methods
2.1. Experimental Design
In this experiment, 15 representative rice varieties, which have been widely planted in Jiangsu Province and developed in different years, were selected and grown at the Baima Teaching and Research Base of Nanjing Agricultural University. The seeds were sown on 13 May 2021 in an experimental field at Nanjing Agricultural University and transplanted on 15 June 2021. The experimental field is located at the Baima Base of Nanjing Agricultural University in Lishui District, Nanjing City, Jiangsu Province (31°36′ N, 119°10′ E). The basic soil characteristics are as shown in Table S1. The temperature and rainfall data for these three years are plotted in Figure 1. Soil samples were collected before planting and air-dried for the analysis of physical and chemical properties. Ammonium nitrogen and nitrate nitrogen were extracted with 2 M KCl and analyzed using an autoanalyzer (CFAAA3, Bran & Luebbe Inc., Norderstedt, Germany). Total nitrogen and soil organic matter were determined using a carbon and nitrogen elemental analyzer (multi EA 5000, Elementar Analysensysteme GmbH, Langenselbold, Germany). The soil water content was determined using an oven. Available phosphorus was analyzed by the NaHCO3-Mo-Sb colorimetric method. Available potassium was analyzed by the flame spectrophotometry method.
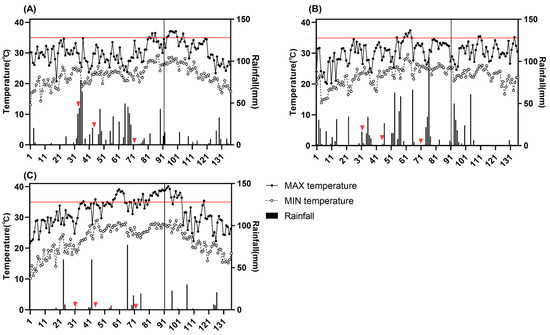
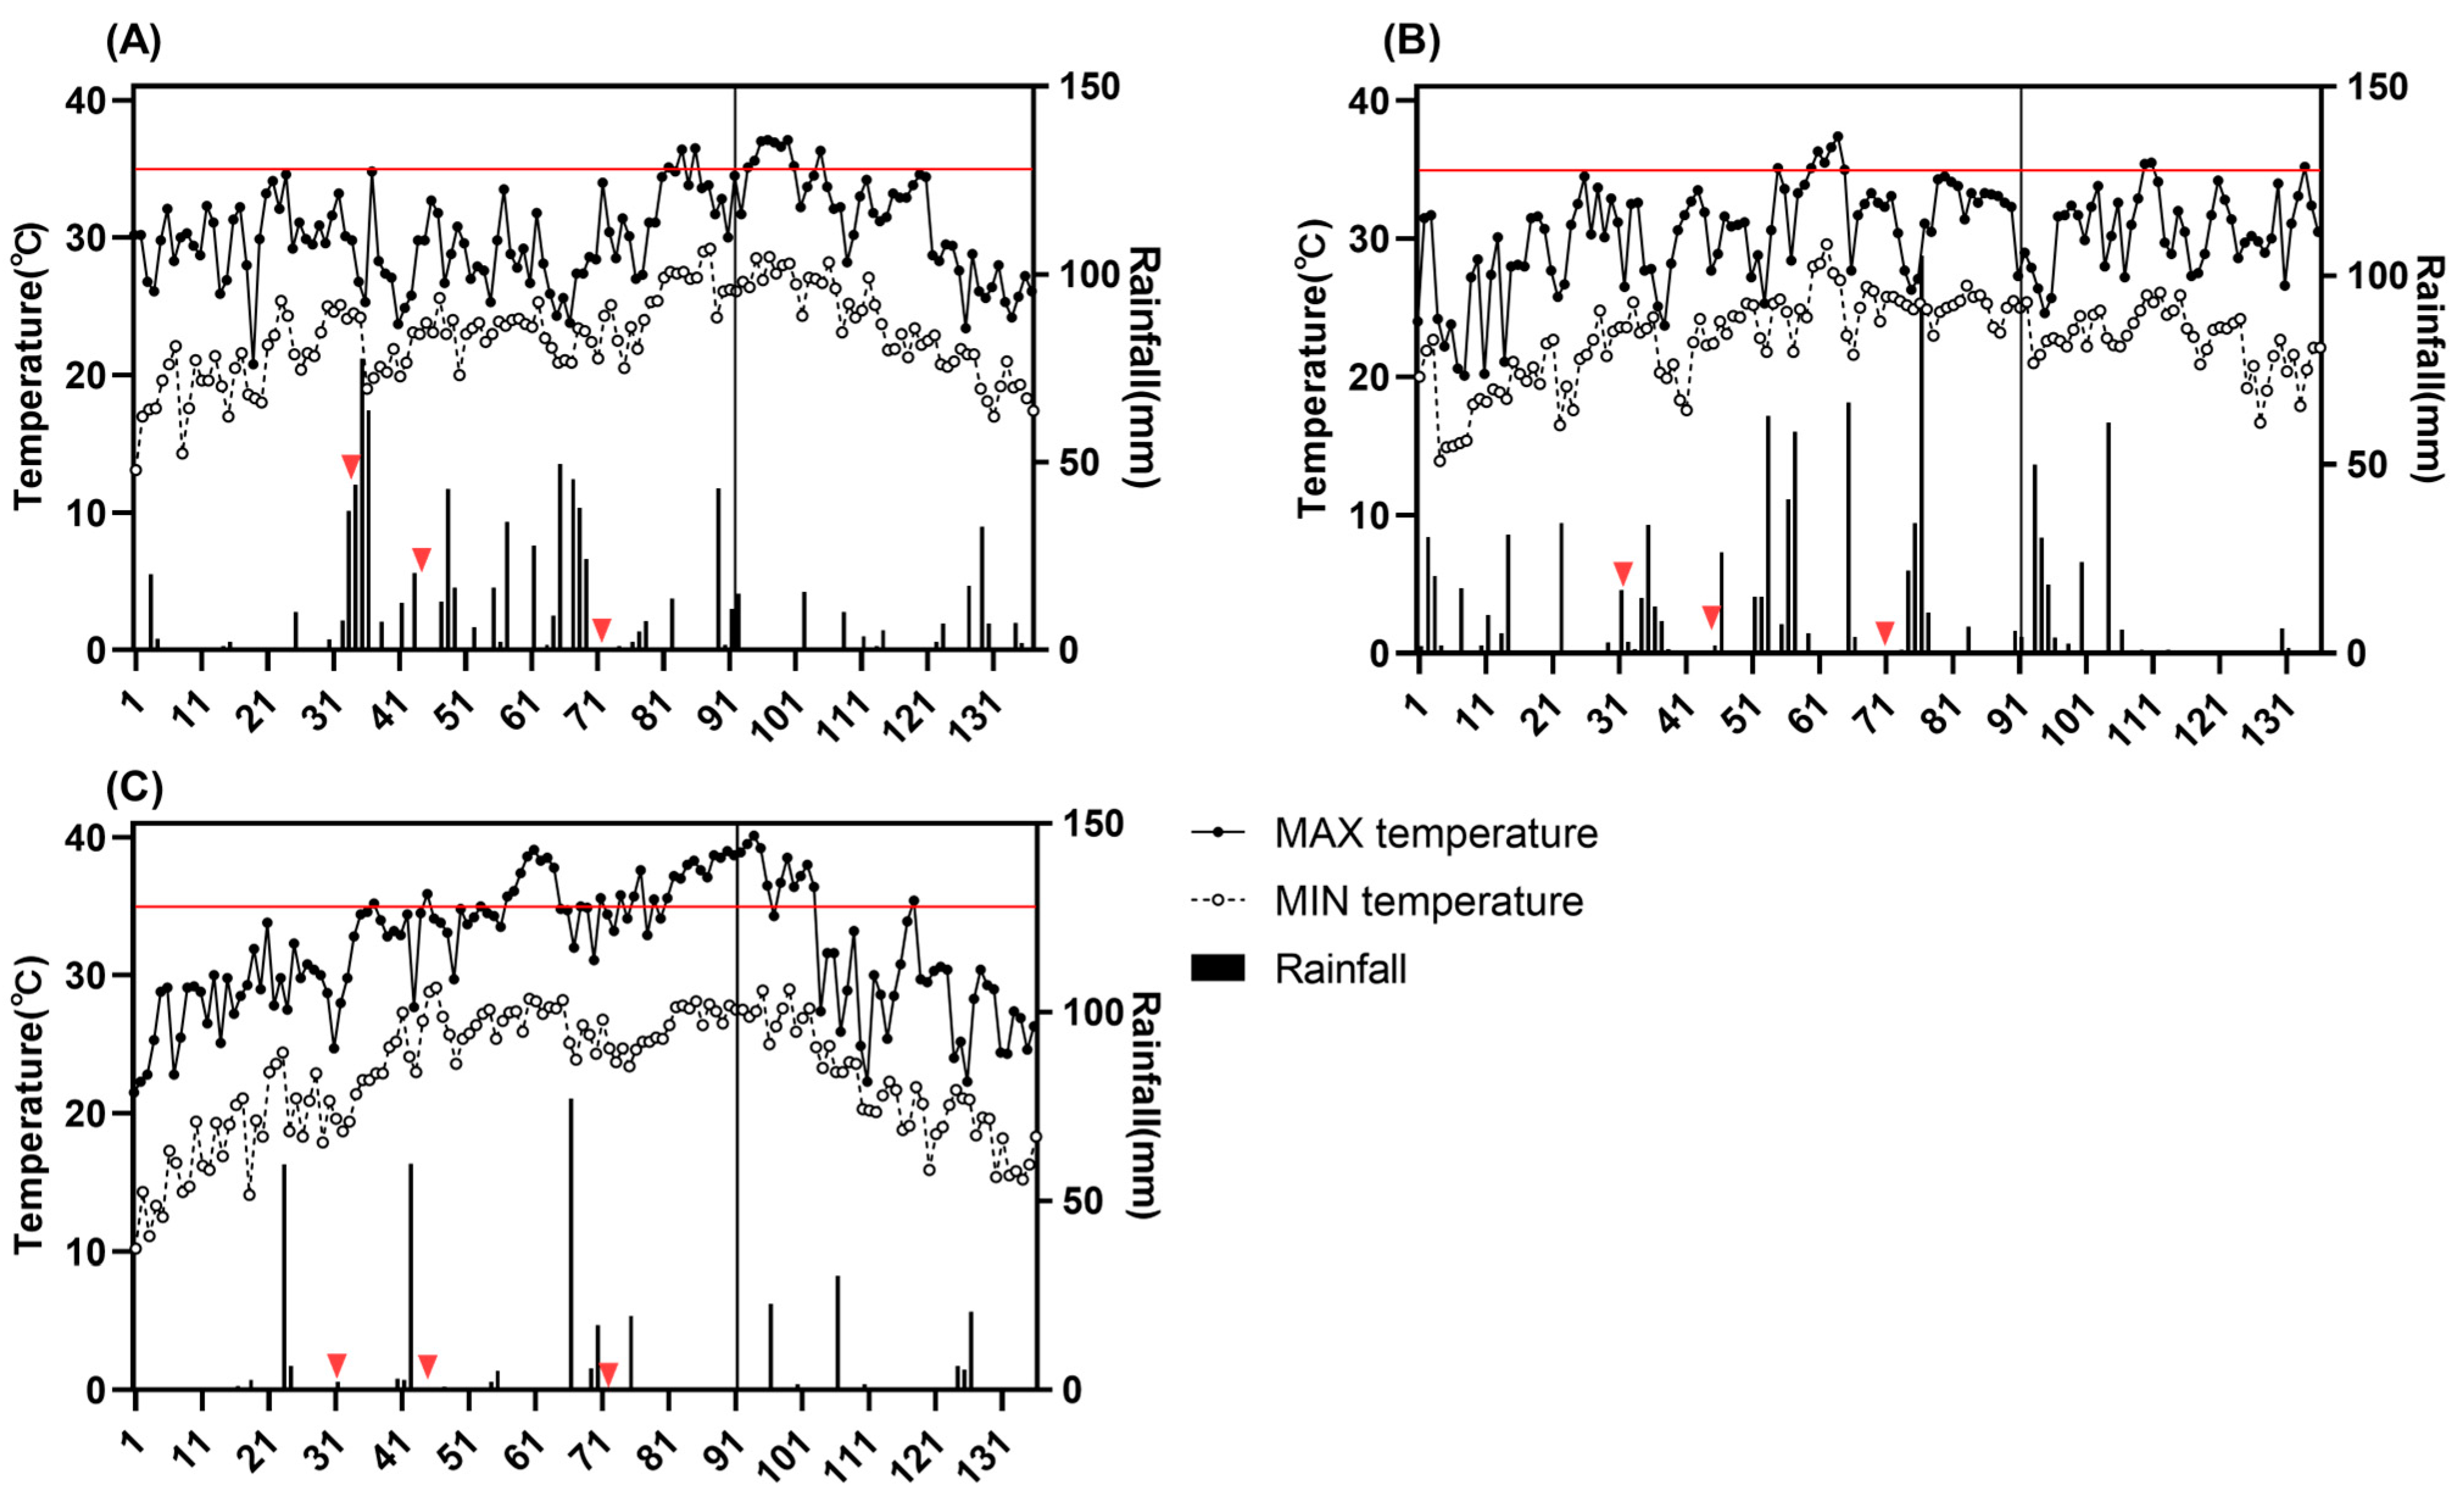
Figure 1.
Temperature and rainfall during the entire rice growing season under natural conditions from 2020 to 2022. (A): 2020; (B): 2021; (C): 2022. The X-axis means the number of days after sowing. The vertical lines in the figure indicate the start of rice panicle initiation, the red horizontal line represents 35 °C, and the red triangles represent the time of fertilization.
2.2. Fertilizer Application
In this experiment, the macronutrient fertilizers used were urea (containing 46% N), single superphosphate (containing 16% P2O5), and potassium chloride (containing 60% K2O). The experimental field management followed local conventional practices, including water management, pest and weed control, and disease prevention, which were consistent with the standard rice cultivation methods in the area. During planting, one seedling was placed in each hole, with a planting density of 70 plants per plot. Four nitrogen fertilizer gradients were designed, nitrogen deficiency (N1), low nitrogen (N2), medium nitrogen (N3), and high nitrogen (N4), with nitrogen application rates of 65 kg·ha−1, 150 kg·ha−1, 250 kg·ha−1, and 350 kg·ha−1 (calculated as pure nitrogen), respectively. Nitrogen fertilizers were applied as a base fertilizer (before transplanting), a tillering fertilizer (5days after transplanting), and a booting fertilizer (45days after transplanting) in a ratio of 4:3:3. Phosphorus and potassium fertilizers were applied once as base fertilizers at rates of 75 kg P2O5·ha−1 and 166 kg K2O·ha−1, respectively. The transplanting density was 20 hills/m2, with one seedling per hill; plant spacing was 20 cm; and row spacing was 25 cm. The treatments were arranged in a split plot design with nitrogen fertilizer application as the main plots and the varieties as subplots, and each experiment was performed in three replicates with a plot area of 5 m2 (2 m × 2.5 m).
2.3. Sample Collection
The plant samples from flowering stage were collected at the full heading stage. Ten rice plants were randomly selected from each plot, excluding border plants, and their plant height, tiller number, and other indicators were measured. From these ten plants, five plants close to the average values were selected, and whole plants were harvested at ground level. After harvesting, the selected plants were dried in an oven at 105 °C for 30 min to stop their metabolism. The samples were then dried in a 70 °C drying oven until a constant weight was achieved. After weighing each part of the sample, the plants were ground using a plant grinder.
2.4. Sample Analysis and Measurement Methods
The determination of nitrogen content in the rice plants occurred as follows:
After harvesting, the samples were heated at 105 °C for 30 min and ground into powder. Total nitrogen content was determined using the H2SO4-H2O2 digestion method with continuous flow analysis using an autoanalyzer (CFAAA3, Bran & Luebbe Inc., Norderstedt, Germany).
The measurement of NUE was conducted according to the method of Zhang et al. [16]:
Harvest index (HI) = Grain weight per plant at harvest/Aboveground biomass per plant at harvest.
Nitrogen harvest index (NHI) = Nitrogen content in grain per plant at harvest/Total nitrogen content in aboveground biomass per plant at harvest.
Nitrogen recovery efficiency (NRE, g/g) = Total nitrogen content in aboveground biomass per unit area in the season/Nitrogen applied per unit area in the season (calculated as pure nitrogen).
Nitrogen partial factor productivity (NPFP, g/g) = Grain yield per unit area at harvest/Nitrogen applied per unit area in the season (calculated as pure nitrogen).
Physiological nitrogen use efficiency (PNUE, g/g) = Grain yield per plant/Total nitrogen content in the aboveground biomass per plant.
Nitrogen translation ratio (NTR) = [(N content in panicles per unit area at harvest/Total nitrogen content in aboveground biomass per unit area at harvest) − (N content in panicles per unit area at flowering/Total nitrogen content in aboveground biomass per unit area at flowering)] × 100%.
2.5. LASSO Regression and Data Analysis
In this paper, the threshold of daytime high-temperature stress is 35 °C, and the threshold of nighttime high-temperature stress is 25 °C [18]. The heading date was defined as the time when 80% of the plants in the plot started heading to the time when all the plants were in full heading. Data processing in this study was performed using SPSS 22.0 for correlation analysis and ANOVA analysis. Pearson’s correlation method was used for correlation analysis, and differences in ANOVA were determined based on Duncan’s multiple range test with a significance level of p < 0.05. Graphs and charts were generated using GraphPad 8.0.2, and the standard errors in the data presented in the paper are represented by SE values.
3. Results
3.1. Temperature and Rainfall
Figure 1 shows that the average maximum temperatures in 2020 and 2021 were 30.1 °C and 30.3 °C, respectively, while in 2022, it was 31.7 °C. In 2020, high-temperature stress mainly occurred during flowering stage, with a short duration (7 days). In 2021, high-temperature stress primarily occurred during tillering stage, with a short duration (7 days). In 2022, high-temperature stress occurred from the tillering stage to the flowering stage, lasting longer (35 days), with the highest temperature exceeding 40 °C, causing more significant damage. The average minimum temperatures for the entire growing season in the three years were between 22.5 °C and 22.6 °C. However, the number of days with a minimum temperature of 25 °C or higher in 2022 was 53 days compared to 36 days in 2020 and 33 days in 2021.
As for rainfall, the average daily rainfall in 2020 was 6 mm; in 2021, it was 6.8 mm; and in 2022, it was 2.5 mm. In 2020, rainfall was mainly concentrated during the three fertilization periods, with over 70% of rainfall occurring between 30 and 72 days after sowing. In 2021, 41% of rainfall occurred between 30 and 72 days after sowing, which was lower than that in 2020.
3.2. Traits of Rice Under Different Temperature and Rainfall Conditions
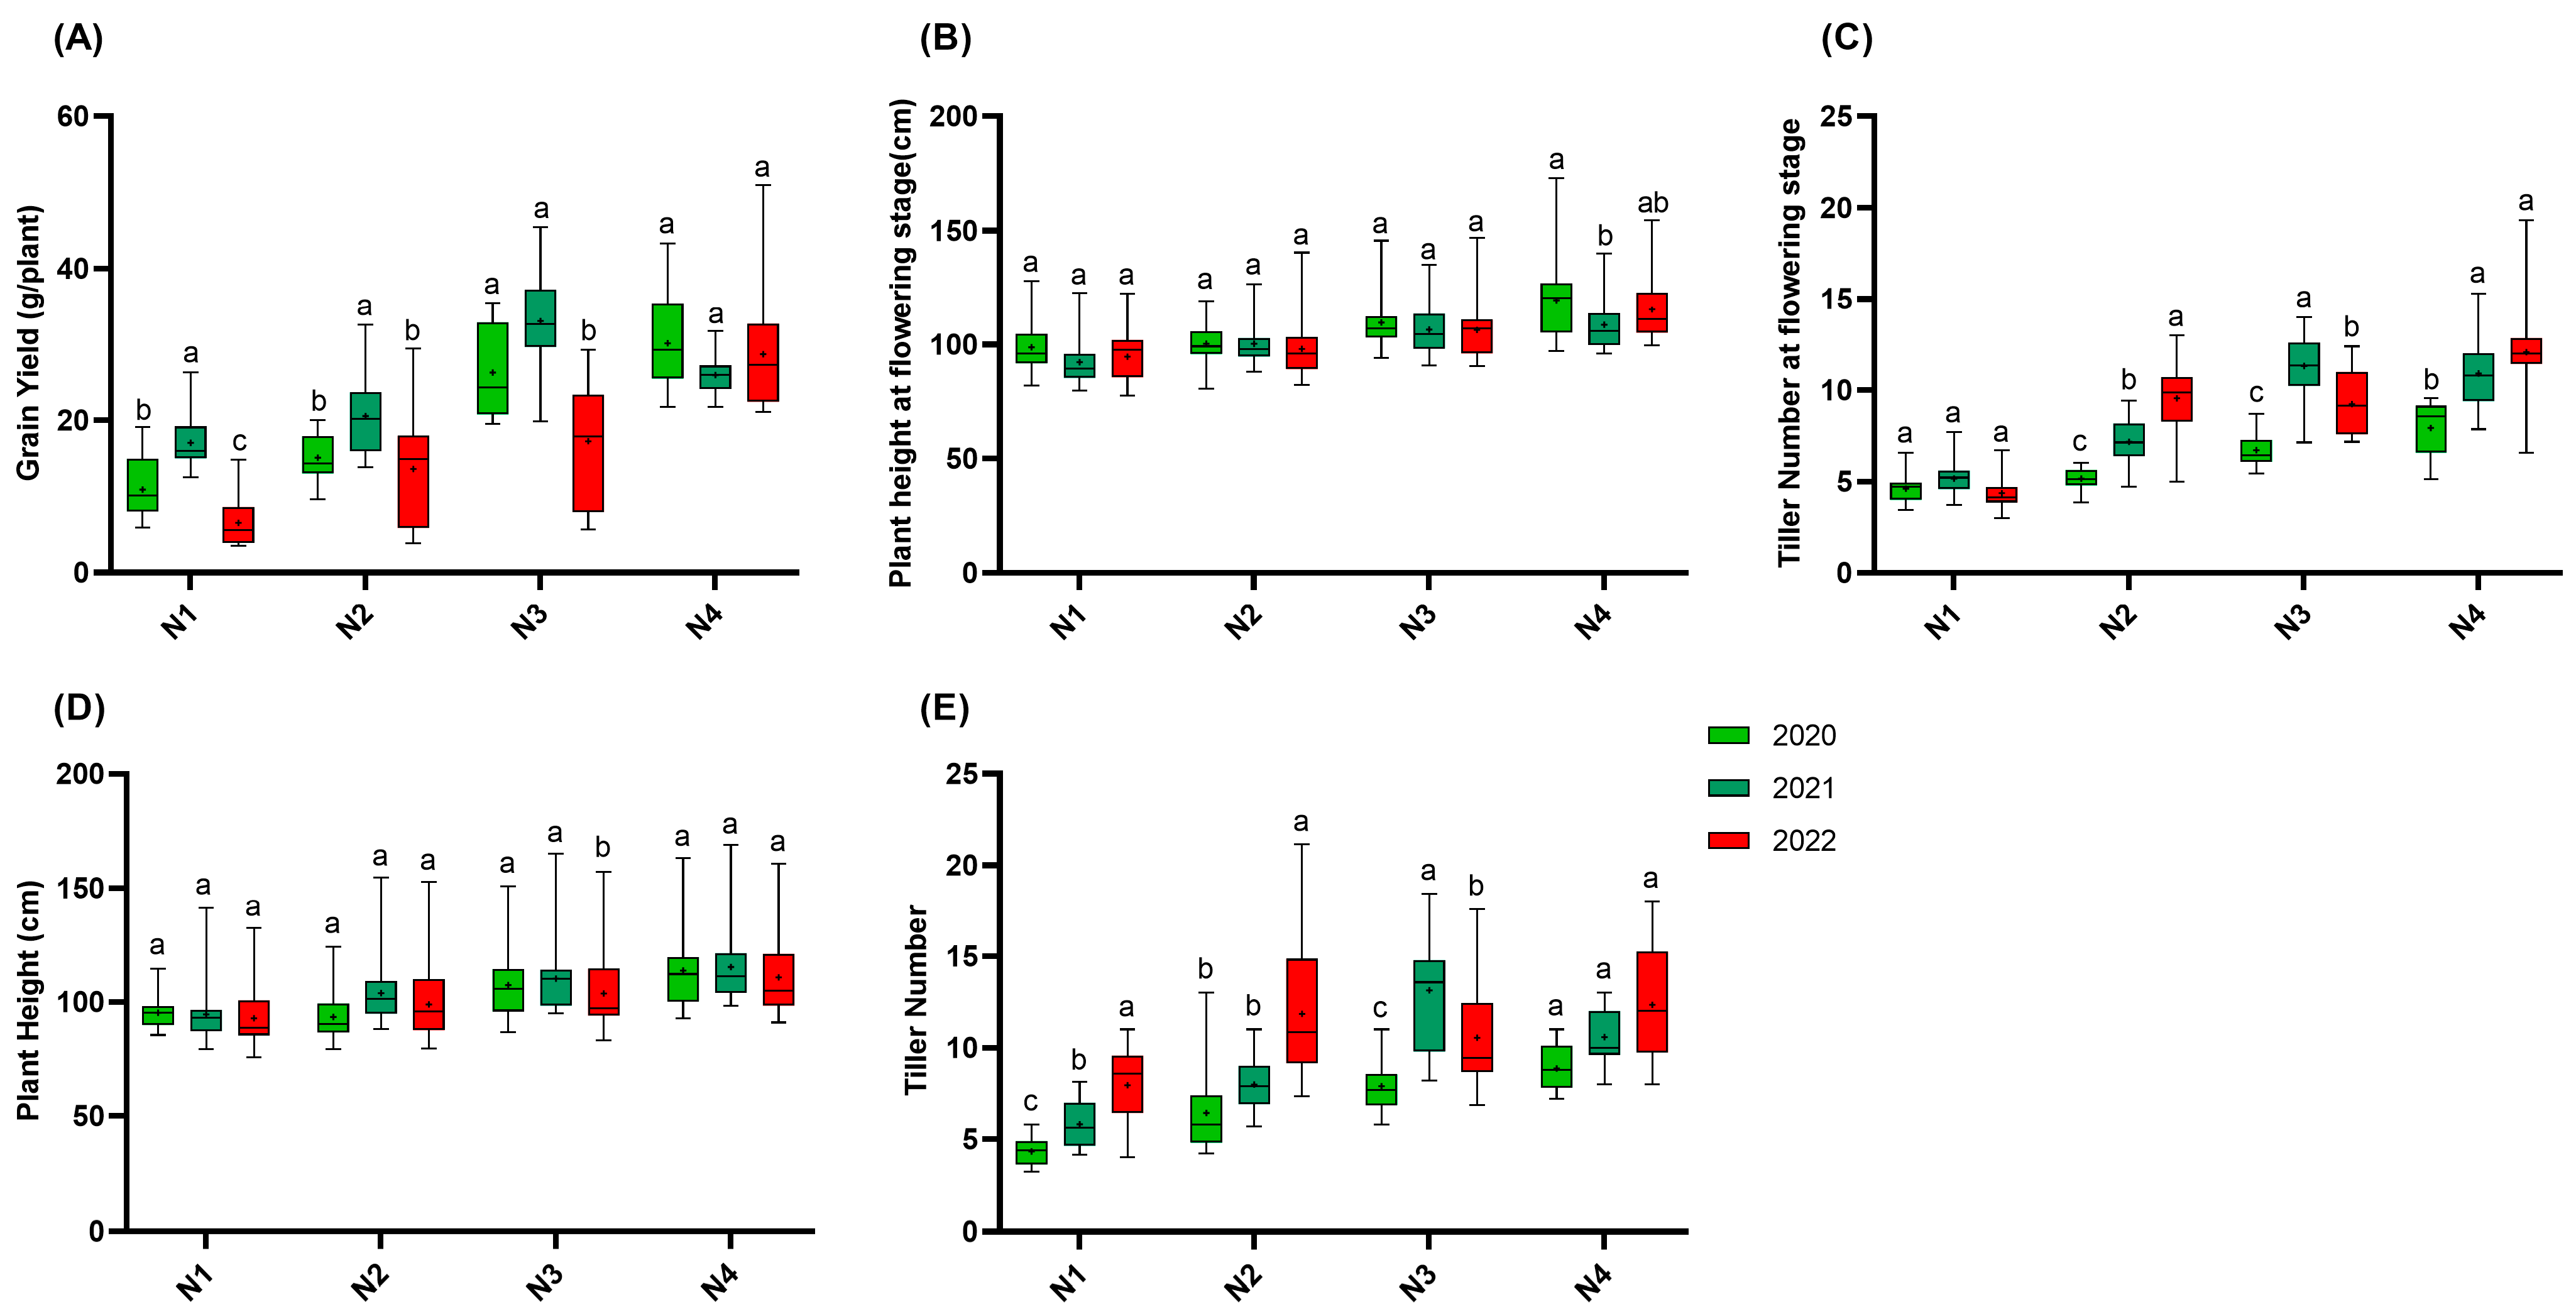
In 2020, 2021, and 2022, the agronomic traits of the japonica rice varieties developed in Jiangsu Province were statistically analyzed. Figure 2 shows that in both 2020 and 2022, the yield increased with the nitrogen gradient. In 2021, the yield increased from the N1 to N3 gradients; however, the yield in the N4 gradient was lower than that in N3. At the N1, N2, and N3 gradients, the yield in 2021 was generally higher than that in 2020, and the yield in 2020 exceeding that of 2022. Specifically, the yield in 2022 decreased by 61.5%, 33.9%, and 47.7% compared to that in 2021 at the N1, N2, and N3 gradients, respectively. Overall, the yield of the japonica rice varieties was affected by both the year and nitrogen gradient, with different patterns emerging in each year.
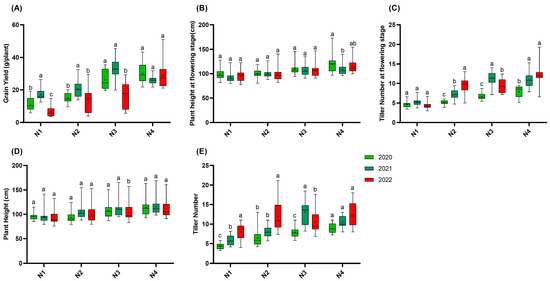
Figure 2.
Agronomic traits of 15 rice varieties in 2020, 2021, and 2022. (A): Grain yield; (B): plant height at flowering stage; (C): tiller number at flowering stage; (D): plant height; (E): tiller number. N1: 65 kgN·ha−1, N2: 150 kgN·ha−1, N3: 250 kgN·ha−1, and N4: 350 kgN·ha−1. n = 15 biological replicates; different lowercase letters indicate significant differences (p < 0.05; Duncan’s multiple range test).
Regarding the plant height at the flowering stage, no significant differences were observed among the nitrogen gradients, except for the N4 gradient in 2020, where the plant height was higher than that in 2021. At the maturity stage, the plant height in the N3 gradient in 2022 was significantly lower than those in both 2020 and 2021, while no significant differences were found for the other nitrogen gradients.
For the tiller number at the flowering stage, the number of tillers in the N2 gradient in 2022 was significantly higher than those in both 2021 and 2020. In contrast, in 2021, the number of tillers in the N3 gradient at the flowering stage was significantly higher than those in both 2022 and 2020. At the maturity stage, the number of tillers in N1 in 2022 was significantly higher than those in 2020 and 2021. Similarly, the number of tillers in N2 in 2022 was significantly higher than those in 2020 and 2021. However, in the N3 gradient, the number of tillers in 2021 was significantly higher than those in 2022 and 2020.
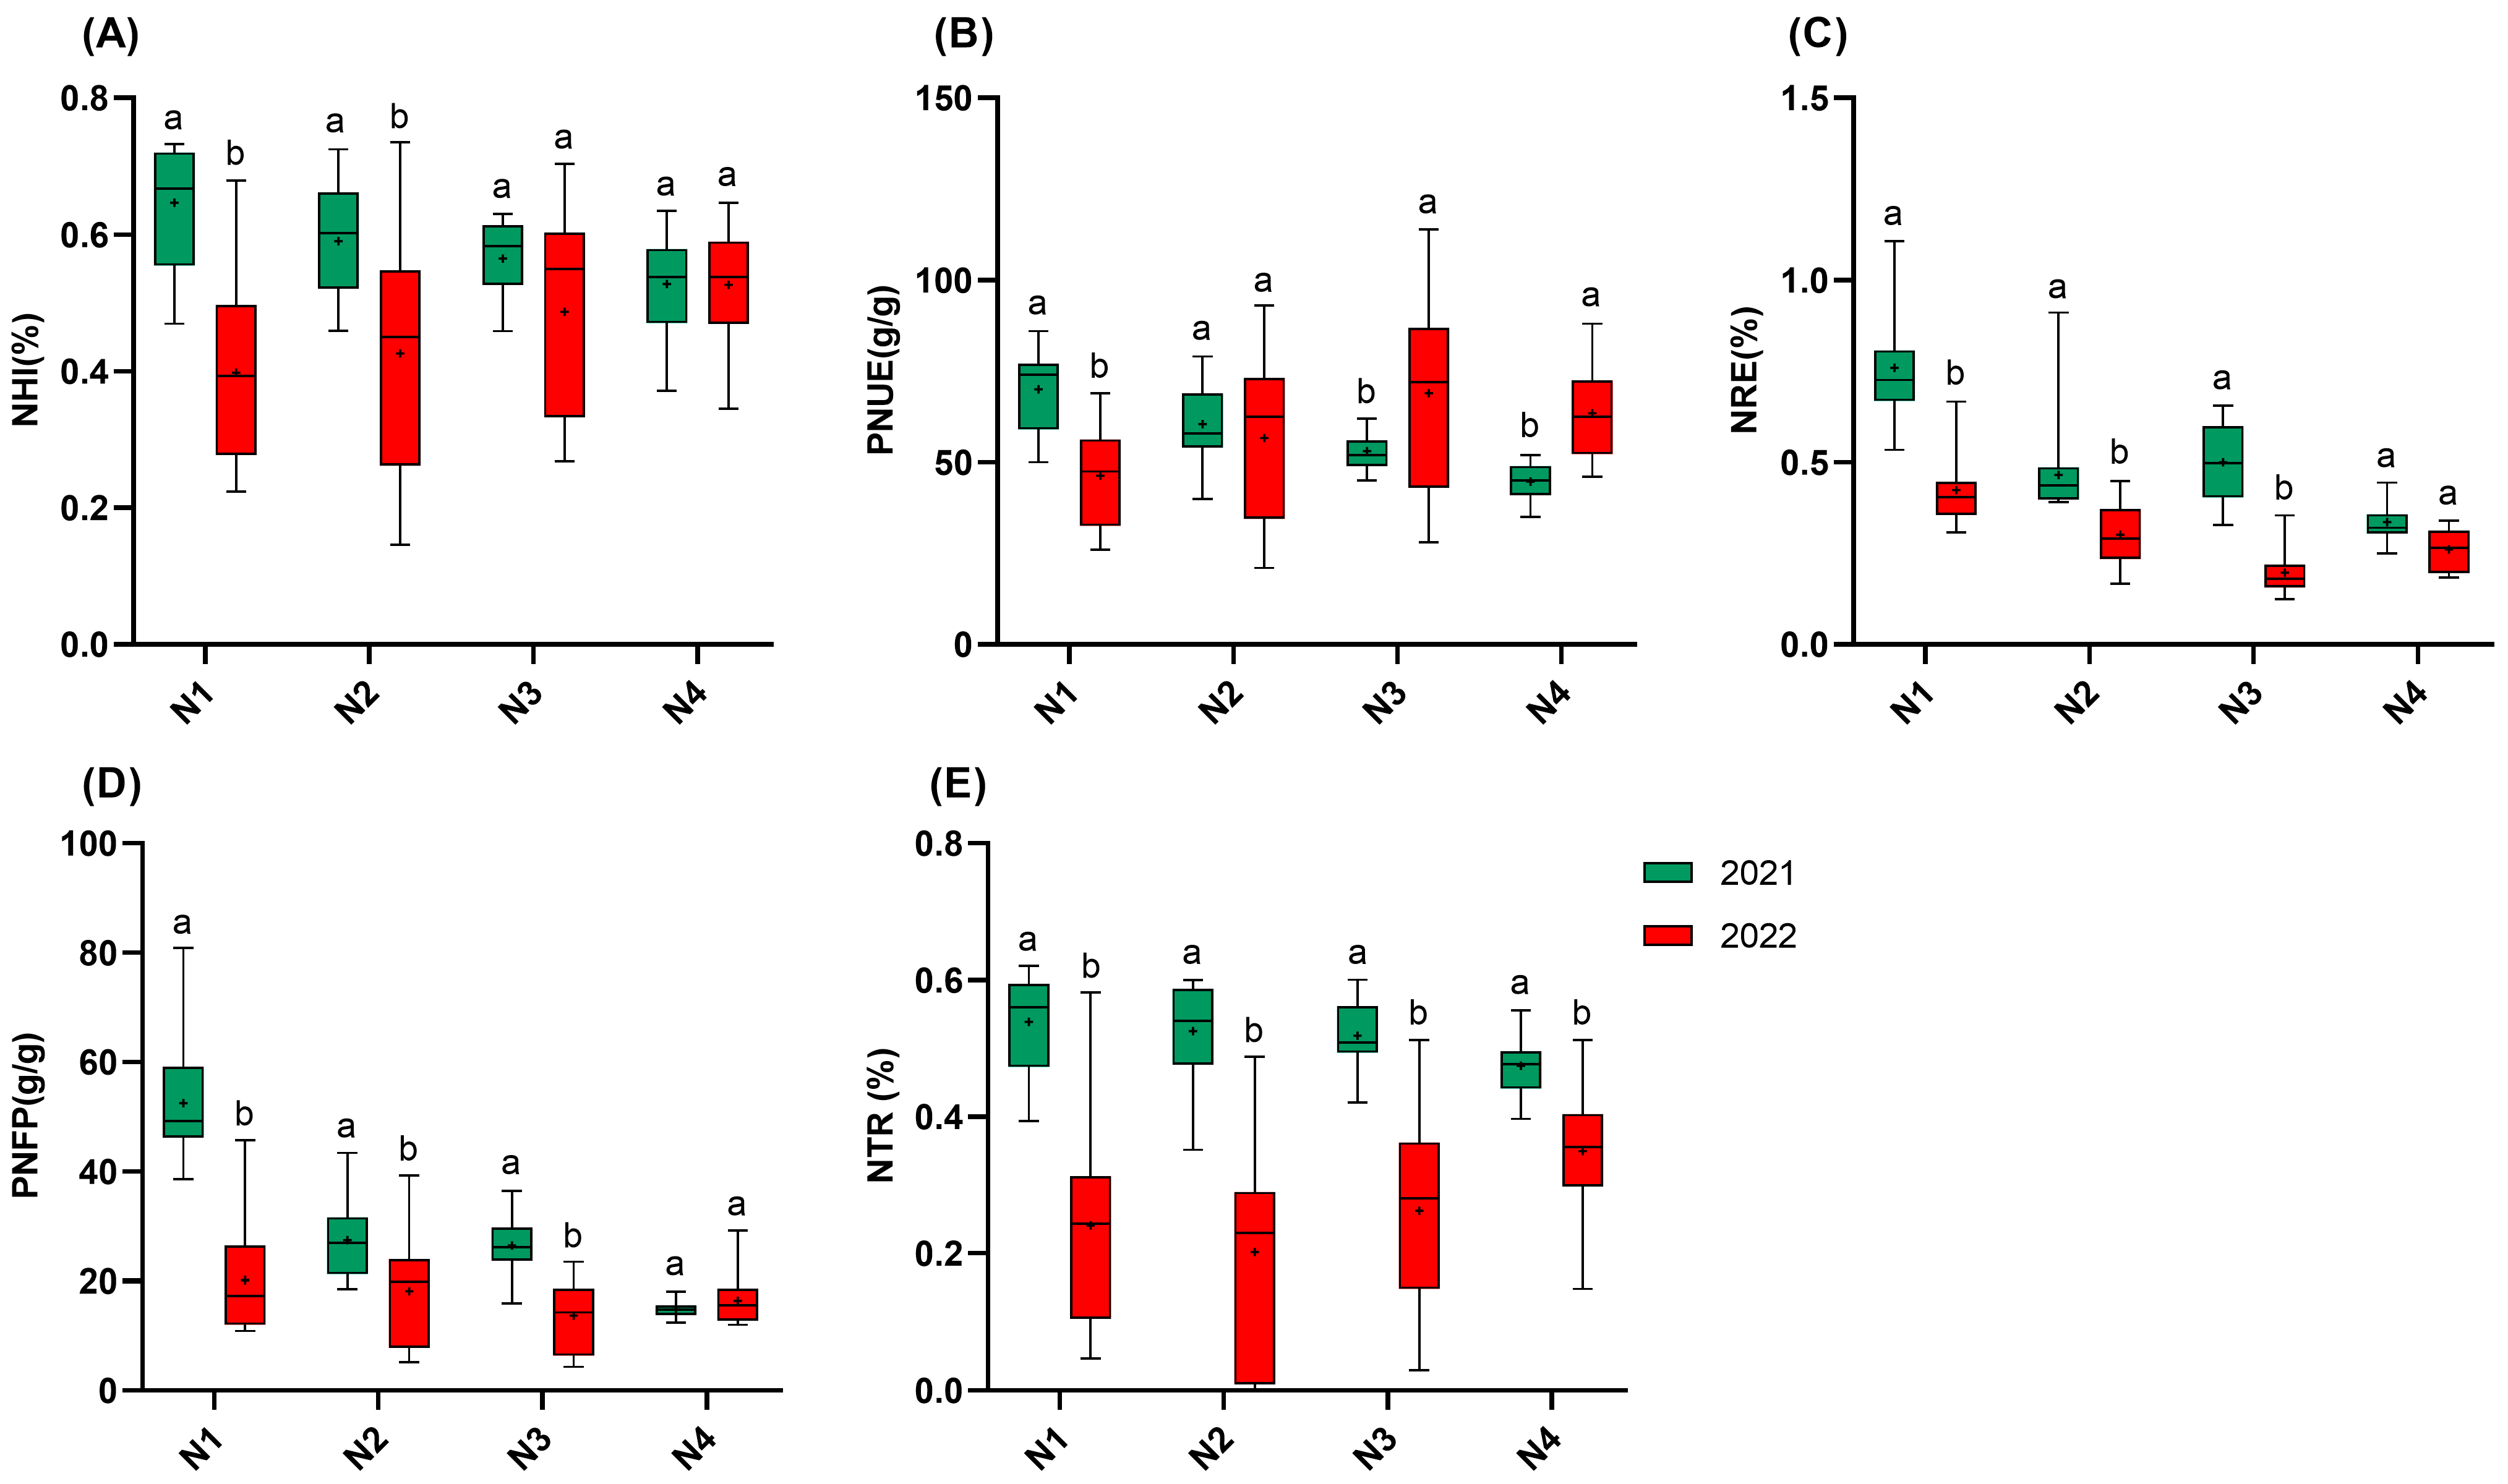
Regarding NUE, high temperatures significantly reduced NUE, while increasing nitrogen fertilization helped mitigate the loss of NUE caused by high temperatures (Figure 3). The NHI in 2022 showed significant reductions of 45.7% (N1), 40.2% (N2), and 24.2% (N3) compared to those in 2021, while no significant difference was observed for N4 between the years. Similarly, NRE and PNFP were significantly lower than those in 2021 at all the nitrogen gradients, except for N4. In 2021, the NHI, PNUE, PNFP, and the NTR all decreased as nitrogen application increased, while NRE followed the order N1 > N3 > N2 > N4. Notably, under high-temperature conditions in 2022, PNUE displayed nitrogen-dependent recovery. While PNUE in N1 was 33.9% lower than that in 2021, N3 and N4 PNUE increased by 30.0% and 41.8%, respectively. Finally, the nitrogen transport processes showed particular vulnerability, with the NTR reductions spanning 26.3–61.6% across the four nitrogen gradients in 2022, which is the most serious efficiency loss observed. Notably, even the maximum nitrogen inputs failed to completely alleviate the loss, indicating that heat stress has a significant effect on nitrogen transportation and remobilization after flowering. The reduction in NRE, spanning 22.4–60.5% across the four nitrogen gradients in 2022, indicates that high temperature also has a significant effect on the capacity of plant roots to acquire nitrogen from soil [19].

Figure 3.
NUE of 15 rice varieties in 2021 and 2022. (A): NHI; (B): PNUE; (C): NRE; (D): PNFP; (E): NTR. N1: 65 kgN·ha−1, N2: 150 kgN·ha−1, N3: 250 kgN·ha−1, and N4: 350 kgN·ha−1. n = 15 biological replicates; different lowercase letters indicate significant differences (p < 0.05; Duncan’s multiple range test).
In 2021, the straw weight and biomass followed the order of N3 > N4 > N2 > N1 (Figure 4). In 2022, the straw weight in N2 was significantly higher than in 2021, while the straw weight in N3 was significantly lower than that in 2021. The biomass in 2022 was significantly lower in the N1 and N3 gradients compared to those in 2021. Interestingly, for the HI, in 2021, the HI had no correlation with nitrogen application, but in 2022, the HI increased with increasing nitrogen application. Notably, the HI reductions in 2022 were mitigated at higher nitrogen levels. The HI in N4 decreased by only 7.7% compared to that in 2021, which is significantly less than the reductions at N1–N3 (24.2–45.7%). This indicates that increasing nitrogen application can mitigate the loss of HI caused by high temperatures. Regarding the nitrogen concentration in the grains and the straw, as well as the nitrogen concentration in the straw at the flowering stage in 2022, these were all significantly lower than they were in 2021, with the differences increasing as nitrogen application increased. The panicle nitrogen concentration at the flowering stage in 2022 was significantly higher than that in 2021. For nitrogen accumulation, at all the four nitrogen gradients, both grain and straw nitrogen accumulation at the maturity and flowering stages were lower in 2022 than those in 2021, and the total plant nitrogen accumulation at all the four nitrogen gradients in 2022 was also significantly lower than that in 2021. Moreover, all the nitrogen accumulation values in 2022 increased with increasing nitrogen application.
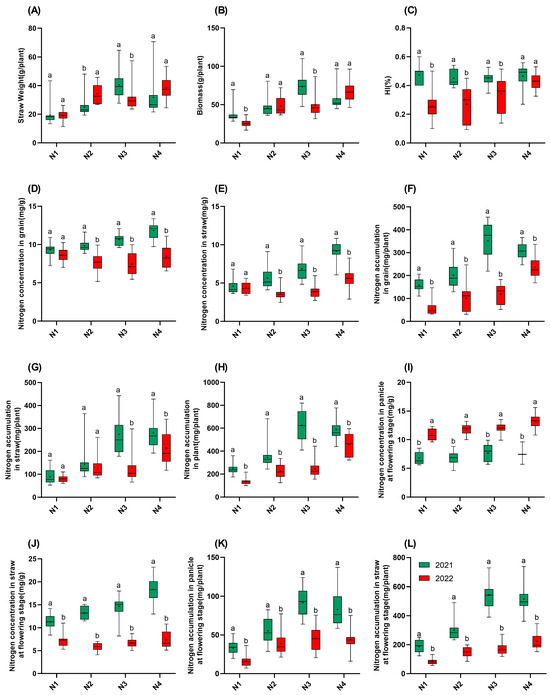
Figure 4.
Traits of 15 rice varieties in 2021 and 2022. (A): Straw weight; (B): biomass; (C): HI; (D): nitrogen concentration in grain; (E): nitrogen concentration in straw; (F): nitrogen accumulation in grain; (G): nitrogen accumulation in straw; (H): nitrogen accumulation in plant; (I): nitrogen concentration in panicle at flowering stage; (J): nitrogen concentration in straw at flowering stage; (K): nitrogen accumulation in panicle at flowering stage; (L): nitrogen accumulation in straw at flowering stage. N1: 65 kgN·ha−1, N2: 150 kgN·ha−1, N3: 250 kgN·ha−1, and N4: 350 kgN·ha−1. n = 15 biological replicates; different lowercase letters indicate significant differences (p < 0.05; Duncan’s multiple range test).
3.3. LASSO Regression Analysis on Traits of Rice
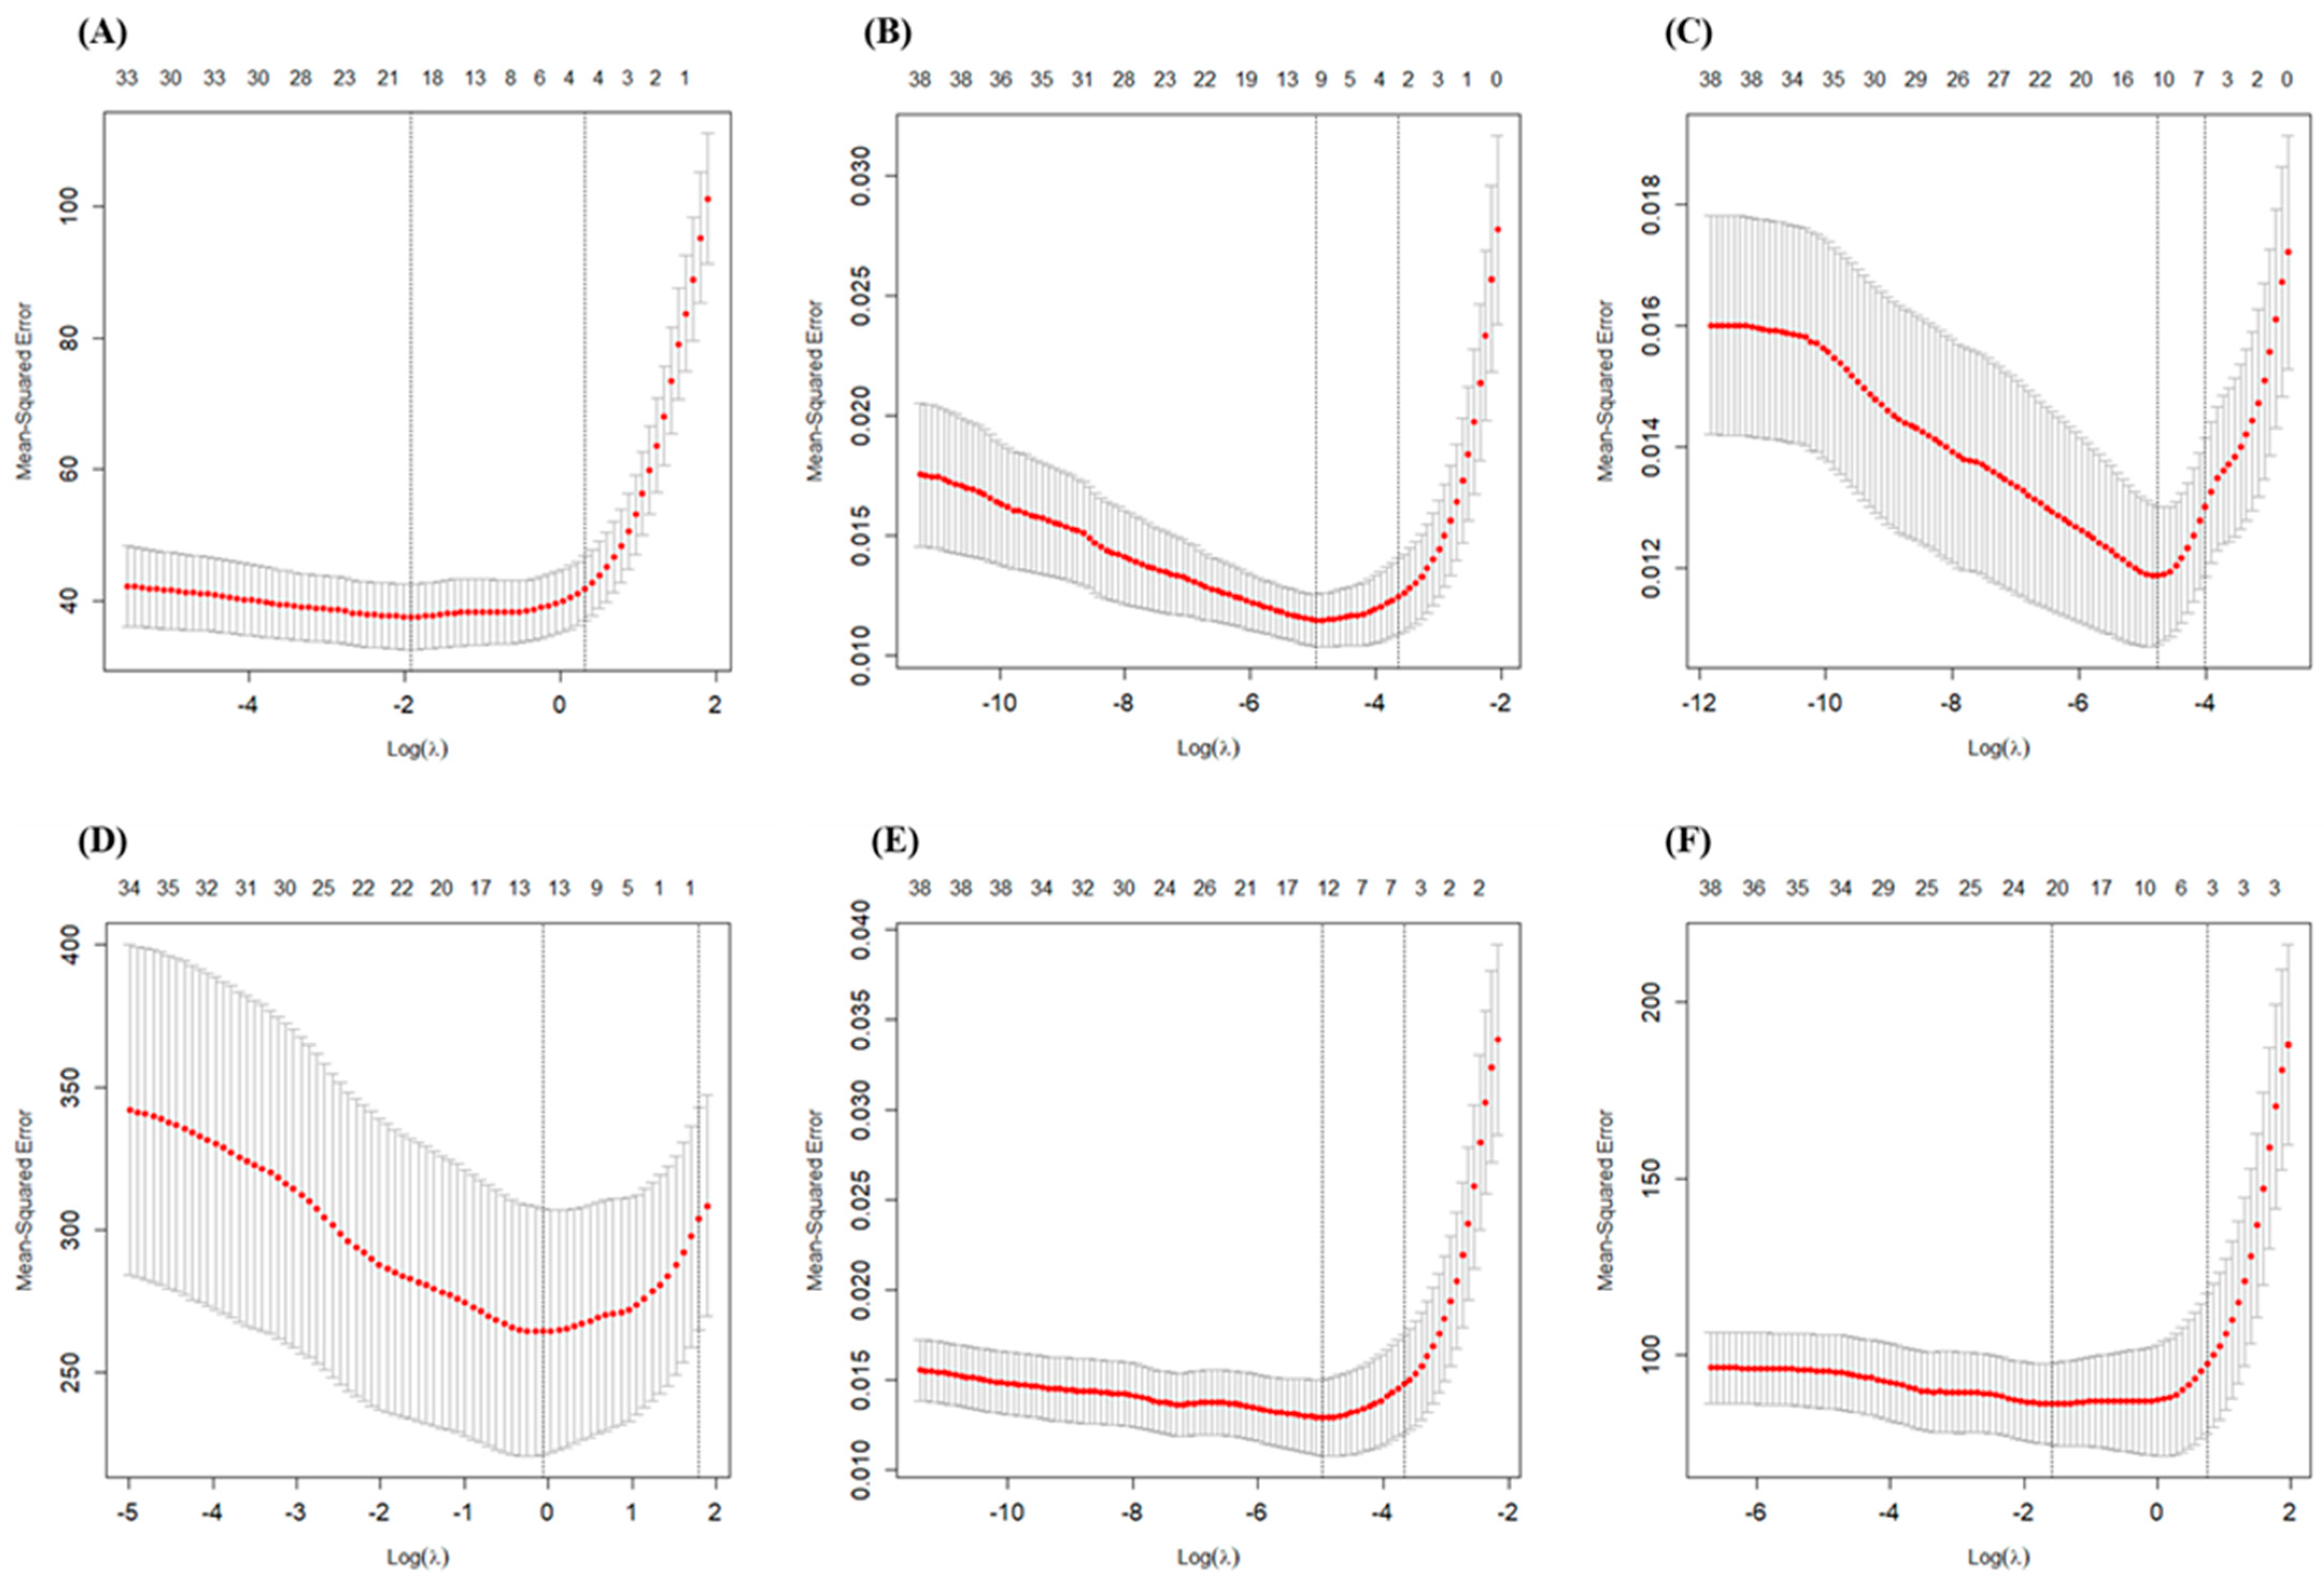
In our study, 10-fold cross-validation was used to select the tuning parameter λ. The mean-squared error was computed based on 10-fold cross-validation. The red dashed line represents the mean-squared error, and the error bars represent the standard deviation of the mean-squared error, as shown in Figure 5 and Figure S1. Two special values along the λ sequence are indicated by the vertical dotted lines. Lambda.min is the λ value that minimizes the mean cross-validation error, while lambda.1se is the value of λ that gives the most regularized model such that the cross validated error is within one standard error of the minimum. All the results in this study are based on the selection of lambda.1se, aiming to identify the independent variables most significantly correlated with the dependent variables.
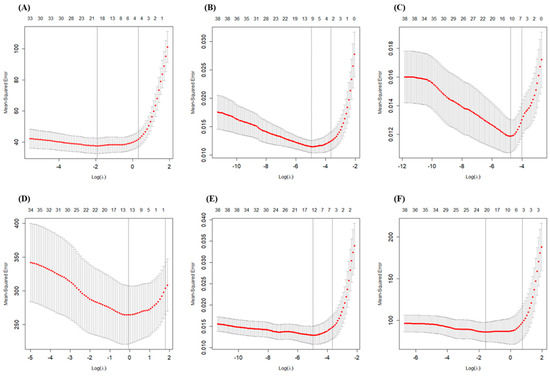
Figure 5.
Changes in fitting deviation in grain yield and NUE with different λ values. (A): Grain yield; (B): NTR; (C): NHI; (D): PNUE; (E): NRE; (F): PNFP. Left vertical dotted line represents lambda.min, and right vertical dotted line represents lambda.1se.
LASSO also estimates the effect coefficients of the selected variables [20]. Variables with higher effect coefficients can be regarded as contributing more to explaining the dependent variables. Therefore, effect coefficients were used as the importance scores of the variables selected by LASSO. The results of LASSO regression are shown in Table 1 and Table S2. The negative effect coefficients (−β) indicate a negative impact on the response variable, while the positive effect coefficients (+β) indicate a positive impact. The results show that yield is significantly negatively correlated with the maximum temperature during the jointing and booting stages, as well as with the days of high-temperature stress during the flowering and filling stages, and significantly positively correlated with nitrogen application. Biomass is significantly positively correlated with nitrogen application, rainfall during the tillering stage, varieties two and seven, and significantly negatively correlated with days of high-temperature stress during the filling stage. For NUE, the NHI is significantly positively correlated with rainfall during the tillering and filling stages and negatively correlated with the days of high-temperature stress during the flowering and filling stages. PNUE is significantly negatively correlated with the days of high-temperature stress during the filling stage. NRE is negatively correlated with nitrogen application, the maximum temperature during the jointing and booting stage, the minimum temperature during the jointing and booting stage, and the nights of high-temperature stress during the flowering stage, while it is significantly positively correlated with rainfall during the tillering stage, rainfall during the jointing and booting stage, and variety two. PNFP is significantly negatively correlated with nitrogen application and the days of high-temperature stress during the flowering stage. The NTR is significantly negatively correlated with the maximum temperature during the flowering stage and significantly positively correlated with rainfall during the tillering stage. For the five NUE indicators, four are correlated with the maximum or minimum temperature during the flowering stage. This suggests that temperature during flowering stage plays an important role in rice’s NUE and is a critical stage for NUE during rice growth.

Table 1.
Effect coefficients of LASSO regression for different rice traits. X1: Nitrogen application. X2: Maximum temperature during seedling stage. X3: Maximum temperature during tillering stage. X4: Maximum temperature during jointing and booting stage. X5: Maximum temperature during flowering stage. X6: Maximum temperature during filling stage. X7: Minimum temperature during seedling stage. X8: Minimum temperature during tillering stage. X9: Minimum temperature during jointing and booting stage. X10: Minimum temperature during flowering stage. X11: Minimum temperature during filling stage. X12: Rainfall during seedling stage. X13: Rainfall during tillering stage. X14: Rainfall during jointing and booting stage. X15: Rainfall during flowering stage. X16: Rainfall during filling stage. X17: Days of high daily temperature stress during seedling stage, X18: Days of high daily temperature stress during tillering stage, X19: Days of high daily temperature stress during jointing and booting stage, X20: Days of high daily temperature stress during flowering stage, X21: Days of high daily temperature stress during filling stage, X22: Days of high night temperature stress during seedling stage, X23: Days of high night temperature stress during tillering stage, X24: Days of high night temperature stress during jointing and booting stage, X25: Days of high night temperature stress during flowering stage, X26: Days of high night temperature stress during filling stage. X27–X41: Varieties 1–15.
Half of the rice traits are influenced by the maximum or minimum temperature during the jointing and booting stage, indicating that the jointing and booting stage is a temperature-sensitive stage for rice. Among the temperatures during the different growth stages, the maximum and minimum temperatures during the jointing and booting stage, the maximum temperature during the flowering stage, and the maximum temperature during the filling stage are all key factors affecting rice growth and development. This suggests that rice is especially sensitive to temperature during the reproductive growth stages.
Regarding rainfall, rainfall during the tillering and jointing and booting stages is critical for rice growth and development. In this experiment, four NUE indicators were closely related to rainfall during the tillering stage. For all the traits, rainfall during the seedling, tillering, jointing and booting, flowering, and filling stages was significantly correlated with three, ten, six, three, and two traits, respectively. This indicates that in this experiment, rainfall during the tillering stage is a key factor influencing japonica rice cultivated in Jiangsu Province. This suggests that rice is more sensitive to rainfall during its vegetative growth stages. Overall, the LASSO regression results provide a comprehensive understanding of the complex relationships between the rice growth traits, nitrogen application, temperature, and rainfall. These insights are crucial for formulating targeted cultivation strategies to optimize rice growth and nitrogen use efficiency.
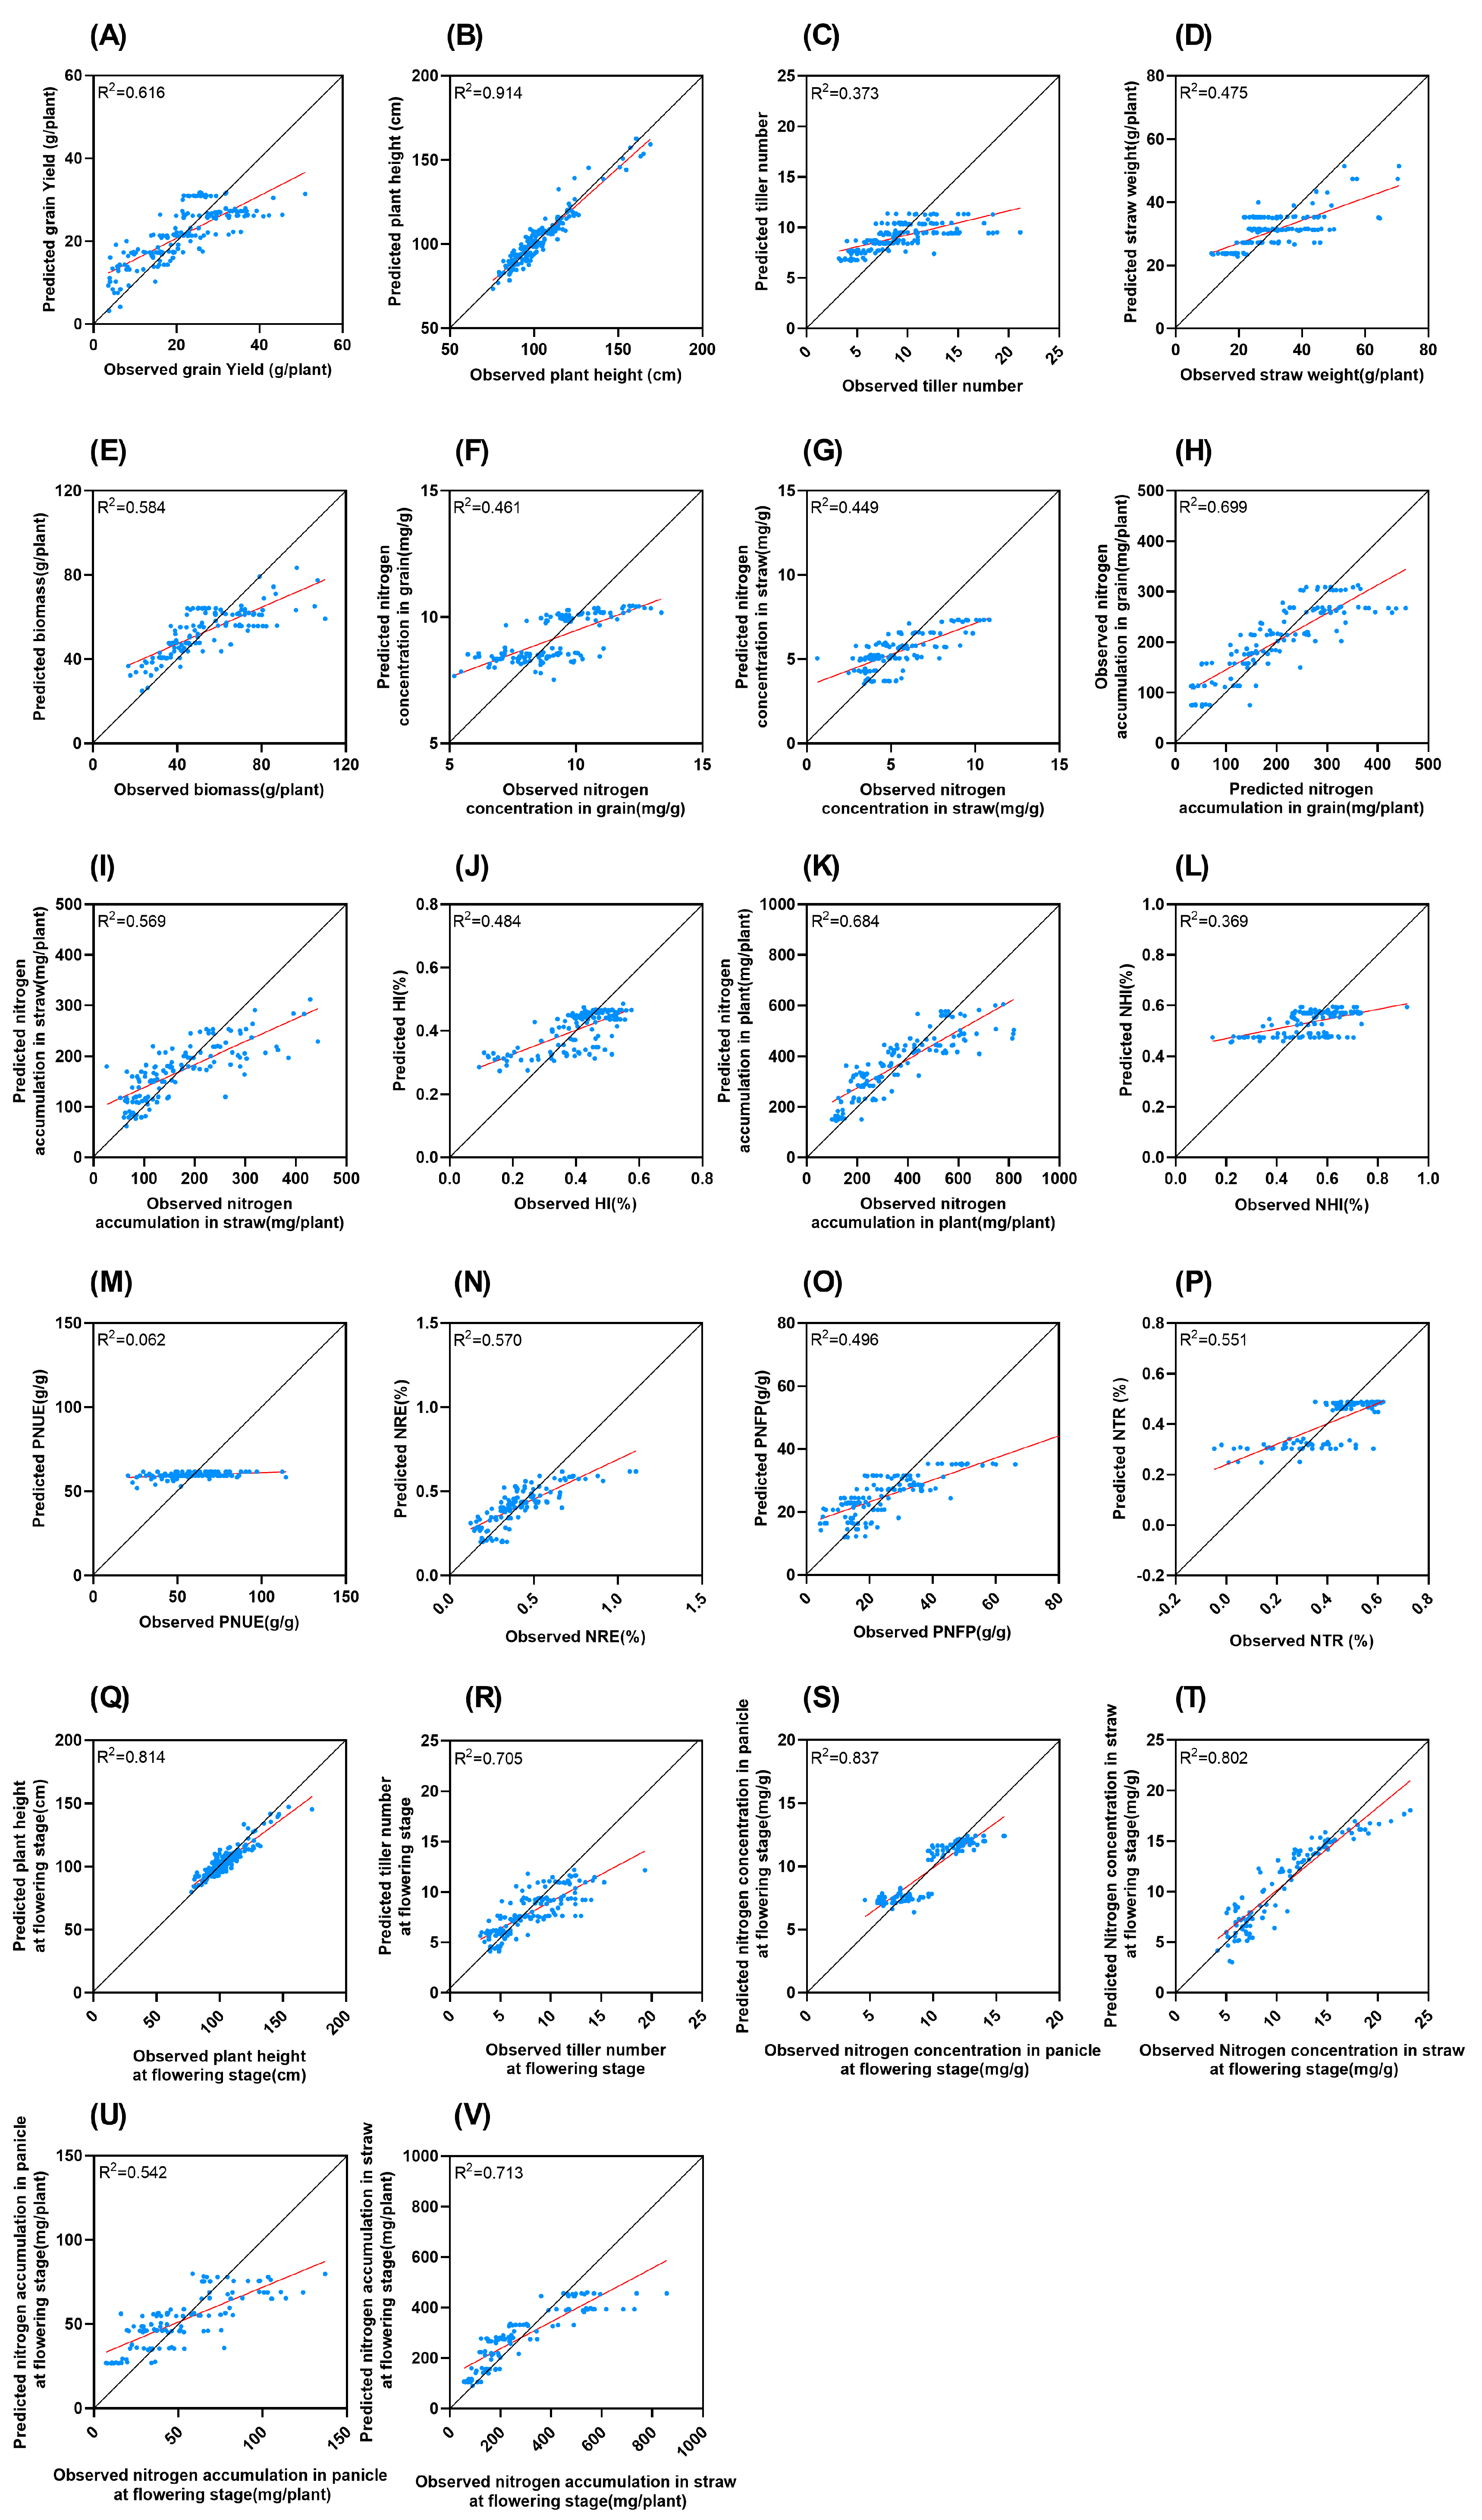
R2 for PNUE is the lowest, at only 0.062, while the highest R2 for plant height is 0.914 (Figure 6). R2 for the five NUE indicators are relatively low: the NHI (0.369), NRE (0.570), PNFP (0.496), and the NTR (0.551).
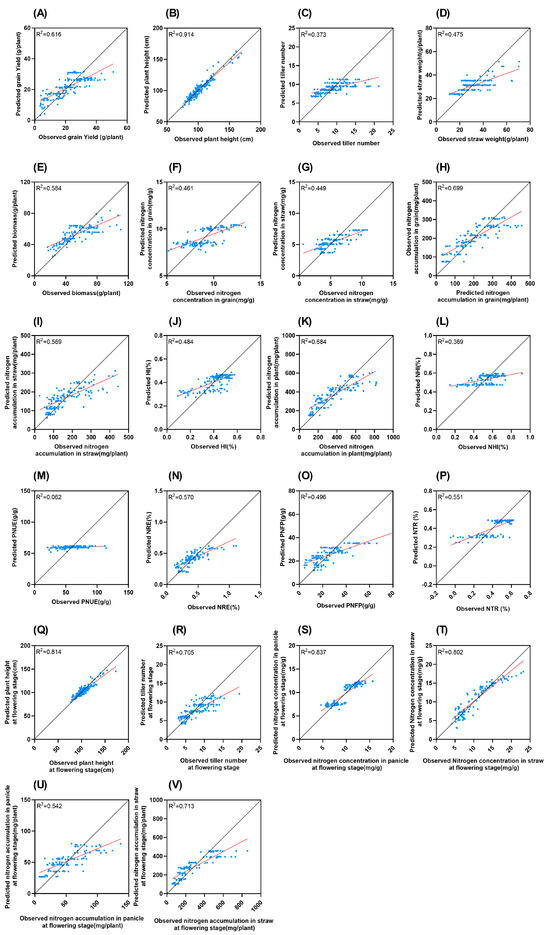
Figure 6.
Comparison of measured and LASSO predicted values of different traits. Black solid line represents 1:1 line. Red line represents trend line (A): Grain yield; (B): plant height; (C): tiller number; (D): straw weight; (E): biomass; (F): nitrogen concentration in grain; (G): nitrogen concentration in straw; (H): nitrogen accumulation in grain; (I): nitrogen accumulation in straw; (J): HI; (K): nitrogen accumulation in plant; (L): NHI; (M): PNUE; (N): NRE; (O): PNFP; (P): NTR; (Q): plant height at flowering stage; (R): tiller number at flowering stage; (S): nitrogen concentration in panicle at flowering stage; (T): nitrogen concentration in straw at flowering stage; (U): nitrogen accumulation in panicle at flowering stage; (V): nitrogen accumulation in straw at flowering stage.
The R2 value represents the goodness of the model fit to the data. The low R2 value of PNUE suggests that the variables incorporated in this study possess extremely limited explanatory power for the variation in PNUE. This likely implies that aside from the factors currently considered in this research, there are other crucial factors influencing PNUE, such as the soil microbial community [21] and the inherent genetic characteristics of rice varieties [22], which are highly worthy of exploration in future study. Moreover, as shown in Figure 3, increasing nitrogen application can mitigate the loss of NUE caused by high temperatures. The relationship between temperature, nitrogen fertilization, and NUE is far from a simple, linear one. In contrast, the high R2 value of plant height (0.914) indicates that the model we constructed can effectively account for the changes in plant height. This means that under the conditions of this study, the main factors affecting plant height have been effectively incorporated into the model.
4. Discussion
4.1. Rainfall During Tillering Stage Is Crucial for the Growth of Rice and NUE
In the last two decades, the yield losses caused by extreme rainfall have been comparable to those caused by extreme temperatures. Nationwide observations and model simulations indicate that extreme rainfall has led to an approximate 8% reduction in rice yield in China [23]. Some studies have shown that nitrogen application, temperature, and rainfall significantly affect the NUE of japonica rice, with nitrogen application having the largest impact, followed by temperature, and rainfall having a relatively smaller influence [22]. Therefore, this study focused on nitrogen application, temperature, and rainfall to explore their effects on the NUE of rice.
Rainfall variability plays a significant role in rice growth and development. To acquire more energy resources, rice plants in deep water environments elongate their internodes rapidly due to the activation of ethylene biosynthesis and increased levels of gibberellin/abscisic acid [24]. This physiological mechanism also explains why plant height in this study was significantly positively correlated with rainfall during the jointing and booting stage (Table 1).
Analysis showed that during the vegetative growth stage, extreme rainfall primarily reduced effective panicle numbers by limiting nitrogen availability during tillering [23]. However, some studies have also shown that rainfall during tillering and jointing and booting stages exert a positive impact on rice yield, and an increase in rainfall in the vegetative growth stage will increase the ratio of grain to grass [25]. In 2021 and 2022, daily rainfall during the tillering stage ranged from 2.1 to 9.7 mm, and that in jointing and booting stage ranges from 1.6 to 11.3 mm. On only one day, the daily rainfall is higher than 80 mm. These rainfall conditions were consistent with the positive correlations found between rainfall in these stages and biomass, the HI, and the four NUE types, highlighting the critical role of rainfall in the vegetative growth stage (Table 1 and Table S2).
4.2. High Temperature Significantly Reduces the Yield and NUE of Rice, and the Reproductive Growth Stage Is the Most Sensitive to High Temperatures
High-temperature stress represents one of the crucial challenges confronted in rice cultivation. Rising temperatures are expected to negatively impact rice yield and NUE. Some studies indicate that for every 1 °C increase in global temperature, the global rice yield decreases by approximately 3.2 ± 3.7% [26]. In areas where the maximum temperatures approach 30 °C, the soil surface temperatures can reach 45 °C [27]. The effects of high temperatures differ among the various growth stages. Other studies show that during the vegetative stage, high nighttime temperatures can accelerate rice development without significantly affecting the total biomass [28]. However, nighttime high temperatures have been reported to reduce biomass, while daytime high temperatures produce the opposite effect [29]. This study found that the days of high-temperature stress during the filling stage was significantly negatively correlated with straw weight and biomass. Figure 3B shows that in the high-temperature years, the biomass at the N1 and N3 gradients was significantly lower than that in 2021, while no significant differences were observed at the N2 and N4 gradients. This suggests that the mechanisms by which high temperatures affect rice biomass are complex, aligning with the study by Pereira et al. [30].
According to previous research, high temperatures primarily limit grain growth by inhibiting dry matter transport, rather than reducing photosynthesis [31]. In this study, the HI was significantly correlated with the maximum temperature during the flowering stage (Table 1). Saud et al. [32] reported that rice yield is primarily influenced by post flowering background temperatures. High temperatures affect panicle differentiation and flower fertilization, ultimately resulting in a decrease in yield. High temperatures have a more pronounced negative impact on early rice yield, particularly during the filling stage. In contrast, the vegetative stage is less sensitive to high temperatures [33]. These findings align with this study, which found that rice yield was closely related to the maximum temperature during the jointing and booting stage and the days of high-temperature stress during the flowering and filling stages. The reproductive growth stage is the most temperature-sensitive stage for rice, not the vegetative growth stage (Table 1).
Some studies have shown that post flowering warming can increase the crude protein content in both early and late rice [34,35]. Other studies have indicated that as temperatures decrease during the filling stage, the grain protein content initially decreases, and then increases. Under all the temperature conditions, increasing nitrogen application enhances the grain protein content [36]. Furthermore, high nighttime temperatures have a more detrimental effect on rice yield and quality than high daytime temperatures, particularly on the grain protein content [37]. In this study, the average temperature during filling stage was 27.2 °C, and the rice grain nitrogen concentration was significantly positively correlated with the minimum temperature during the filling stage and nitrogen application. Since rice grain nitrogen concentration is directly related to the crude protein content, these findings are consistent with the previous studies (Table S2).
High-temperature stress significantly affects the reproductive development of rice, particularly the development of male and female reproductive organs. Since pollen is more sensitive to temperature stress, its viability, germination ability, and pollen tube growth are likely to be more severely affected. By contrast, female gametes are less affected. This developmental asynchrony is likely to have a negative impact on fertilization success, consequently reducing seed yield and quality [38,39]. For example, high-temperature stress shortens the time the stigma is receptive to pollen, limiting pollen stigma interactions and reducing fertilization opportunities [18]. Moreover, high temperatures can lead to poor anther dehiscence, which significantly impairs pollen release and dispersal efficiency [40]. This may explain why the reproductive growth stage is the most temperature-sensitive stage for rice.
4.3. Practical Suggestions for Farmers’ Production: Multi-Dimensional Strategies to Help Rice Cope with Climate Change and Achieve Efficient Production
The identification of heat-vulnerable rice growth stages based on LASSO enables the implementation of targeted interventions to augment the thermotolerance of rice. Farmers should prioritize thermal monitoring during the flowering and grain-filling stages, when high-temperature exposure most significantly reduces yields [41]. The practical measures include midday (12:00) mist spraying, which reduces the canopy temperature by 1.35 °C and increases yields by 13.6% through delayed leaf senescence and enhanced photosynthetic efficiency [42]. Concurrent nitrogen management is critical during these stages, with supplemental applications offsetting heat-induced yield losses, while maintaining NUE. These interventions synergize with saturated irrigation practices that maintain root zone temperatures 0.8–2.0 °C below ambient levels, thereby preserving root activity and ammonium assimilation capacity [43].
Our data revealed that rainfall during the tillering (2.1–9.7 mm/day) and jointing and booting stages (1.6–11.3 mm/day) was positively correlated with biomass accumulation, the HI, and NUE, emphasizing water management’s critical role in the vegetative phases. Yu et al. [44] indicated that the impacts of irrigation methods on rice vary under different soil and climate conditions. When the pH is greater than 6.5 and the total precipitation is less than 900 mm, water-saving irrigation exacerbates yield losses. For instance, in low-organic-content soils (<1.5%), the yield loss reaches 7.7%. In contrast, in acidic soils (pH < 6.5), high-rainfall regions (annual precipitation > 900 mm), and when the average annual temperature is ≥15 °C, water-saving irrigation can increase rice yields to varying degrees. Precision nitrogen scheduling is essential. Sun et al. [45] pointed out that before flag-leaf development, applying 40–60% of the total nitrogen as a panicle fertilizer and distributing it equally during the fourth/second or third/first leaf emergence stages can optimize NUE. Meanwhile, adjusting the planting time is also a good strategy to avoid the adverse effects of high temperatures on rice flowering and filling [46].
These findings provide integrated crop management practices: immediate field-level adaptations (microclimate control and water–nitrogen synergy) coupled with strategic planning (site-specific irrigation, staged fertilization, and adjusting planting schedules). In other rice growing regions, agricultural producers can identify the key factors driving climate change through LASSO and take targeted measures to mitigate the high-temperature stress impacts on rice yield and NUE. Additionally, these findings provide valuable insights for breeding heat-tolerant germplasm and conducting molecular biology research.
4.4. Beyond Traditional Models: LASSO Reveals True Climate Drivers of NUE in Rice Growth Analysis
Although our findings have clearly expounded on the climatic determinants of NUE, the generalizability potential of LASSO requires further validation. A study by Sun et al. [22] demonstrated that there is substantial variability in the Nitrogen Utilization Efficiency (NUtE) of rice across Asia. This variability is mainly attributable to anthropogenic interventions, climatic variables, and cultivar characteristics. Their research used the generalized linear model to identify the four key modulators of NUtE: the nitrogen/potassium fertilization levels, temperature, and solar radiation intensity. By making use of their comprehensive dataset, we conducted LASSO regression analysis. The results of our analysis (Table S3) validated the dominant impacts of nitrogen supply (β = −5.55), temperature (β = −3.36), insolation incidence (β = 2.35), and potassium supply (β = 2.12) on the variation in NUtE. Notably, it was observed that the japonica showed a superior NUtE performance in comparison with that of indica, and the inbred variety exhibited a better performance relative to that of the hybrid. These findings further confirm the core predictors identified in the reference study, thus demonstrating the robustness of LASSO regression in resolving the climate-nutrient interactions across different spatial gradients.
Methodologically, the LASSO regression improves the predictive accuracy via L1-norm regularization, which is capable of performing coefficient shrinkage and automatic feature selection. When applied to collinear climatic predictors, this regularization technique renders the redundant variables ineffective, while retaining the biologically meaningful ones [47,48,49]. Our analysis revealed a positive association between NUtE and radiation (β = 2.35), and we found no significant relationship between precipitation and NUtE, which is in contrast to the negative correlations reported by Sun et al. [22]. This divergence probably arises from the multicollinearity in their dataset. As shown in Figure S2, the correlation coefficient between temperature and precipitation is 0.878, and correlation coefficient between temperature and insolation incidence is 0.866. However, in such a multicollinear situation, the generalized linear model might misinterpret the relationships, while LASSO can disentangle these complex collinear predictors accurately [50]. Therefore, LASSO regression provides a more reliable and accurate method for exploring the complex relationships between rice growth and the climate.
4.5. Limitation
This study has several limitations. Firstly, this research focused on a specific sample of 15 rice varieties grown in a single location (Baima, Nanjing, China). These varieties may not represent the full diversity of rice. In particular, the potential influence of varying soil conditions was not explored. Soil properties, especially the nutrient content, can significantly affect rice yield and NUE [51]. Furthermore, NUE-related traits were not recorded in 2020. Simultaneously, the current model cannot fully capture the complex interactions between nitrogen fertilizer and heat stress. We suggest future molecular-level investigations mechanistically link the nitrogen rate, NUE, and thermal tolerance. Lastly, all the results in this study used lambda.1se to identify the independent variables most significantly correlated with the dependent variables. This approach may lead to lower R2 values and potentially overlook secondary climate drivers. Future studies can address these limitations by including a broader range of rice varieties, locations, climate conditions, and alternative machine learning methods to better explore the effects of climatic factors on rice yield and NUE.
5. Conclusions
This study employed LASSO regression to analyze the impacts of nitrogen application, temperature, and rainfall at different growth stages on rice yield NUE. Our findings highlight three critical insights: (1) the reproductive growth stages (flowering and filling stages) exhibit heightened sensitivity to high temperatures, with substantial losses in yield (33.1% average), NRE (22.4–60.5%), and the NTR (26.3–61.6%), revealing heat stress severely affects nitrogen transportation, remobilization, and uptake; (2) the vegetative growth stages (tillering and jointing and booting stages) show significant rainfall sensitivity, influencing over half of the measured traits, including four NUE types; (3) increasing nitrogen application can alleviate the losses caused by high temperatures, particularly demonstrated by 30.0% and 41.8% PNUE increases at N3 and N4 under 2022 extreme heat.
To address climate warming challenges, we propose practical solutions: immediate field-level adaptations coupled with strategic planning. Although this study focused on the japonica varieties in Jiangsu Province, the actionable strategies proposed can serve as a reference for rice-producing regions facing climatic pressures, helping them identify the key climate-related factors affecting rice production. Future studies should validate these approaches across diverse agricultural production area to refine climate and nitrogen management practices.
Supplementary Materials
The following supporting information can be downloaded at: https://www.mdpi.com/article/10.3390/agronomy15030677/s1, Figure S1: Change in fitting deviation with different λ values; Figure S2: Correlation analysis of different factors. Table S1: Soil basic properties; Table S2: Effect coefficients of LASSO regression for different rice traits; Table S3: Effect coefficients of LASSO regression for NutE.
Author Contributions
Conceptualization, Y.M. and X.F.; methodology, Y.M.; software, X.L.; validation, Y.M.; formal analysis, Y.M.; investigation, M.S., H.Z. and J.X.; resources, L.Z.; data curation, Y.M.; writing—original draft preparation, Y.M.; writing—review and editing, Y.M. and X.F.; project administration, X.F.; funding acquisition, X.F. All authors have read and agreed to the published version of the manuscript.
Funding
This work was funded by The National Natural Science Foundation of China (32172665); Innovation ability construction plan of Zhongshan biological breeding Laboratory (bm2022008-02); Key Re-search and Development Project of Hainan Province in 2024 (Science and Technology Commissioner Category) (ZDYF2024KJTPY006).
Data Availability Statement
The datasets generated and analyzed during the current study are available from the corresponding author on reasonable request.
Conflicts of Interest
The authors declare no conflicts of interest.
Abbreviations
The following abbreviations are used in this manuscript:
| LASSO | Least absolute shrinkage and selection operator |
| NUE | Nitrogen use efficiency |
| NRE | Nitrogen recovery efficiency |
| NTR | Nitrogen translocation ratio |
| PNUE | Physiological nitrogen use efficiency |
| HI | Harvest index |
| NHI | Nitrogen harvest index |
| NPFP | Nitrogen partial factor productivity |
| NUtE | Nitrogen Utilization Efficiency |
References
- Liu, X.; Liu, Y.; Liu, Z.; Chen, Z. Impacts of climatic warming on cropping system borders of China and potential adaptation strategies for regional agriculture development. Sci. Total Environ. 2021, 755, 142415. [Google Scholar] [CrossRef] [PubMed]
- Vergé, X.P.C.; De Kimpe, C.; Desjardins, R.L. Agricultural production, greenhouse gas emissions and mitigation potential. Agric. Forest Meteorol. 2007, 142, 255–269. [Google Scholar] [CrossRef]
- Xia, L.; Ti, C.; Li, B.; Xia, Y.; Yan, X. Greenhouse gas emissions and reactive nitrogen releases during the life-cycles of staple food production in China and their mitigation potential. Sci. Total Environ. 2016, 556, 116–125. [Google Scholar] [CrossRef] [PubMed]
- Abascal, E.; Gómez-Coma, L.; Ortiz, I.; Ortiz, A. Global diagnosis of nitrate pollution in groundwater and review of removal technologies. Sci. Total Environ. 2022, 810, 152233. [Google Scholar] [CrossRef]
- Fan, X.; Sun, X.; Yang, R.; Chen, S.; Li, R.; Bian, X.; Xia, L.; Zhang, C. Comparative Analyses of Grain Quality in Response to High Temperature during the Grain-Filling Stage between Wxa and Wxb under Indica and Japonica Backgrounds. Agronomy 2023, 13, 17. [Google Scholar] [CrossRef]
- Yao, D.; Wu, J.; Luo, Q.; Li, J.; Zhuang, W.; Xiao, G.; Deng, Q.; Lei, D.; Bai, B. Influence of high natural field temperature during grain filling stage on the morphological structure and physicochemical properties of rice (Oryza sativa L.) starch. Food Chem. 2020, 310, 125817. [Google Scholar] [CrossRef]
- Huang, M.; Zhang, H.; Zhao, C.; Chen, G.; Zou, Y. Amino acid content in rice grains is affected by high temperature during the early grain-filling period. Sci. Rep. 2019, 9, 2700. [Google Scholar] [CrossRef]
- Liao, G.; Yang, Y.; Xiao, W.; Mo, Z. Nitrogen Modulates Grain Yield, Nitrogen Metabolism, and Antioxidant Response in Different Rice Genotypes. J. Plant Growth Regul. 2023, 42, 2103–2114. [Google Scholar] [CrossRef]
- Yu, J.; Du, T.; Zhang, P.; Ma, Z.; Chen, X.; Cao, J.; Li, H.; Li, T.; Zhu, Y.; Xu, F.; et al. Impacts of High Temperatures on the Growth and Development of Rice and Measures for Heat Tolerance Regulation: A Review. Agronomy 2024, 14, 2811. [Google Scholar] [CrossRef]
- Liu, K.; Deng, J.; Lu, J.; Wang, X.; Lu, B.; Tian, X.; Zhang, Y. High Nitrogen Levels Alleviate Yield Loss of Super Hybrid Rice Caused by High Temperatures During the Flowering Stage. Front. Plant Sci. 2019, 10, 357. [Google Scholar] [CrossRef]
- Yamori, W.; Nagai, T.; Makino, A. The rate-limiting step for CO2 assimilation at different temperatures is influenced by the leaf nitrogen content in several C3 crop species. Plant Cell Environ. 2011, 34, 764–777. [Google Scholar] [CrossRef] [PubMed]
- Huang, G.; Zhang, Q.; Wei, X.; Peng, S.; Li, Y. Nitrogen Can Alleviate the Inhibition of Photosynthesis Caused by High Temperature Stress under Both Steady-State and Flecked Irradiance. Front. Plant Sci. 2017, 8, 945. [Google Scholar] [CrossRef] [PubMed]
- Cao, J.; Zhang, Z.; Tao, F.; Zhang, L.; Luo, Y.; Zhang, J.; Han, J.; Xie, J. Integrating Multi-Source Data for Rice Yield Prediction across China using Machine Learning and Deep Learning Approaches. Agric. Forest Meteorol. 2021, 297, 108275. [Google Scholar] [CrossRef]
- Zhang, J.; Fu, Z.; Zhang, K.; Li, J.; Cao, Q.; Tian, Y.; Zhu, Y.; Cao, W.; Liu, X. Optimizing rice in-season nitrogen topdressing by coupling experimental and modeling data with machine learning algorithms. Comput. Electron. Agric. 2023, 209, 107858. [Google Scholar] [CrossRef]
- Das, B.; Nair, B.; Reddy, V.K.; Venkatesh, P. Evaluation of multiple linear, neural network and penalised regression models for prediction of rice yield based on weather parameters for west coast of India. Int. J. Biometeorol. 2018, 62, 1809–1822. [Google Scholar] [CrossRef]
- Zhang, Y.; Tateishi-Karimata, H.; Endoh, T.; Jin, Q.; Li, K.; Fan, X.; Ma, Y.; Gao, L.; Lu, H.; Wang, Z.; et al. High-temperature adaptation of an OsNRT2.3 allele is thermoregulated by small RNAs. Sci. Adv. 2022, 8, eadc9785. [Google Scholar] [CrossRef]
- Friedman, J.; Hastie, T.; Tibshirani, R. Regularization Paths for Generalized Linear Models via Coordinate Descent. J. Stat. Softw. 2010, 33, 1–22. [Google Scholar] [CrossRef]
- Das, S.; Krishnan, P.; Nayak, M.; Ramakrishnan, B. High temperature stress effects on pollens of rice (Oryza sativa L.) genotypes. Environ. Exp. Bot. 2014, 101, 36–46. [Google Scholar] [CrossRef]
- Xu, G.; Fan, X.; Miller, A.J. Plant nitrogen assimilation and use efficiency. Annu. Rev. Plant Biol. 2012, 63, 153–182. [Google Scholar] [CrossRef]
- Li, J.; Veeranampalayam-Sivakumar, A.; Bhatta, M.; Garst, N.D.; Stoll, H.; Stephen Baenziger, P.; Belamkar, V.; Howard, R.; Ge, Y.; Shi, Y. Principal variable selection to explain grain yield variation in winter wheat from features extracted from UAV imagery. Plant Methods 2019, 15, 123. [Google Scholar] [CrossRef]
- Farooq, M.S.; Uzair, M.; Maqbool, Z.; Fiaz, S.; Yousuf, M.; Yang, S.H.; Khan, M.R. Improving Nitrogen Use Efficiency in Aerobic Rice Based on Insights into the Ecophysiology of Archaeal and Bacterial Ammonia Oxidizers. Front. Plant Sci. 2022, 13, 913204. [Google Scholar] [CrossRef] [PubMed]
- Sun, Y.; Gao, L.; Meng, X.; Huang, J.; Guo, J.; Zhou, X.; Fu, G.; Xu, Y.; Firbank, L.G.; Wang, M.; et al. Large-scale exploration of nitrogen utilization efficiency in Asia region for rice crop: Variation patterns and determinants. Glob. Change Biol. 2023, 29, 5367–5378. [Google Scholar] [CrossRef] [PubMed]
- Fu, J.; Jian, Y.; Wang, X.; Li, L.; Ciais, P.; Zscheischler, J.; Wang, Y.; Tang, Y.; Müller, C.; Webber, H.; et al. Extreme rainfall reduces one-twelfth of China’s rice yield over the last two decades. Nat. Food 2023, 4, 416–426. [Google Scholar] [CrossRef] [PubMed]
- Pradhan, C.; Mohanty, M. Submergence Stress: Responses and adaptations in crop plants. In Molecular Stress Physiology of Plants; Rout, G.R., Das, A.B., Eds.; Springer: New Delhi, India, 2013; pp. 331–357. [Google Scholar]
- Abbas, S.; Mayo, Z.A. Impact of temperature and rainfall on rice production in Punjab, Pakistan. Environ. Dev. Sustain. 2021, 23, 1706–1728. [Google Scholar] [CrossRef]
- Zhao, C.; Liu, B.; Piao, S.; Wang, X.; Lobell, D.B.; Huang, Y.; Huang, M.; Yao, Y.; Bassu, S.; Ciais, P.; et al. Temperature increase reduces global yields of major crops in four independent estimates. Proc. Natl. Acad. Sci. USA 2017, 114, 9326–9331. [Google Scholar] [CrossRef]
- Kolb, P.F.; Robberecht, R. High temperature and drought stress effects on survival of Pinus ponderosa seedlings. Tree Physiol. 1996, 16, 665–672. [Google Scholar] [CrossRef]
- Impa, S.M.; Raju, B.; Hein, N.T.; Sandhu, J.; Prasad, P.V.V.; Walia, H.; Jagadish, S.V.K. High night temperature effects on wheat and rice: Current status and way forward. Plant Cell Environ. 2021, 44, 2049–2065. [Google Scholar] [CrossRef]
- Xiong, D.; Ling, X.; Huang, J.; Peng, S. Meta-analysis and dose-response analysis of high temperature effects on rice yield and quality. Environ. Exp. Bot. 2017, 141, 1–9. [Google Scholar] [CrossRef]
- Pereira, J.; Figueiredo, N.; Goufo, P.; Carneiro, J.; Morais, R.; Carranca, C.; Coutinho, J.; Trindade, H. Effects of elevated temperature and atmospheric carbon dioxide concentration on the emissions of methane and nitrous oxide from Portuguese flooded rice fields. Atmos Environ. 2013, 80, 464–471. [Google Scholar] [CrossRef]
- Shi, P.; Zhu, Y.; Tang, L.; Chen, J.; Sun, T.; Cao, W.; Tian, Y. Differential effects of temperature and duration of heat stress during anthesis and grain filling stages in rice. Environ. Exp. Bot. 2016, 132, 28–41. [Google Scholar] [CrossRef]
- Saud, S.; Wang, D.; Fahad, S.; Alharby, H.F.; Bamagoos, A.A.; Mjrashi, A.; Alabdallah, N.M.; AlZahrani, S.S.; AbdElgawad, H.; Adnan, M.; et al. Comprehensive Impacts of Climate Change on Rice Production and Adaptive Strategies in China. Front. Microbiol. 2022, 13, 926059. [Google Scholar] [CrossRef] [PubMed]
- Song, Y.; Wang, C.; Linderholm, H.W.; Fu, Y.; Cai, W.; Xu, J.; Zhuang, L.; Wu, M.; Shi, Y.; Wang, G.; et al. The negative impact of increasing temperatures on rice yields in southern China. Sci. Total Environ. 2022, 820, 153262. [Google Scholar] [CrossRef]
- Rehmani, M.I.A.; Wei, G.; Hussain, N.; Ding, C.; Li, G.; Liu, Z.; Wang, S.; Ding, Y. Yield and quality responses of two indica rice hybrids to post-anthesis asymmetric day and night open-field warming in lower reaches of Yangtze River delta. Field Crops Res. 2014, 156, 231–241. [Google Scholar] [CrossRef]
- Chen, J.L.; Wilson, C.R.; Tapley, B.D.; Scanlon, B.; Güntner, A. Long-term groundwater storage change in Victoria, Australia from satellite gravity and in situ observations. Glob. Planet Change 2016, 139, 56–65. [Google Scholar] [CrossRef]
- Lu, B.; Xu, C.; Li, Z.; Tang, X.; Yang, F.; Xu, D.; Zhu, G.; Zhang, J.; Jiang, Y.; Li, W.; et al. Influence of the temperature during grain filling stage and nitrogen application rate on yield and quality of indica hybrid rice. Field Crops Res. 2024, 309, 109333. [Google Scholar] [CrossRef]
- Su, Q.; Rohila, J.S.; Ranganathan, S.; Karthikeyan, R. Rice yield and quality in response to daytime and nighttime temperature increase—A meta-analysis perspective. Sci. Total Environ. 2023, 898, 165256. [Google Scholar] [CrossRef]
- Hedhly, A.; Hormaza, J.I.; Herrero, M. Global warming and sexual plant reproduction. Trends Plant Sci. 2009, 14, 30–36. [Google Scholar] [CrossRef]
- Zinn, K.E.; Tunc-Ozdemir, M.; Harper, J.F. Temperature stress and plant sexual reproduction: Uncovering the weakest links. J Exp. Bot. 2010, 61, 1959–1968. [Google Scholar] [CrossRef]
- Matsui, T. Rice (Oryza sativa L.) Cultivars Tolerant to High Temperature at Flowering: Anther Characteristics. Ann. Bot. 2002, 89, 683–687. [Google Scholar] [CrossRef]
- Xu, Y.; Chu, C.; Yao, S. The impact of high-temperature stress on rice: Challenges and solutions. Crop J. 2021, 9, 963–976. [Google Scholar] [CrossRef]
- Jiang, X.; Hua, M.; Yang, X.; Hu, N.; Qiu, R.; Yang, S. Impacts of Mist Spray on Rice Field Micrometeorology and Rice Yield under Heat Stress Condition. Sci. Rep. 2020, 10, 1579. [Google Scholar] [CrossRef] [PubMed]
- Matsue, Y.; Takasaki, K.; Abe, J. Water Management for Improvement of Rice Yield, Appearance Quality and Palatability with High Temperature During Ripening Period. Rice Sci. 2021, 28, 409–416. [Google Scholar] [CrossRef]
- Yu, Q.; Dai, Y.; Wei, J.; Wang, J.; Liao, B.; Cui, Y. Rice yield and water productivity in response to water-saving irrigation practices in China: A meta-analysis. Agric. Water Manag. 2024, 302, 109006. [Google Scholar] [CrossRef]
- Sun, Y.; Ma, J.; Sun, Y.; Xu, H.; Yang, Z.; Liu, S.; Jia, X.; Zheng, H. The effects of different water and nitrogen managements on yield and nitrogen use efficiency in hybrid rice of China. Field Crops Res. 2012, 127, 85–98. [Google Scholar] [CrossRef]
- Liu, C.; Van der Fels-Klerx, H.J. Quantitative Modeling of Climate Change Impacts on Mycotoxins in Cereals: A Review. Toxins 2021, 13, 276. [Google Scholar] [CrossRef]
- He, S.; Li, X.; Sivakumar, V.; Banerjee, A. Interpretable Predictive Modeling for Climate Variables with Weighted Lasso. Proceedings of the. AAAI Conf. Artif. Intell. 2019, 33, 1385–1392. [Google Scholar] [CrossRef]
- Liang, X.; Sun, H. Weighted Selection Probability to Prioritize Susceptible Rare Variants in Multi-Phenotype Association Studies with Application to a Soybean Genetic Data Set. J. Comput. Biol. 2023, 30, 1075–1088. [Google Scholar] [CrossRef]
- Tibshirani, R. Regression Shrinkage and Selection via the Lasso. J. R. Stat. Soc. Ser. B 1996, 1, 267–288. [Google Scholar] [CrossRef]
- Abbasi, A.; Özkale, M.R. Restricted Liu estimator under stochastic linear restrictions in generalized linear models: Theory and applications. Commun. Stat.-Simul. Comput. 2023, 1–23. [Google Scholar] [CrossRef]
- Chen, G.; Duan, Q.; Wu, C.; He, X.; Hu, M.; Li, C.; Ouyang, Y.; Peng, L.; Yang, H.; Zhang, Q.; et al. Optimizing rice yield, quality and nutrient use efficiency through combined application of nitrogen and potassium. Front. Plant Sci. 2024, 15, 1335744. [Google Scholar] [CrossRef]

Disclaimer/Publisher’s Note: The statements, opinions and data contained in all publications are solely those of the individual author(s) and contributor(s) and not of MDPI and/or the editor(s). MDPI and/or the editor(s) disclaim responsibility for any injury to people or property resulting from any ideas, methods, instructions or products referred to in the content. |
© 2025 by the authors. Licensee MDPI, Basel, Switzerland. This article is an open access article distributed under the terms and conditions of the Creative Commons Attribution (CC BY) license (https://creativecommons.org/licenses/by/4.0/).