Article

Greenhouse Gas Emissions and Yield of Durum Wheat Under Organic and Conventional Fertilization in Three Texture Classes

by
Lucia Ottaiano
1,2,
Ida Di Mola
1,*,
Luca Vitale
2,*,
Eugenio Cozzolino
3,
Maria Eleonora Pelosi
1,
Giuseppe Maglione
4 and
Mauro Mori
1
1
Department of Agronomy, University of Naples Federico II, Portici, 80055 Naples, Italy
2
National Research Council, Department of Biology, Agriculture and Food Sciences, Institute for Agriculture and Forestry Systems in the Mediterranean, P.le Enrico Fermi 1, Loc. Porto del Granatello, Portici, 80055 Naples, Italy
3
CREA, Research Center for Cereal and Industrial Crops, 81100 Caserta, Italy
4
National Research Council, Institute for the Animal Production System in the Mediterranean Environment, P.le Enrico Fermi 1, Loc. Porto del Granatello, Portici, 80055 Naples, Italy
*
Authors to whom correspondence should be addressed.
Agronomy 2025, 15(3), 702; https://doi.org/10.3390/agronomy15030702
Submission received: 10 February 2025 / Revised: 7 March 2025 / Accepted: 12 March 2025 / Published: 13 March 2025
(This article belongs to the Section Soil and Plant Nutrition)

Abstract

:
Durum wheat (Triticum turgidum subsp. durum), though less widespread than soft wheat, is crucial in Mediterranean countries. Agriculture significantly contributes to global climate change by emitting greenhouse gases, particularly nitrous oxide, which accounts for about 6% of global warming because of its long atmospheric lifetime and heat-trapping capacity. Soil fertility is influenced by the interplay of its physical, chemical, and biological properties, which, in turn, affect the production of nitrous oxide (N2O), a potent greenhouse gas. The yield-scaled N2O emission index, which measures N2O emissions relative to crop yield, is used to develop sustainable agricultural strategies. Our study aimed to compare the effects of organic vs. conventional fertilization on durum wheat yield and N2O emissions across three soils differing in texture. The study was carried out from autumn 2020 to spring 2021 in Portici (Naples, Italy). A factorial combination was applied, involving three different texture classes (clay, sand, and loam) and four fertilization strategies (no fertilization, compost, digestate, and mineral fertilization). Our results highlight that in sandy soil, wheat yield reached its highest values, particularly under digestate fertilization (+74.5%) and, interestingly, with lower cumulative N2O emissions (−16%). However, in sandy soil, the protein content of kernels was lower, similar to that recorded for the fertilization with digestate.

1. Introduction

Agriculture contributes to global climate change by emitting greenhouse gases into the atmosphere, but it is also one of the economic activities most affected by it, as climate is an essential factor for cultivation. The greenhouse effect is the main cause of the increase in temperatures [1], and one of the most important greenhouse gases is nitrous oxide (N2O), which contributes 6% to global warming. Nitrous oxide in the atmosphere has a very long lifetime [2] and traps heat in the planetary system [3,4,5]. An exponential increase in the atmospheric concentration of N2O has occurred in the last period [4]; indeed, it has been shown that it increased by 20 times since pre-industrial times and by more than 30% since 1990 [6]. About 10 years ago, global N2O emissions were around 12.4 million tons, and they are expected to increase to about 13 million tons by 2050 [6]. In Europe, soil management practices are responsible for about 70% of total annual nitrous oxide [7], which is produced by the activity of microbial denitrification and nitrification [8]. These processes are controlled by various soil-related factors, including moisture, temperature, and nitrogen (N) content, which, in turn, are strongly dependent on texture [9,10]. The variation in soil physicochemical properties provides opportunities to compare the role of soil properties on N2O emissions under uniform environmental and management conditions [11]. Therefore, interest is growing in the scientific community regarding processes regulating N2O emissions from agricultural soils. The water-filled pore space (WFPS) and nitrate concentration are very important factors in the spatial and temporal variability of N2O emissions in different soil types and environmental conditions. Therefore, knowing them can help identify effective mitigation strategies to reduce N2O emissions from agricultural soils [12,13,14,15].
Many studies have demonstrated that the application of organic materials can maintain or even significantly increase crop yield compared to the application of synthetic fertilizers [16,17,18]. Furthermore, the organic material increases soil fertility and reduces environmental deterioration [19,20,21].
Organic amendments such as compost and digestate have been proposed as a sustainable alternative to synthetic fertilizers. According to some studies, organic materials increase N2O production [22,23,24]; according to others, they reduce them [25,26,27]. These contrasting results are due to the different types of applied organic matter, climate, and soil conditions [28,29]. The application of organic fertilizers in wheat increases the exogenous carbon (C) content and soil organic matter (SOM), contributing to the sequestration of readily available nitrogen and promoting the conversion of N2O into N2 during denitrification, thereby reducing N2O emissions. Additionally, the increase in carbon sources improves nutrient efficiency and soil physical properties, significantly stimulating microbial community activity. This accelerates microbial metabolism and increases soil microbial carbon and nitrogen contents [28]. In another study on maize, SOM was significantly increased by the application of organic manure, accelerating mineralization under higher temperatures with the production of NH4+, which is the by-product of nitrification and denitrification, and, therefore, yielding greater emissions of N2O [29].
The N2O Emissions Yield Index (N2O-EYI), the ratio between cumulative N2O emissions and production (expressed as dry matter), is an agronomic and environmental metric used to assess the trade-off between crop productivity and nitrous oxide (N2O) emissions [30]. The N2O emissions yield index considers both environmental and economic impacts; therefore, it can be used to develop appropriate policies for sustainable agricultural production and environmental protection by accounting for both crop yields and N2O emissions [25,31,32,33,34,35,36]. Therefore, in order to reduce greenhouse gas emissions, it is necessary to identify cultivation practices that increase crop yields while avoiding large increases in greenhouse gases [37,38,39]. Lv et al. [12] showed that substituting 25% of chemical fertilizer with organic manure can reduce yield-scaled N2O emissions and maintain good crop productivity.
Globally, durum wheat (Triticum turgidum subsp. durum) is considered a minor cereal compared to soft wheat, representing only 8–10% of the total cultivated wheat area [37]. However, production has exceeded 700 million tons in recent years, with Mediterranean countries being the primary producers and consumers [38]. It is mainly used for processing in Mediterranean countries, which are the main consumers. The cultivation of durum wheat in the Mediterranean region faces major environmental constraints, particularly drought and extreme temperatures, which negatively affect critical growth stages, such as flowering, pollination, and grain filling [39]. These environmental stresses necessitate molecular adaptation strategies to mitigate their adverse effects [40,41].
Therefore, this study aimed to compare the effects of organic vs. conventional fertilization on durum wheat yield and N2O emissions across three soil types.

2. Materials and Methods

2.1. Experimental Site, Cropping System, Management, and Yield Measurements

The study was carried out during autumn 2021 and spring 2022 at the Experimental Station of the Department of Agricultural Sciences in Portici. The durum wheat seeds were sown on 23 December 2021 with a density of 400 per square meter. The experimental design was a factorial combination between three different texture classes (clay, sand, and loam) and four different fertilization strategies (not fertilized—Cont; fertilized with compost—Com; fertilized with digestate—Dig; fertilized with mineral—Min). Each treatment was performed three times for a total of 36 plots.
Before the sowing, the soil was sampled at a depth of 0.30 m, and the main physical and chemical properties of the soils are given in Table 1.
“Marco Aurelio” was the variety used for the trial. This variety is characterized by great adaptability to different growing areas, which ensures that production is always constant and satisfactory. In addition, it has excellent qualitative characteristics of grain and semolina, with high protein content in the grain and a high yellowness index in the semolina.
The nitrogen dose was calculated using the balance method and was 120 kg ha−1. The compost and digestate were applied at sowing; the organic nitrogen content was 2% and 0.6% for compost and digestate, respectively. In contrast, the mineral fertilizer was applied as ammonium nitrate (26% N) in two doses (30% at sowing and 70% at tillering). Harvesting took place on 23 June; a 2 m−2 sample area was cut and weighed to determine grain yield, plant height, and harvest index (HI). In addition, the percentage of vitreous and shrinking kernels was assessed visually on three samples of 100 seeds per treatment and replicated. In the laboratory, the nitrogen content was determined using the Kjeldhal method, and then, the protein content of the kernels was determined by multiplying the nitrogen content by a factor of 6.25.

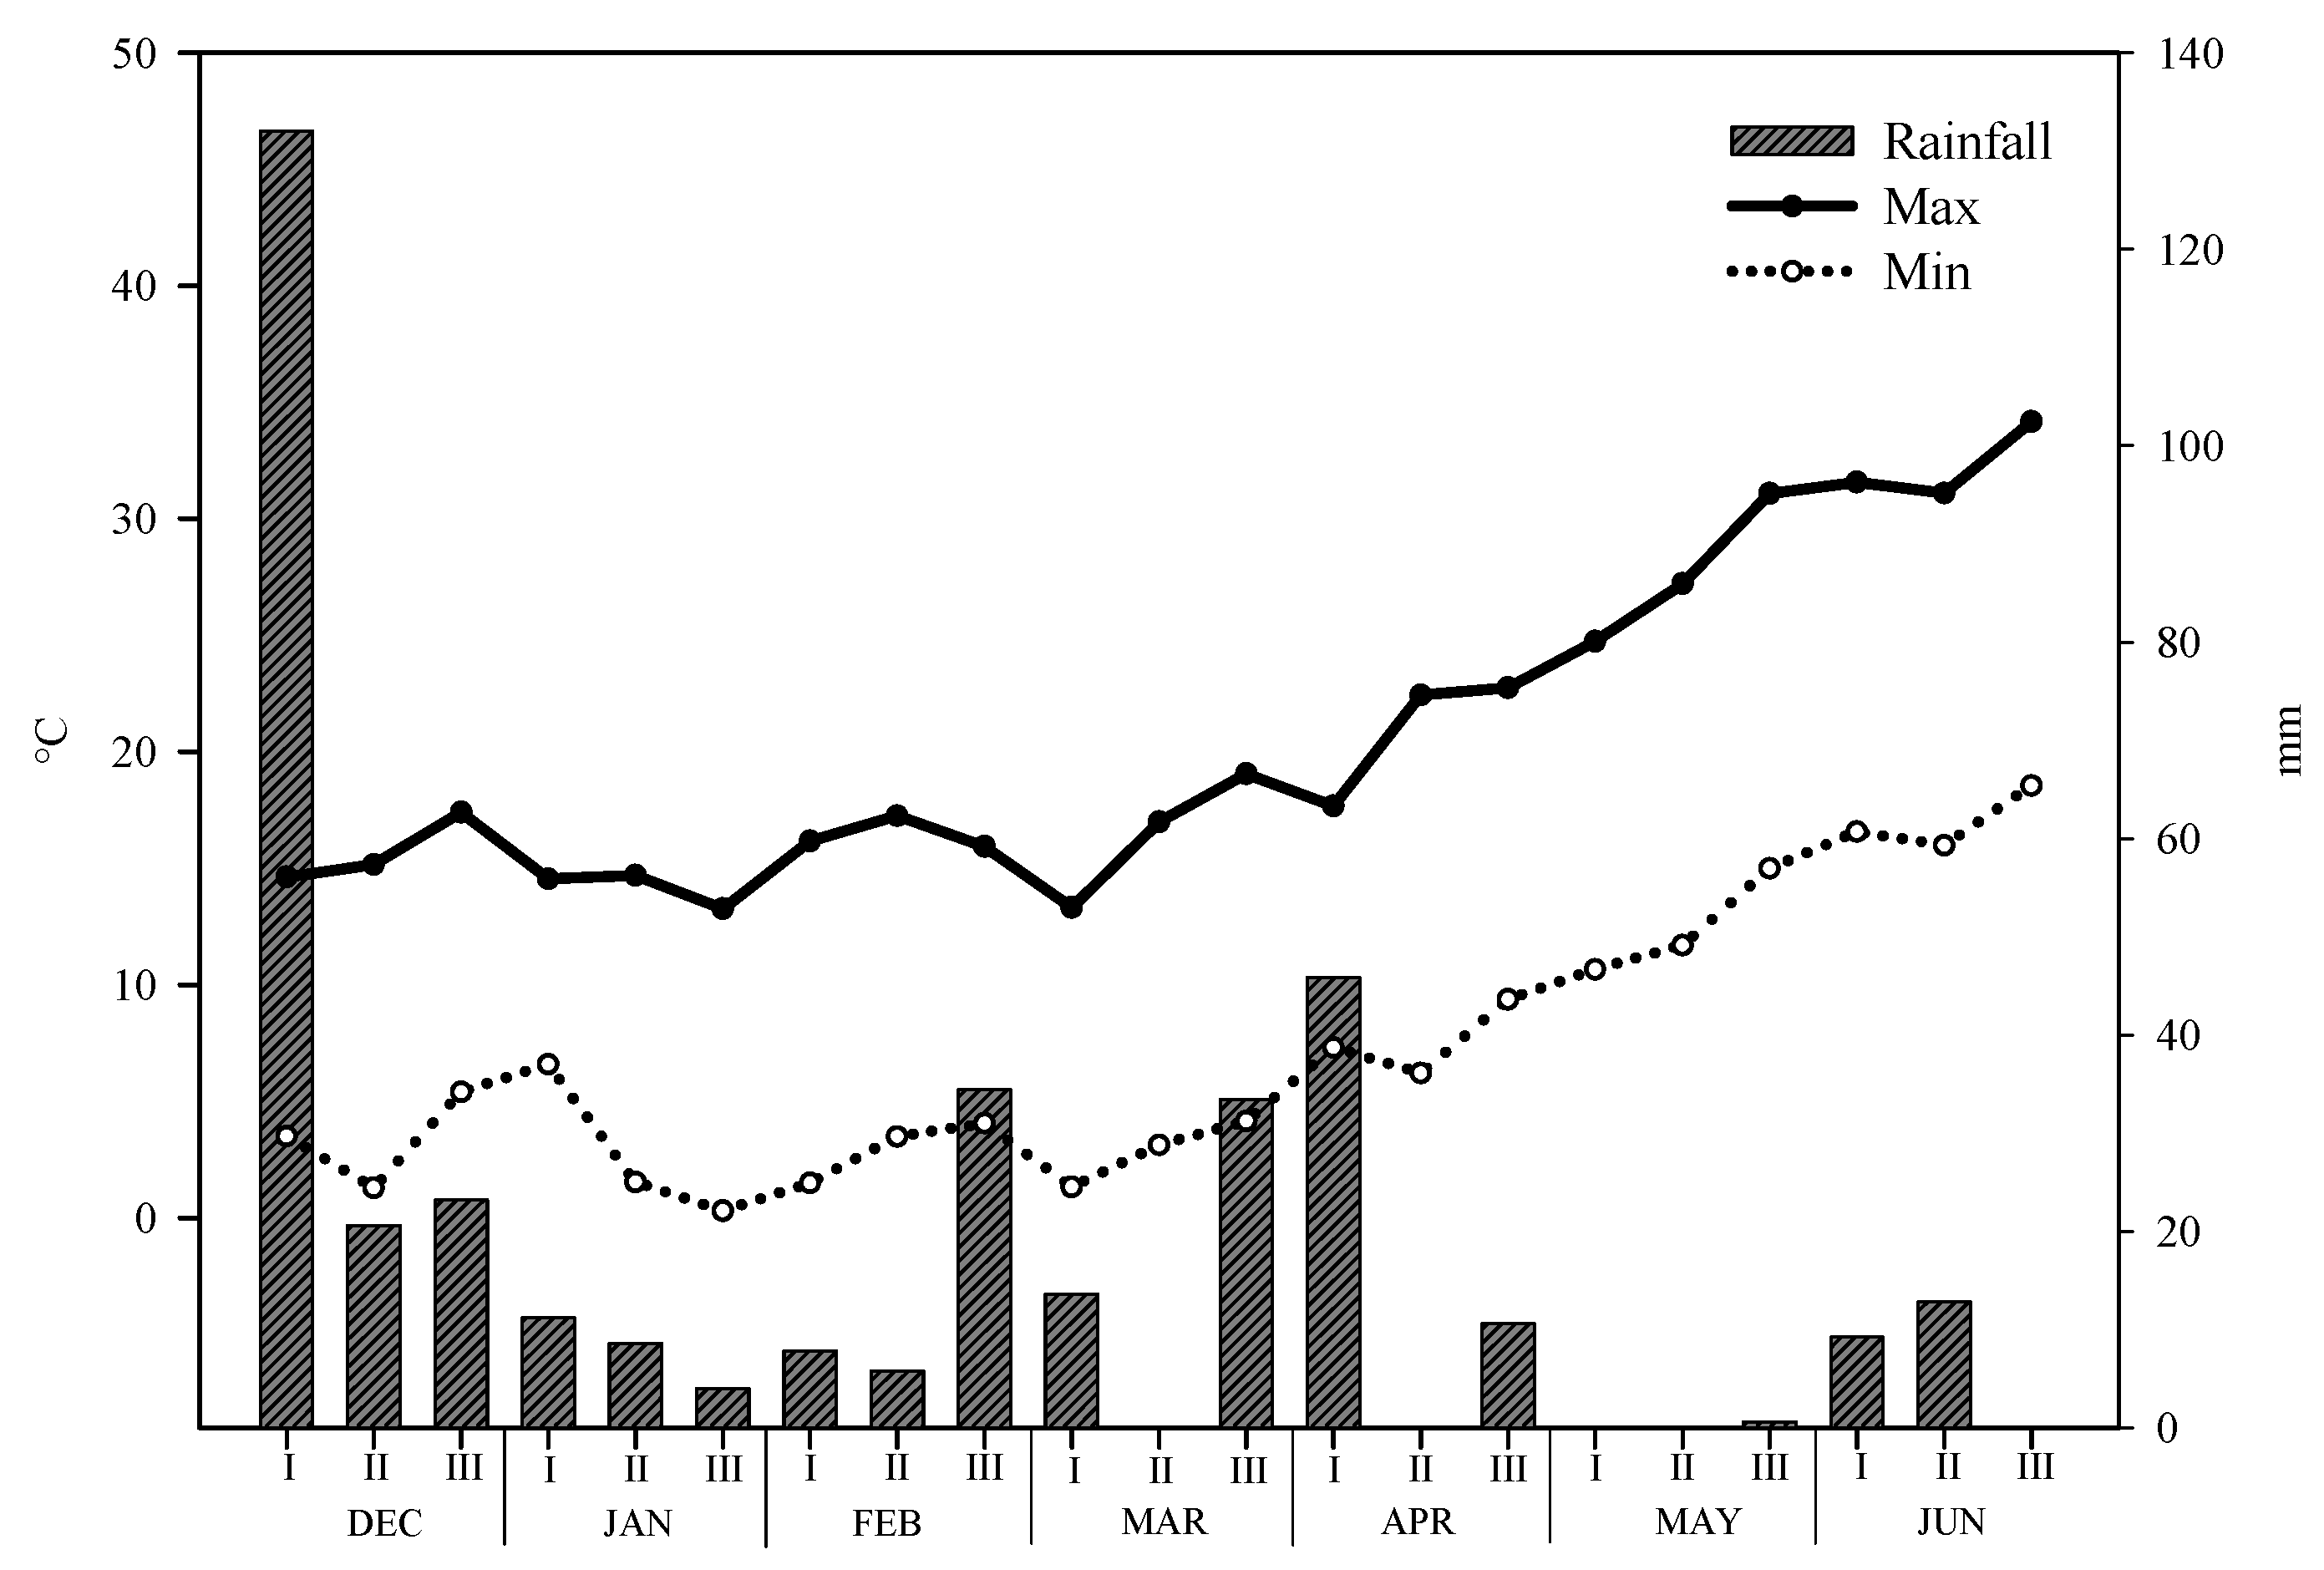
2.2. Weather Conditions of Experimental Site

During the whole growing period, typical Mediterranean climate conditions were observed, with a mild, wet winter and warm, dry summer. The minimum temperature ranged between 0.3 °C in the last ten days of January and 18.9 °C in the last ten days of June, while the ranges of maximum temperatures were 13.3 °C in the last ten days of January and 34.2 °C in the last ten days of June (Figure 1). Rainfall during the growing season amounted to 374 mm.

2.3. Soil N2O Flux Measurement and Cumulative Flux

During the crop cycle, N2O emissions were measured by the static chamber technique. Twelve chambers were located for each soil; therefore, 3 chambers were present for each fertilization strategy (one chamber per replication). The chambers (0.20 m diameter, 0.15 m height, and 4.7 L) were inserted into the soil and were left there for the entire measurement period. Air samples were collected using a PVC syringe (Pikdare SPA MTD Medical, Casnate Con Bernate, CO, Italy) and were stored in 0.20 L evacuated vials until analysis; initially, ambient air samples were collected while the chambers were still open (t = 0). Subsequently, the chambers were closed, and air samples were taken every 10 min by flushing the vial volume three times using a double-needle inlet connected to the chamber headspace. The gas samples were then analyzed by gas chromatography (Micro GC Fusion; Inficon, Sommacampagna, VR, Italy).
Cumulative flux (fc) was determined considering the average flux obtained in each sampling date and carrying out a linear interpolation according to Ranucci et al. [42].

2.4. Nitrogen Content, Soil Moisture

The soil nitrate (NO3) content was measured from samples collected at a 0–0.30 m depth using an auger. To obtain a representative sample for each chamber, multiple soil samples were taken near each auto-chamber and combined. Then, the soil was air-dried, sieved (2 mm), and analyzed for NO3 content using a colorimetric method with a spectrophotometer (DR 2000; HACH Co., Loveland, CO, USA). The sampling dates were as follows: 20 December 2021 (before sowing); 19 January, 23 February, 17 March, 14 April, 11–25 May, and 21 June 2022.
The soil moisture was measured at a 0–0.20 m depth by means of two soil moisture sensors (Theta Probe; Delta-T devices Ltd., Cambridge, UK), which were used to determine the water-filled pore space (WFPS) as follows:
WFPS = VSWC/[1 − (BD/2.65)]
where 2.65 represents the average density calculated on the basis of the relative content of the different mineral constituents [43], BD is the bulk density, and VSWC is the volumetric soil water content.

2.5. Calculations of N2O Intensity and Emission Factor

N2O intensity was calculated as an indicator of both crop productivity and environmental costs when evaluating optimal nitrogen rate. The yield-scaled N2O emissions were determined with the following formula [44]:
N 2 O   intensity = cum N 2 O emissions ( k g   h a 1 ) dry   product ( t   h a 1 )
The N2O emission factor (EF) was calculated as shown in the following equation [12]:
N 2 O   E F = cum N 2 O   treatment cum N 2 O   control N   applied × 100
The cumulative N2O emissions were obtained by subtracting the cumulative N2O emissions of the no fertilization treatment from the cumulative N2O emissions of the fertilized treatments and dividing it by the N fertilization rate.

2.6. Statistical Analysis

The data were subjected to a two-way analysis of variance (ANOVA) using a general linear model with the SPSS software package (SPSS version 22, Chicago, IL, USA). Means were separated according to the Tukey test at p ≤ 0.05. The regression analyses were performed using all of the data collected during the monitoring activities (N2O emissions, soil NO3 concentration, and WFPS).

3. Results

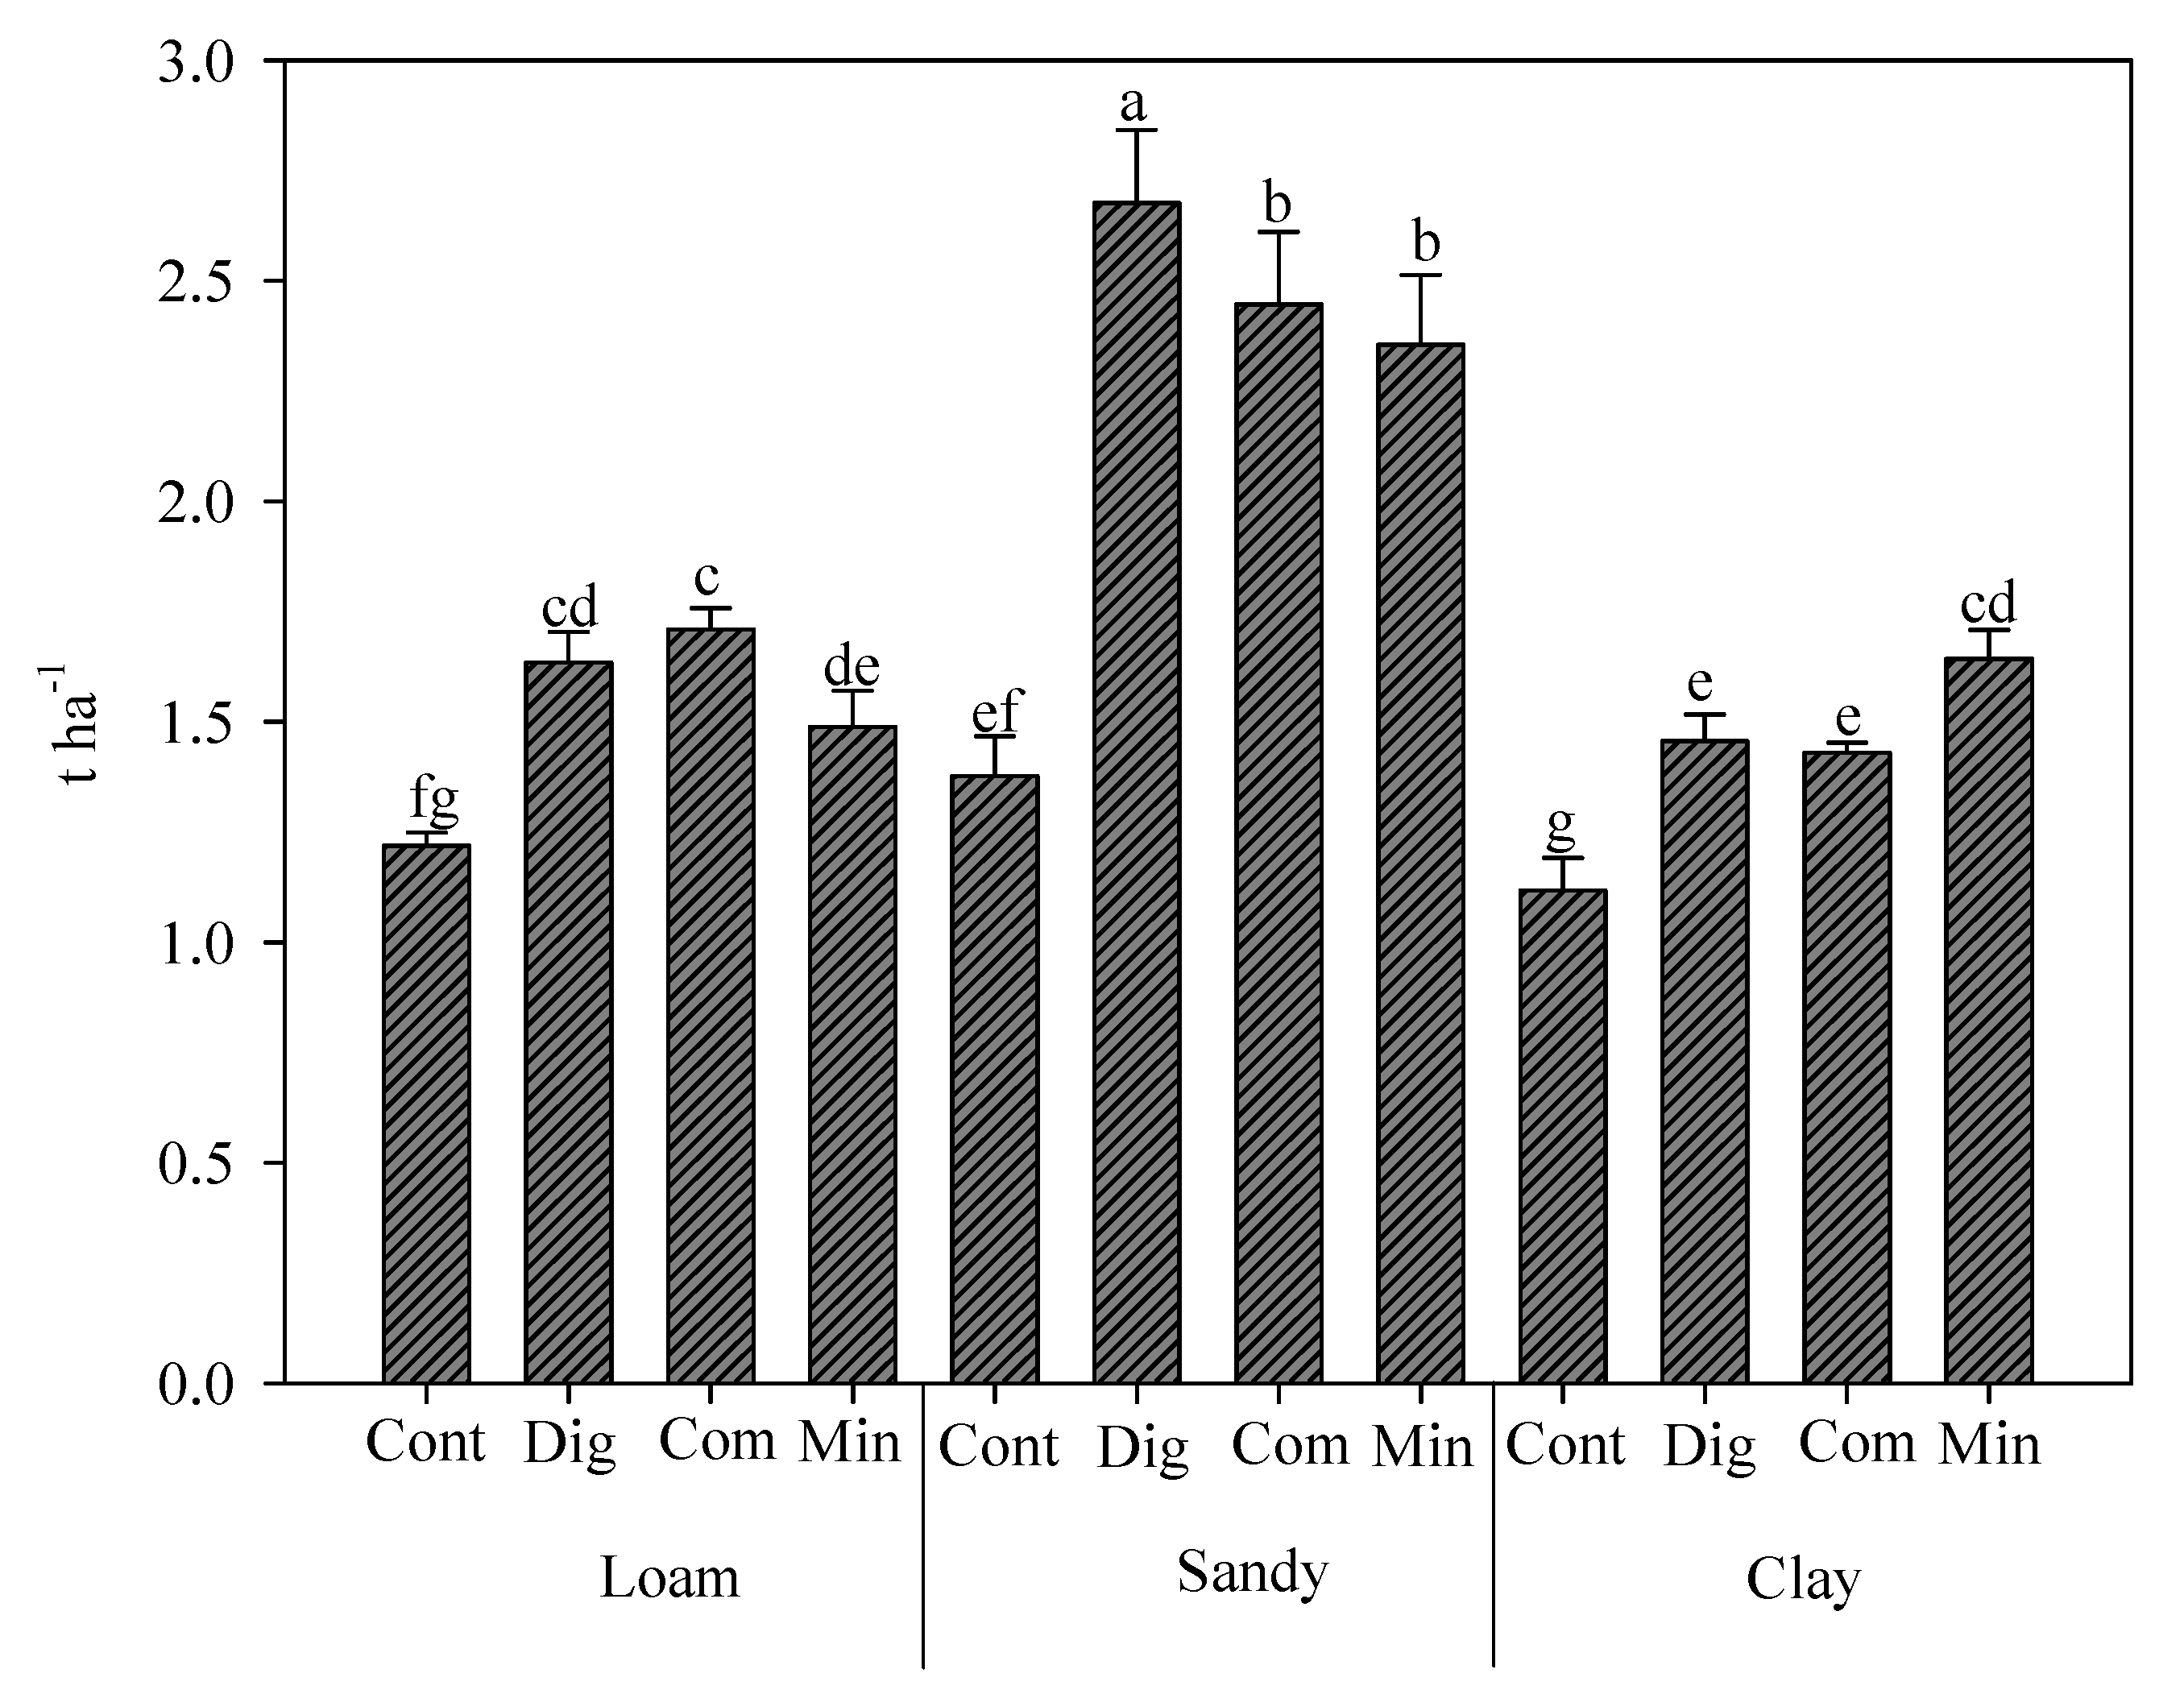
3.1. Yield and Its Components

Wheat yield was affected by the interaction between types of soil and fertilization strategies (ST × F). The highest wheat yield was recorded in sandy soil with digestate fertilization (2.7 t ha−1), which was significantly different from all other treatments (Figure 2). Conversely, in the other two soils, no significant differences were found between the two organic fertilization treatments. Interestingly, only in clay soil, the Min showed higher values than organic fertilizations (Figure 2).
The interaction ST × F also affected the shrinking and protein percentage of grains; overall, the shrinking percentage was low in all treatments, reaching 4% only in the grain of plants grown on clay soil and not fertilized. The highest protein content was found in grains of plants grown on clay soil with mineral fertilization (16.8%), and, as expected, the lowest one was in the unfertilized sandy soil (9.1%) (Table 2). The mean protein contents were 14.4%, 13.5%, and 11.2% for loam, clay, and sandy soil, respectively, while they were 15.4%, 12.7%, 11.7%, and 11.2% for Min, Com, Cont, and Dig, respectively (Table 2). The HI was higher in sandy soil (38.5% vs. 31.5% of the mean value of clay and loam soils, respectively), and the vitreousness percentages were 33.1% vs. 16.0% (mean value of clay and loam soils, respectively) (Table 2). The mean value of the plants’ height was 65.3 cm, irrespective of treatments.

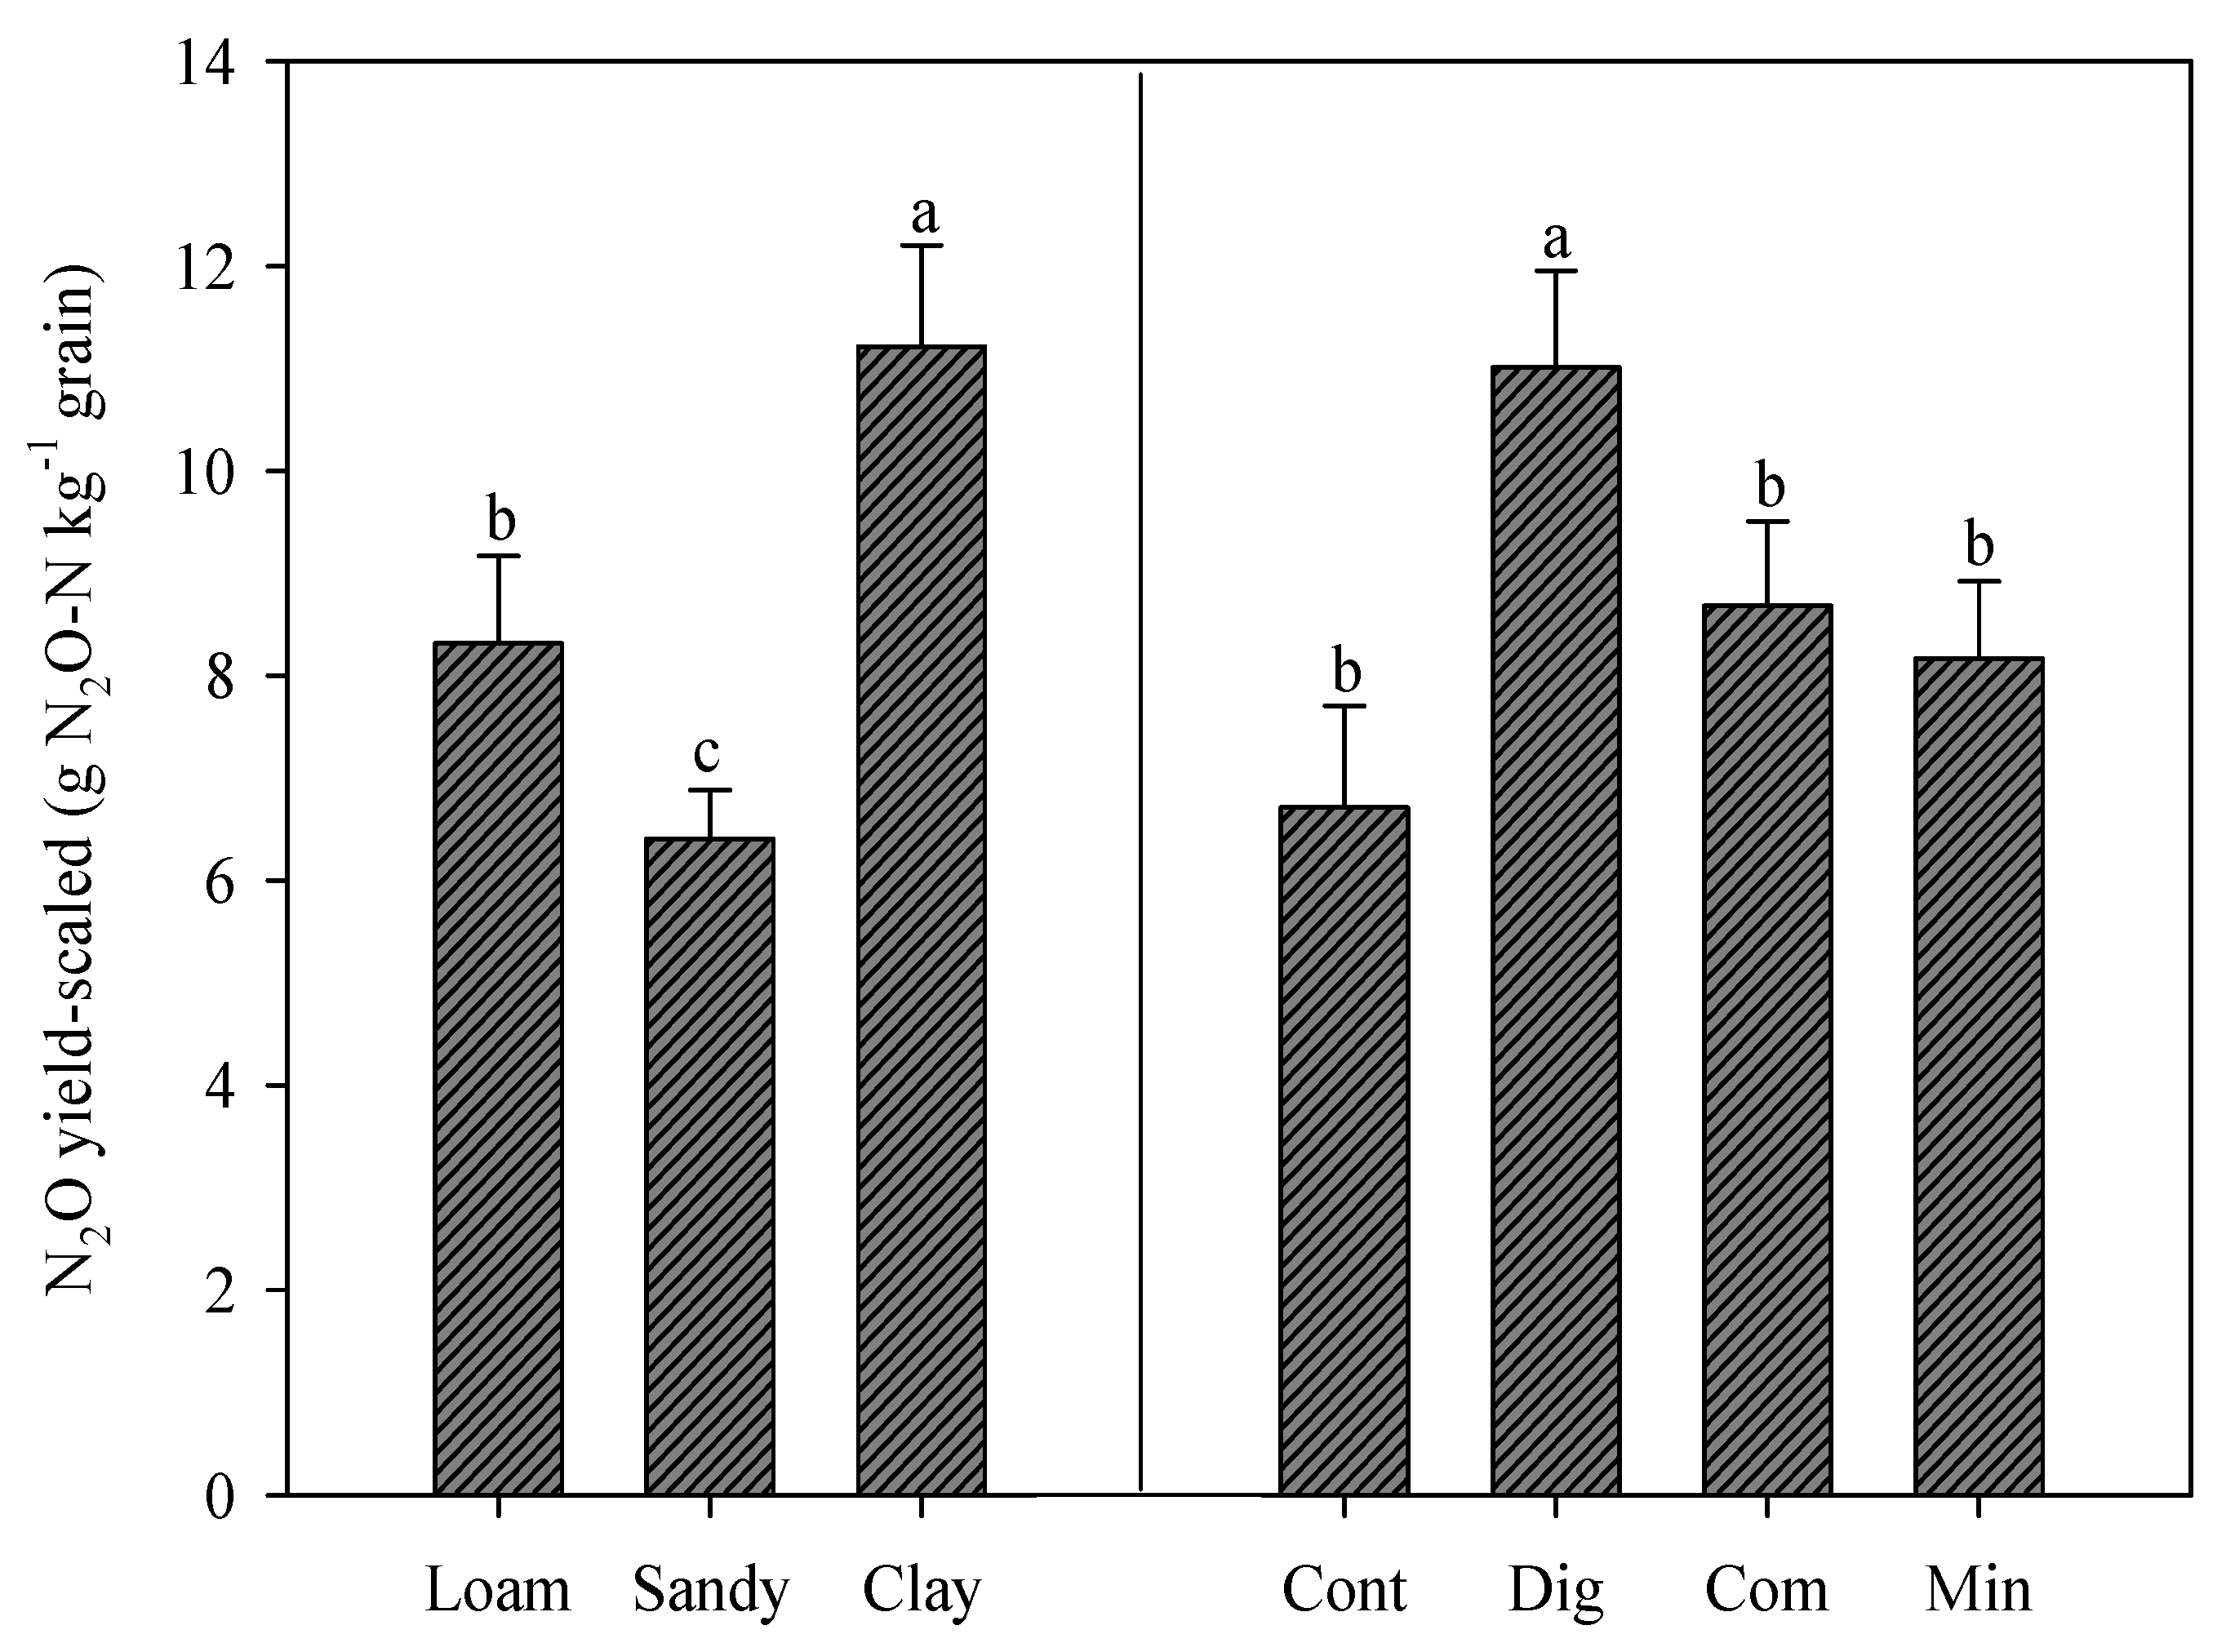
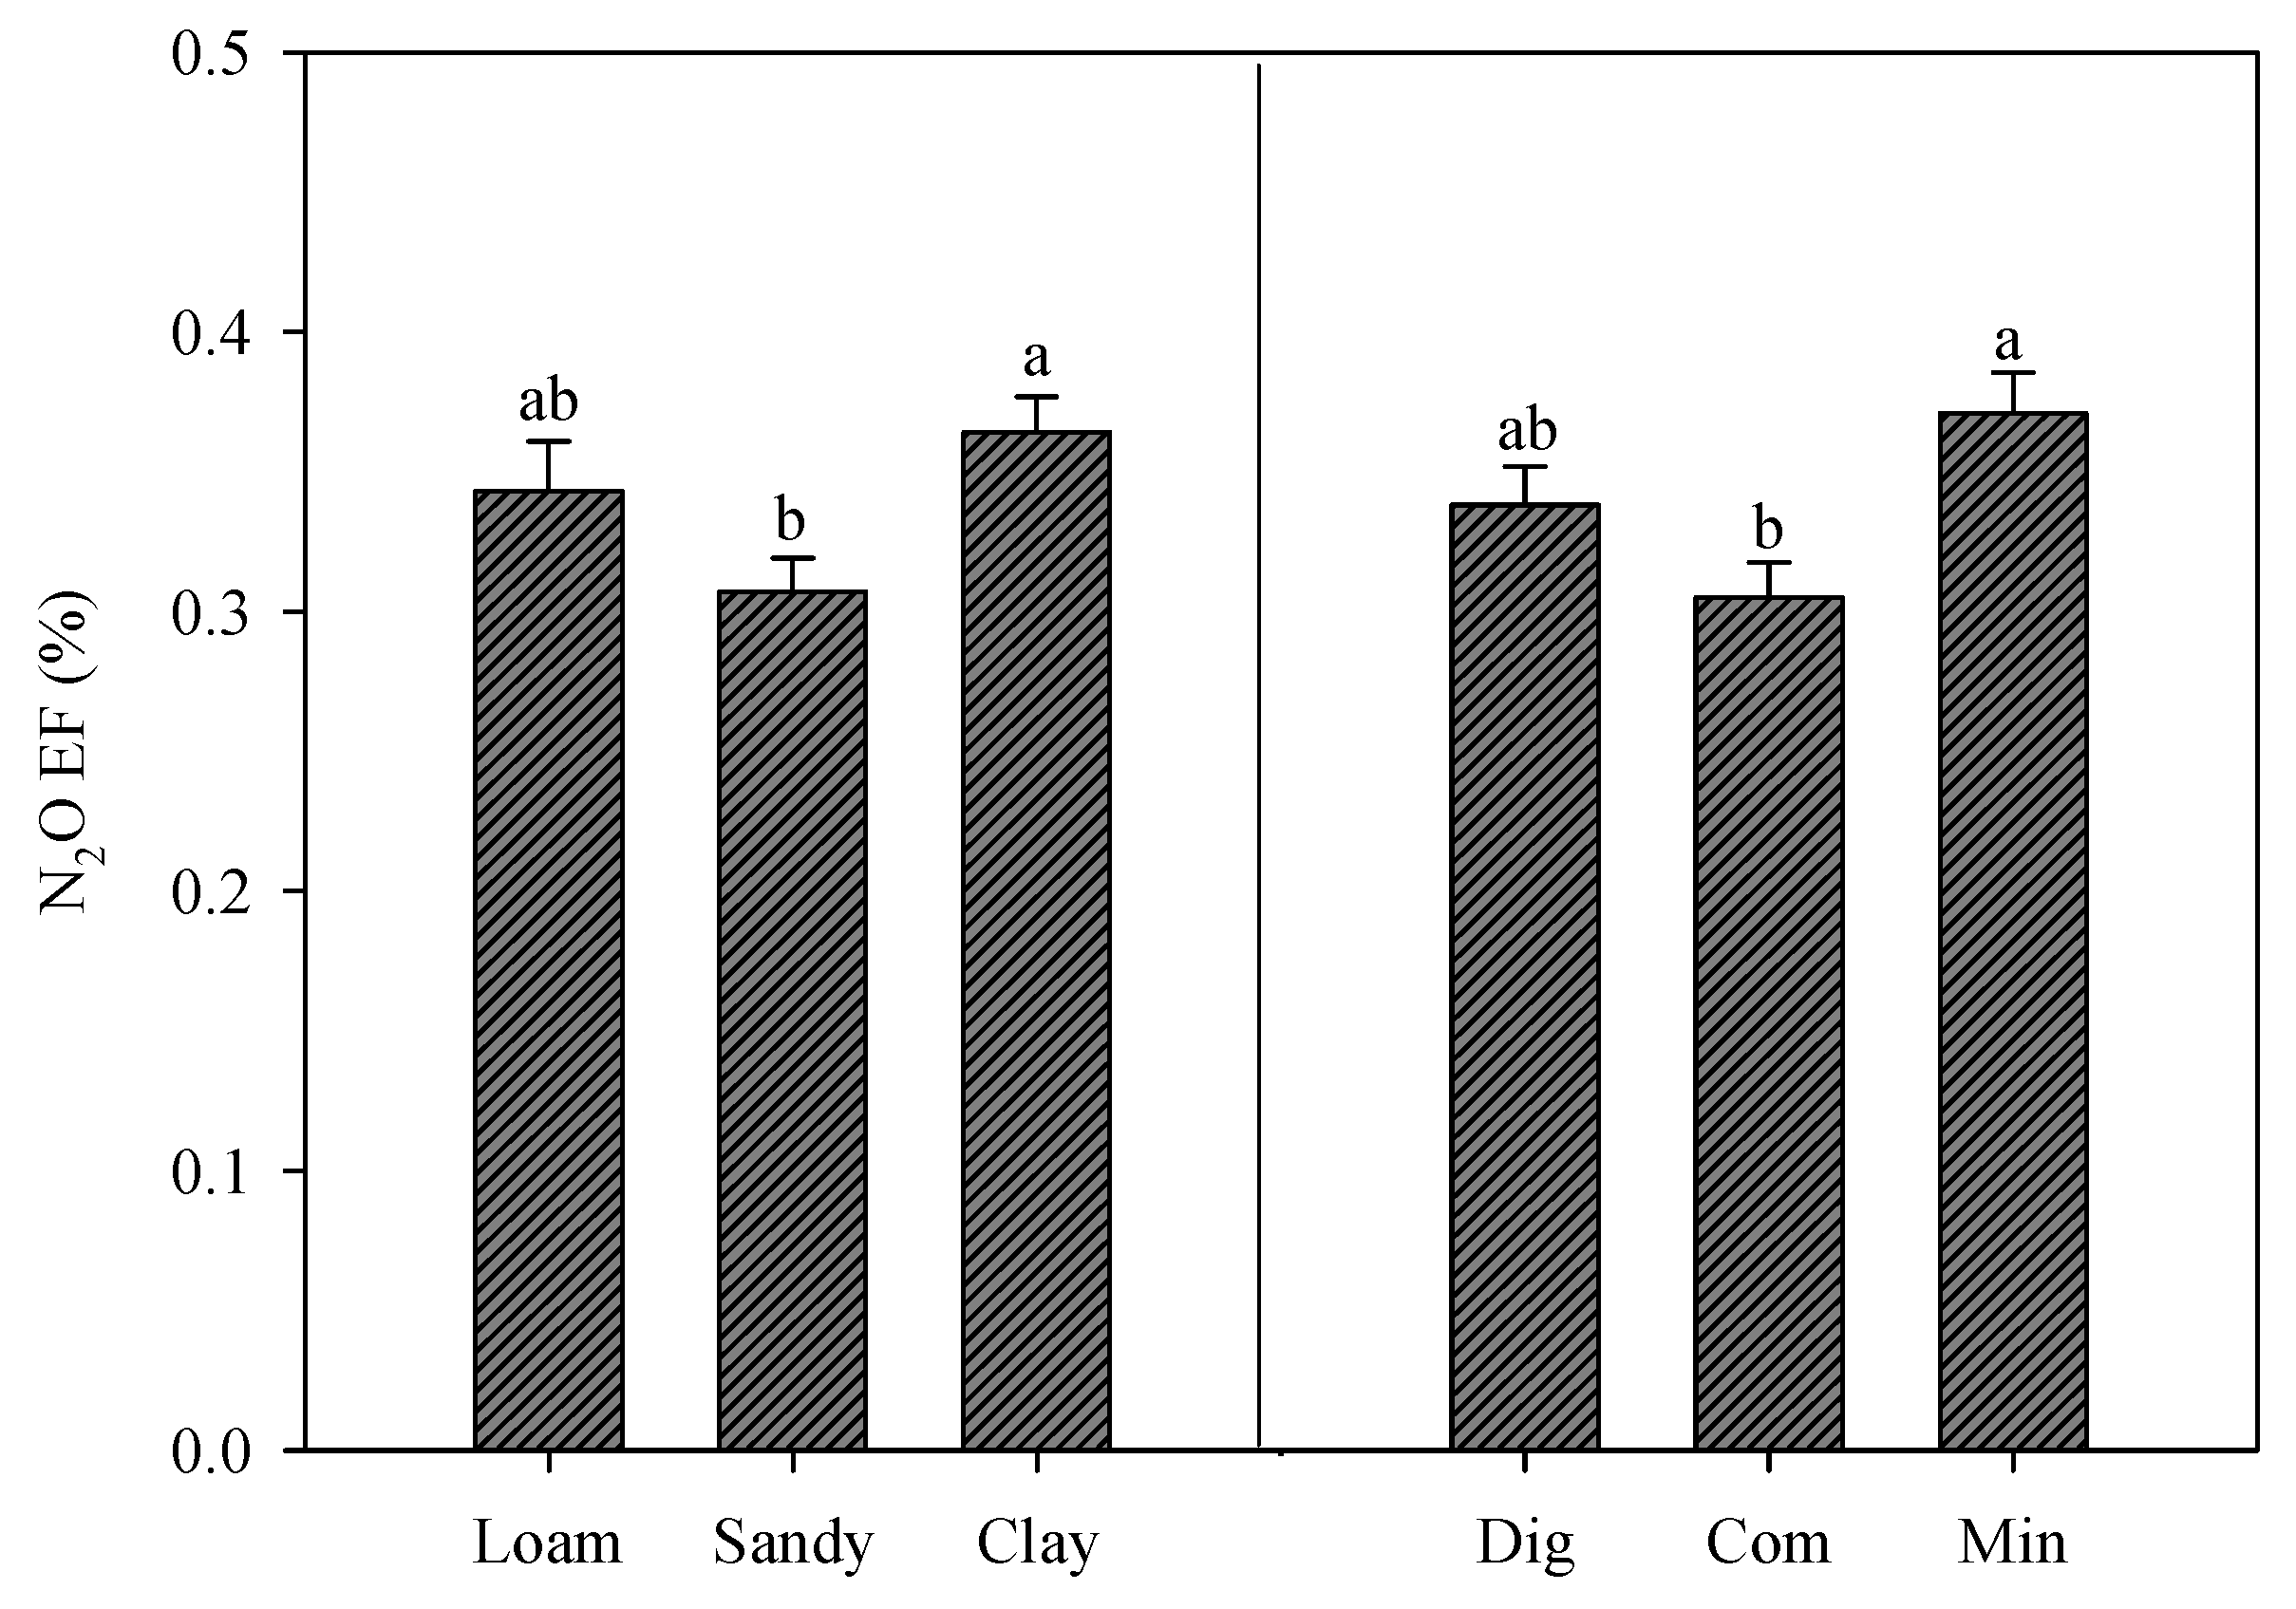
3.2. Cumulative Soil N2O Emissions, Yield-Scaled N2O Emissions, and Emission Factor

Cumulative N2O emissions were significantly affected by the main factors (Figure 3). Higher values were recorded in clay and loam soils (mean of 30.75 mg m−2) without statistical differences, but the loam soil was also not different from sandy soil (25.75 mg m−2) (Figure 3). As expected, the highest values of N2O emissions were found under Min fertilization, while the lowest one was in the not-fertilized control; the two organic strategies showed an intermediate value, and they were not statistically different (Figure 3).
Also, yield-scaled N2O emissions were significantly affected only by the main factors (Figure 4). In particular, significantly higher values were observed in clay soil (11.21 g N2O-N kg−1 grain), and the lower ones were found in sandy soil (6.41 g N2O-N kg−1 grain). Regarding the fertilization strategies, the Dig fertilization elicited higher values (mean of 11.01 g N2O-N kg−1 grain), which were statistically different from all other treatments but had no differences between them (7.85 g N2O-N kg−1 grain on average).
Also, the emission factor was significantly affected by the main factors (Figure 5). In clay and loam soils, it reached its highest values (mean of 0.35%), but the loam soil was not different from the sandy soil (0.31%). Instead, for fertilization treatments, fertilization with compost resulted in lower values (0.30%) but not statistically different from the digestate. As expected, the highest values were found in treatments with mineral fertilization (0.37%).

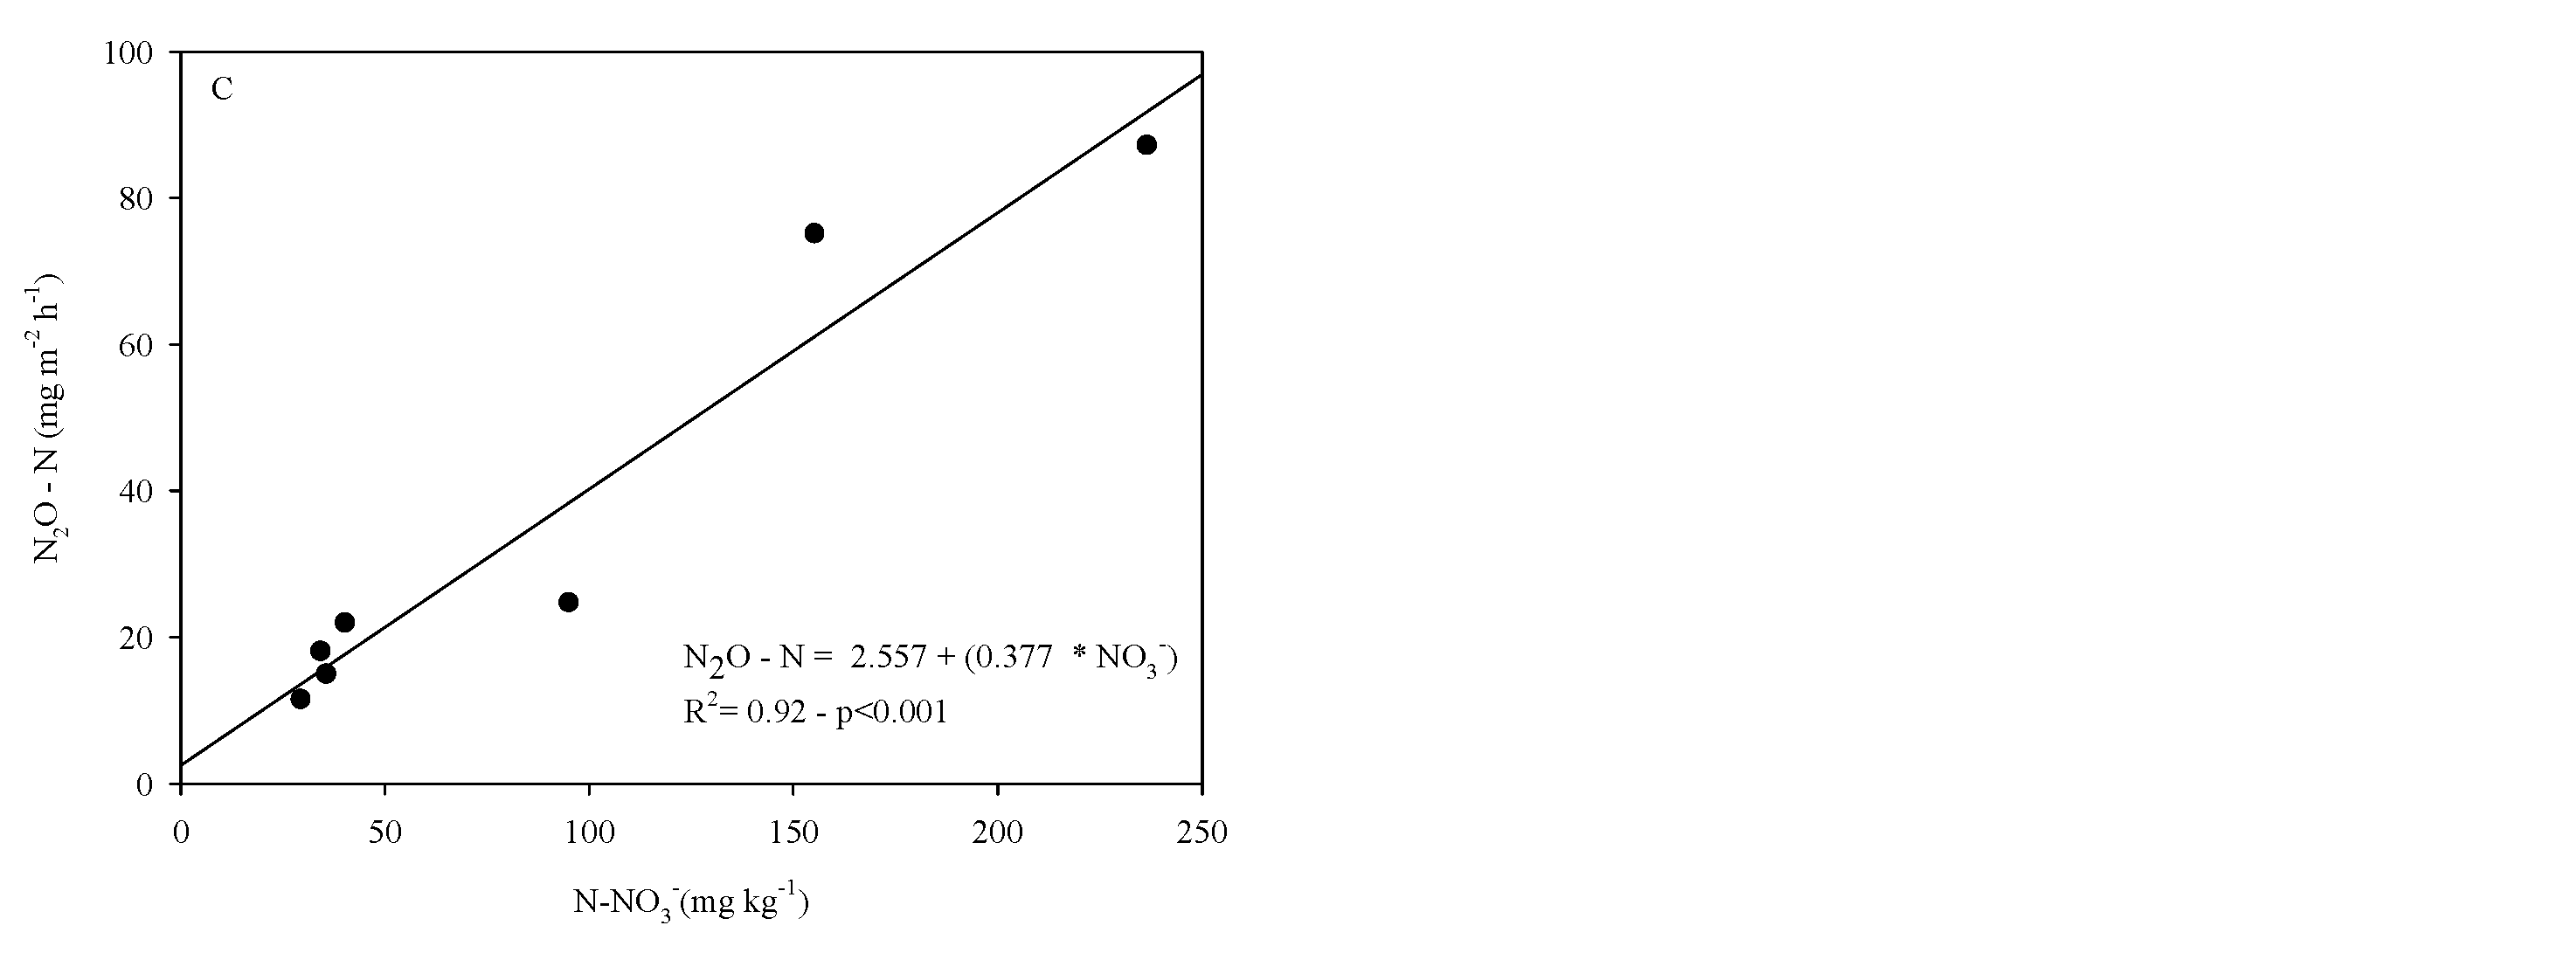
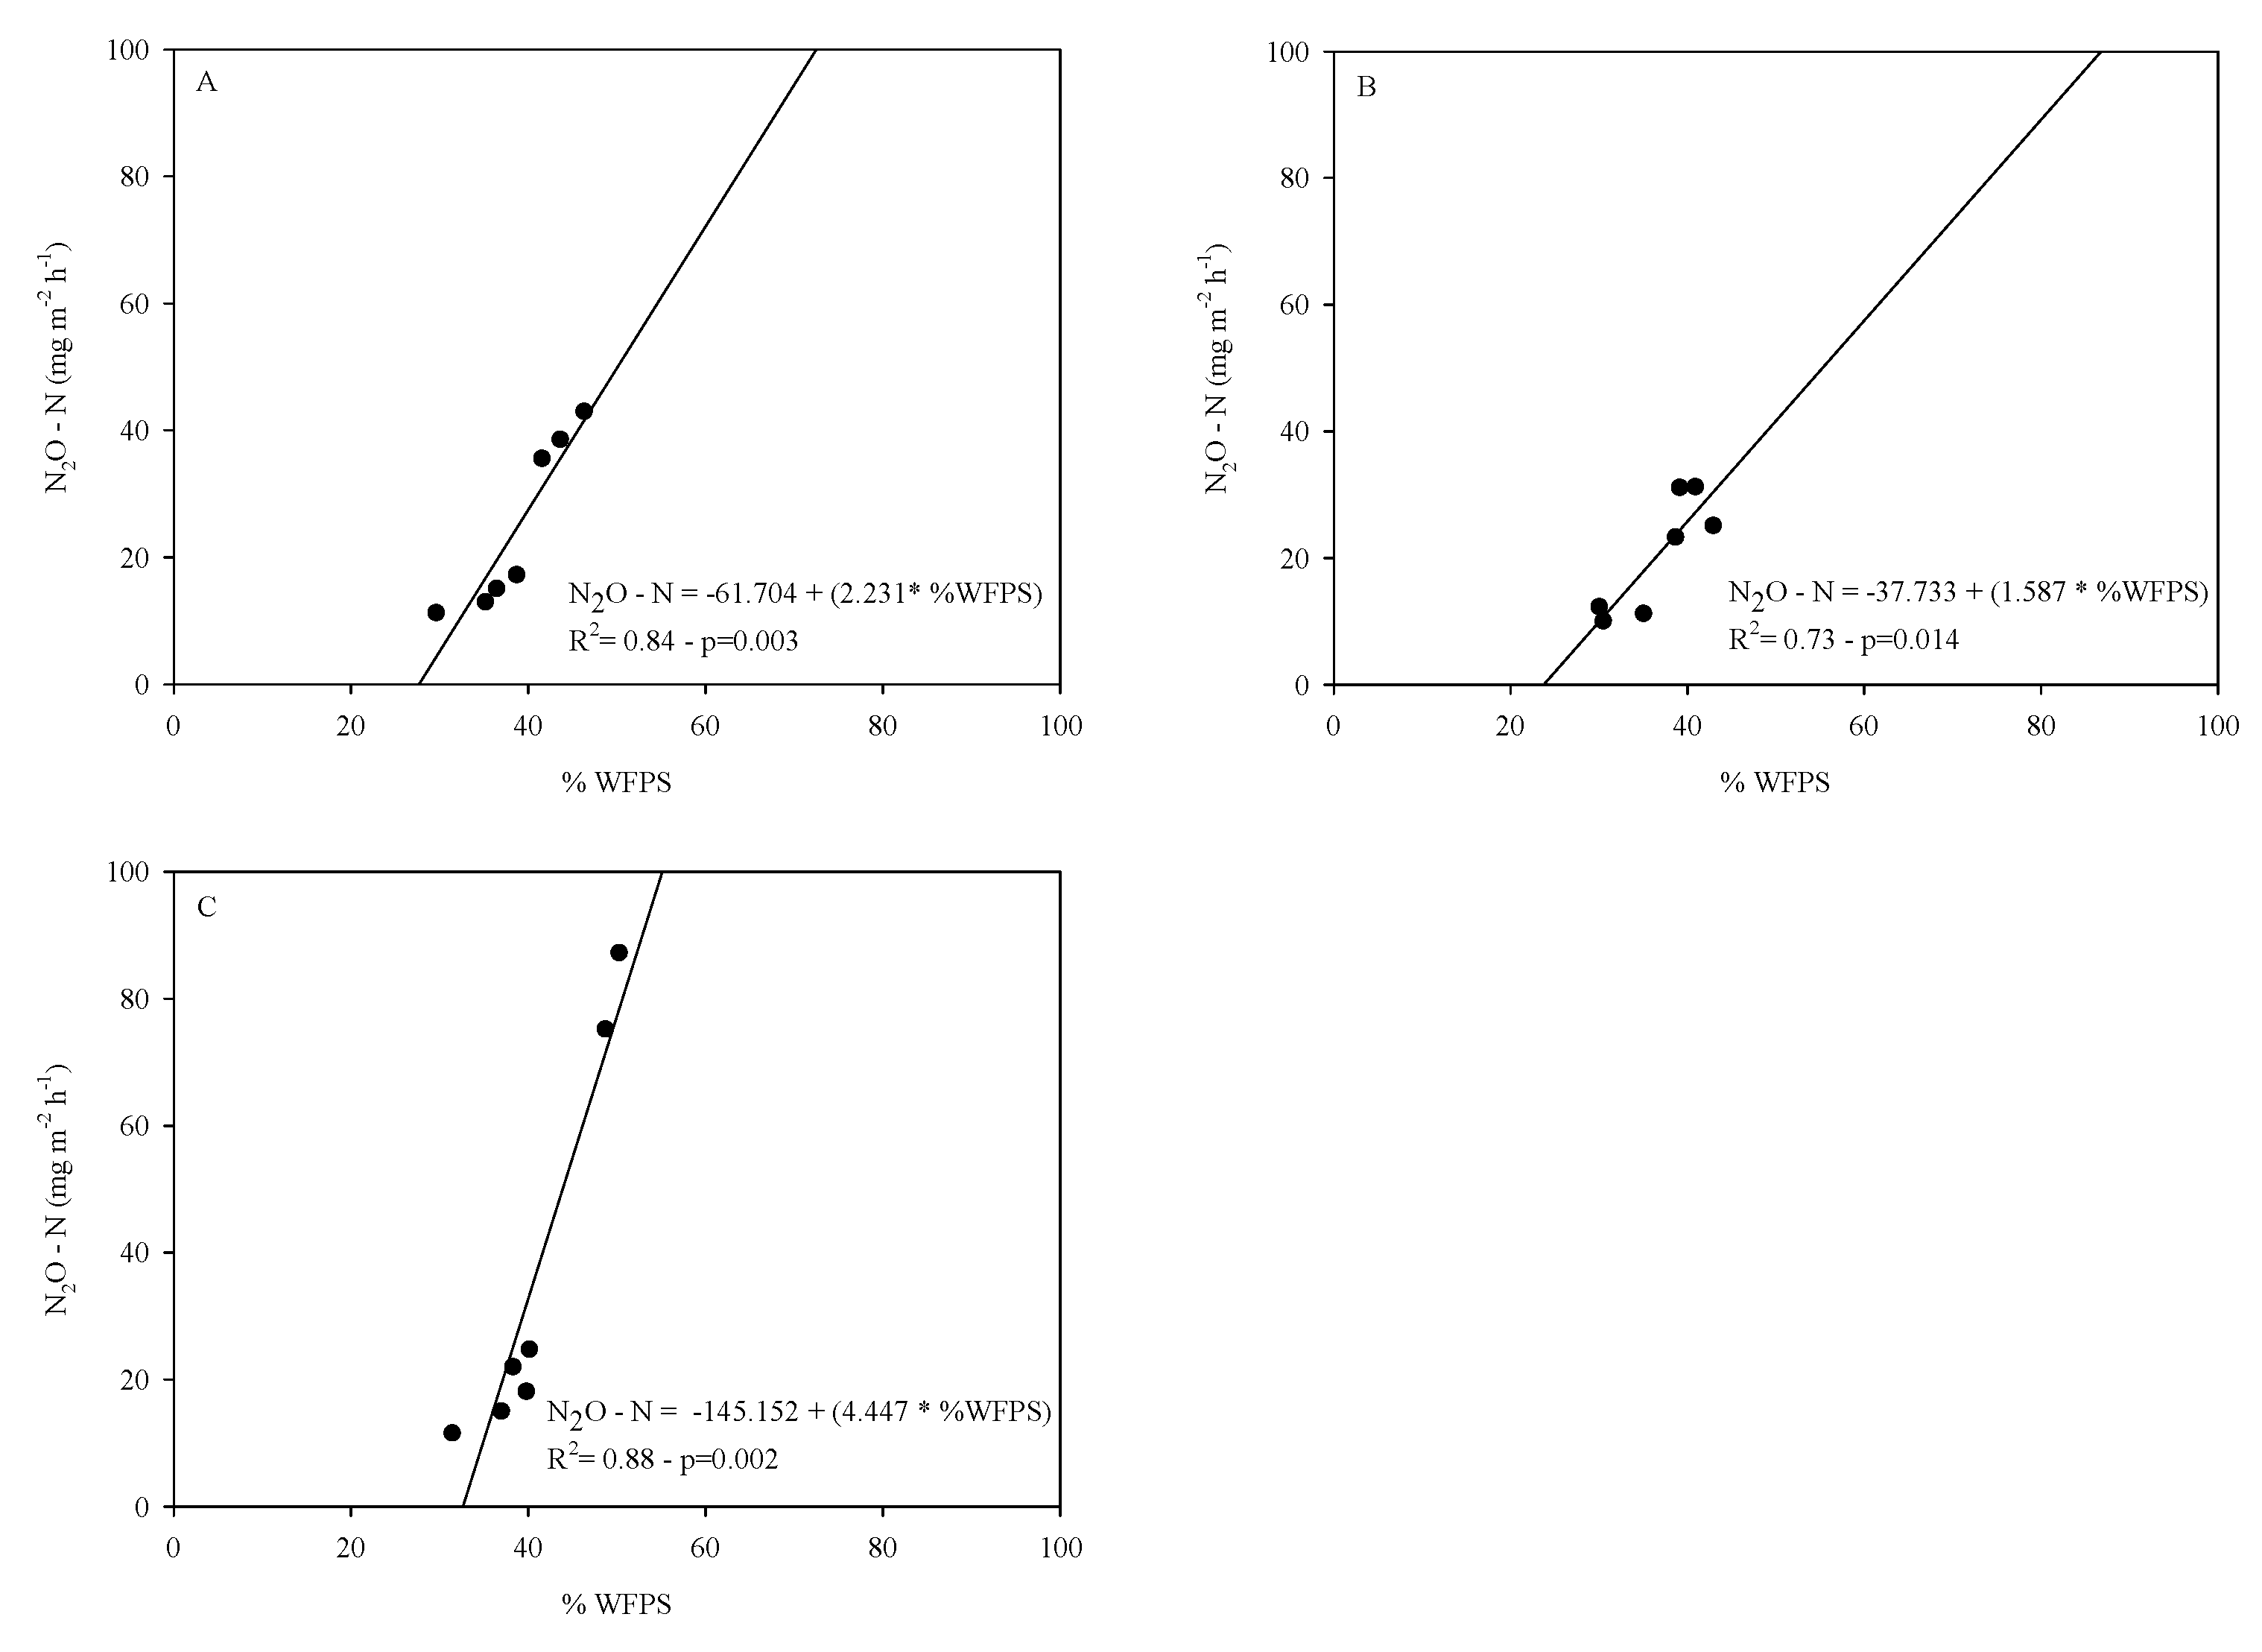
3.3. Regression Analysis

The datasets of the different soils and of the different fertilizations were modeled according to simple, exponential, and linear functions by comparing the response of N2O flux to soil nitrate concentration and WFPS.
In Figure 6A–C, the correlations between the fluxes recorded in different soils and nitrate concentration are reported. Positive correlations with nitrates were found in all soils, in particular, with values of r2 = 0.86, p = 0.002 and a slope of 0.553 in loamy soil (Figure 6A), r2 = 0.97, p < 0.001 and a slope of 0.43 in sandy soil (Figure 6B) and, finally, r2 = 0.92, p < 0.001 and a slope of 0.37 in clay soil (Figure 6C).
From the linear regression between N2O fluxes and WFPS percentage (Figure 7A–C), we observed a strong correlation across all three soil types. The slopes varied depending on the soil type. Loam soils exhibited an R2 = 0.84 with a significance level of p = 0.003; sandy soils showed an R2 = 0.73 with p = 0.014; finally, clay soils displayed an R2 = 0.88 with p = 0.002.

4. Discussion

To address the challenge of reducing soil N2O emissions, the objective of the current research was to evaluate the N2O emissions, yield, and some qualitative traits of durum wheat grain subjected to different nitrogen fertilization strategies and grown in three different soil types. The highest values of N2O emissions were found with mineral fertilization but also in loam and clay soils. Our findings align with several scientific studies reporting that increasing the clay content in soil elevates N2O emissions because of the increased likelihood of anaerobic conditions [45,46,47]. Tan et al. [48] also reported higher N2O emissions in clay soils compared to sandy-silty soils, emphasizing the influence of soil physicochemical properties on the variables driving greenhouse gas fluxes. Similarly, Ottaiano et al. [49] found that different soil textures influence nitrous oxide emissions in varying ways; specifically, cumulative N2O emissions from clay soils were slightly higher than those from sandy-silty soils, although the differences were not statistically significant. Regarding the effect of fertilization strategies, our results are in line with the findings of Vitale et al. [50]; in a study on tomatoes cultivated on sandy soil, the authors compared different types of fertilization (ammonium nitrate, mineral fertilizers combined with nitrification inhibitors, and organo-mineral fertilizers) and found that the organo-mineral fertilization reduced N2O emissions compared to mineral fertilization. Chantigny et al. [51], in Canada, observed that sandy loam seemed to limit nitrous emissions and manure application induced higher N2O emissions compared to mineral fertilizer. In addition, our data show a lower emission factor with organic fertilization, as well as in sandy soils. Our findings are in line with the results of Ball et al. [52] and Chantigny et al. [51] in research carried out in Scotland and Canada, respectively, on different types of organic fertilizers. In the sandy soil, they observed significantly decreased yield-scaled N2O emissions from the clay soil by 42.8%. Regarding fertilization, digestate treatment increased N2O emissions by 28.4% in terms of yield compared to all treatments. The lowest yield-scaled N2O emissions were observed in the COM treatment, indicating that organic fertilization not only increased yield but also reduced yield-scaled emissions. Similar findings were found by He et al. [53], who observed that the combined amendment of chicken manure and biochar significantly increased tea yield while reducing yield-scaled N2O emissions. Additionally, sandy soils increased durum wheat yield without significantly increasing N2O emissions. These data are similar to the N2O EF and production data we found in our test.
Wheat yield was highest on sandy soils fertilized with digestate, whereas on loam and clay soils, organic fertilization resulted in a lower yield compared to mineral fertilization. Our results are consistent with those of Di Mola et al. [54], who compared mineral (Min) and organic (Org) fertilization, as well as an unfertilized control, across three different sites and soil textures, in the inland hills of the Campania region. In particular, Min significantly increased wheat yield on clay soils, while no significant differences were observed between mineral and organic fertilization on sandy-clay loam soils. The highest protein content was recorded in plants grown on clay soil fertilized with mineral fertilization, whereas organic fertilization consistently reduced protein content than mineral fertilization. These findings also align with Tosti et al. [55] and Rossini et al. [56], which observed a lower grain protein content with organic fertilization.
In our study, we observed positive correlations between N2O emissions, nitrate concentration, and WFPS percentage across the different soil texture classes. During the crop cycle, WFPS values across all three soils ranged between 30% and 50% for the nitrification processes to occur [57]. In fact, a positive correlation was found between N2O fluxes and nitrate levels in all soils. We hypothesize that nitrification was the primary process contributing to nitrous oxide emissions. These findings are consistent with several studies [49,58,59]. In fact, it has been observed that as WFPS increases, the concentration of available O2 in the soil decreases [60,61], which enhances denitrification processes and leads to greater N2O production [62,63].
In our study, we observed linear correlations between N2O fluxes and WFPS percentage. Therefore, as the WFPS increases, there is a corresponding increase in N2O production. Del Grosso et al. [64] highlighted the critical role of WFPS in regulating N2O emissions, emphasizing that even small increases in WFPS can lead to significant rises in N2O fluxes. This is particularly relevant for clay soils, which have higher water-holding capacities. Similarly, Bateman and Baggs [13], in their study on the contributions of nitrification and denitrification to N2O emissions under different WFPS conditions, found that nitrification was the dominant process at lower WFPS levels, while denitrification became more significant at higher WFPS levels.
Therefore, it seems that in the clay soil, N2O production was most likely driven predominantly by the denitrification process, as the average WFPS percentage was consistently above 40%. Conversely, in the other two soils, the predominant process appeared to be nitrification, given that the WFPS percentage was approximately 30%. In other studies, it was demonstrated that low nitrous oxide (N2O) fluxes were observed in sandy soils under low WFPS conditions. In fact, the authors found that when the WFPS is low (30%) and the air space is high, nitrification is predominant, but N2O production is reduced because there are not sufficient anaerobic conditions for denitrification [13,50,51,52,53,54,55,56,57,58,59,60,61,62,63,64].

5. Conclusions

Based on our results for durum wheat, organic fertilization, especially digestate, in sandy and loamy soils seems to be a valid and sustainable alternative to mineral fertilization, thanks to higher grain yield and, interestingly, lower cumulative N2O emissions. The clay soil, overall, was less suitable for wheat cultivation under organic fertilization because the nitrogen produced by the mineralization of organic matter seemed to be mainly released in the atmosphere as N2O, reducing its availability for wheat growth and production. Therefore, the choice of nitrogen fertilization strategies depends significantly on soil properties, particularly soil texture. The appropriate combination of fertilization strategy and soil type can serve as an effective approach to reducing greenhouse gas emissions from arable soils while maintaining adequate crop productivity and minimizing the environmental impact of cropping systems. Obviously, further research is needed to confirm these results.

Author Contributions

Conceptualization, M.M., L.V., and E.C.; methodology, M.E.P.; software, L.O. and M.E.P.; validation, L.V. and G.M.; formal analysis, I.D.M. and E.C.; investigation, E.C.; resources, E.C.; data curation, M.E.P. and G.M.; writing—original draft preparation, L.O. and L.V.; writing—review and editing, L.O. and I.D.M.; visualization, I.D.M.; supervision, I.D.M. and G.M.; project administration, M.M. and L.V.; funding acquisition, M.M. All authors have read and agreed to the published version of the manuscript.

Funding

This research received no external funding.

Data Availability Statement

The original contributions presented in this study are included in the article. Further inquiries can be directed to the corresponding authors.

Acknowledgments

We would like to thank Bruno Di Matteo for her support in field work.

Conflicts of Interest

The authors declare no conflict of interest.

References

  1. Raza, A.; Razzaq, A.; Mehmood, S.S.; Zou, X.L.; Zhang, X.; Lv, Y.; Xu, J. Impact of Climate Change on Crops Adaptation and Strategies to Tackle Its Outcome: A Review. Plants 2019, 8, 34. [Google Scholar] [CrossRef] [PubMed]
  2. Prather, M.J.; Hsu, J.; DeLuca, N.M.; Jackman, C.H.; Oman, L.D.; Douglass, A.R.; Fleming, E.L.; Strahan, S.E.; Steenrod, S.D.; Søvde, O.A.; et al. Measuring and modeling the lifetime of nitrous oxide including its variability. J. Geophys. Res. Atmos. 2015, 120, 5693–5705. [Google Scholar] [CrossRef] [PubMed]
  3. Butterbach-Bahl, K.; Baggs, E.M.; Dannenmann, M.; Kiese, R.; Zechmeister-Boltenstern, S. Nitrous oxide emissions from soils: How well do we understand the processes and their controls Philosophical, Transactions of the Royal, Society. Biol. Sci. 2013, 368, 20130122. [Google Scholar] [CrossRef] [PubMed]
  4. Ciais, P.; Sabine, C.; Bala, G.; Bopp, L.; Brovkin, V.; Canadell, J.; Chhabra, A.; DeFries, R.; Galloway, J.; Heimann, M.; et al. Carbon and Other Biogeochemical Cycles. In Climate Change 2013: The Physical Science Basis. Contribution of Working Group I to the Fifth Assessment Report of the Intergovernmental Panel on Climate Change; Cambridge University Press: Cambridge, UK, 2013; pp. 465–570. [Google Scholar]
  5. Tian, H.; Lu, C.; Ciais, P.; Michalak, A.M.; Canadell, J.G.; Saikawa, E.; Huntzinger, D.N.; Gurney, K.R.; Sitch, S.; Zhang, B.; et al. The terrestrial biosphere as a net source of greenhouse gases to the atmosphere. Nature 2016, 531, 225. [Google Scholar] [CrossRef]
  6. Tiseo, I. Annual Nitrous Oxide Emissions Worldwide 1990–2021. Available online: https://www.statista.com/statistics/1379448/annual-global-nitrous-oxide-emissions/ (accessed on 20 October 2024).
  7. European Environment Agency. Annual European Union Greenhouse Gas Inventory 1990–2013 and Inventory Report 2015. Available online: https://www.eea.europa.eu/en/analysis/publications/european-union-greenhouse-gas-inventory-2015 (accessed on 20 October 2024).
  8. Han, J.-G.; Zhu, Y.-L.; Bai, H.-Y.; Qu, D.; Chu, J.Y.; Wu, C.D. N2O emission under different moisture and temperature regimes. Bull. Environ. Contam. Toxicol. 2007, 78, 284–287. [Google Scholar]
  9. Smith, P.; Martino, D.; Cai, Z.; Gwary, D.; Janzen, H.; Kumar, P. Agriculture. In Climate Change 2007: Mitigation Contribution of Working Group III to the 4th Assessment Report of the Intergovernmental Panel on Climate Change; Metz, B., Davidson, O.R., Bosch, P.R., Dave, R., Mayer, L.A., Eds.; Cambridge University: Cambridge, UK, 2007; pp. 497–540. [Google Scholar]
  10. Ravishankara, A.R.; Daniel, J.S.; Portmann, R.W. Nitrous oxide (N2O): The dominant ozone-depleting substance emitted in the 21st century. Science 2009, 326, 123–125. [Google Scholar] [CrossRef]
  11. Shakoor, A.; Xu, Y.; Wang, Q.; Chen, N.; He, F.; Zuo, H.; Yin, H.; Yan, X.; Ma, Y.; Yang, S. Effects of fertilizer application schemes and soil environmental factors on nitrous oxide emission fluxes in a rice-wheat cropping system, east China. PLoS ONE 2018, 13, e0202016. [Google Scholar] [CrossRef]
  12. Lv, F.; Song, J.; Giltrap, D.; Feng, Y.; Yang, X.; Zhang, S. Crop yield and N2O emission affected by long-term organic manure substitution fertilizer under winter wheat-summer maize cropping system. Sci. Total Environ. 2020, 732, 139321. [Google Scholar] [CrossRef]
  13. Bateman, E.J.; Baggs, E.M. Contributions of nitrification and denitrification to N2O emissions from soils at different water-filled pore space. Biol. Fertil. Soils 2005, 41, 379–388. [Google Scholar] [CrossRef]
  14. Li, Y.; Chen, J.; Drury, C.F.; Liebig, M.; Johnson, J.M.F.; Wang, Z.; Feng, H.; Abalos, D. The role of conservation agriculture practices in mitigating N2O emissions: A meta-analysis. Agron. Sustain. Dev. 2023, 43, 63. [Google Scholar] [CrossRef]
  15. Zhu, G.; Ma, X.; Gao, Z.; Ma, W.; Li, J.; Cai, Z. Characterizing CH4 and N2O emissions from an intensive dairy operation in summer and fall in China. Atmos. Environ. 2014, 83, 245–253. [Google Scholar] [CrossRef]
  16. Maillard, É.; Angers, D.A. Animal manure application and soil organic carbon stocks: A meta-analysis. Glob. Change Biol. 2014, 20, 666–679. [Google Scholar] [CrossRef] [PubMed]
  17. Rasool, R.; Kukal, S.S.; Hira, G.S. Soil physical fertility and crop performance as affected by long term application of FYM and inorganic fertilizers in rice–wheat system. Soil Tillage Res. 2007, 96, 64–72. [Google Scholar] [CrossRef]
  18. Yang, J.; Gao, W.; Ren, S. Long-term effects of combined application of chemical nitrogen with organic materials on crop yields, soil organic carbon and total nitrogen in fluvo-aquic soil. Soil Tillage Res. 2015, 151, 67–74. [Google Scholar] [CrossRef]
  19. Diacono, M.; Montemurro, F. Long-term effects of organic amendments on soil fertility. Sustain. Agric. 2011, 2, 761–786. [Google Scholar]
  20. Zhang, S.L.; Gao, P.C.; Tong, Y.A.; Norse, D.; Lu, Y.L.; Powlson, D. Overcoming nitrogen fertilizer over-use through technical and advisory approaches: A case study from Shaanxi Province, northwest China. Agric. Ecosyst. Environ. 2015, 209, 89–99. [Google Scholar] [CrossRef]
  21. Li, J.; Wen, Y.; Li, X.; Li, Y.; Yang, X.; Lin, Z.; Song, Z.; Cooper, J.M.; Zhao, B. Soil Labile Organic Carbon Fractions and Soil Organic Carbon Stocks as Affected by Long-Term Organic and Mineral Fertilization Regimes in the North China Plain. Soil Tillage Res. 2018, 175, 281–290. [Google Scholar] [CrossRef]
  22. Baggs, E.M.; Chebii, J.; Ndufa, J.K. A short-term investigation of trace gas emissions following tillage and no-tillage of agroforestry residues in western Kenya. Soil Tillage Res. 2006, 90, 69–76. [Google Scholar] [CrossRef]
  23. Chen, H.X.; Liu, J.J.; Zhang, A.F.; Chen, J.; Cheng, G.; Sun, B.H.; Pi, X.M.; Dyck, M.; Si, B.C.; Zhao, Y.; et al. Effects of straw and plastic film mulching on greenhouse gas emissions in Loess Plateau, China: A field study of 2 consecutive wheat-maize rotation cycles. Sci. Total Environ. 2017, 579, 814–824. [Google Scholar] [CrossRef]
  24. Xu, W.; Zhao, D.; Ma, Y.; Yang, G.; Ambus, P.L.; Liu, X.; Luo, J. Effects of long-term organic fertilizer substitutions on soil nitrous oxide emissions and nitrogen cycling gene abundance in a greenhouse vegetable field. Appl. Soil Ecol. 2023, 188, 104877. [Google Scholar] [CrossRef]
  25. Wei, X.R.; Hao, M.D.; Xue, X.H.; Shi, P.; Horton, R.; Wang, A.; Zang, Y.F. Nitrous oxide emission from highland winter wheat field after long-term fertilization. Biogeosciences 2010, 7, 3301–3310. [Google Scholar] [CrossRef]
  26. Huang, Y.; Zou, J.W.; Zheng, X.H.; Wang, Y.S.; Xu, X.K. Nitrous oxide emissions as influenced by amendment of plant residues with different C:N ratios. Soil Biol. Biochem. 2004, 36, 973–981. [Google Scholar] [CrossRef]
  27. Frimpong, K.A.; Baggs, E.M. Do combined applications of crop residues and inorganic fertilizer lower emission of N2O from soil? Soil Use Manag. 2010, 26, 412–424. [Google Scholar] [CrossRef]
  28. JinJin, Y.; Chen, H.; Tang, X.; Zhang, L.; Yan, J.; Li, S.; Chen, Y.; Li, X.; Wu, H.; Xiao, X. Combination of nitrogen and organic fertilizers reduce N2O emissions while increasing winter wheat grain yields and quality in China. Front. Environ. Sci. 2024, 12, 1485043. [Google Scholar]
  29. Cui, P.Y.; Fan, F.L.; Yin, C.; Song, A.L.; Huang, P.R.; Tang, Y.J.; Zhu, P.; Peng, C.; Li, T.Q.; Wakelin, S.A.; et al. Long-term organic and inorganic fertilization alters temperature sensitivity of potential N2O emissions and associated microbes. Soil Biol. Biochem. 2016, 93, 131–141. [Google Scholar] [CrossRef]
  30. Van Groenigen, J.W.; Velthof, G.L.; Oenema, O.; Van Groenigen, K.J.; Van Kessel, C. Towards an agronomic assessment of N2O emissions: A case study for arable crops. Eur. J. Soil Sci. 2010, 61, 903–913. [Google Scholar] [CrossRef]
  31. Mosier, A.R.; Halvorson, A.D.; Reule, C.A.; Liu, X.J. Net global warming potential and greenhouse gas intensity in irrigated cropping systems in northeastern Colorado. J. Environ. Qual. 2006, 35, 1584. [Google Scholar] [CrossRef]
  32. Venterea, R.T.; Bijesh, M.; Dolan, M.S. Fertilizer source and tillage effects on yield-scaled nitrous oxide emissions in a corn cropping system. J. Environ. Qual. 2011, 40, 1521–1531. [Google Scholar] [CrossRef]
  33. Van Kessel, C.; Venterea, R.T.; Six, J.; Adviento-Borbe, M.A.A.; Linquist, B.; Van Groenigen, K.J. Climate, duration, and N placement determine N2O emissions in reduced tillage systems: A meta-analysis. Glob. Change Biol. 2013, 19, 33–44. [Google Scholar] [CrossRef]
  34. Sainju, U.M. A global meta-analysis on the impact of management practices on net global warming potential and greenhouse gas intensity from cropland soils. PLoS ONE 2016, 11, e0148527. [Google Scholar] [CrossRef]
  35. Kim, D.G.; Giltrap, D. Determining optimum nitrogen input rate and optimum yield-scaled nitrous oxide emissions: Theory, field observations, usage, and limitations. Agric. Ecosys. Environ. 2017, 247, 371–378. [Google Scholar] [CrossRef]
  36. Chen, H.; Liao, Q.; Liao, Y. Response of area- and yield-scaled N2O emissions from croplands to deep fertilization: A meta-analysis of soil, climate, and management factors. J. Sci. Food Agric. 2021, 101, 4653–4661. [Google Scholar] [CrossRef] [PubMed]
  37. De Vita, P.; Taranto, F. Durum wheat (Triticum turgidum ssp. durum) breeding to meet the challenge of climate change. Adv. Plant Breed. Strateg. Cereals 2019, 5, 471–524. [Google Scholar]
  38. International Grains Council. 2023. Available online: https://www.igc.int/en/default.aspx (accessed on 20 October 2024).
  39. Nachit, M.M.; Elouafi, I. Durum adaptation in the Mediterranean dryland: Breeding, stress physiology, and molecular marker. Chall. Strateg. Dryland Agric. 2004, 32, 203–218. [Google Scholar]
  40. Aprile, A.; Havlickova, L.; Panna, R.; Mare, C.; Borrelli, G.M.; Marone, D.; Perrotta, C.; Rampino, P.; De Bellis, L.; Curn, V. Different stress responsive strategies to drought and heat in two durum wheat cultivars with contrasting water use efficiency. BMC Genom. 2013, 14, 821. [Google Scholar] [CrossRef]
  41. Iurlaro, A.; De Caroli, M.; Sabella, E.; De Pascali, M.; Rampino, P.; De Bellis, L.; Perrotta, C.; Dalessandro, G.; Piro, G.; Fry, S.C. Drought and Heat Defferentially Affect XTH Expression and XET Activity and Action in 3-Day-Old Seedlings of Durum Wheat Cultivars with Different Stress Susceptibility. Plant Sci. 2016, 7, 1686. [Google Scholar]
  42. Ranucci, S.; Bertolini, T.; Vitale, L.; Di Tommasi, P.; Ottaiano, L.; Oliva, M.; Magliulo, V. The influence of management and environmental variables on soil N2O emissions in a crop system in Southern Italy. Plant Soil 2001, 343, 83–96. [Google Scholar] [CrossRef]
  43. Rowell, D.L. Soil Science: Methods and Applications; Longman Ltd.: Harlow, UK, 1994; p. 61. [Google Scholar]
  44. Faber, A.; Jarosz, Z.; Jędrejek, A.; Rutkowska, A. Yield-scaled nitrous oxide emission from soils depending on nitrogen use efficiency characteristics. Pol. J. Environ. Stud. 2019, 28, 3155–3162. [Google Scholar] [CrossRef]
  45. Granli, T.; Bøckman, O.C. Nitrous oxide from agriculture. Norw. J. Agric. Sci. 1994, 12, 1–128. [Google Scholar]
  46. Sahrawat, K.L.; and Keeney, D.R. Nitrous oxide emission from soils. Adv. Soil Sci. 1986, 4, 103–148. [Google Scholar]
  47. Velthof, G.L.; Oenema, O. Nitrous oxide fluxes from grassland in the Netherlands: II. Effects of soil type, nitrogen fertilizer application and grazing. Eur. J. Soil Sci. 1995, 46, 541–549. [Google Scholar] [CrossRef]
  48. Tan, I.Y.S.; van Es, H.M.; Duxbury, J.M.; Melkonian, J.J.; Schindelbeck, R.R.; Geohring, L.D.; Hively, W.D.; Moebius, B.N. Single-event nitrous oxide losses under maizeproduction as affected by soil type, tillage, rotation, and fertilization. Soil Tillage Res. 2009, 102, 19–26. [Google Scholar] [CrossRef]
  49. Ottaiano, L.; Di Mola, I.; Di Tommasi, P.; Mori, M.; Magliulo, V.; Vitale, L. Effects of irrigation on N2O emissions in a maize crop grown on different soil types in two contrasting seasons. Agriculture 2020, 10, 623. [Google Scholar] [CrossRef]
  50. Vitale, L.; Polimeno, F.; Ottaiano, L.; Maglione, G.; Tedeschi, A.; Mori, M.; De Marco, A.; Di Tommasi, P.; Magliulo, V. Fertilizer type influences tomato yield and soil N2O emissions. Plant Soil Environ. 2017, 63, 105–110. [Google Scholar] [CrossRef]
  51. Chantigny, M.H.; Rochette, P.; Angers, D.A.; Bittman, S.; Buckley, K.; Massé, D.; Bélanger, G.; Eriksen-Hamel, N.; Gasser, M.O. Soil nitrous oxide emissions following band-incorporation of fertilizer nitrogen and swine manure. J. Environ. Qual. 2010, 39, 1545–1553. [Google Scholar] [CrossRef]
  52. Ball, B.C.; McTaggart, I.P.; Scott, A. Mitigation of greenhouse gas emissions from soil under silage production by use of organic manures or slow-release fertilizer. Soil Use Manag. 2004, 20, 287–295. [Google Scholar]
  53. He, T.; Yuan, J.; Luo, J.; Wang, W.; Fan, J.; Liu, D.; Ding, W. Organic fertilizers have divergent effects on soil N2O emissions. Biol. Fertil. Soils 2019, 55, 685–699. [Google Scholar] [CrossRef]
  54. Di Mola, I.; Ottaiano, L.; Sacco, A.; Senatore, M.; Mori, M. Organic versus mineral fertilization: Assessing of yield and quality of durum wheat in marginal lands. Ital. J. Agron. 2021, 16, 1855. [Google Scholar] [CrossRef]
  55. Tosti, G.; Farneselli, M.; Benincasa, P.; Guiducci, M. Nitrogen fertilization strategies for organic wheat production: Crop yield and nitrate leaching. Agron. J. 2016, 108, 770–781. [Google Scholar] [CrossRef]
  56. Rossini, F.; Provenzano, M.E.; Sestili, F.; Ruggeri, R. Synergistic effect of sulphur and nitrogen in the organic and mineral fertilization of durum wheat: Grain yield and quality traits in the Mediterranean environment. Agronomy 2018, 8, 189. [Google Scholar] [CrossRef]
  57. Davidson, E.A. Fluxes of nitrous oxide and nitric oxide from terrestrial ecosystems. In Microbial Production and Consumption of Greenhouse Gases: Methane, Nitrogen Oxides and Halomethanes; Rogers, J.E., Whitman, W.B., Eds.; American Society for Microbiology: Washington, DC, USA, 1991; pp. 219–235. [Google Scholar]
  58. Dobbie, K.E.; McTaggart, I.P.; Smith, K.A. Nitrous oxide emissions from intensive agricultural systems: Variations between crops and seasons, key driving variables, and mean emission factors. J. Geophys. Res. Atmos. 1999, 104, 26891–26899. [Google Scholar] [CrossRef]
  59. Ruser, R.; Flessa, H.; Russow, R.; Schmidt, G.; Buegger, F.; Munch, J.C. Emission of N2O, N2 and CO2 from soil fertilized with nitrate: Effect of compaction, soil moisture and rewetting. Soil Biol. Biochem. 2006, 38, 263–274. [Google Scholar] [CrossRef]
  60. Du, Y.; Guo, S.; Wang, R.; Song, X.; Ju, X. Soil pore structure mediates the effects of soil oxygen on the dynamics of greenhouse gases during wetting-drying phases. Sci. Total Environ. 2023, 895, 165192. [Google Scholar] [CrossRef]
  61. Song, X.T.; Wei, H.N.; Rees, R.M.; Ju, X.T. Soil oxygen depletion and corresponding nitrous oxide production at hot moments in an agricultural soil. Environ. Pollut. 2022, 292, 118345. [Google Scholar] [CrossRef]
  62. Di, H.J.; Cameron, K.C.; Podolyan, A.; Robinson, A. Effect of soil moisture status and a nitrification inhibitor, dicyandiamide, on ammonia oxidizer and denitrifier growth and nitrous oxide emissions in a grassland soil. Soil Biol. Biochem. 2014, 73, 59–68. [Google Scholar] [CrossRef]
  63. Zhu, X.; Burger, M.; Doane, T.A.; Horwath, W.R. Ammonia oxidation pathways and nitrifier denitrification are significant sources of N2O and NO under low oxygen availability. Proc. Natl. Acad. Sci. USA 2013, 110, 6328–6333. [Google Scholar] [CrossRef]
  64. Del Grosso, S.J.; Parton, W.J.; Mosier, A.R.; Ojima, D.S.; Kulmala, A.E.; Phongpan, S. General model for N2O and N2 gas emissions from soils due to dentrification. Glob. Biogeochem. Cycles 2000, 14, 1045–1060. [Google Scholar] [CrossRef]
Figure 1. Maximum and minimum air temperature trends and rainfall during the growing season of durum wheat. I, II, and III represent 10-day intervals in each month.
Agronomy 15 00702 g001
Figure 2. Yield of wheat as affected by texture classes and nitrogen fertilization strategies. Vertical bars indicate standard error; different letters indicate significant differences according to Tukey test (p < 0.05).
Agronomy 15 00702 g002
Figure 3. Main effects of cumulative N2O emissions in texture classes (loam, sandy, and clay) and nitrogen fertilization strategies (Cont, Dig, Com, Min). Vertical bars indicate standard error; different letters indicate significant differences according to Tukey test (p < 0.05).
Agronomy 15 00702 g003
Figure 4. Yield-scaled N2O emissions in texture classes (loam, sandy, and clay) and nitrogen fertilization strategies (Cont, Dig, Com, Min). Vertical bars indicate standard error; different letters indicate significant differences according to Tukey test (p < 0.05).
Agronomy 15 00702 g004
Figure 5. Emission factor (EF) in texture classes (loam, sandy, and clay) and nitrogen fertilization strategies (Cont, Dig, Com, Min). Vertical bars indicate standard error; different letters indicate significant differences according to Tukey test (p < 0.05).
Agronomy 15 00702 g005
Figure 6. Linear regression for the relationship between N2O fluxes and nitrate concentration in the loam (A) sandy (B) and clay (C) soil.
Agronomy 15 00702 g006aAgronomy 15 00702 g006b
Figure 7. Linear regression for the relationship between N2O fluxes and percentage WFPS in the loam (A) sandy (B) and clay (C) soil.
Agronomy 15 00702 g007
Table 1. Physical and chemical soil properties. OM—organic matter.
Texture Classes (USDA)Sand
%
Silt
%
Clay
%
pHOM
%
N-Kjeldhal
%
N-NO3
mg kg−1
N-NH4
mg kg−1
P
mg kg−1
K
mg kg−1
Clay36.024.539.57.71.60.0817.48.2112.8602.0
Sand70.523.06.57.81.00.0762.313.4106.11324.9
Loam49.525.025.57.61.70.1114.811.8360.5966.4
USDA—United States Department of Agriculture; data are means (n = 3).
Table 2. Harvest index (HI), height, vitreousness, shrinking, and protein content of wheat as affected by the interaction between texture classes and fertilization strategies.
TreatmentsHIHeightVitreousnessShrinkingProtein
%cm%%%
Soil TypeFertilization
LoamCont30.7 ± 0.6066.5 ± 3.0010.0 ± 2.891.3 ± 0.67 bc14.7 ± 0.28 c
Dig33.7 ± 2.9262.1 ± 1.1016.7 ± 8.291.3 ± 0.67 bc12.5 ± 0.32 e
Com33.7 ± 2.5269.2 ± 2.208.3 ± 2.401.0 ± 0.58 bd15.0 ± 0.39 bc
Min30.5 ± 1.0465.7 ± 0.9518.3 ± 4.410.7 ± 0.67 cd15.5 ± 0.63 b
SandyCont38.7 ± 2.1365.7 ± 1.8424.0 ± 2.080.0 ± 0.00 d9.1 ± 0.39 h
Dig38.7 ± 0.6761.1 ± 2.4836.7 ± 1.760.0 ± 0.00 d11.1 ± 0.50 f
Com37.8 ± 0.7370.2 ± 2.1732.3 ± 1.200.0 ± 0.00 d10.7 ± 0.91 fg
Min38.8 ± 0.1767.0 ± 1.0939.3 ± 2.850.0 ± 0.00 d13.8 ± 0.13 d
ClayCont22.8 ± 0.3365.7 ± 3.182.3 ± 1.204.0 ± 0.58 a11.2 ± 0.30 f
Dig29.7 ± 2.4063.4 ± 3.4119.3 ± 4.911.7 ± 0.88 b10.1 ± 0.65 g
Com34.2 ± 1.0162.1 ± 0.3427.7 ± 9.130.3 ± 0.33 d12.5 ± 0.53 e
Min36.7 ± 4.1765.4 ± 4.2325.7 ± 2.850.3 ± 0.33 d16.8 ± 0.26 a
Significance
Soil Type (ST)**NS******
Fertilization (F)**NS******
ST × FNSNSNS***
In each column, different letters indicate significant differences; NS, *, and ** refer to not significant, significant at p <0.05, and significant at p <0.01, respectively.
Disclaimer/Publisher’s Note: The statements, opinions and data contained in all publications are solely those of the individual author(s) and contributor(s) and not of MDPI and/or the editor(s). MDPI and/or the editor(s) disclaim responsibility for any injury to people or property resulting from any ideas, methods, instructions or products referred to in the content.

