Article

Agrivoltaics: Integration of Reused PV Modules

by
María-Beatriz Nieto-Morone
1,2,
Miguel-Ángel Muñoz-García
2,3,*,
David Pérez López
3,4,
Carlota Bernal-Basurco
3,4,
Félix García Rosillo
1 and
María del Carmen Alonso-García
1
1
Unidad de Energía Solar Fotovoltaica, Departamento de Energía, CIEMAT, Av. Complutense, 40, 28040 Madrid, Spain
2
Laboratorio de Propiedades Físicas y Técnicas Avanzadas en Agroalimentación (LPF-TAGRALIA), Universidad Politécnica de Madrid, Av. Puerta de Hierro, 2, 28040 Madrid, Spain
3
School of Agricultural, Food and Biosystems Engineering (ETSIAAB), Universidad Politécnica de Madrid, Av. Puerta de Hierro, 2, 28040 Madrid, Spain
4
Centro de Estudios e Investigación para la Gestión de Riesgos Agrarios y Medioambientales (CEIGRAM), Paseo de la Senda del Rey, 13, 28040 Madrid, Spain
*
Author to whom correspondence should be addressed.
Agronomy 2025, 15(3), 730; https://doi.org/10.3390/agronomy15030730
Submission received: 5 February 2025 / Revised: 11 March 2025 / Accepted: 12 March 2025 / Published: 18 March 2025

Abstract

:
This study evaluates the integration of reused PV modules within an agrivoltaic system designed for sustainable horticultural production, focusing on energy performance and agricultural outcomes. The experimental setup included both new and partially repaired PV modules, installed over tomato crops under real operating conditions. The results demonstrate that reused PV modules exhibit a strong and consistent energy performance, achieving correlations between irradiance and energy output comparable to new panels. Despite slightly lower performance ratios, reused modules maintained stable efficiency and operational viability, emphasizing their potential for sustainable applications. On the agricultural side, shading provided by PV panels protects the crop yield. This study highlights the environmental and economic advantages of incorporating reused PV modules into agrivoltaic systems, including reductions in raw material extraction, electronic waste generation, and overall environmental impact. By leveraging the circular economy principles, agrivoltaics with reused PV modules provide a sustainable pathway to balance energy production and food security while optimizing land use efficiency. These findings establish the potential of agrivoltaics as a key technology in advancing the sustainable energy transition.

1. Introduction

The rapid expansion of solar photovoltaic (PV) energy is recognized as a pivotal element in the global transition toward renewable energy sources. Solar PV installations have grown exponentially in recent decades, playing a central role in the decarbonization of energy systems and the achievement of climate targets [1]. However, as solar PV continues to be deployed on a massive scale, concerns have emerged regarding land use conflicts, resource scarcity, and the lifecycle management of PV technology. At the intersection of these issues lies the concept of agrivoltaics (AGVs), which integrates photovoltaic electricity generation with agricultural activities, offering a dual land use solution that addresses both energy generation and food production [2].
The concept of agrivoltaics has gained significant attention as a means of optimizing the use of arable land. This dual-use approach mitigates the diminishing returns that are commonly associated with the dedication of land to the production of either energy or food, commonly known as the “food versus fuel” debate [1,2]. The key advantage of agrivoltaics lies in its capacity to simultaneously address food security, energy demand, and land use efficiency by leveraging the symbiotic relationship between PV systems and crops. Solar panels can provide shading that reduces water evaporation from the soil, thereby lowering the need for irrigation while still allowing sufficient sunlight for the photosynthesis of crops, including perennial crops, such as fruit species [3]. Additionally, they shield crops from extreme weather conditions, such as excessive heat, wind, frost, or hail, which could damage either the yield or the plant, thus contributing to higher yields and improved produce quality [4,5,6]. Meanwhile, crops beneath PV arrays can help cool the panels through evapotranspiration [7], potentially improving PV efficiency by reducing overheating [8].
A key factor in optimizing agrivoltaic systems is the efficient utilization of the entire solar spectrum—mainly within the visible (VIS) and near-infrared (NIR) ranges—while the remaining spectral components, such as ultraviolet (UV) and longer infrared wavelengths, are either underutilized or dissipated as heat. However, the spectral pattern under the panels tends to change its composition, i.e., UV, red, and green. Recent advances in full-spectrum solar energy utilization seek to overcome this limitation by employing spectral splitting technology, which separates incoming sunlight into different wavelength bands, directing each to the most suitable conversion mechanism [9]. This approach maximizes energy efficiency by enabling simultaneous photothermal, photovoltaic, and photochemical processes, enhancing the overall system performance. The integration of such strategies in agrivoltaics can improve both agricultural productivity and energy generation by optimizing the spectral distribution available to crops and PV.
Several studies have explored the performance of different crops under agrivoltaic systems, focusing on key parameters, such as yield, water-use efficiency, and crop quality, including variables like size, nutrient content, and resistance to diseases. In particular, Bruhwyler and Feuerbacher et al. demonstrated in their research that crops such as wheat and lettuce show an improved performance when grown under PV arrays due to microclimate changes induced by shading from the panels [10,11]. Another study on agrivoltaic grape cultivation demonstrated that moderated sunlight exposure and reduced water stress could enhance the water-use efficiency and grape quality [12]. Similar results were found in the research on chili peppers and Welsh onions cultivated under controlled greenhouse conditions, where shading provided by PV panels enhanced crop quality while maintaining comparable yields to those achieved through conventional farming practices [10,13].
Regarding water content in the soil, Van de Ven et al. [6] proved that agrivoltaic systems result in a reduction in water evaporation from the soil, thereby reducing irrigation needs while still allowing sufficient sunlight for the photosynthesis of crops. Additionally, the protective effect of the PV panels shields crops from extreme atmospheric conditions, such as excessive heat, frost, or hail, which contributes to higher yields and better-quality produce [14,15]. These results highlight the potential of agrivoltaic systems to enhance the sustainability of both food and energy production, especially in regions facing water scarcity or extreme climatic conditions.
Studies conducted in diverse environments have demonstrated how AGV systems respond to variations in climate and soil properties. In Mediterranean regions, shading from PV panels has been shown to significantly reduce evapotranspiration, leading to water savings up to 30% in crops such as cucumber while maintaining stable yields [16]. In temperate climates, experiments with rainfed maize have revealed that AGV conditions not only stabilize yields but also improve crop resilience during drought periods by preserving soil moisture and moderating temperature extremes. In tropical regions, AGV systems implemented in large-scale solar farms have demonstrated benefits beyond agricultural productivity, such as improving soil conductivity and reducing erosion, which enhances both plant growth and the stability of the electrical infrastructure [17]. Meanwhile, in semi-arid environments, AGV projects have been successfully used to rehabilitate degraded land. A large-scale AGV park in Jiangshan, China, has shown that integrating PV panels with layered crop cultivation can restore soil fertility, reduce erosion, and generate economic benefits by combining agriculture and renewable energy production [18].
An important and emerging aspect that can be considered in agrivoltaic applications is the reuse of decommissioned PV modules, which aligns with circular economy principles while contributing to the sustainability of solar energy systems. Since agrivoltaic installations often combine moderate energy demands with the dual function of energy production and agriculture, they provide a suitable opportunity to reuse PV modules that have been decommissioned but still retain sufficient efficiency for practical applications. This approach offers both environmental and economic benefits, extending the useful life of PV modules and reducing the demand for new raw materials, such as silicon, silver, and aluminum. Moreover, repurposing second-hand panels in agrivoltaics systems helps mitigate the growing issue of PV waste mass while maintaining the energy output required for such applications.
By integrating reused PV panels into agrivoltaics systems, the solar industry can move toward a more sustainable and resource-efficient model, reducing electronic waste and lowering the environmental footprint associated with the manufacturing and disposal of solar modules. Recent studies have shown that second-hand PV modules can be easily repaired and reintegrated into new installations, significantly extending their operational lifespan while supporting the transition to a more circular economy in the photovoltaic sector [19].
Nieto Morone et al. [20] showed that partially repaired or second-hand PV modules can still perform adequately despite experiencing some degree of electrical degradation. For example, a recent analysis of partially repaired modules from Spanish PV plants found that 87% of the modules exhibited less than 20% power loss, demonstrating that these panels can still generate energy despite the presence of defects. This highlights the viability of second-hand panels for reuse in systems like agrivoltaics, where energy demands are lower compared to grid-connected solar farms, and minor performance losses do not significantly affect overall productivity. An important consideration in agrivoltaic systems is the difference between the lifespan of PV modules and the life cycle of crops. While new PV modules typically last 25–30 years, reused modules, as considered in this study, have already been in operation for 12 years, meaning their remaining lifespan is shorter. In contrast, agricultural crops have much shorter cycles, usually measured in months or a few years. This disparity allows for multiple crop rotations under the same PV infrastructure, optimizing land use over time. However, when integrating reused PV modules, it is necessary to consider their remaining operational life to ensure that their energy production remains viable throughout the agrivoltaic system’s operation. This highlights the importance of circular economy approaches, where repurposing second-hand PV modules can enhance sustainability while maintaining agricultural productivity.
The aim of this study is to evaluate crop productivity in a plantation of 384 m2 designed to support sustainable horticultural production in which part of the land is also used to produce electricity with a small photovoltaic installation (agrivoltaic systems) in which part of the modules are reused. This experimental project at the Universidad Politécnica de Madrid (UPM) focuses on assessing the effects of the agrivoltaic system in the plantation, comparing the results of repaired and conventional PV modules both on energy production and agricultural productivity. Specifically, this study analyzes the impact of PV systems on tomato (Solanum lycopersicum L.) productivity while also examining the stability of electrical parameters, energy output, and reliability of second-hand PV modules compared to new ones under real operating conditions.

2. Materials and Methods

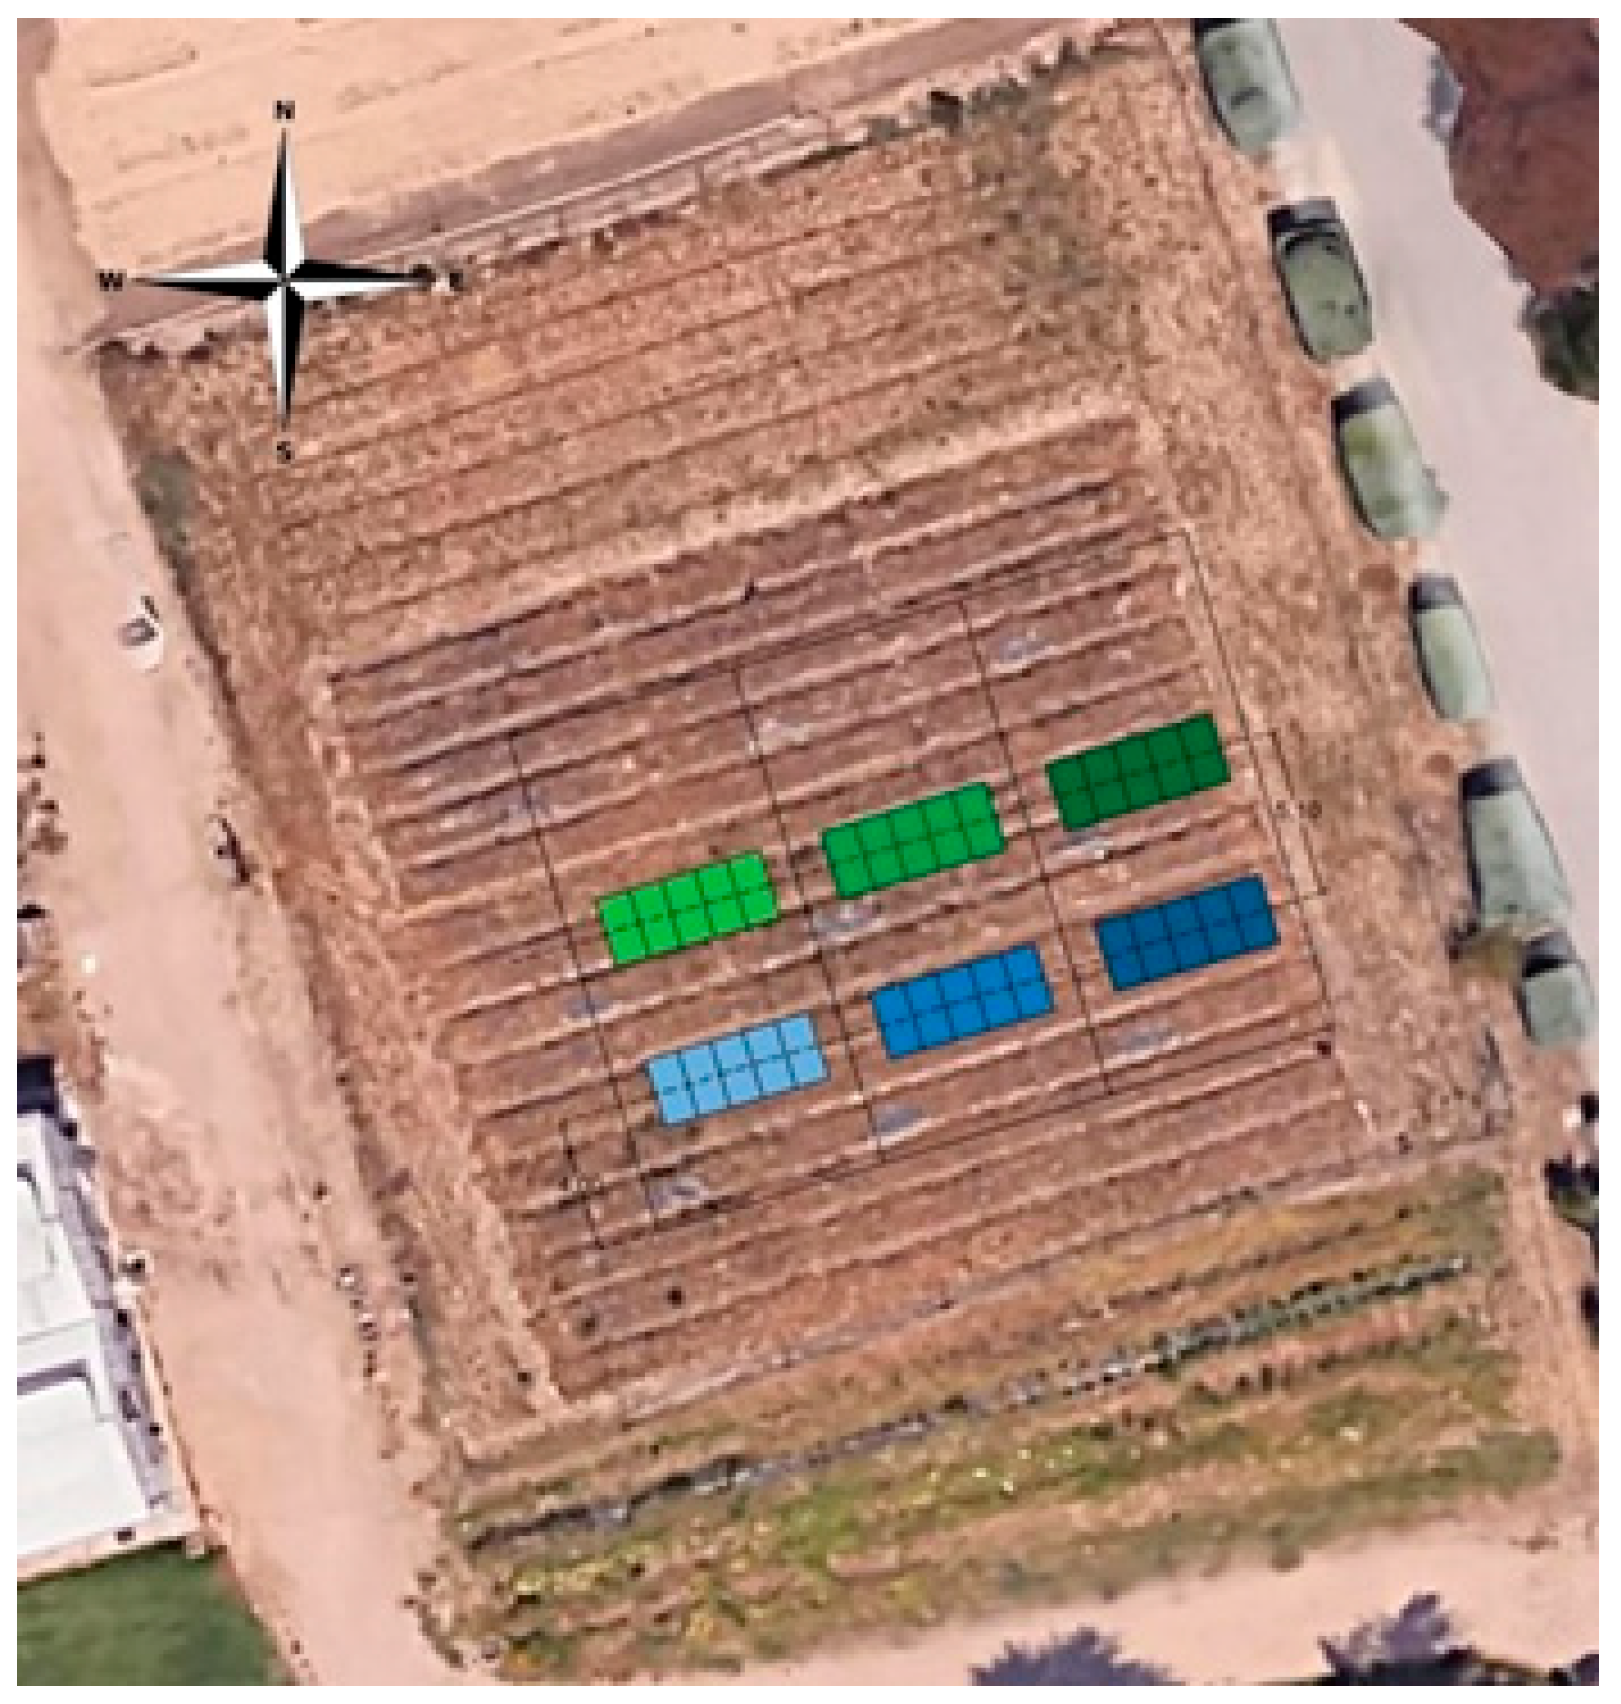
2.1. Location and Conditions of the Test

This study was carried out at the Escuela Técnica Superior de Ingeniería Agronómica, Alimentaria y de Biosistemas (ETSIAAB) of UPM (40°26′ N, 3°44′ W). The geographical site recorded average maximum temperatures of 30.6 °C, reaching a peak of 42 °C. The average temperatures were 11.8 °C, with the lowest recorded value of 0.2 °C. During the period of study, the mean precipitation was 85.2 mm. The average relative humidity in the experimental plots was 49.34%, fluctuating between a minimum of 3.52% and maximum of 99.98%. The average wind speed during the growing cycle was 1.1 m/s, with a minimum daily average of 0.7 m/s recorded on 2 August 2024 and 21 May 2024, and a maximum of 1.8 m/s on 14 May 2024. The wind direction was 274°, which means the wind was coming from the west (W), slightly northwest.
The agrivoltaic installation covered an area of approximately 65.20 m2. Soil was Anthrosol, deeper than 1.5 m and with three horizons. The first was 30 cm, had a sandy loam texture, pH of 7.8, and 3.68% of organic matter and 1.3% of total limestone. A second horizon was from 30 cm to 90 cm, had a sandy loam texture, pH of 7.9, and a percentage of 1.5% of total limestone. The third horizon was from 90 cm to deeper with a loamy sand texture.

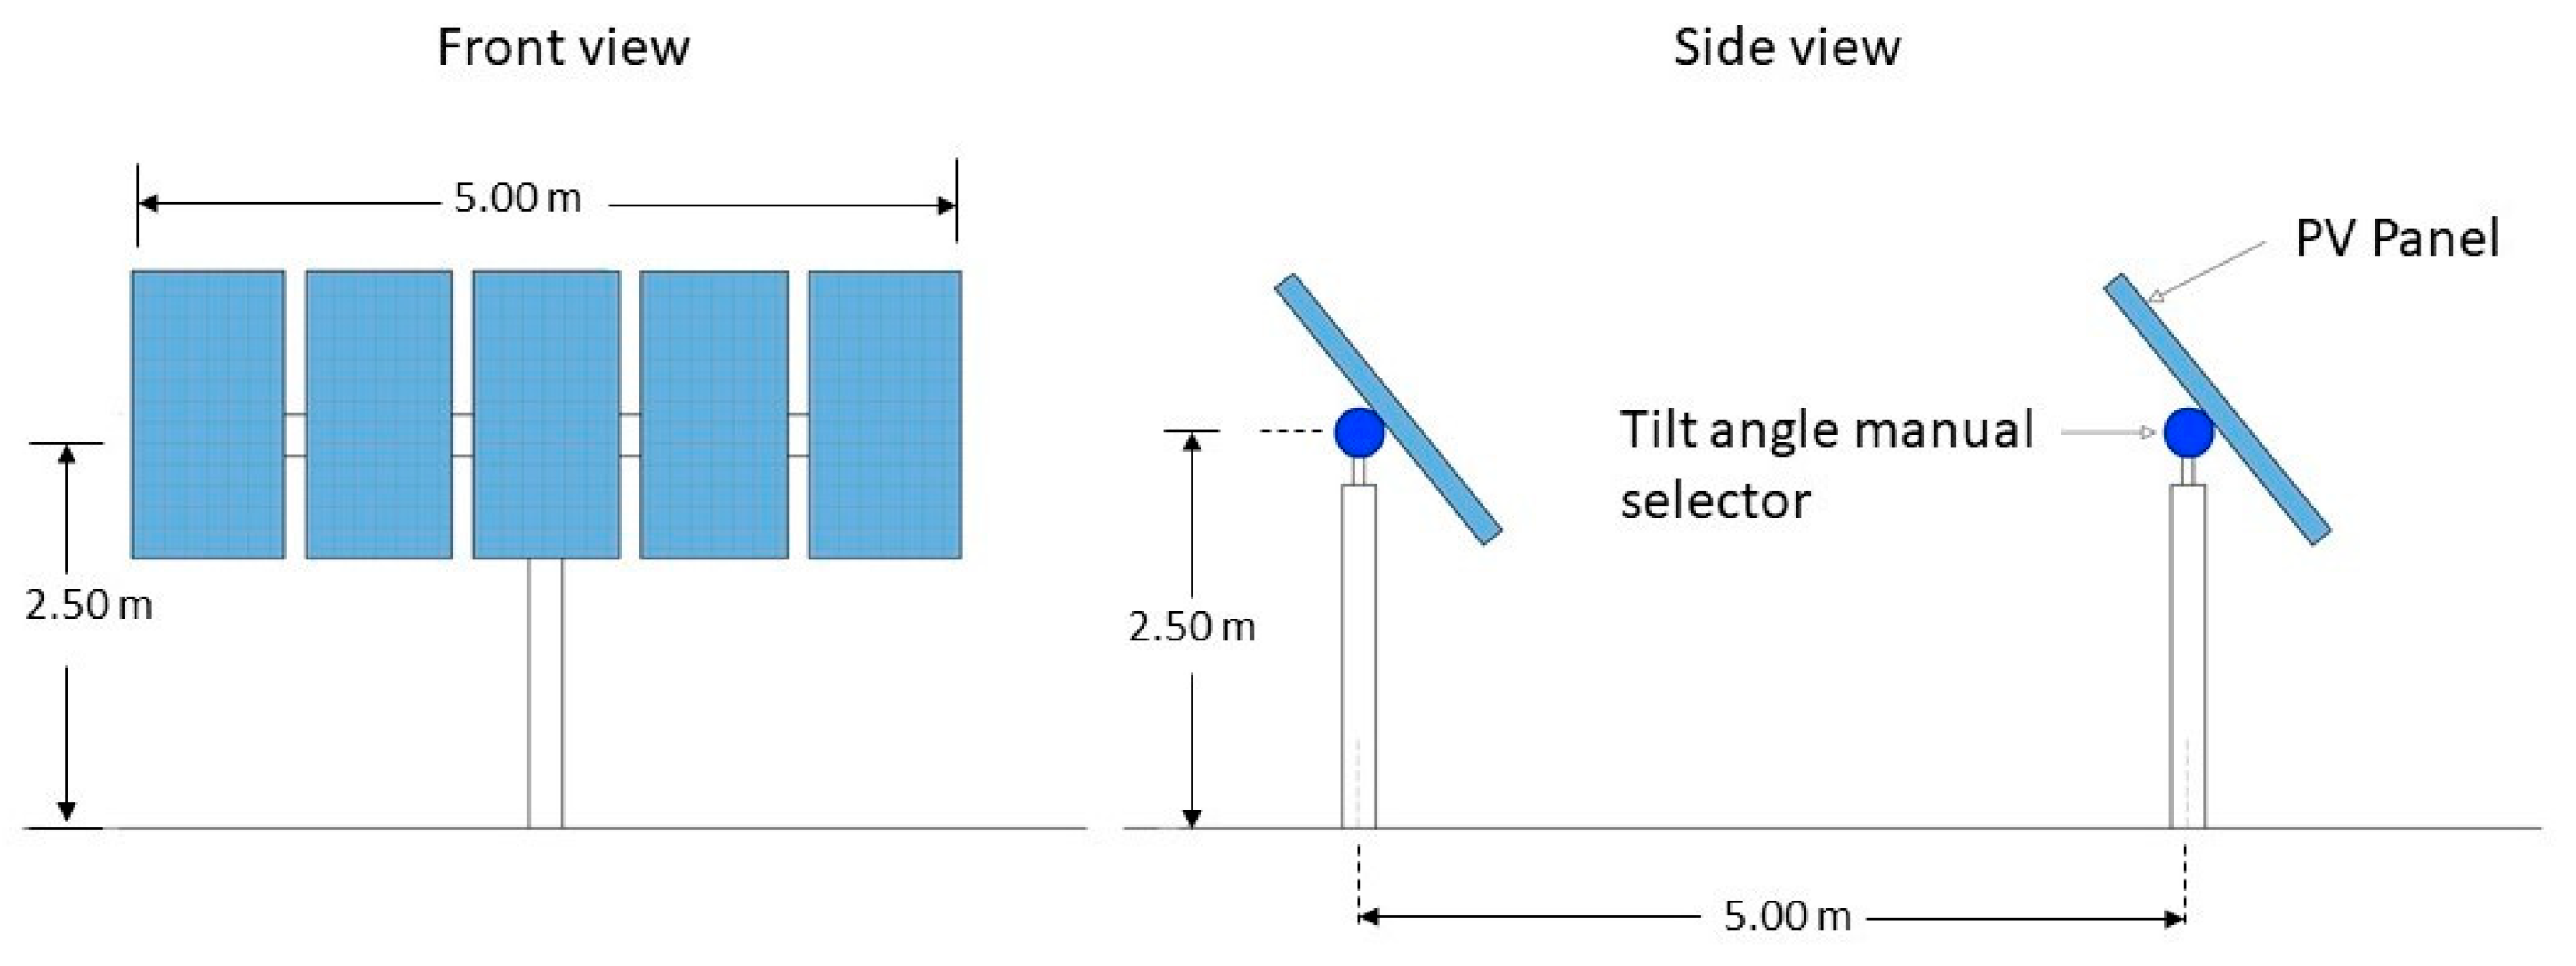
2.2. Installation of the Photovoltaic System

The experimental PV installation, designed for testing purposes, consisted of a system with a total capacity of 9.3 kWp. The system consisted of 30 monocrystalline silicon modules facing south-east (25° from the north–south axis), arranged in 6 strings of 5 modules each, connected in series. These strings were then wired in parallel, with the output of each string fed into the Maximum Power Point Tracking (MPPT) inputs of SAJ R5-5K-T2-15 inverters.
The PV modules included 15 newly installed JNMM144-450L modules, each of 450 Wp, and 15 repaired TopSolar TSM 160M modules with a lower peak power of 170 Wp. The used modules, approximately 12 years old, were selected based on their availability and were repaired to restore their functionality. Prior to reuse, the modules were characterized as a preliminary step, as detailed in our previous work [20]. The panels were characterized using the IEC 61215 [21] standard tests: visual inspection (MQT 01), maximum power determination (MQT 02), insulation test (MQT03), wet current leakage test (MQT15), electroluminescence, and infrared imaging. These analyses confirmed that the repaired modules were functionally stable and suitable for deployment in the agrivoltaic system. The technical specifications of the new and used modules are summarized in Table 1 and Table 2, respectively.
The experimental setup consisted of two single pole structures per plot, each supporting 5 monocrystalline silicon modules. Three replications were performed for statistical purposes, resulting in a total of 6 single poles across the experimental plots. Each single pole presented a height of 2.5 m, where the center of the PV modules was positioned. The monopoles had a horizontal axis that allowed the tilt angle of the modules to be adjusted. Within each plot, one monopole was equipped with new PV modules, while the other monopole held used modules, with each monopole forming an independent string. The distance between the monopoles in the same plot was 5 m, which allowed for the inclusion of two internal ridges between them. Figure 1 shows a schematic representation of the monopole.
This configuration ensured the system’s structural and operational integrity and made it easier to assess the performance and feasibility of reusing modules.
Following one of the most common options, the panels were not cleaned manually. They were simply cleaned naturally by the rain. This was to ensure greater sustainability, even though soiling is a known effect and can affect production by 1 to 5%, with the effect being equivalent in both systems due to their location. On the other hand, maintenance was limited to monitoring the electrical protection elements, just as it happens in commercial installations, since photovoltaic systems have the advantage of minimal maintenance.

2.3. Design of the Plantation and Treatments

The planting was carried out on ridges that were 1.10 m wide, each containing two rows of plants spaced 50 cm apart. The distance between plants within each row was 30 cm, arranged in a triangular planting pattern. The spacing between ridges was 60 cm, resulting in a final planting density of 47.619 plants/ha. To reduce weed emergence, the ridges were mulched with a 1.50 m wide black polyethylene plastic film.
Each experimental plot consisted of ridges 8.5 m wide, with the outermost ridges designated as borders. Data collection was focused on the central area of the ridge, leaving at least 2 m as a border.
Each row of plants was equipped with a drip line positioned 10 cm inside the inner side of the ridge below the plastic film, with drippers spaced 30 cm apart. The drippers, integrated into the drip line, which was 16 mm in diameter, were self-compensating with a nominal flow rate of 4 L/h.
Irrigation was equal for both treatments, totaling 242 mm for the whole season. The crop needs, calculated by Food and Agriculture Organization (FAO) method, were 369 mm [22]. Deficit irrigation was used based on the hypothesis that shaded plants require less water than those cultivated in an open field.
Soil moisture was determined weekly in the first 20 cm of soil with Hydrosens II equipment (Campbell Scientific Inc., Logan, UT, USA). The measurements were taken between the two crop rows of a ridge, with no significant differences between treatments, showing values ranging from 5.6% to 27.1%, depending on the proximity of irrigation to the time of measurement.
The planting was carried out on 24 April 2024 using tomato plants (Solanum lycopersicum L.) of the AB8058 variety from Bayerat with a phenological stage in the range of 15–16 according to the BBCH scale [23]
Two treatments were considered: one in the inner space of the PV system, which was shaded during part of the day, and one outside the PV system without any shade.

2.4. Sampling and Measures

Harvesting was conducted on 6 August 2024, 104 days after planting. To obtain a representative measurement of plant productivity, six plants were harvested per plot. Harvested tomatoes were divided into two groups: commercial or reds, which included all tomatoes without defects, and non-commercial, which included tomatoes with defects, such as a green color, blossom end rot, sun scald, cracking fruits, or others.
After harvesting the fruit, the aerial parts of the six plants were cut and dried in a stove at 60 °C until they reached a constant weight.
Photosynthetically active radiation (PAR) was measured 70 cm above the soil, the height expected for the plant plus 10 cm. Each shaded experimental plot was equipped with an SQ-421X-SS SDI 12 digital output quantum sensor (Apogee, Logan, UT, USA). An additional sensor was installed outside the shaded zone, above one experimental plot of the non-shaded treatment. This data allowed us to calculate the daily light integral as a summatory of PAR during a day.
The experimental procedure involved operating both sets of PV modules—new and second-hand—under identical environmental conditions. PV modules were positioned as shown in Figure 2, where PV panels in the blue range are new and reused in the green range. Any differences in shading, orientation, or incident solar radiation were minimized.

2.5. Statistic Analysis

Data were statistically analyzed by a one-way analysis of variance (ANOVA) using Python 3.12.9. Significant differences were evaluated using the ANOVA test. The probability level for significance determination was 0.05.

2.6. Photovoltaic Data Collection and Parameters Monitored

Several parameters were continuously monitored to assess the reused PV modules’ performance and their integration feasibility in this agrivoltaic environment. The following key metrics were evaluated:
  • Electrical performance: the power output of the reused string PV modules was monitored continuously using a data acquisition system integrated into the selected inverters. Variables like current and voltage output were recorded every 5 min to capture diurnal and seasonal performance variations.
  • Thermal response and cooling effect: module temperature was measured using temperature sensors attached to the backsheet of the PV panels.
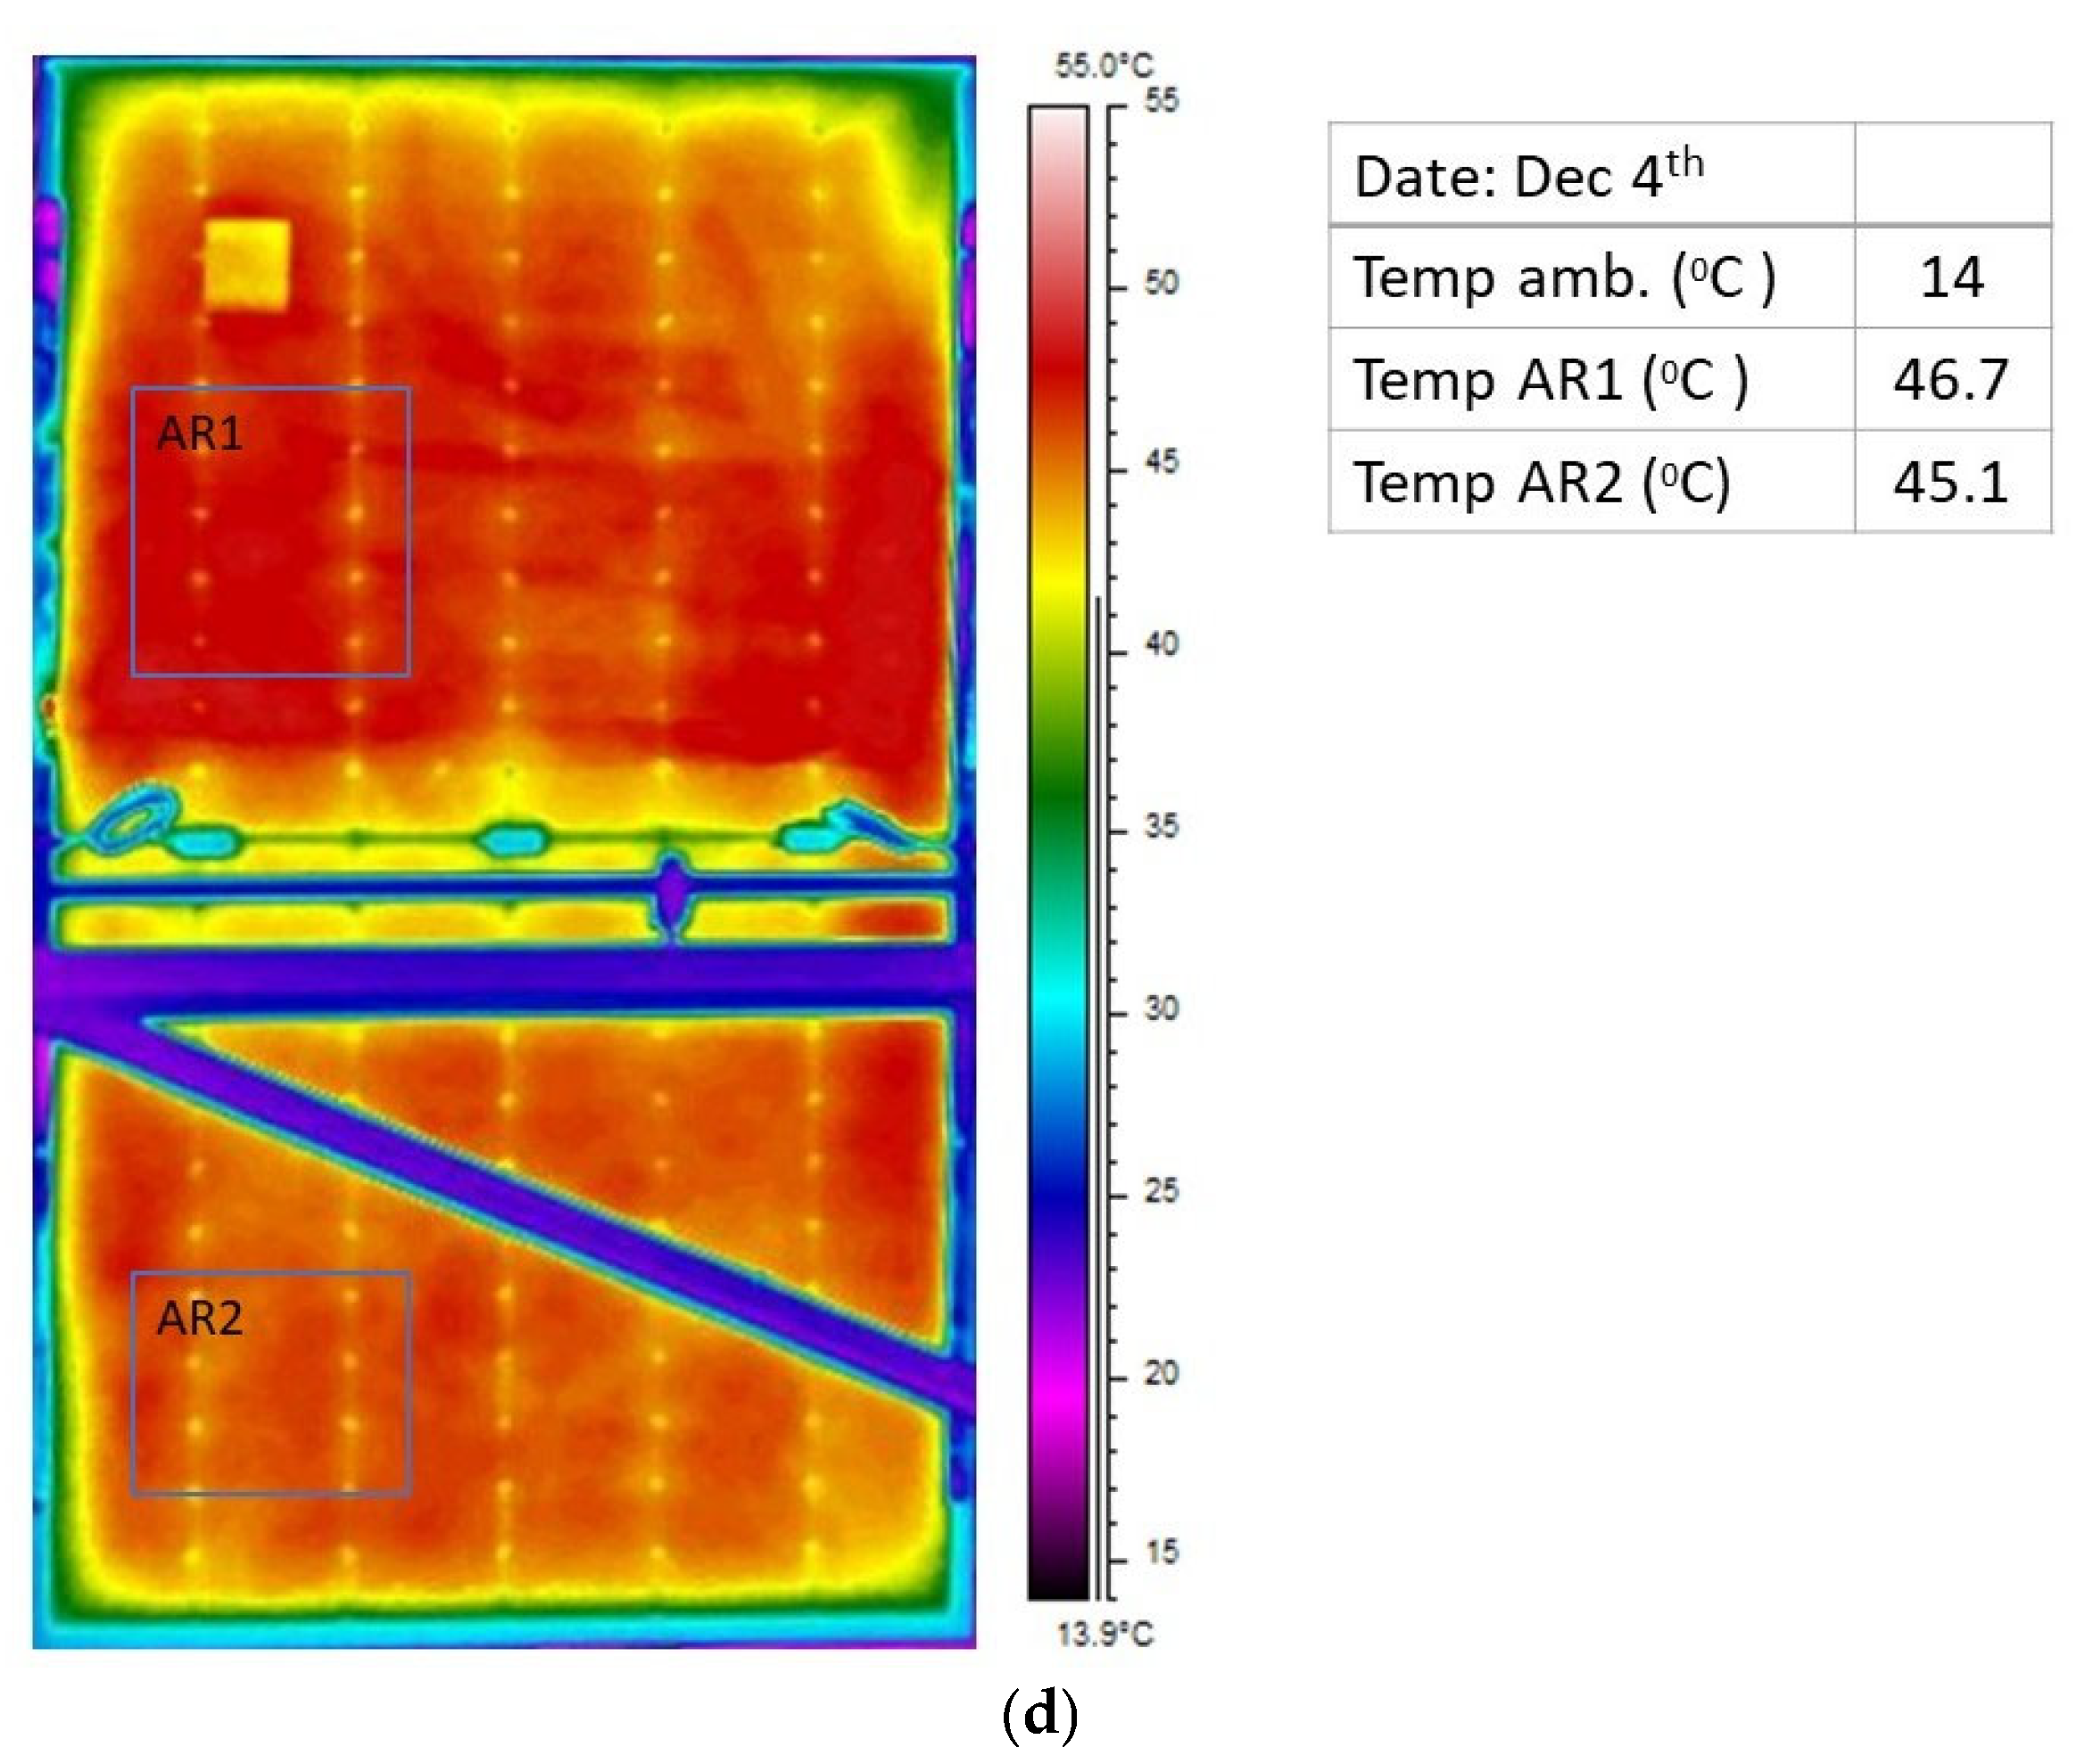
  • Infrared thermography (IR) images: IR images were captured under operational conditions using a FLIR SC640 Thermal Imaging camera, which had a temperature reading accuracy of ±2 °C, a focal plane array of 640 × 480, and a thermal sensitivity of 60 mK at 30 °C. The images were acquired periodically for optimal thermographic analysis depending on favorable weather conditions.

3. Results

This study analyzed the impact of shading and photosynthetically active radiation (PAR) on tomato crop performance under agrivoltaic conditions. The first part of the results is organized into three sections: total yield, commercial tomato production, and fruit production analyses. This one examines dried plant weight and the effects PAR variability. Each section discusses the findings, their implications, and potential insights for optimizing agrivoltaic systems. The second part presents the outcomes of the electrical parameters’ analysis, energy output, and reliability of reused PV modules compared to new ones in real operating conditions.

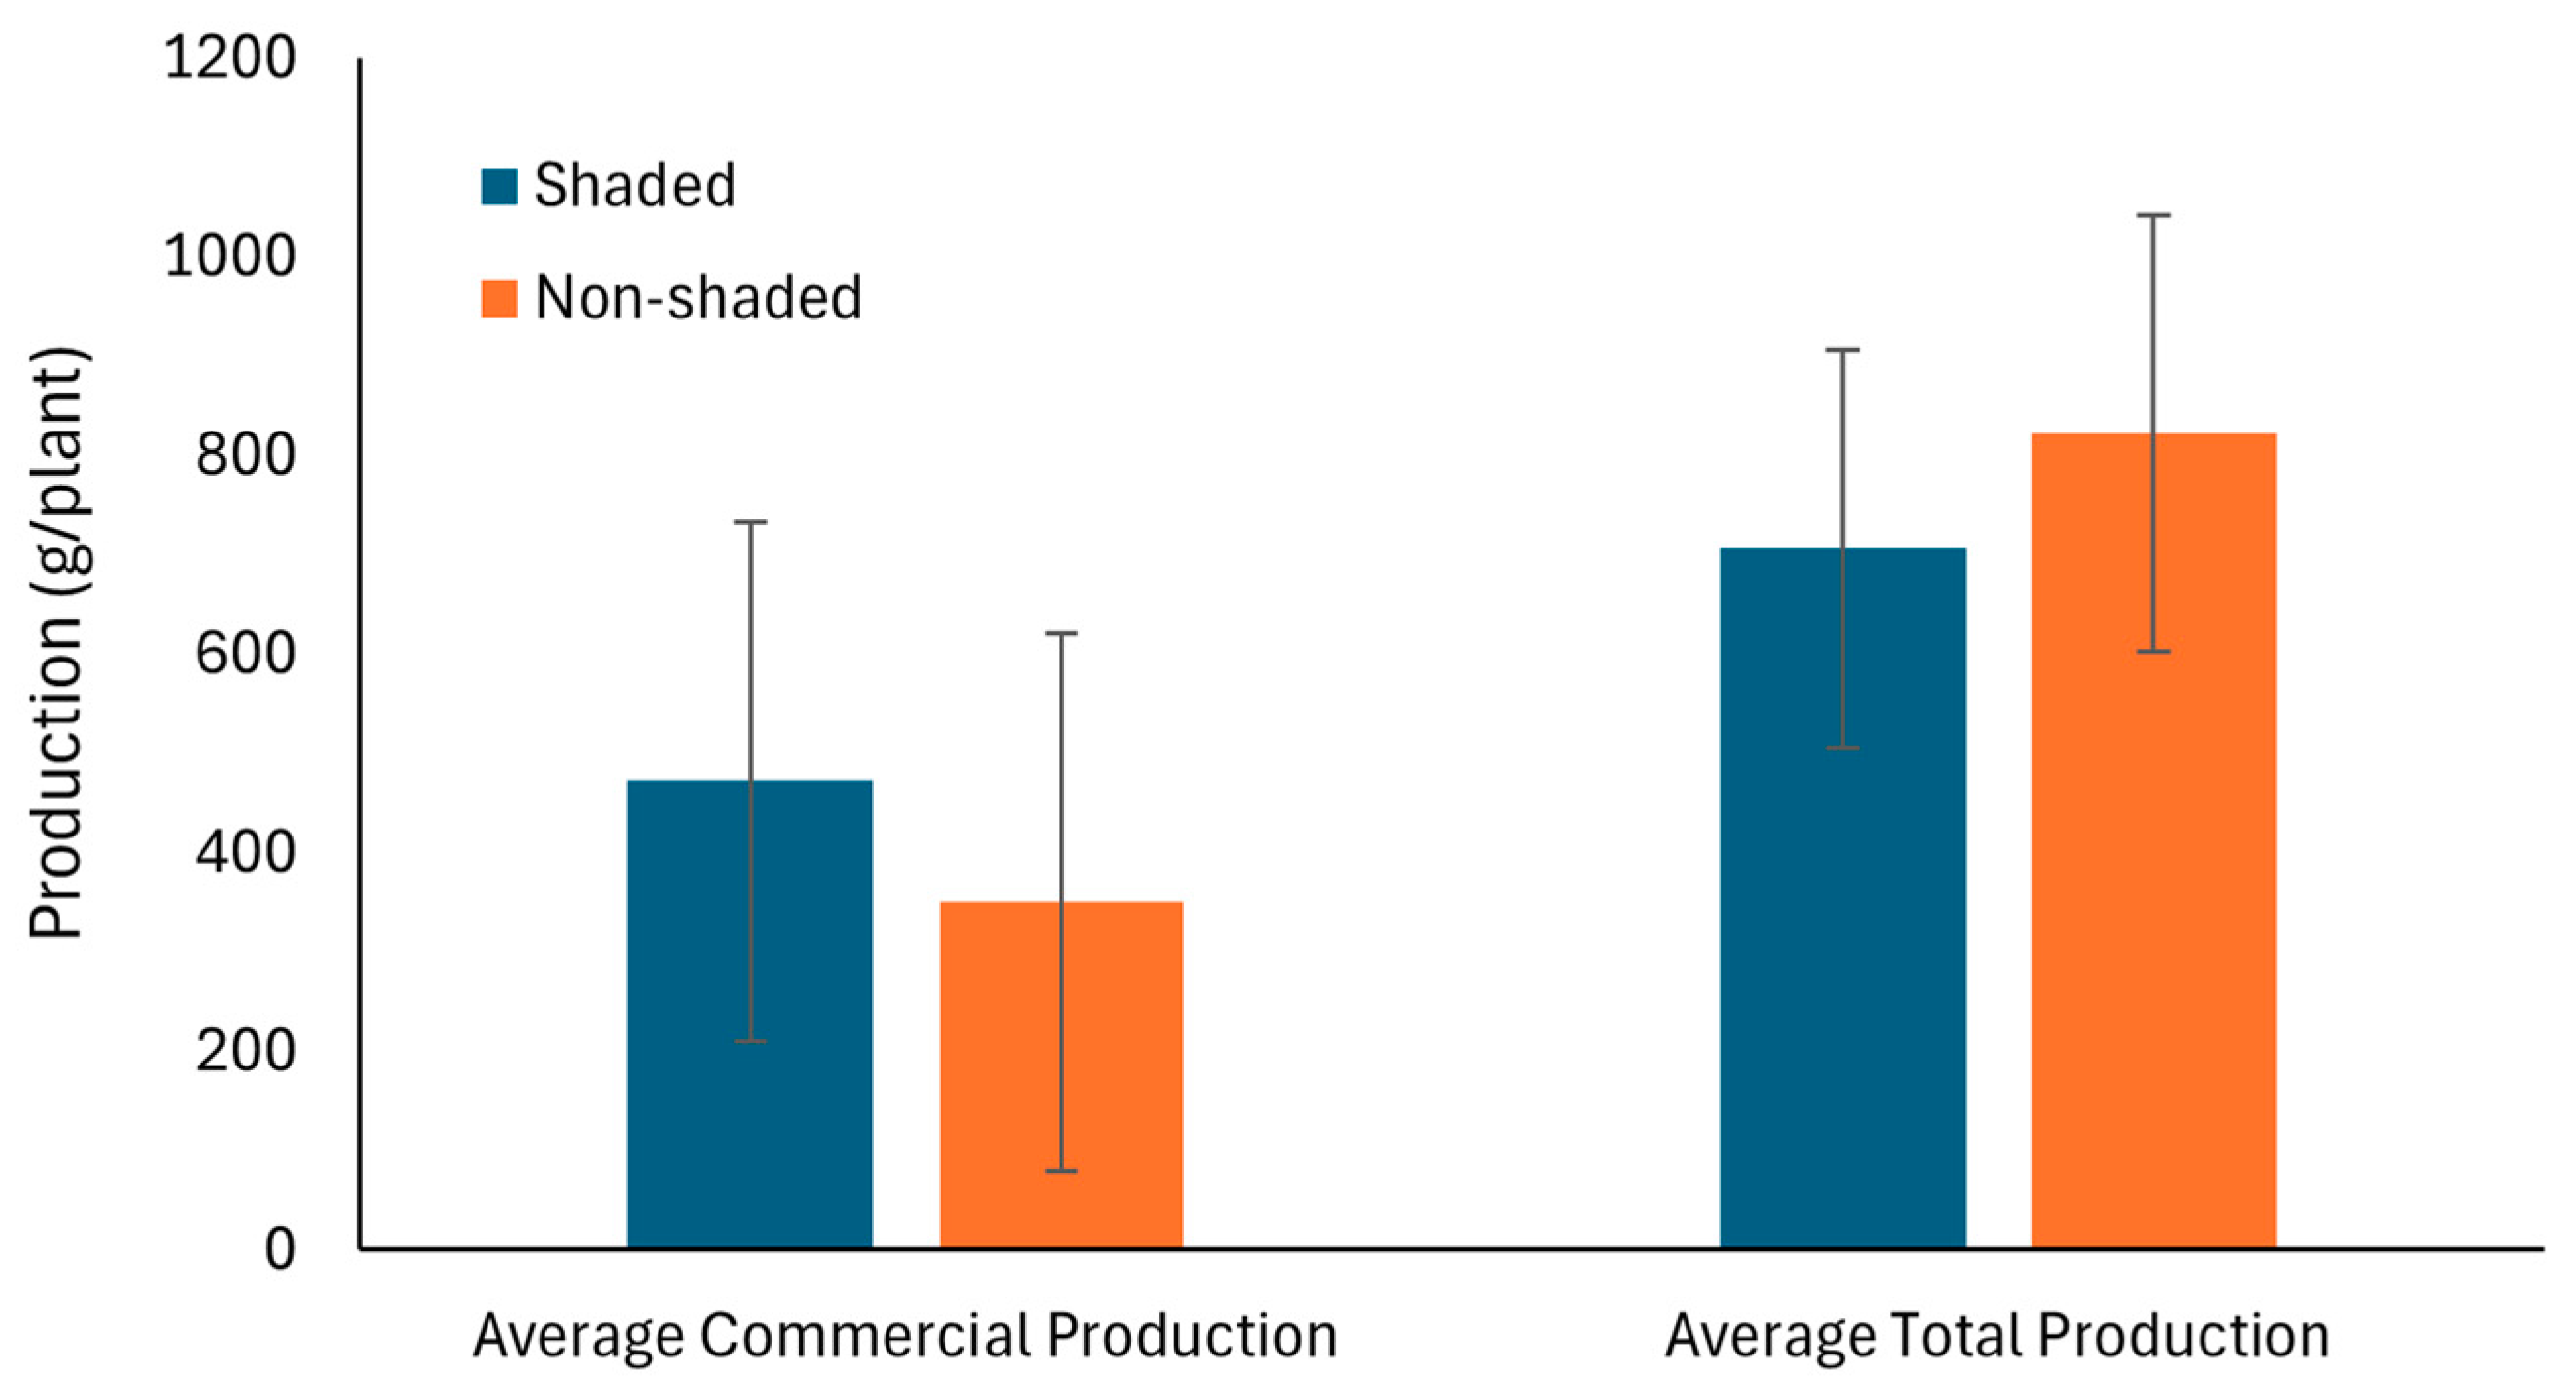
3.1. Crop Total Yield

Figure 3 illustrates the average total production, defined as the total weight of all harvested fruits, regardless of their maturity, color, or condition. This metric includes both fully developed, ripe fruits, and those that have not yet reached full maturity, including green and yellow fruits. It also includes damaged fruits, such as blossom end rot (BER) and sunscald tomatoes. Additionally, it also represents the average commercial production. This metric represents the weight of fruits ready to be commercialized. Total crop yield, a key indicator of productivity, did not differ significantly between shaded and non-shaded plots, although the average yield under panels (shaded conditions) was 706 g/plant, while in non-shaded plots it was 822 g/plant.
This aligns with the findings of Song et al. [24]. Similarly, H.-P. Kläring and A. Krumbein [25] observed a decrease in the yield in shaded tomato plants, although the reduction was less than expected, suggesting that plants can adapt their metabolism to mitigate yield losses. Moreover, a positive correlation was found between solar radiation and both yield and fruit number in tomatoes, with photosynthetically active radiation (PAR) directly influencing the yield, particularly before anthesis [26]. A similar trend was observed in lettuce, where Marrou et al. [27] reported that the yield was maintained in shaded plots due to an increase in the total leaf area per plant, compensating for lower light availability. However, Tani et al. [28] found that, despite this adaptation, lettuce growth was still inhibited under solar panels compared to greenhouse conditions, likely due to the greater reduction in light intensity.
In shaded plots, data productions ranged from 546 g/plant to 1008 g/plant (261.3 standard deviation), while in non-shaded plots they ranged from 638 g/plant to 1133 g/plant (270.8 standard deviation). The coefficient of variation was 55% in shaded plots and 46% in non-shaded plots.

3.1.1. Commercial Tomato (Mature Fruit) Production

The commercial tomato yield showed no significant differences with productions of 472 g/plant in shaded plots, while in the non-shaded ones this was 350 g/plant (Figure 3). The first one ranged from 289 g/plant to 687 g/plant, and in the other treatment it ranged from 184 g/plant to 598 g/plant.
The high variability of our data may be one of the reasons for the lack of statistical significance, although other studies have found no differences when tomatoes were grown in an agrivoltaic system, even increasing the yield [29]. Although tomatoes have a high radiation requirement [30] and significant differences have been found in other works [31], these differences may be due to the experimental design. In the study carried out by Scarano [31], tomatoes were grown in pots under the shade of the panels, while ours was an in-field experiment in the area between panels. The lack of significant differences may be due to deficit irrigation, which can cause water stress and limit the yield [32] more than shading. Additionally, these findings suggest that irrigation requirements in shaded plots are not lower, contrasting the results obtained by [29].

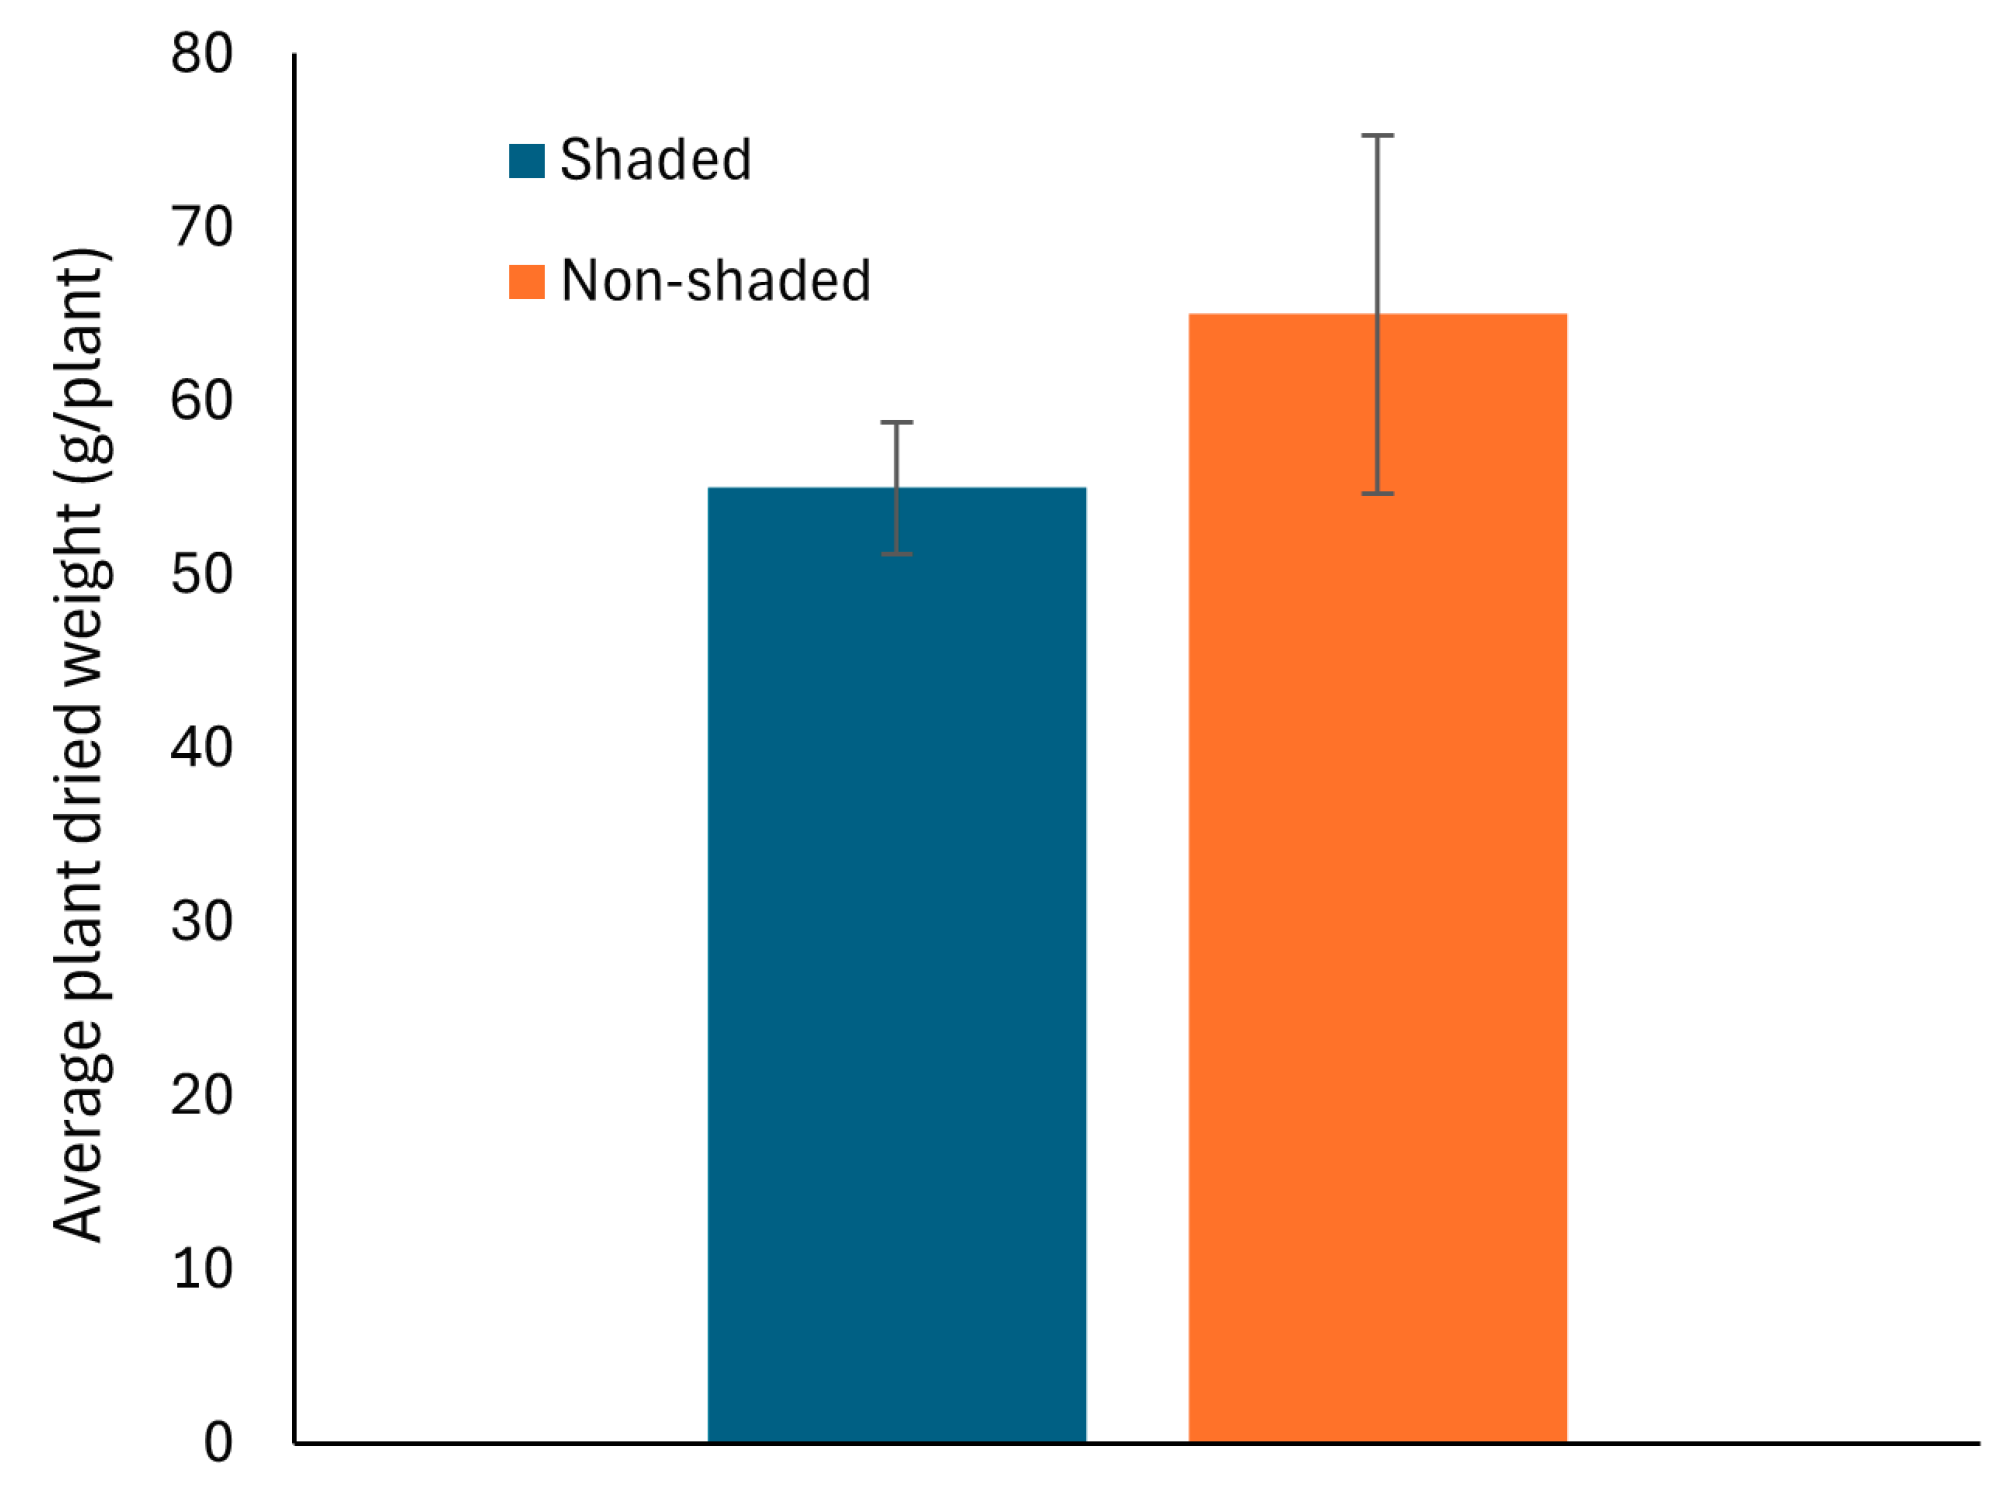
3.1.2. Fruit Production Analysis

Plant dried weight is a robust indicator of vegetative growth. In our study, plants grown under non-shaded conditions exhibited a higher average dry weight (65 g/plant ± 10 standard deviation) compared to those in shaded plots (55 g/plant ± 4 standard deviation) although the difference was not statistically significant, as shown in Figure 4. This lack of significance may be attributed to the small sample size, which represents a limitation of our study. Future research with a larger sample size could provide a more conclusive assessment of the impact of shading on plant dry weight.
Figure 5 shows the daily light integral (DLI) evolution monitored for the four months during the crop development.
DLI values are consistently lower in the shaded plots compared to the non-shaded ones. This clearly reflects the light-blocking and scattering effects of the photovoltaic infrastructure. While the shaded plots show a consistent attenuation pattern throughout the observation period, there are occasional dips, such as those observed in late May and mid-June, which can be attributed to environmental factors, in fact the time of the dips aligns with the dips in non-shaded plots. The non-shaded plots show higher DLI values with greater variability, in line with direct sunlight exposure, which is subject to fluctuations caused by weather patterns.
Seasonal light integral was calculated as summatory of DLI during the whole trial.
Figure 6a,b show the relationship between total production and commercial production vs. the seasonal light integral (SLI) to analyze the seasonal variability of the amount of photosynthetically active light.
Figure 6a shows that, in shaded plots, the SLI is 3415 mol/m2, much lower than in the non-shaded plots (5239 mol/m2).
The reduction in radiation did not result in a decrease in either the total or commercial yield, nor was there an apparent relationship between these parameters. As previously mentioned, this may be due to the fact that plant production is limited by deficit irrigation or that the radiation received by the shaded plants was enough for crop development.

3.2. Electrical Performance Analysis

The second part of the study presents the outcomes of the electrical parameters’ analysis, energy output, and reliability of second-hand PV modules compared to new ones in real operating conditions.

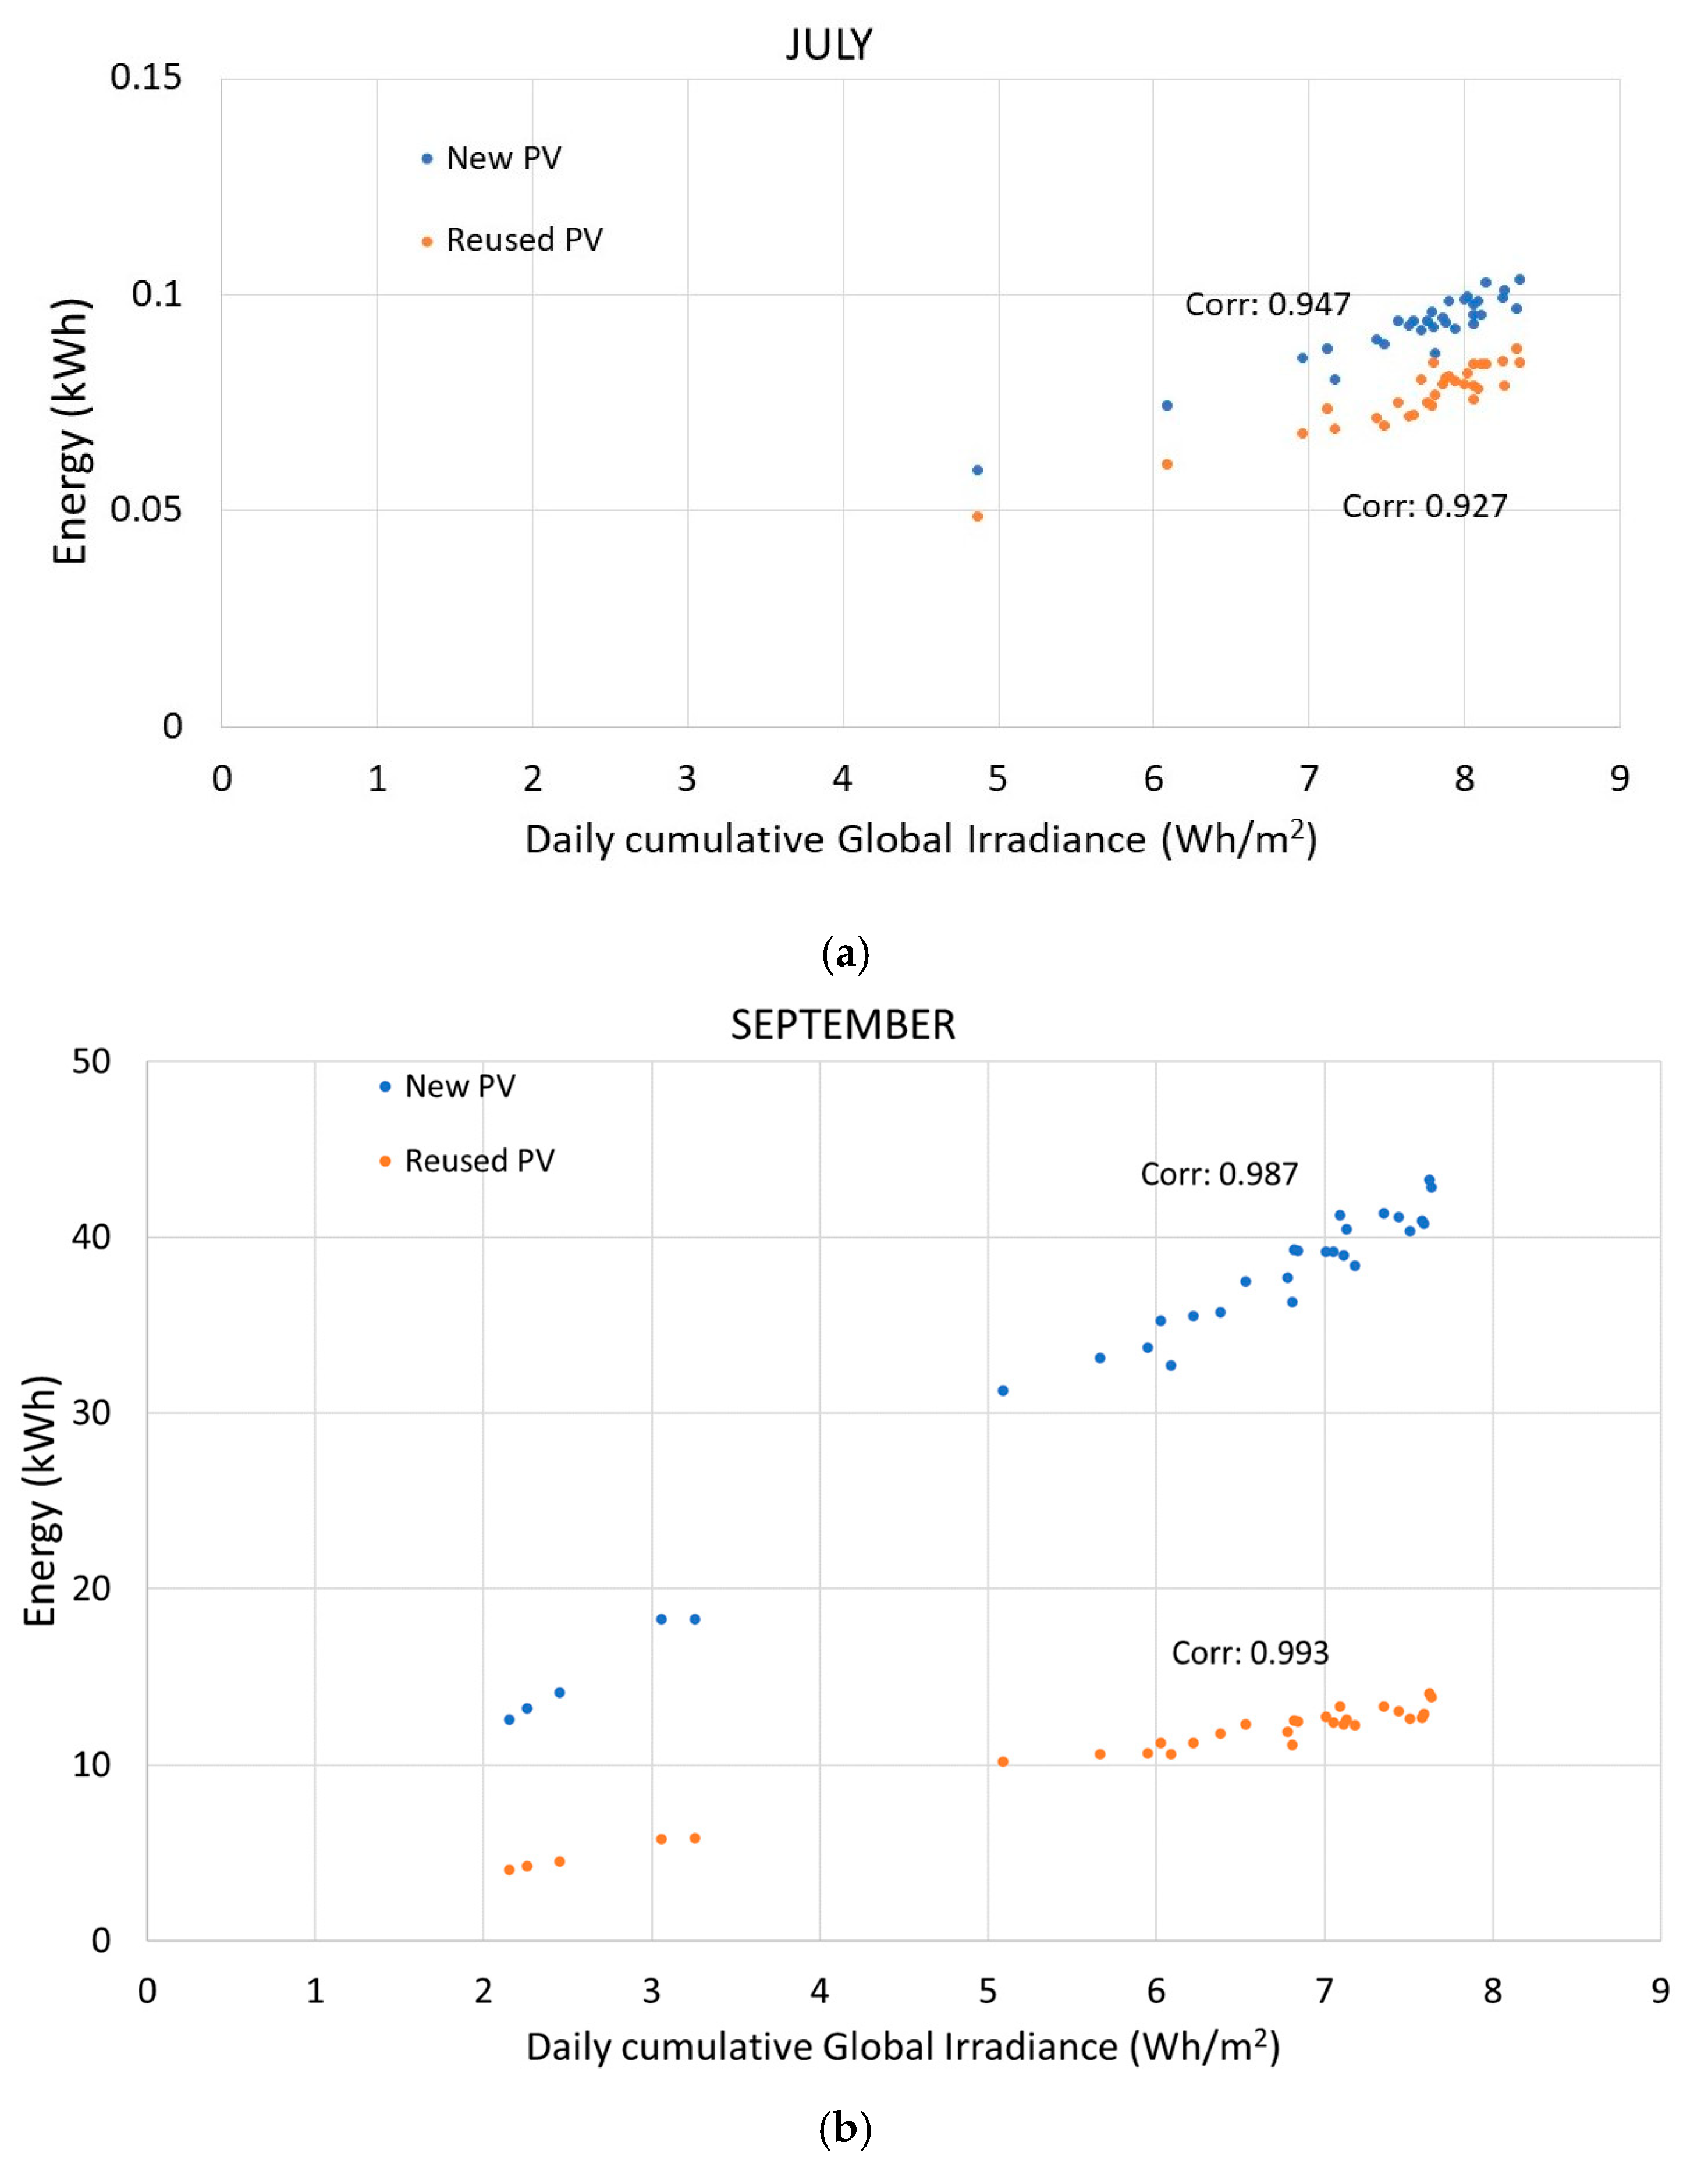
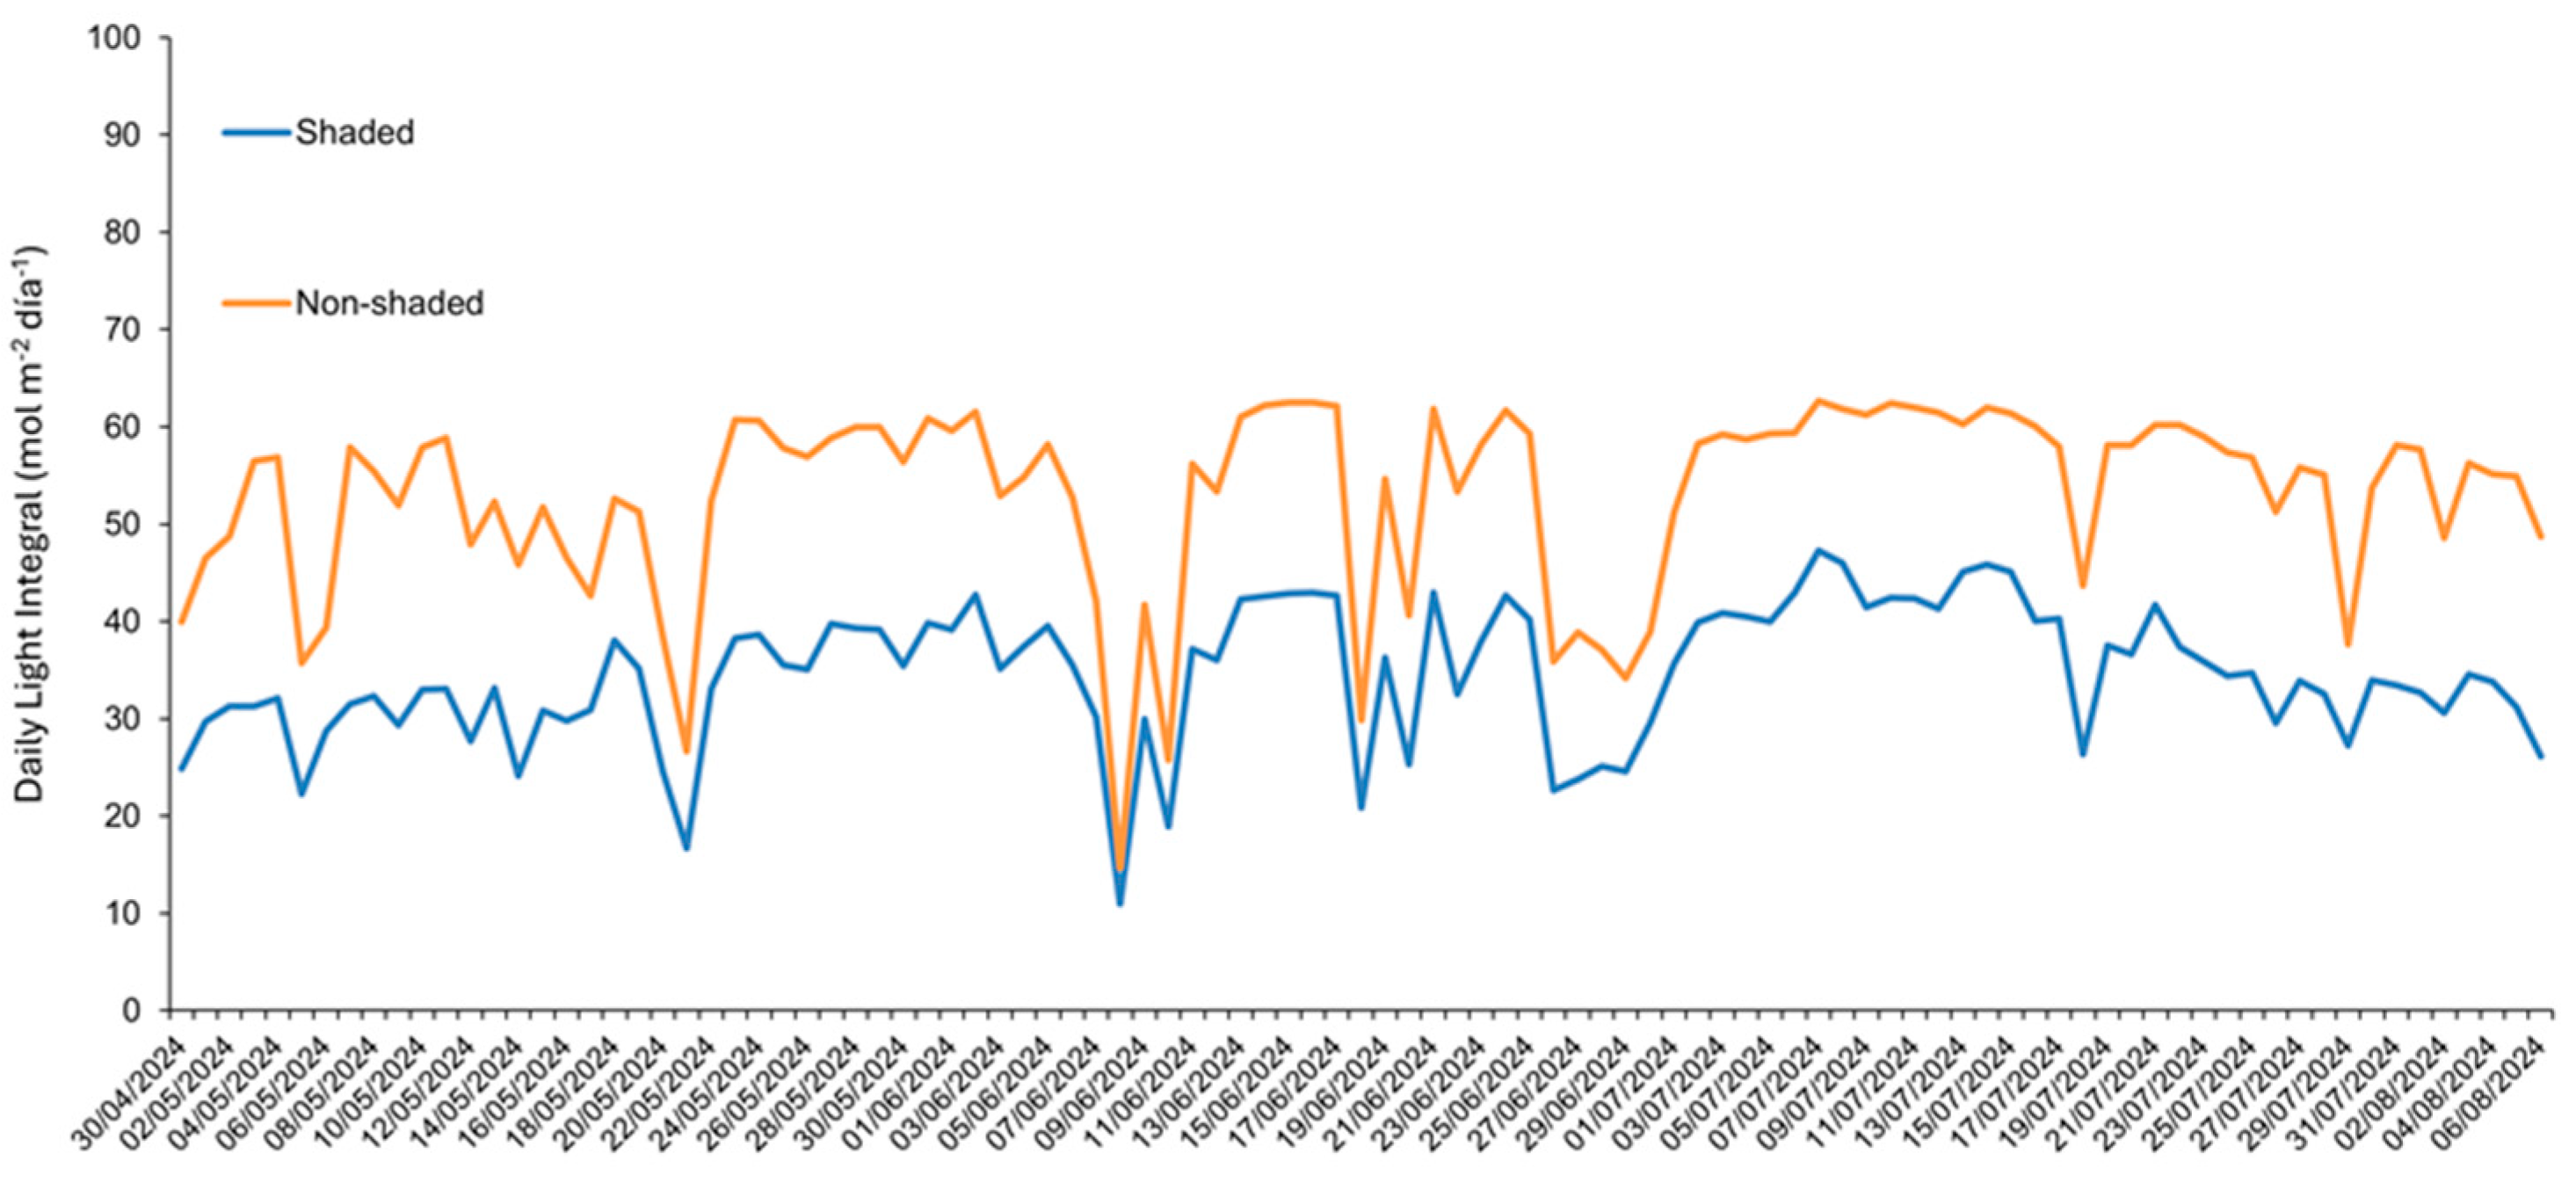
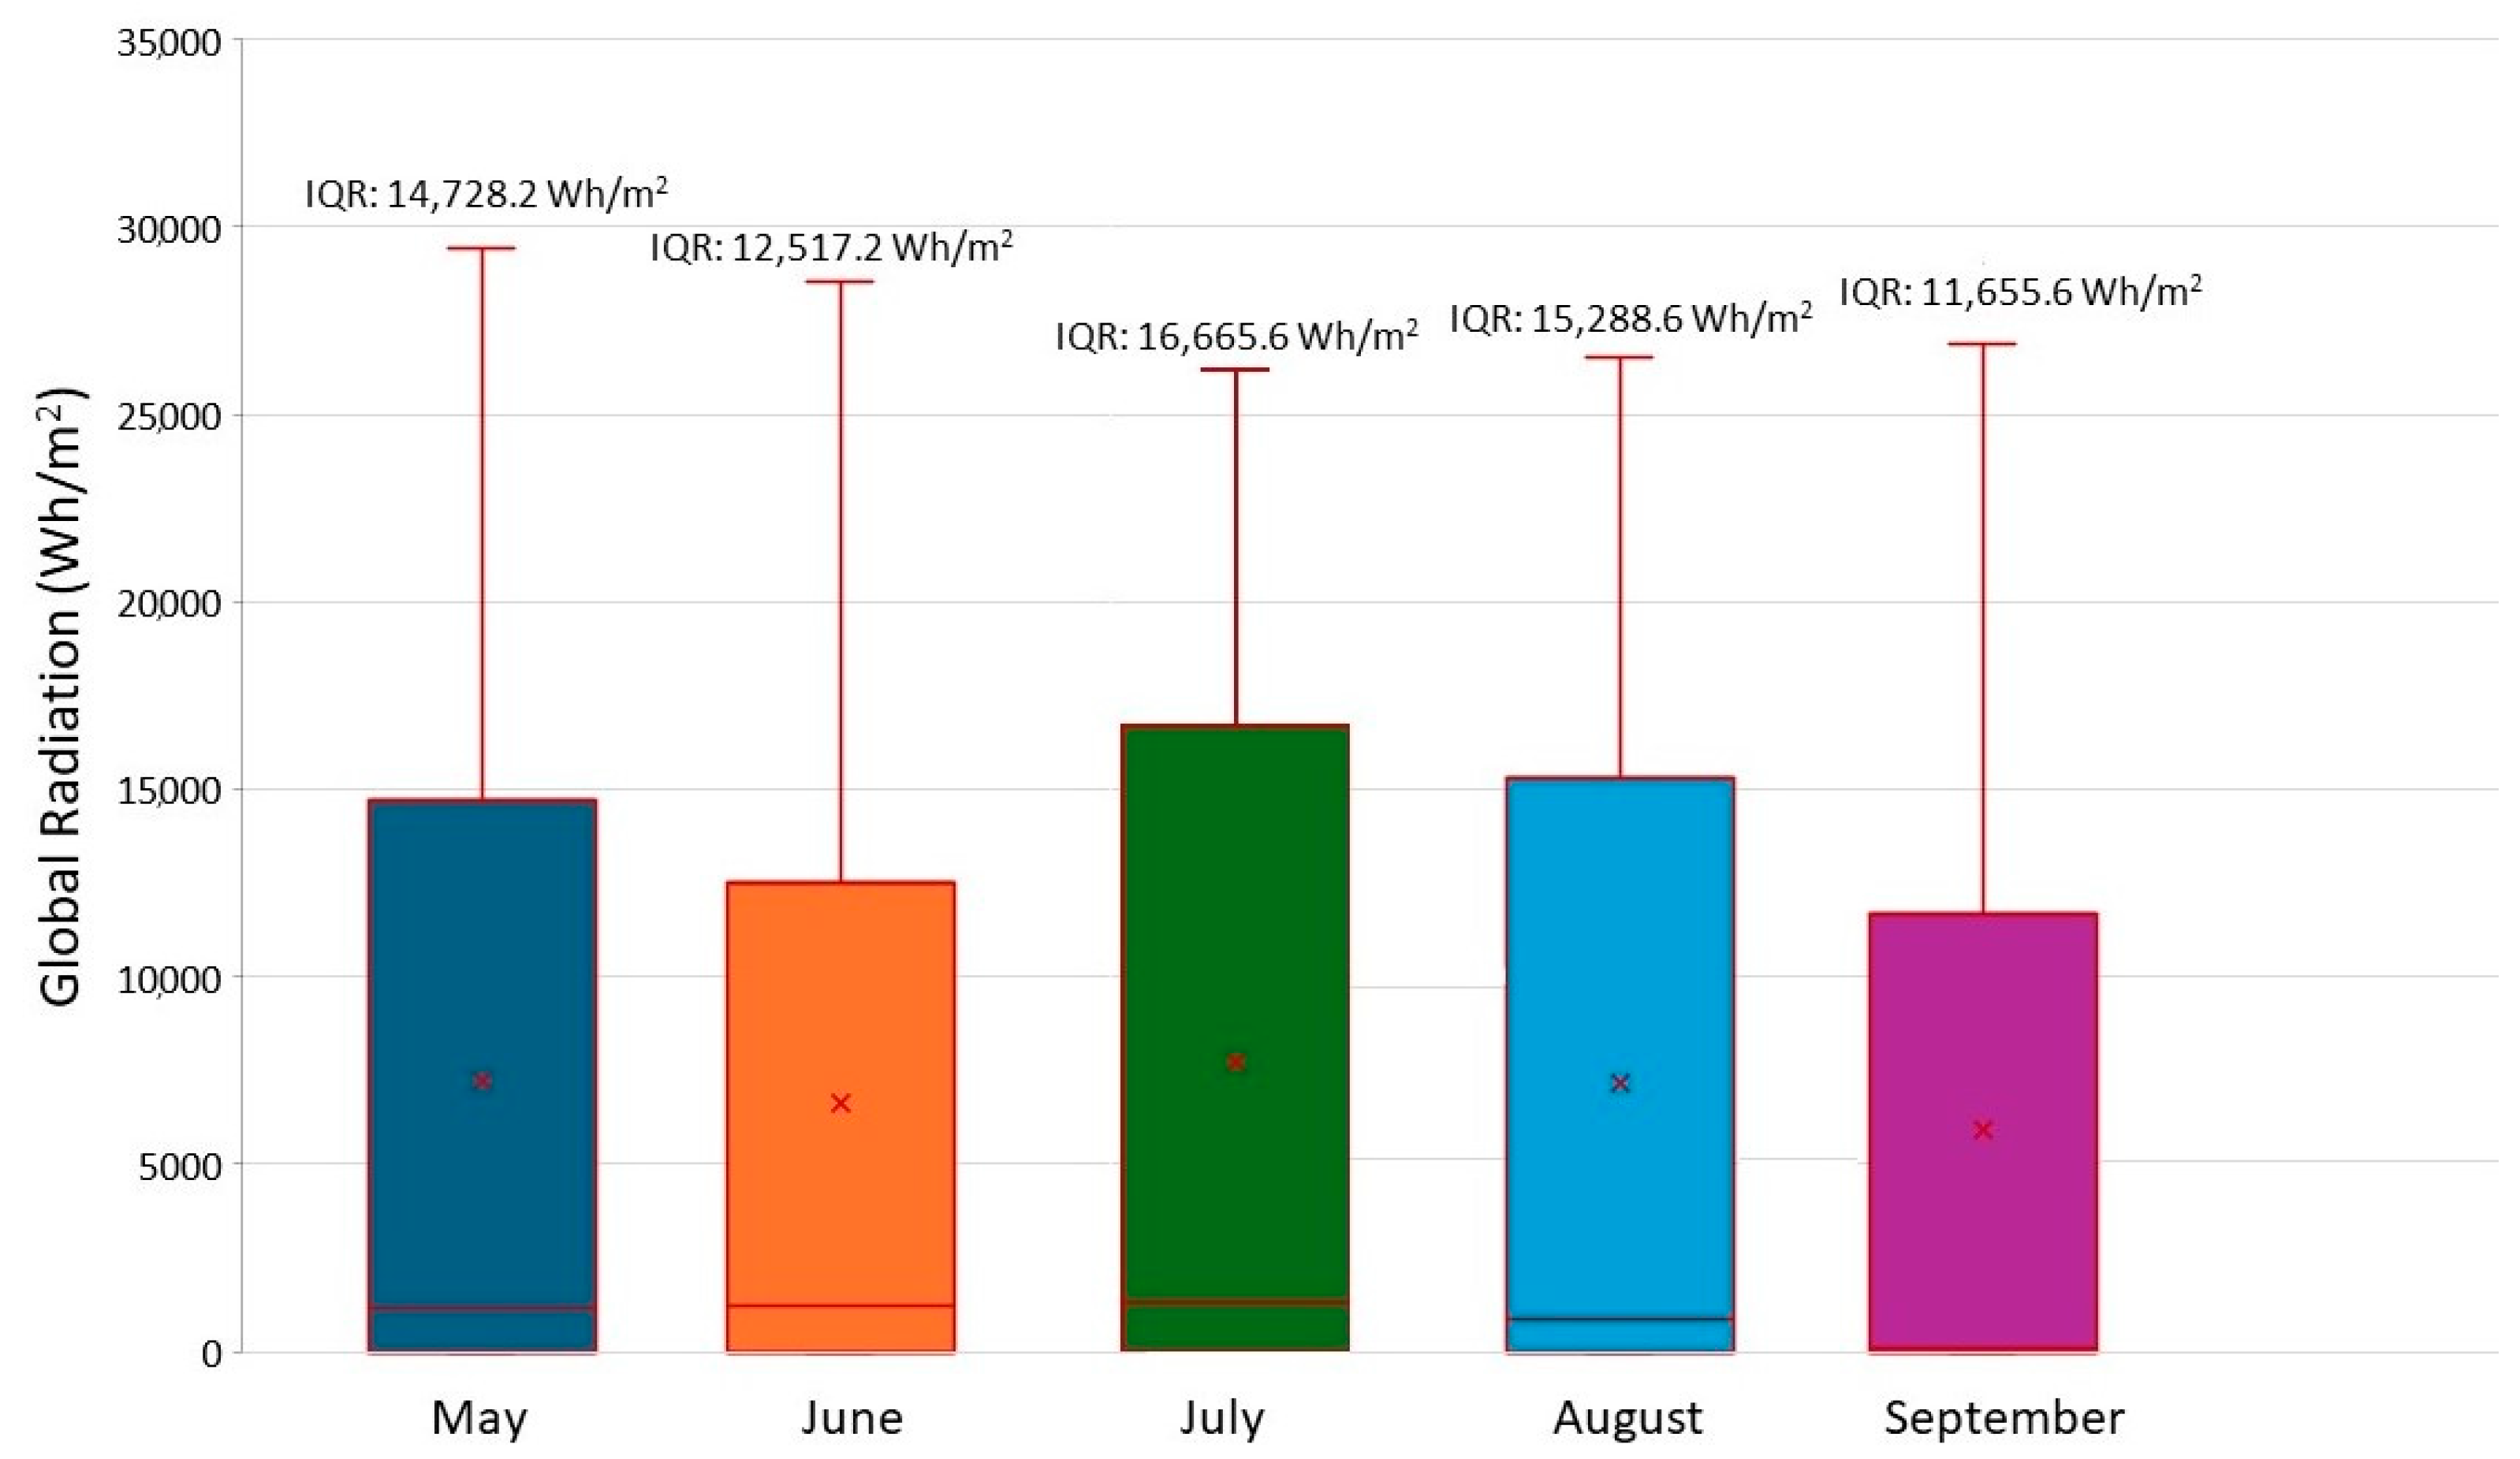
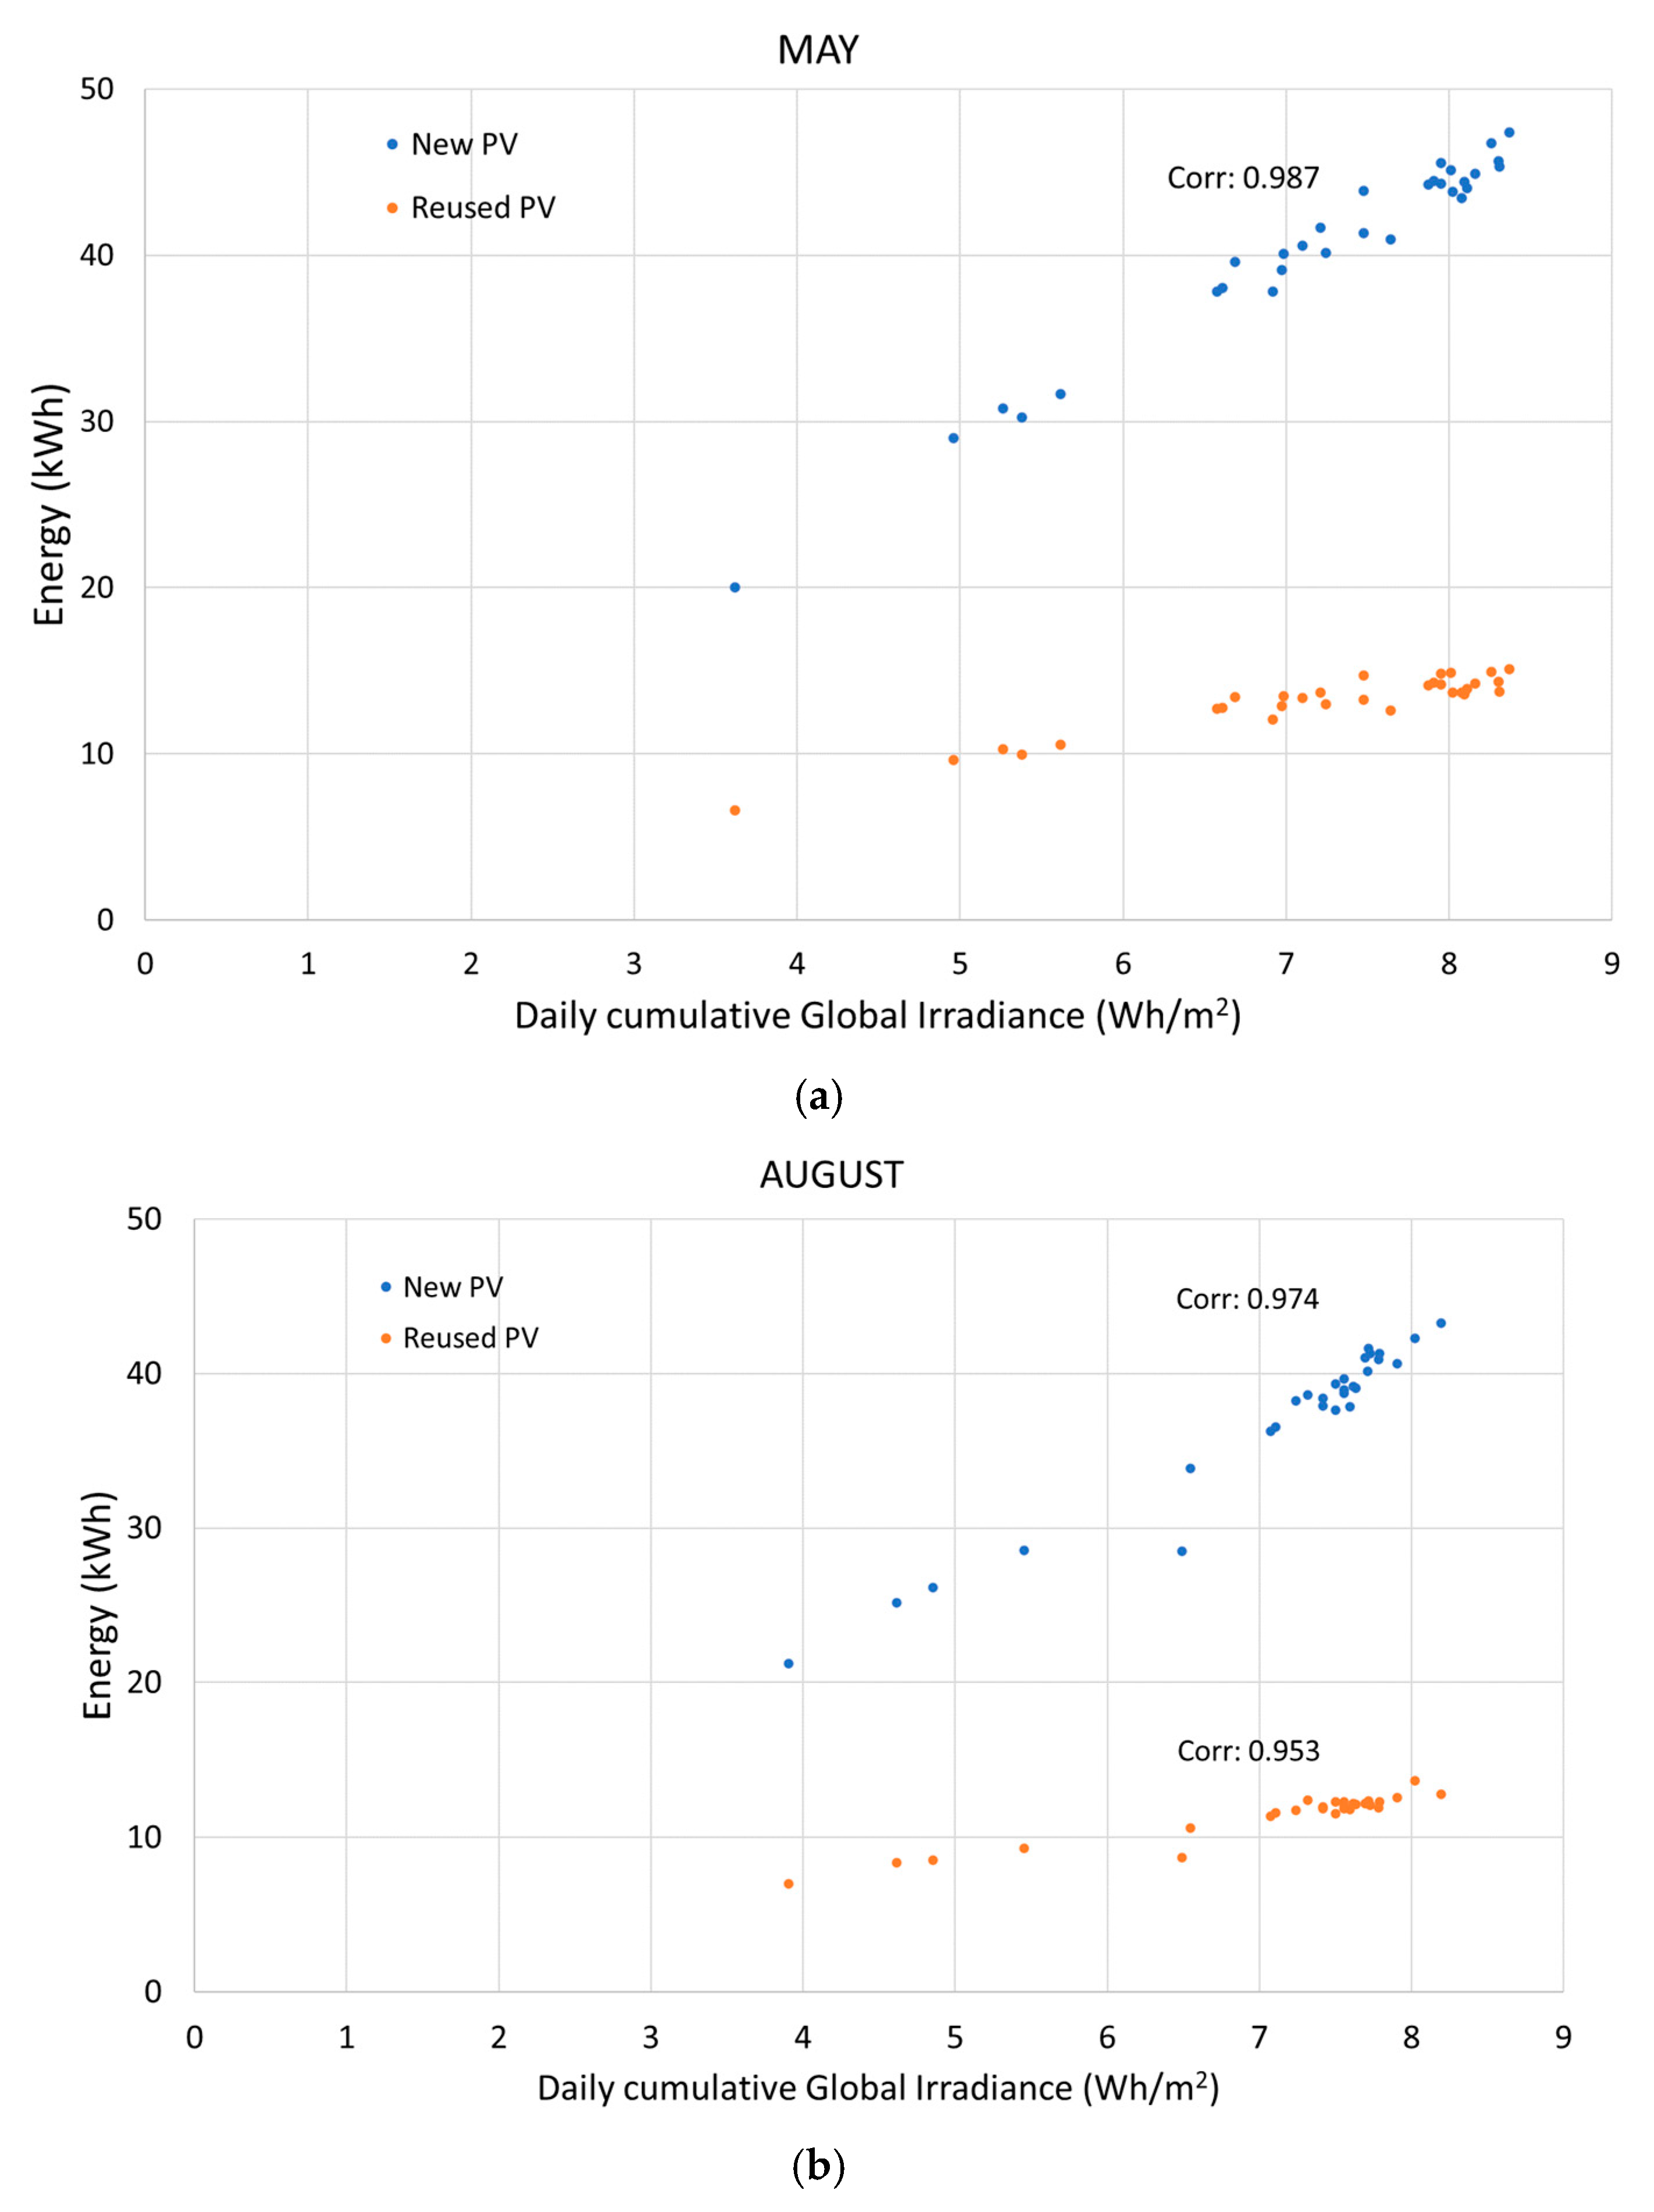
3.2.1. Irradiance and Energy

In order to evaluate the electrical performance of the PV system, it is necessary to monitor both the production of the panels (new and reused) and the climatic variables that affect it. In our case, we measured the global irradiance and PAR radiation data, and in this section, we present the results of the relationship between these variables and the monitored electrical parameters.
The global incident irradiance at the plane of the PV panels was recorded every 15 min for the months of May, June, July, August, and September. The median, interquartile ranges, and outliers are shown in Figure 7. The interquartile range (IQR) is the statistical measure that describes the dispersion of a dataset. It represents the range in which the central 50% of the data lies and is calculated as the difference between the third quartile and the first quartile. This analysis illustrates seasonal variability and irradiance peaks for each month.
The data analysis in Figure 7 reveals significant seasonal variations in solar irradiance, characterized by differences in the mean values, variability, and high irradiance phenomena. Our records show that July has the highest median irradiance, approximately 7680 Wh/m2, reflecting consistently high solar exposure this month, with the highest intensity in the summer of 2024. In contrast, September has the lowest median irradiance, around 6120 Wh/m2, which corresponds to the seasonal transition to autumn, with shorter days and lower solar intensity. Despite this decrease, September has a maximum radiation value of 26,856 Wh/m2, indicating periods of high solar input under non-shaded conditions. The seasonal variations in irradiance values observed in Figure 7 are primarily influenced by changes in solar elevation throughout the year. During summer months (June–July), the sun reaches a higher altitude, resulting in increased direct irradiance on the PV modules. In contrast, during September, the lower solar elevation leads to a reduction in the total incident radiation. This variation is consistent with the expected seasonal shift in the solar angle and daylight duration, impacting the overall energy generation potential of the system. Regarding the variability of the irradiance records, June shows a moderate average irradiance of around 6816 Wh/m2, with a relatively large IQR, highlighting the variability of daily irradiance levels. The maximum irradiance reaches 28536 Wh/m2, indicating occasional high peaks. Similarly, August, with an average irradiance of 7152 Wh/m2, shows greater variability with a wider IQR than that obtained for July. The records also show outliers, suggesting intermittent high irradiance events, possibly caused by atmospheric conditions of scattered clouds.
This trend in irradiance values translates into the power generated by the PV panels and, therefore, the energy fed into the grid by each inverter. Figure 8 below shows the ratio of energy generated per month by the new and reused panels for each of the three inverters.
In Figure 7, it is possible to see that the irradiance IQR in June is slightly higher than that observed in September. However, Figure 8 shows that the energy generated in June is 24% lower compared to September for all inverters. The values in Figure 8 were obtained by computing the monthly accumulated measured energy (kWh) ratio to the theoretical cumulative peak energy (kWhp). For new panels, the nominal output from the factory was used, and for reused panels, the output from curve IV measured in the solar simulator was used. This discrepancy is due to the absence of electricity generation data during June due to plant maintenance periods. In contrast, during the remaining months, July and August, there is a more direct correlation between irradiance and the corresponding energy production variables.
Subsequently, the correlations between the energy generated by the new and reused panels and the daily cumulative global irradiance per month were evaluated. the results for May and August are presented in Figure 9, while for the rest of the months they are included in Appendix A.
Throughout the analysis period (May to September), the relationship between the irradiance and energy output exhibited a generally strong and stable correlation, with June being the notable exception.
In May, correlation coefficients were high, with values of 0.987 for new PV panels and 0.943 for reused ones, reflecting a robust relationship under favorable late-spring conditions. These results highlight the effective response of both panel types to consistent irradiance levels.
However, in June, there was a noticeable decrease in the correlation coefficients, attributed to external events affecting the plant’s normal operation, leading to a significant reduction in energy generation. These disruptions also resulted in a lower number of data points in the energy vs. irradiance graphs, which impacted the calculated correlation coefficients. As summer progressed into July, the correlation coefficients increased significantly (Figure A1 in Appendix A). New PV panels demonstrated a maximum performance level of 0.947, while reused panels also exhibited an enhancement, with coefficients reaching approximately 0.927. These outcomes are indicative of the stabilizing effect of peak summer conditions, which were characterized by higher and more consistent irradiance levels. However, the performance disparity between new and reused panels became more pronounced, as the new panels consistently achieved higher correlations.
In August, late-summer conditions brought greater atmospheric variability, including increased cloud cover and fluctuations in solar intensity, causing a slight decline in correlation coefficients compared to July. New panels exhibited values around 0.974, while reused panels showed slightly lower coefficients of 0.953. Despite this decline, the relationship between irradiance and energy output remained strong, underscoring the panels’ resilience to moderately intense conditions.
By September, climatic conditions had stabilized considerably, resulting in the highest correlation coefficients observed during the entire period. Both new and reused panels demonstrated good relationships with cumulative irradiance. New panels achieved coefficients of 0.987, while reused panels closely followed with values of 0.993 (Figure A1 in Appendix A). These results highlight the importance of well-distributed and stable irradiance during early autumn, which minimized performance differences between the panel types. Under these optimal conditions, reused panels almost matched the performance of new ones.
These correlations illustrate the seasonal variability of the PV system’s response to irradiance; however, they do not account for other significant variables, such as atmospheric temperature or the operational temperature of the PV modules. As a result, these correlations represent only a partial relationship between irradiance and power output. To gain a deeper insight into the system’s performance, Figure 10 presents an analysis of the plant’s performance ratio (PR), evaluating both new and reused panels.

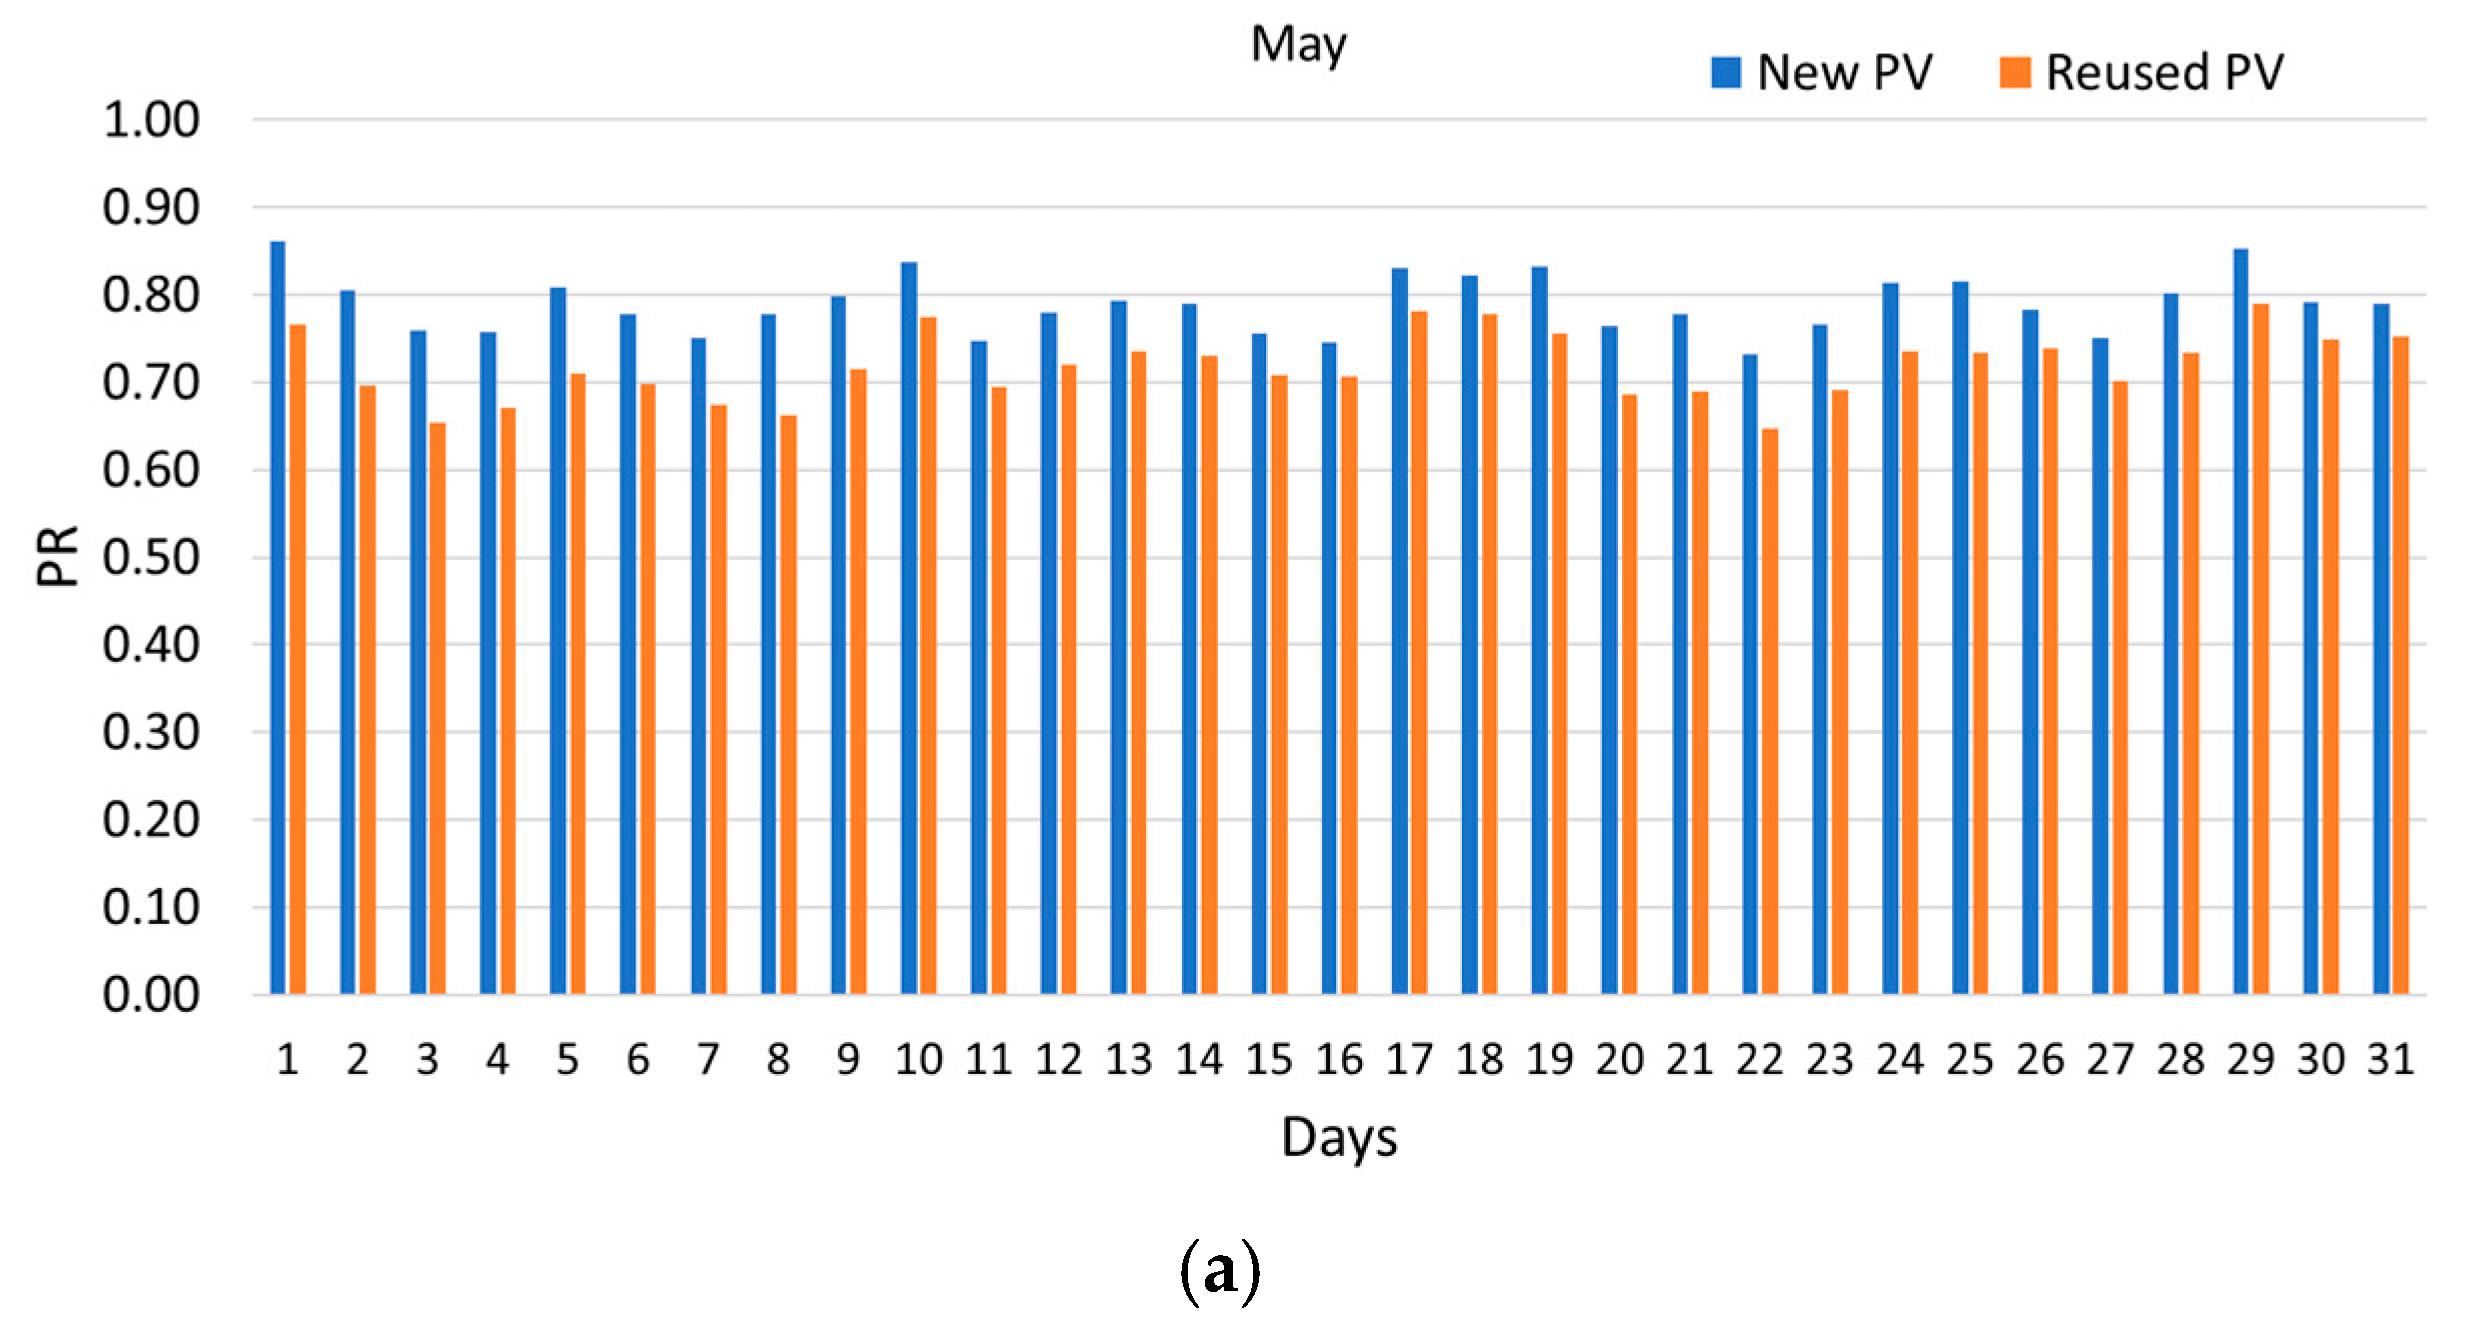
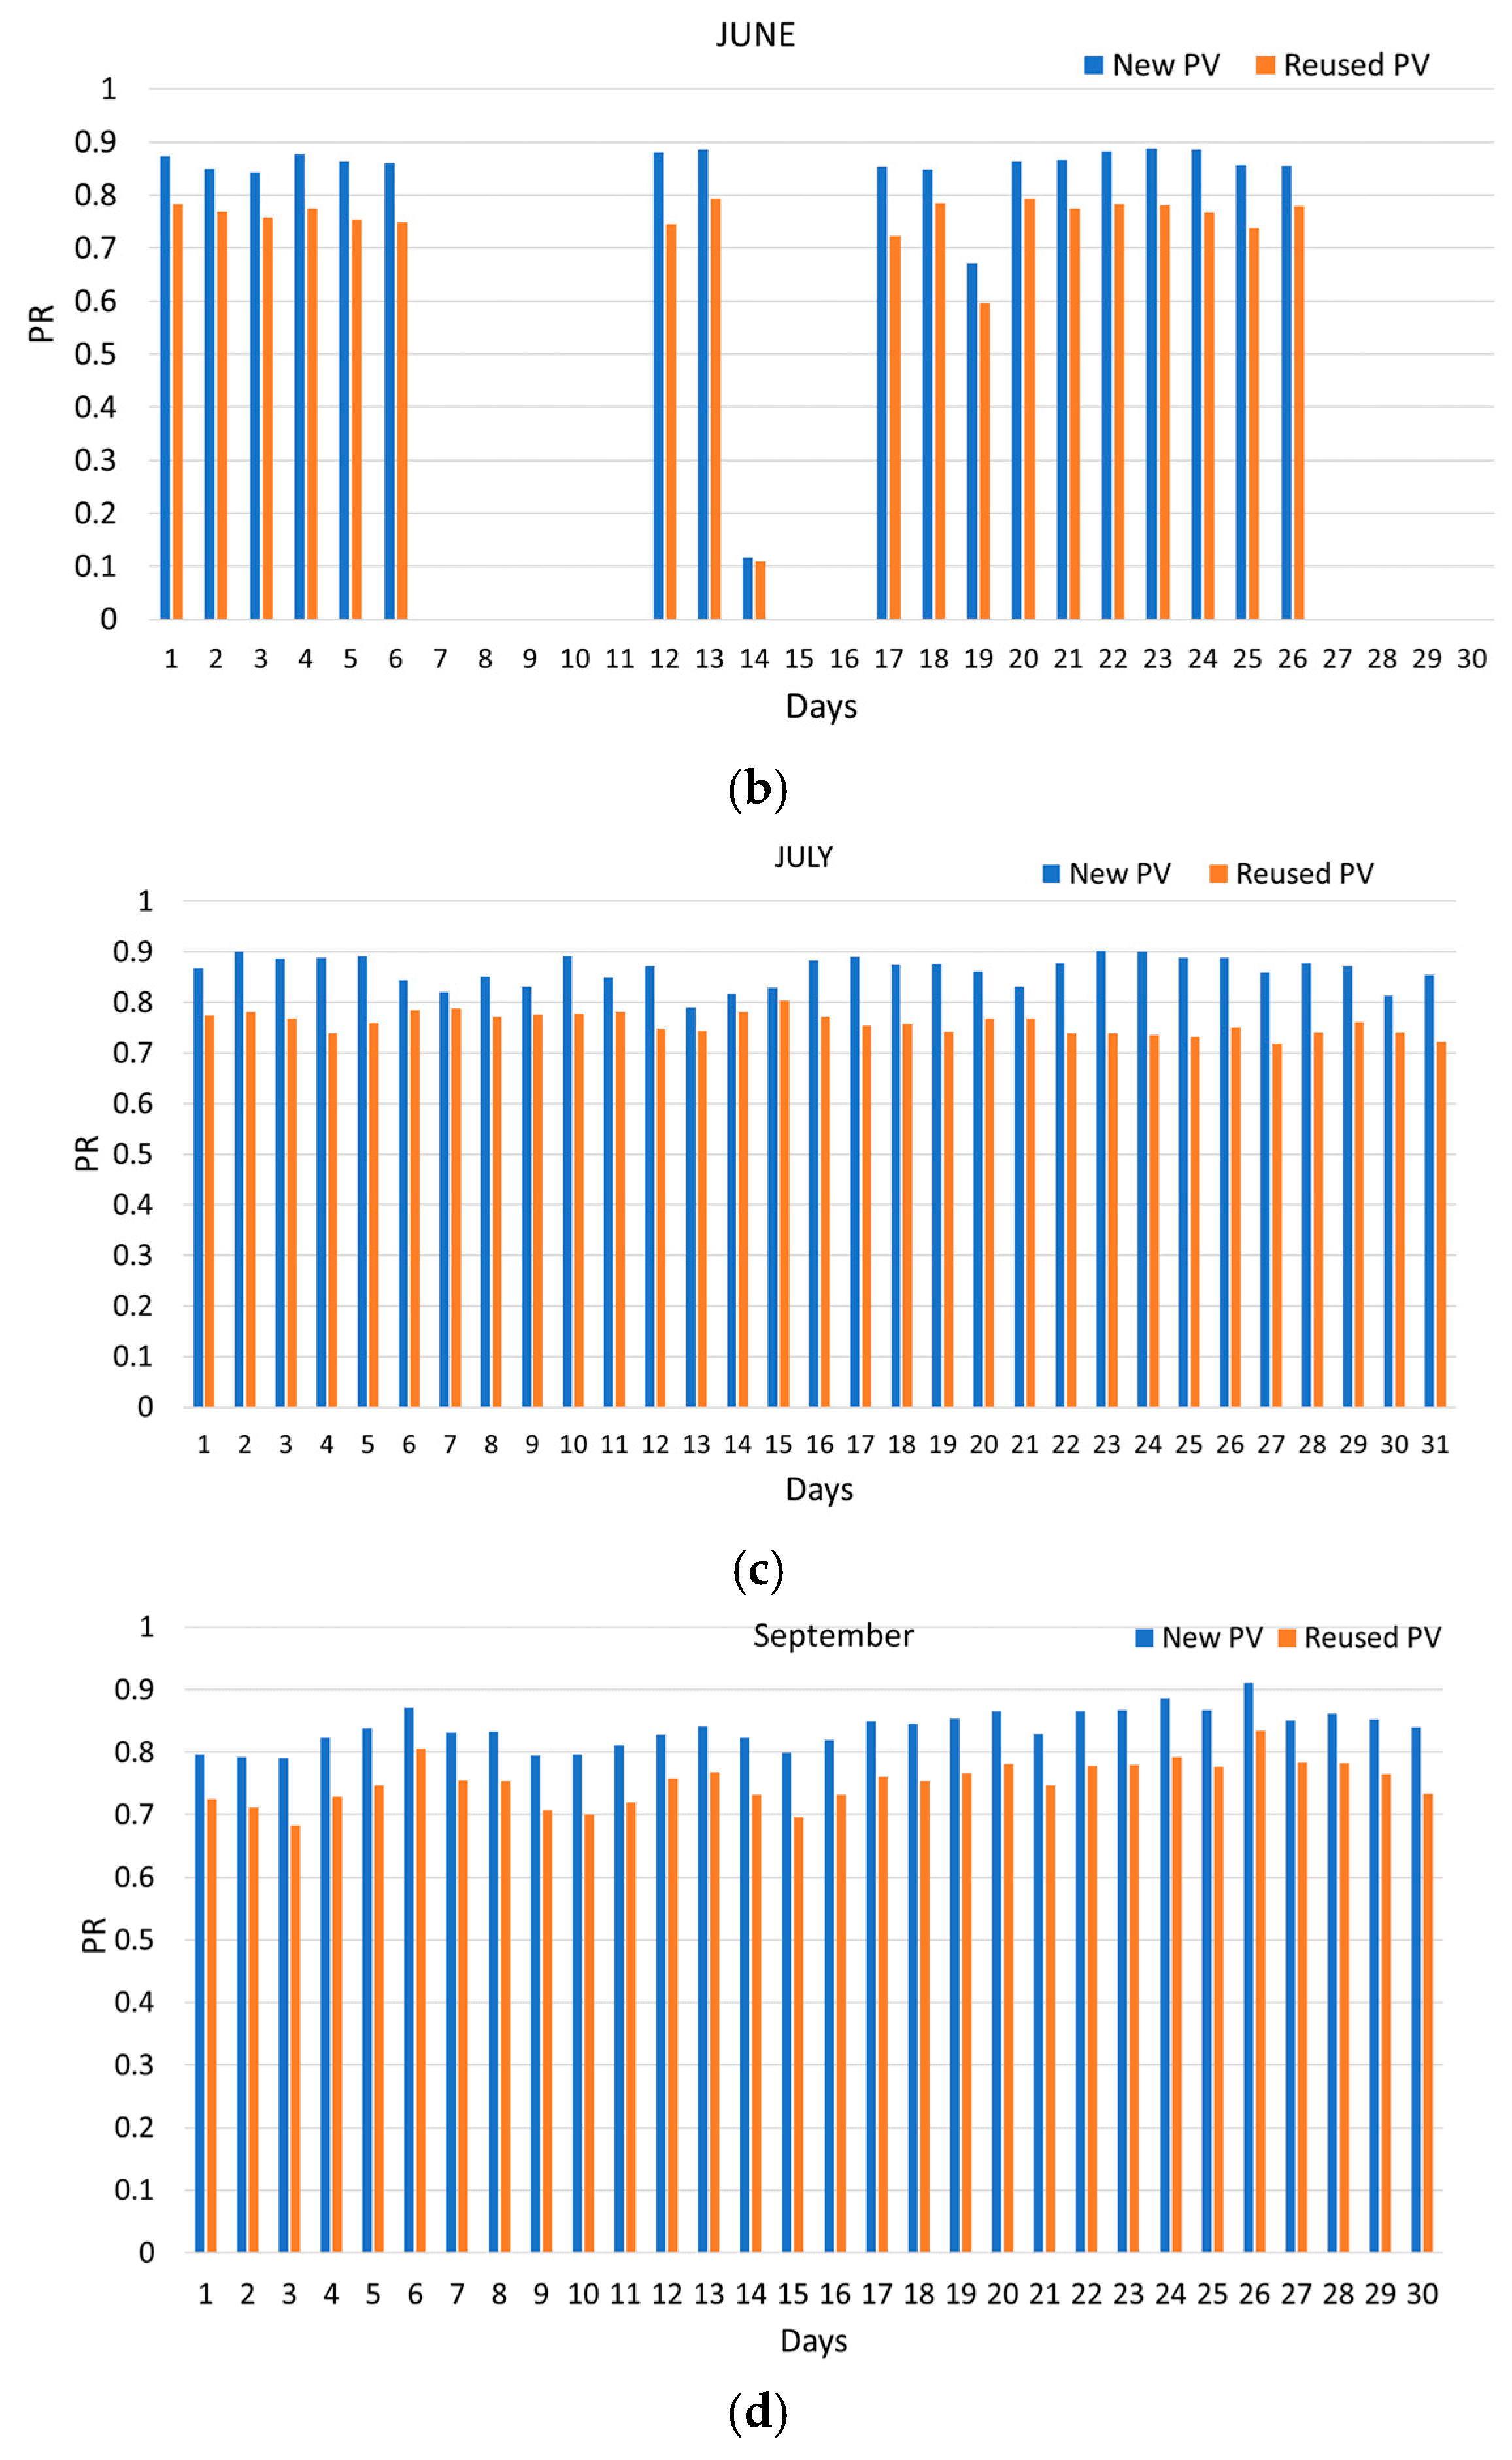
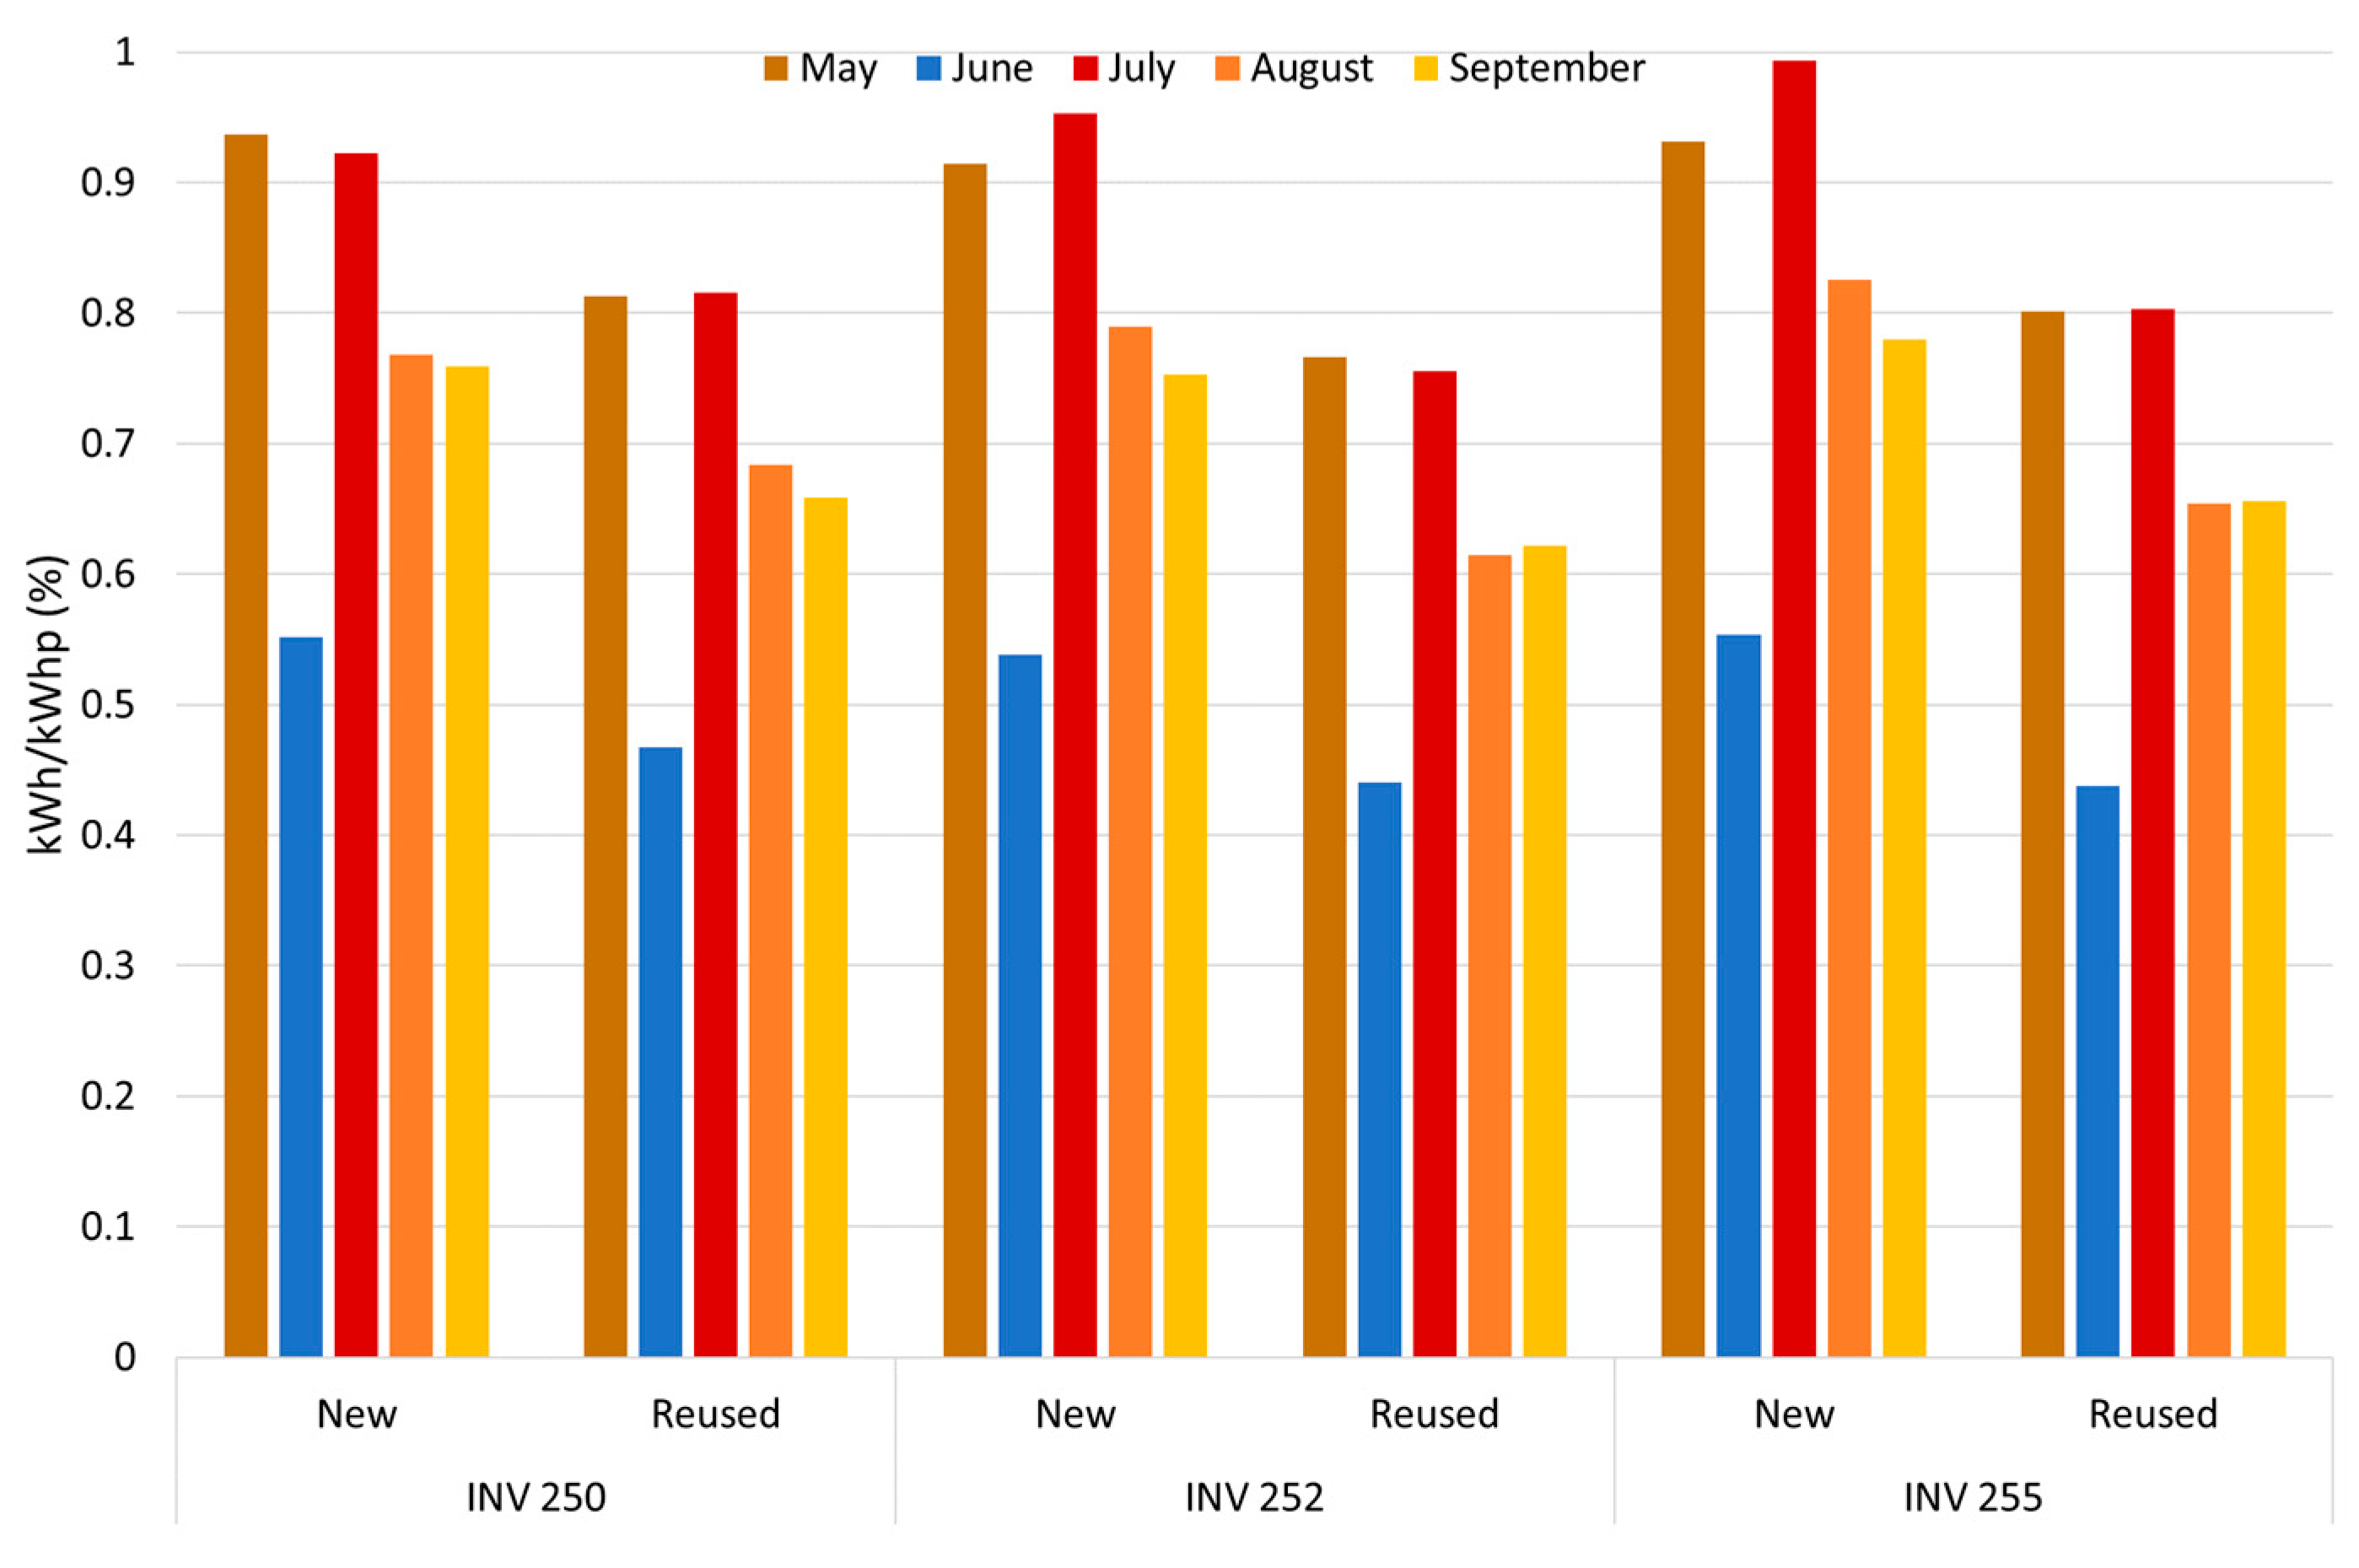
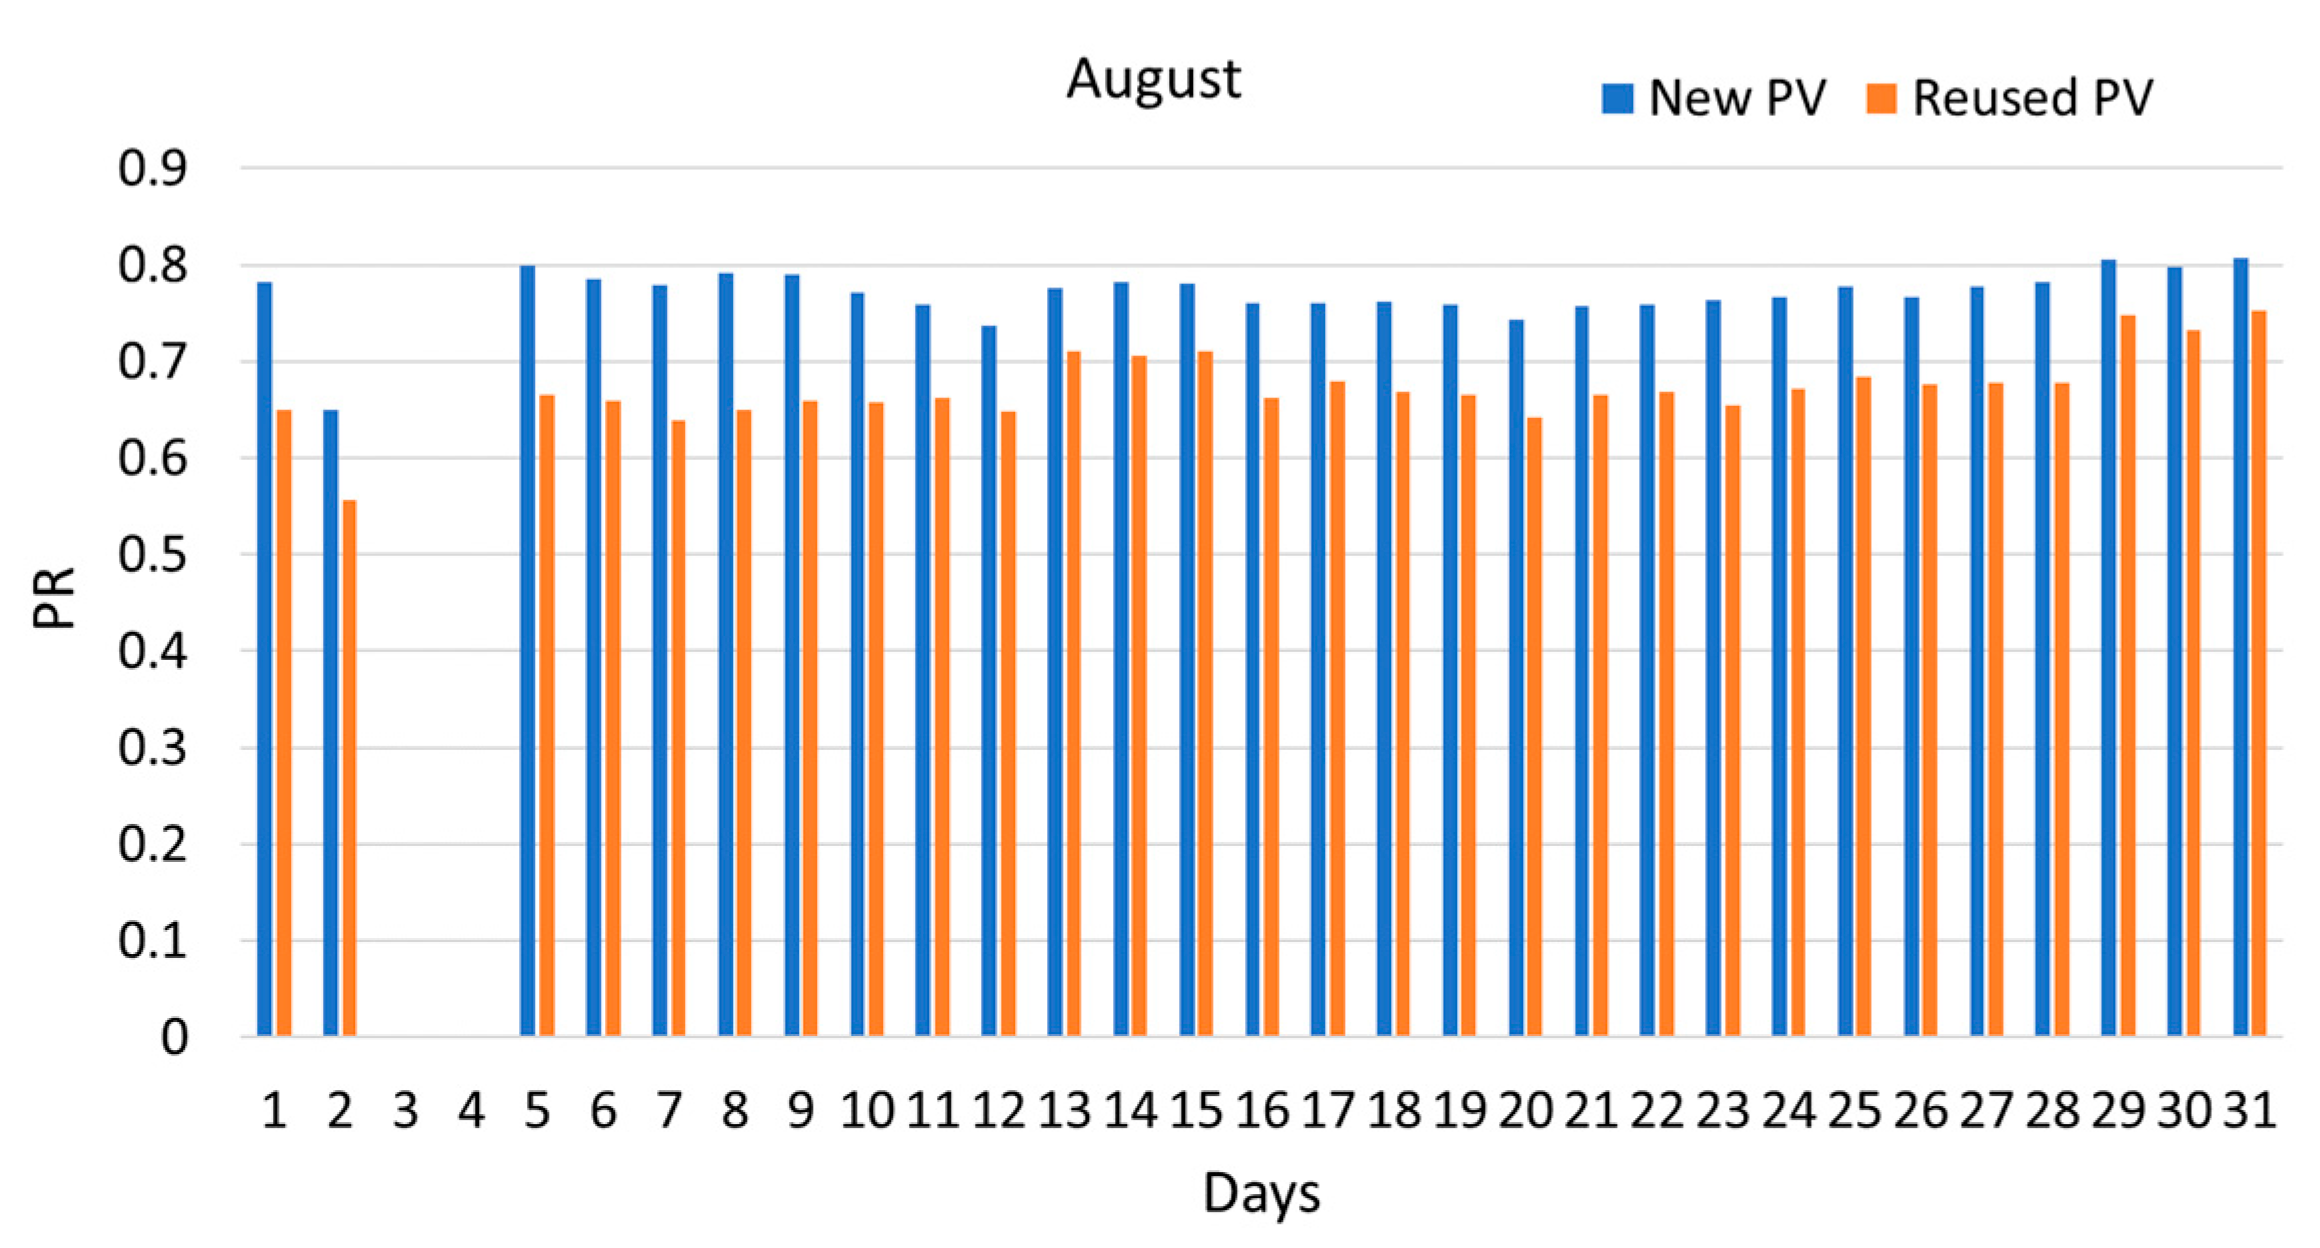
3.2.2. Performance Ratio (PR)

The performance ratio is determined in accordance with the IEC 61724 standard, which defines PR as the ratio of the system’s final yield (Yf) to its reference yield (Yr), providing a measure of the overall impact of system losses. In the case of monofacial systems, it is specified as:
P R = Y f Y r = E o u t / P 0   H i / G i , r e f
where Eout is the output energy in kWh and P0 the nominal power in kWp. Hi is the irradiation, that is, irradiance integrated over a specified time interval in kWh/m2, and Gi is the in-plane irradiance, also known as the plane-of-array (POA) irradiance in W/m2.
For the new PV panels, the PR was calculated using their nominal power as the reference. In contrast, for the reused panels, the PR was determined based on their expected nominal power after 12 years of degradation, assuming a degradation rate of 0.5% per year, as specified by the manufacturer’s data.
Analyzing Figure 10, we observe a consistent performance advantage of new PV modules over reused PV modules across all the studied months. Figure 10 shows the PR in August, and the remaining months are presented in Figure A2 in Appendix A. While the PR of new modules is consistently higher, the reused modules demonstrate a stable and predictable performance, maintaining a relatively constant gap between the two types. In May, the PR remains high and uniform for both module types, with minimal daily fluctuations. However, June shows notable PR drops on specific days, caused by operational issues. By July, the PR stabilizes, resembling the consistent behavior observed in May. In August and September, the PR exhibits a more homogeneous pattern. However, a slight decline is noticeable in September, potentially linked to seasonal factors such as reduced irradiance or higher temperatures affecting system efficiency.
Overall, the reused modules demonstrate operational viability despite their slightly lower performance compared to new modules. Seasonal trends indicate a gradual decline in the PR toward the end of the period, suggesting external environmental influences. These observations underscore the stability of reused PV modules and their potential for sustainable energy applications, particularly when performance predictability is crucial. These findings are supported by the study carried out by Muñoz [33], which analyzes performance in Si-m PV modules and other technologies in a PV facility located near our agrivoltaic plant in the ETSIAAB. In that study, Muñoz concludes that the energy produced and the performance ratio are still good even after more than 10 years of operation.
In Figure 11, we observe the average evolution of the PR over the period studied. In August, when the recorded temperatures were the highest, both types of panels experienced a similar reduction in PR. This is to be expected, as the photovoltaic system was operating without crops underneath the panels, and the higher temperatures reached by them led to a noticeable decrease in efficiency [34]. The difference in the PR between May and June is that the system was not operational on some days of June due to maintenance, making June unsuitable for a direct comparison. For July, there is a slight increase in the PR compared to May, which can be attributed to higher power generation due to increased irradiance. It should be noted that the reused panels are more sensitive to changes in irradiance and temperature than the new panels. By analyzing the evolution of the performance ratio (PR) over the months studied, it can be seen that reused panels have, on average, a 12.3% lower PR compared to new photovoltaic panels.

3.2.3. Infrared Thermography Inspection

Infrared thermography (IR) images were periodically recorded throughout the testing period during the months when optimal climatic conditions were present, specifically when the irradiance levels exceeded a stable 800 W/m2, and there was no wind. Images were taken for all the pergolas, covering both new and reused panels. The IR technique captures near-infrared electromagnetic radiation emitted from objects with temperatures above absolute zero in the wavelength range of 8–12 μm. In the photovoltaic modules, the incident radiation is converted into electricity and heat; by altering the current flow conditions, temperature changes due to irradiance fluctuations can be registered, creating distinctive cell temperature patterns that provide precise insights into potential failures. This allowed us to track any potential degradation caused by environmental factors, such as temperature fluctuations, humidity, or wind exposure. The results of the thermographic analysis confirmed that no additional damage was observed in the reused modules after installation, reinforcing the reliability of their integration into the AGV system. IR thermographies images of the new and reused panels are shown in Appendix A.

3.2.4. Reused Panels’ Operational Characteristics

The reuse of photovoltaic (PV) modules in agrivoltaic systems represents a promising strategy to extend their lifespan and promote circular economy principles. By preventing premature disposal, reuse reduces PV waste while maintaining energy generation capacity. Studies show that many decommissioned modules retain 70–85% of their original power output, making them viable for second-life applications [35] This approach optimizes resource efficiency, reducing the demand for new raw materials and lowering the carbon footprint associated with module manufacturing and disposal.
Although failure mechanisms have been documented in aged PV modules, these findings do not necessarily apply only to repaired modules. In practice, monitoring reused modules does not require significantly higher maintenance efforts compared to conventional ones. Low-cost diagnostic techniques, such as infrared thermography, allow for early fault detection, ensuring a reliable performance without additional operational burdens. Furthermore, agrivoltaic environments benefit from lower operating temperatures due to crop evapotranspiration, which helps mitigate potential efficiency losses and enhances module longevity.
From an economic perspective, reusing PV modules reduces initial investment costs, offering a financially viable alternative to new installations. Additionally, the development of a second-life PV market fosters new opportunities in refurbishment, resale, and decentralized solar applications. By extending module lifespans, reuse supports sustainable energy deployment, minimizes environmental impact, and reinforces the long-term viability of solar technologies without compromising the system’s performance [36].

4. Conclusions

This study demonstrates the significant potential of agrivoltaic systems as an innovative solution to optimize land use by integrating energy generation with agricultural production. The findings highlight several key outcomes that underscore the advantages of this dual-use approach, including the effective addressing of challenges related to land use conflicts and resource efficiency.
The reduction in PAR did not cause a decrease in yield. Additionally, no significant reduction in water consumption was observed in the agrivoltaic system. These results emphasize the capacity of agrivoltaic systems to balance agricultural productivity with energy sustainability by optimizing both quantity and quality in food production.
This study also confirms the operational viability of reused PV modules within the agrivoltaic system. Despite the slightly lower performance compared to new panels, the reused modules displayed strong and consistent correlations between irradiance and energy output, with coefficients consistently exceeding 0.93 during peak irradiance months and reaching up to 0.993 in September. Performance ratio (PR) analysis further revealed the stable and predictable behavior of reused modules, with efficiency losses remaining within acceptable margins. These findings affirm the potential of repurposed PV panels for sustainable applications, particularly in scenarios with moderate energy demands, such as agrivoltaics.
Furthermore, the integration of reused PV panels within agrivoltaic systems contributes substantially to circular economy principles by extending the lifespan of solar panels, reducing the need for new raw materials, and minimizing environmental impacts associated with waste generation. By reusing partially repaired modules, the approach addresses growing concerns about electronic waste and resource scarcity, while maintaining sufficient energy production levels.
Consequently, the integration of agrivoltaic systems with reused PV modules is poised to play a pivotal role in driving the sustainable energy transition and offering effective solutions to pressing global challenges related to food security and land use efficiency. These findings emphasize the critical role of agrivoltaics in maximizing socioeconomic and environmental benefits, positioning this technology as a vital component in the context of a sustainable energy future.

Author Contributions

Conceptualization, M.d.C.A.-G., M.-Á.M.-G. and D.P.L.; methodology, M.d.C.A.-G. and D.P.L.; validation, M.-Á.M.-G. and M.d.C.A.-G.; formal analysis, M.-B.N.-M., F.G.R. and C.B.-B.; investigation, D.P.L., C.B.-B. and M.-B.N.-M.; resources, M.d.C.A.-G. and M.-Á.M.-G.; data curation, M.-B.N.-M., F.G.R., C.B.-B. and D.P.L.; writing—original draft preparation, M.-B.N.-M. and C.B.-B.; writing—review and editing, M.-B.N.-M., F.G.R., M.-Á.M.-G., D.P.L. and M.d.C.A.-G.; visualization, M.-B.N.-M., C.B.-B. and M.d.C.A.-G.; supervision, M.d.C.A.-G. and M.-Á.M.-G.; funding acquisition, M.d.C.A.-G. and D.P.L. All authors have read and agreed to the published version of the manuscript.

Funding

This work is supported by grant PID2020-118417RB-C21, funded by MICIN/AEI/10.13039/501100011033. We acknowledge partial funding through MEDIDA C17.I2G: CIEMAT. Nuevas tecnologías renovables híbridas, Ministerio de Ciencia e Innovación de España, Componente 17 “Reforma Institucional y Fortalecimiento de las Capacidades del Sistema Nacional de Ciencia e Innovación”. Medidas del plan de inversiones y reformas para la recuperación económica funded by the European Union—NextGenerationEU. Additional support for this study was provided by grant PID2021-1227722OB-I00, “Sustainable vegetable production based on Agrivoltaic systems”, funded by Ministerio de Ciencia e Innovación de España MCIN/AEI/10.13039/501100011033 and the Fondo Europeo de Desarollo (FEDER), “ERDF A Way of Making Europe” program.

Data Availability Statement

The data are contained within the article.

Conflicts of Interest

The authors declare no conflicts of interest.

Appendix A

Figure A1. Relationship between daily cumulative global irradiance and energy output for new and reused PV panels for (a) July and (b) September.
Agronomy 15 00730 g0a1
Figure A2. Daily performance ratio (PR) of new and reused PV modules in (a) May, (b) June, (c) July, and (d) September.
Agronomy 15 00730 g0a2aAgronomy 15 00730 g0a2b
Figure A3. IR thermographic images of new PV panels and reused PV panels captured trough different months. All temperatures marked in the figures are medium temperatures. (a) New PV panel in 12 March, (b) reused PV panel in 12 March, (c) reused PV panel in 7 May, and (d) new PV panel in 4 December.
Agronomy 15 00730 g0a3aAgronomy 15 00730 g0a3b

References

  1. Turnley, J.W.; Grant, A.; Schull, V.Z.; Cammarano, D.; Sesmero, J.; Agrawal, R. The viability of photovoltaics on agricultural land: Can PV solve the food vs fuel debate? J. Clean Prod. 2024, 469, 143191. [Google Scholar] [CrossRef]
  2. Al Mamun, M.A.; Dargusch, P.; Wadley, D.; Zulkarnain, N.A.; Aziz, A.A. A Review of Research on Agrivoltaic Systems; Elsevier Ltd.: Amsterdam, The Netherlands, 2022. [Google Scholar] [CrossRef]
  3. Magarelli, A.; Mazzeo, A.; Ferrara, G. Fruit Crop Species with Agrivoltaic Systems: A Critical Review. Agronomy 2024, 14, 722. [Google Scholar] [CrossRef]
  4. Aroca-Delgado, R.; Pérez-Alonso, J.; Callejón-Ferre, Á.J.; Díaz-Pérez, M. Morphology, yield and quality of greenhouse tomato cultivation with flexible photovoltaic rooftop panels (Almería-Spain). Sci. Hortic. 2019, 257, 108768. [Google Scholar] [CrossRef]
  5. La Notte, L.; Giordano, L.; Calabrò, E.; Bedini, R.; Colla, G.; Puglisi, G.; Reale, A. Hybrid and organic photovoltaics for greenhouse applications. Appl. Energy 2020, 278, 115582. [Google Scholar] [CrossRef]
  6. Van de Ven, D.J.; Capellan-Peréz, I.; Arto, I.; Cazcarro, I.; De Castro, C.; Patel, P.; Gonzalez-Eguino, M. The potential land requirements and related land use change emissions of solar energy. Sci. Rep. 2021, 11, 2907. [Google Scholar] [CrossRef]
  7. Magarelli, A.; Mazzeo, A.; Ferrara, G. Exploring the Grape Agrivoltaic System: Climate Modulation and Vine Benefits in the Puglia Region, Southeastern Italy. Horticulturae 2025, 11, 160. [Google Scholar] [CrossRef]
  8. Dupraz, C.; Marrou, H.; Talbot, G.; Dufour, L.; Nogier, A.; Ferard, Y. Combining solar photovoltaic panels and food crops for optimising land use: Towards new agrivoltaic schemes. Renew. Energy 2011, 36, 2725–2732. [Google Scholar] [CrossRef]
  9. Guan, J.; Sun, J.; Shi, X.; Wei, J. Review of full-spectrum solar energy systems based on spectral splitting technology. Int. J. Hydrogen Energy 2024, 81, 1235–1255. [Google Scholar] [CrossRef]
  10. Bruhwyler, R.; Sánchez, H.; Meza, C.; Lebeau, F.; Brunet, P.; Dabadie, G.; Dittmann, S.; Gottschalg, R.; Negroni, J.J. Vertical agrivoltaics and its potential for electricity production and agricultural water demand: A case study in the area of Chanco, Chile. Sustain. Energy Technol. Assess. 2023, 60, 103425. [Google Scholar] [CrossRef]
  11. Feuerbacher, A.; Herrmann, T.; Neuenfeldt, S.; Laub, M.; Gocht, A. Estimating the economics and adoption potential of agrivoltaics in Germany using a farm-level bottom-up approach. Renew. Sustain. Energy Rev. 2022, 168, 112784. [Google Scholar] [CrossRef]
  12. Ferrara, G.; Boselli, M.; Palasciano, M.; Mazzeo, A. Effect of shading determined by photovoltaic panels installed above the vines on the performance of cv. Corvina (Vitis vinifera L.). Sci. Hortic. 2023, 308, 111595. [Google Scholar] [CrossRef]
  13. Kadowaki, M.; Yano, A.; Ishizu, F.; Tanaka, T.; Noda, S. Effects of greenhouse photovoltaic array shading on Welsh onion growth. Biosyst. Eng. 2012, 111, 290–297. [Google Scholar] [CrossRef]
  14. Amaducci, S.; Yin, X.; Colauzzi, M. Agrivoltaic systems to optimise land use for electric energy production. Appl. Energy 2018, 220, 545–561. [Google Scholar] [CrossRef]
  15. Giri, N.C.; Mohanty, R.C. Design of agrivoltaic system to optimize land use for clean energy-food production: A socio-economic and environmental assessment. Clean Technol. Environ. Policy 2022, 24, 2595–2606. [Google Scholar] [CrossRef]
  16. Marrou, H.; Dufour, L.; Wery, J. How does a shelter of solar panels influence water flows in a soil-crop system? Eur. J. Agron. 2013, 50, 38–51. [Google Scholar] [CrossRef]
  17. Ya’acob, M.E.; Lu, L.; Zulkifli, S.A.; Roslan, N.; Ahmad, W.F.H.W. Agrivoltaic approach in improving soil resistivity in large scale solar farms for energy sustainability. Appl. Energy 2023, 352, 121943. [Google Scholar] [CrossRef]
  18. Xiao, Y.; Zhang, H.; Pan, S.; Wang, Q.; He, J.; Jia, X. An agrivoltaic park enhancing ecological, economic and social benefits on degraded land in Jiangshan, China. In AIP Conference Proceedings; American Institute of Physics Inc.: College Park, MD, USA, 2022. [Google Scholar] [CrossRef]
  19. Rosillo, F.G.; Nieto-Morone, M.B.; Esteva, J.B.; Soriano, F.; Temprano, S.; González, C.; del Carmen Alonso-García, M. Repairing ribbon bus bar interruptions in photovoltaic modules using non-intrusive interruption location. Renew. Energy 2024, 223, 120012. [Google Scholar] [CrossRef]
  20. Nieto-Morone, M.B.; Rosillo, F.G.; Muñoz-García, M.A.; Alonso-García, M.C. Enhancing photovoltaic module sustainability: Defect analysis on partially repaired modules from Spanish PV plants. J. Clean Prod. 2024, 461, 142575. [Google Scholar] [CrossRef]
  21. IEC TS 61215; Crystalline Silicon Terrestrial Photovoltaic Modules—Design Qualification and Type Approval. International Electrotechnical Commission: Geneva, Switzerland, 2005.
  22. Allen, R.G.; Pereira, L.S.; Raes, D.; Smith, M. Crop Evapotranspiration-Guidelines for Computing Crop Water Requirements-FAO Irrigation and Drainage Paper 56; FAO: Rome, Italy, 1998. [Google Scholar]
  23. Bleiholder, H.; Weber, E.; Lancashire, P.; Feller, C.; Buhr, L.; Hees, M. Growth stages of mono- and dicotyledonous plants. BBCH Monogr. 2001, 158, 20180906-074619. [Google Scholar]
  24. Song, J.; Chen, Z.; Zhang, A.; Wang, M.; Jahan, M.S.; Wen, Y.; Liu, X. The Positive Effects of Increased Light Intensity on Growth and Photosynthetic Performance of Tomato Seedlings in Relation to Night Temperature Level. Agronomy 2022, 12, 343. [Google Scholar] [CrossRef]
  25. Kläring, H.-P.; Krumbein, A. The Effect of Constraining the Intensity of Solar Radiation on the Photosynthesis, Growth, Yield and Product Quality of Tomato. J. Agron. Crop. Sci. 2013, 199, 351–359. [Google Scholar] [CrossRef]
  26. Higashide, T. Light interception by tomato plants (Solanum lycopersicum) grown on a sloped field. Agric. For. Meteorol. 2009, 149, 756–762. [Google Scholar] [CrossRef]
  27. Marrou, H.; Wery, J.; Dufour, L.; Dupraz, C. Productivity and radiation use efficiency of lettuces grown in the partial shade of photovoltaic panels. Eur. J. Agron. 2013, 44, 54–66. [Google Scholar] [CrossRef]
  28. Tani, A.; Shiina, S.; Nakashima, K.; Hayashi, M. Improvement in lettuce growth by light diffusion under solar panels. J. Agric. Meteorol. 2014, 70, 139–149. [Google Scholar] [CrossRef]
  29. Barron-Gafford, G.A.; Pavao-Zuckerman, M.A.; Minor, R.L.; Sutter, L.F.; Barnett-Moreno, I.; Blackett, D.T.; Thompson, M.; Dimond, K.; Gerlak, A.K.; Nabhan, G.P.; et al. Agrivoltaics provide mutual benefits across the food–energy–water nexus in drylands. Nat. Sustain. 2019, 2, 848–855. [Google Scholar] [CrossRef]
  30. Schwarz, D.; Thompson, A.J.; Kläring, H.P. Guidelines to use tomato in experiments with a controlled environment. Front. Plant Sci. 2014, 5, 625. [Google Scholar] [CrossRef] [PubMed]
  31. Scarano, A.; Semeraro, T.; Calisi, A.; Aretano, R.; Rotolo, C.; Lenucci, M.S.; Santino, A.; Piro, G.; De Caroli, M. Effects of the Agrivoltaic System on Crop Production: The Case of Tomato (Solanum lycopersicum L.). Appl. Sci. 2024, 14, 3095. [Google Scholar] [CrossRef]
  32. Zhang, H.; Xiong, Y.; Huang, G.; Xu, X.; Huang, Q. Effects of water stress on processing tomatoes yield, quality and water use efficiency with plastic mulched drip irrigation in sandy soil of the Hetao Irrigation District. Agric. Water Manag. 2017, 179, 205–214. [Google Scholar] [CrossRef]
  33. Muñoz-García, M.Á.; Moreda, G.P.; Nieto-Morone, M.B.; Alonso-García, M.C. A real case of thin film PV alternatives to cSi based on a-Si and CdTe. Results after eleven years operating at same conditions. Renew. Energy 2025, 240, 122173. [Google Scholar] [CrossRef]
  34. Daniel-Durandt, F.M.; Rix, A.J. The long-term influence of wind and temperature on performance and degradation within an utility-scale photovoltaic plant. IET Renew. Power Gener. 2024, 19, e13182. [Google Scholar] [CrossRef]
  35. Limmanee, A.; Sitthiphol, N.; Jaroensathainchok, S.; Pluemkamon, R.; Kotesopa, S.; Udomdachanut, N.; Krajangsang, T.; Hongsingthong, A. Preliminary Identification of Functional Decommissioned Solar Photovoltaic Modules from Solar Farms: A case study in Thailand. IOP Conf. Ser. Earth Environ. Sci. Inst. Phys. 2023, 1199, 012002. [Google Scholar] [CrossRef]
  36. Tsanakas, I.J.A.; Oreski, G.; Eder, G.; Gassner, A.; van der Heide, A.; Ariolli, D.M.G.; Hernandez, G.O.; Moser, D.; Wambach, K. Toward Reuse-Ready PV: A Perspective on Recent Advances, Practices, and Future Challenges. Adv. Energy Sustain. Res. 2024, 2400237. [Google Scholar] [CrossRef]
Figure 1. Schematic representation of the PV system structure with an adjustable tilt angle: front and side views.
Agronomy 15 00730 g001
Figure 2. Situation plan of new and reused PV panels in the field. The panels in the range of blue are the new panels, while those represented by the range of greens are the reused panels.
Agronomy 15 00730 g002
Figure 3. Average total production and average red production. Error bars indicate the standard deviation.
Agronomy 15 00730 g003
Figure 4. Comparison of plant dried weight (g/plant) under photovoltaic shading and non-shaded conditions across different plots. Error bars indicate the standard deviation.
Agronomy 15 00730 g004
Figure 5. Daily photosynthetically active radiation (PAR) evolution in non-shaded plots and PV-shaded plots from 30 April to 6 August.
Agronomy 15 00730 g005
Figure 6. (a) Relationship between total production and dry weight with seasonal light integral; (b) commercial production relationship with seasonal light integral under two light conditions: non-shaded and PV-shaded plots.
Agronomy 15 00730 g006
Figure 7. Distribution of global radiation in W/m2 during the months of May, June, July, August, and September.
Agronomy 15 00730 g007
Figure 8. Monthly energy production comparison in kWh/kWhp (%) of new and reused PV panels across three inverters.
Agronomy 15 00730 g008
Figure 9. Relationship between daily cumulative global irradiance and energy output for new and reused PV panels for (a) May and (b) August.
Agronomy 15 00730 g009
Figure 10. Daily performance ratio (PR) of new and reused PV modules in August.
Agronomy 15 00730 g010
Figure 11. Performance ratio evolution from May to September.
Agronomy 15 00730 g011
Table 1. Nominal electrical characteristics of new PV modules under STC, installed at ETSIAAB agrivoltaic facility.
JINERGY PV MODULE—JNMM144-450L
Max. Power at STC [W]450
Max. Power Voltage [V]41.36
Max. Power Current [A]10.89
Open circuit Voltage [V]49.98
Short circuit Current [A]11.50
Module Efficiency [%]20.70
Temperature Coefficient Voltage [%/°C]−0.29
Temperature Coefficient Current [%/°C]0.04
Temperature Coefficient Power [%/°C]−0.35
Table 2. Nominal electrical characteristics of reused PV modules under STC, installed at ETSIAAB agrivoltaic facility.
TOP SOLAR PV MODULE—TSM-160M
Max. Power at STC [W]165
Max. Power Voltage [V]35.00
Max. Power Current [A]4.71
Open circuit Voltage [V]43.70
Short circuit Current [A]5.14
Module Efficiency [%]15.50
Temperature Coefficient Voltage [%/°C]−0.34
Temperature Coefficient Current [%/°C]0.05
Temperature Coefficient Power [%/°C]−0.5
Disclaimer/Publisher’s Note: The statements, opinions and data contained in all publications are solely those of the individual author(s) and contributor(s) and not of MDPI and/or the editor(s). MDPI and/or the editor(s) disclaim responsibility for any injury to people or property resulting from any ideas, methods, instructions or products referred to in the content.

