Article

Optimizing Nitrogen and Phosphorus Fertilizer Application for Wheat Yield on Alkali Soils: Mechanisms and Effects

1
School of Water Conservancy and Transportation, Zhengzhou University, Zhengzhou 450001, China
2
State Key Laboratory of Nutrient Use and Management, Institute of Agricultural Resources and Environment, Shandong Academy of Agricultural Sciences, Jinan 250100, China
3
College of Water Conservancy and Civil Engineering, Shandong Agricultural University, Tai’an 271018, China
4
College of Water Resources and Civil Engineering, China Agricultural University, Beijing 100083, China
5
National Center of Technology Innovation for Comprehensive Utilization of Saline-Alkali Land, Institute of Modern Agriculture on Yellow River Delta of SAAS, Dongying 257091, China
*
Authors to whom correspondence should be addressed.
Agronomy 2025, 15(3), 734; https://doi.org/10.3390/agronomy15030734
Submission received: 7 February 2025 / Revised: 12 March 2025 / Accepted: 17 March 2025 / Published: 18 March 2025
(This article belongs to the Section Soil and Plant Nutrition)

Abstract

:
Enhancing crop productivity on alkali soils is essential for food security; however, excessive fertilizer use can lead to soil salinization. Wheat, as a key staple crop, requires an appropriate nitrogen-to-phosphorus fertilization ratio to optimize its yield, yet the ideal ratio remains unclear. In this study, alongside the application of potassium and organic fertilizers, we investigated varying nitrogen application rates (100 kg/ha, 180 kg/ha) and phosphorus application rates (40 kg/ha, 80 kg/ha, 120 kg/ha). The results revealed that, under consistent nitrogen application conditions, when phosphorus application increased from 40 kg/ha to 80 kg/ha and 120 kg/ha, average yield increased by 13.6–25.1% and 0.1–12.6%, respectively. In contrast, under the same phosphorus application conditions, increasing nitrogen application from 100 kg/ha to 180 kg/ha resulted in a 2.6–17.6% increase in average yield. Among the factors considered, biomass emerged as the most significant determinant of yield (Standardized Path Coefficient (SPC) = 0.84), with key influences on biomass including soil alkali-hydrolyzable nitrogen, phosphorus uptake, and potassium uptake. The optimal fertilization strategy for wheat production on alkali soils was found to be 180 kg/ha of nitrogen and 80 kg/ha of phosphorus. These findings provide a theoretical foundation for optimizing fertilizer management in wheat cultivation on alkali soils.

1. Introduction

Based on the 2022 Global Food Crisis Report, the intensity of the global food crisis has reached unprecedented levels [1]. Enhancing crop productivity on alkaline soils has emerged as a critical strategy for ensuring global food security. However, excessive fertilizer use can lead to soil salinization, which poses a significant threat to agricultural productivity. Over 1 billion hectares of alkaline soils is found across more than 100 countries worldwide [2,3], offering substantial potential for development and utilization [3,4]. Wheat, one of the most important staple crops grown on alkaline soils, often faces yield limitations due to the unique challenges posed by such soils [5,6]. The Yellow River Delta (YRD) in China exemplifies coastal alkaline land, where alkaline conditions present significant challenges for crop production [7,8]. Therefore, improving wheat yields on alkaline soils is seen as a promising solution to mitigate the global food crisis.
The balanced application of nitrogen and phosphorus is considered a key and manageable measure to increase wheat yield [9,10]. Nitrogen (N), a vital macronutrient, supports crop growth and development, enhancing both yield and quality in wheat [11]. N-deficient wheat plants exhibit stunted growth and chlorosis, particularly in older leaves [12]. Additionally, it plays a key role in physiological mechanisms that help crops withstand environmental challenges like salt stress [13]. Phosphorus (P), likewise, is essential for crop growth, but its uptake by roots is often hindered in alkaline soils due to competition with other ions, limiting its availability [14,15]. Symptoms of phosphorus deficiency include stunted growth and delayed development, which are common indicators in crops like wheat [16]. Therefore, phosphorus supplementation is necessary, but excessive long-term phosphorus application reduces crop yield [17,18]. Moreover, nitrogen and phosphorus fertilizers interact, with nitrogen enhancing phosphorus uptake and utilization in plants. However, an excess of phosphorus can inhibit nitrogen uptake [19]. The application of both nitrogen and phosphorus fertilizers also affects the crop’s ability to absorb potassium fertilizers [20]. In alkaline soils, nitrogen application can improve phosphorus availability by enhancing soil structure and mobilizing phosphorus [20]. However, excessive phosphorus can form insoluble compounds, reducing phosphorus availability and affecting nutrient uptake efficiency, which influences crop growth and yield. In summary, most research currently centers on the effects of nitrogen and phosphorus fertilizers on crop yield across varying soil types. However, few studies specifically examine the combined impact of nitrogen and phosphorus on wheat yield, soil nutrient dynamics, and plant nutrient uptake in alkaline soils. Even fewer studies focus on identifying the optimal nitrogen and phosphorus application rates tailored to alkaline soil conditions.
This study centers on wheat cultivation in coastal alkali areas, examining how various nitrogen and phosphorus application ratios impact wheat yield and the mechanisms influencing it. It is hypothesized that the optimal nitrogen-to-phosphorus ratio will enhance wheat yield by improving nutrient availability in alkali soils, where nutrient uptake is typically limited. The objectives are (1) to assess the impact of different nitrogen and phosphorus application rates on wheat yield, soil nutrient content, and plant nutrient uptake in alkali soils; (2) to identify the key pathways and factors influencing wheat yield under alkali soil conditions; and (3) to determine the optimal nitrogen and phosphorus fertilization rates for maximizing wheat production on alkali soils. The findings will support rational fertilizer practices for wheat in these regions.

2. Materials and Methods

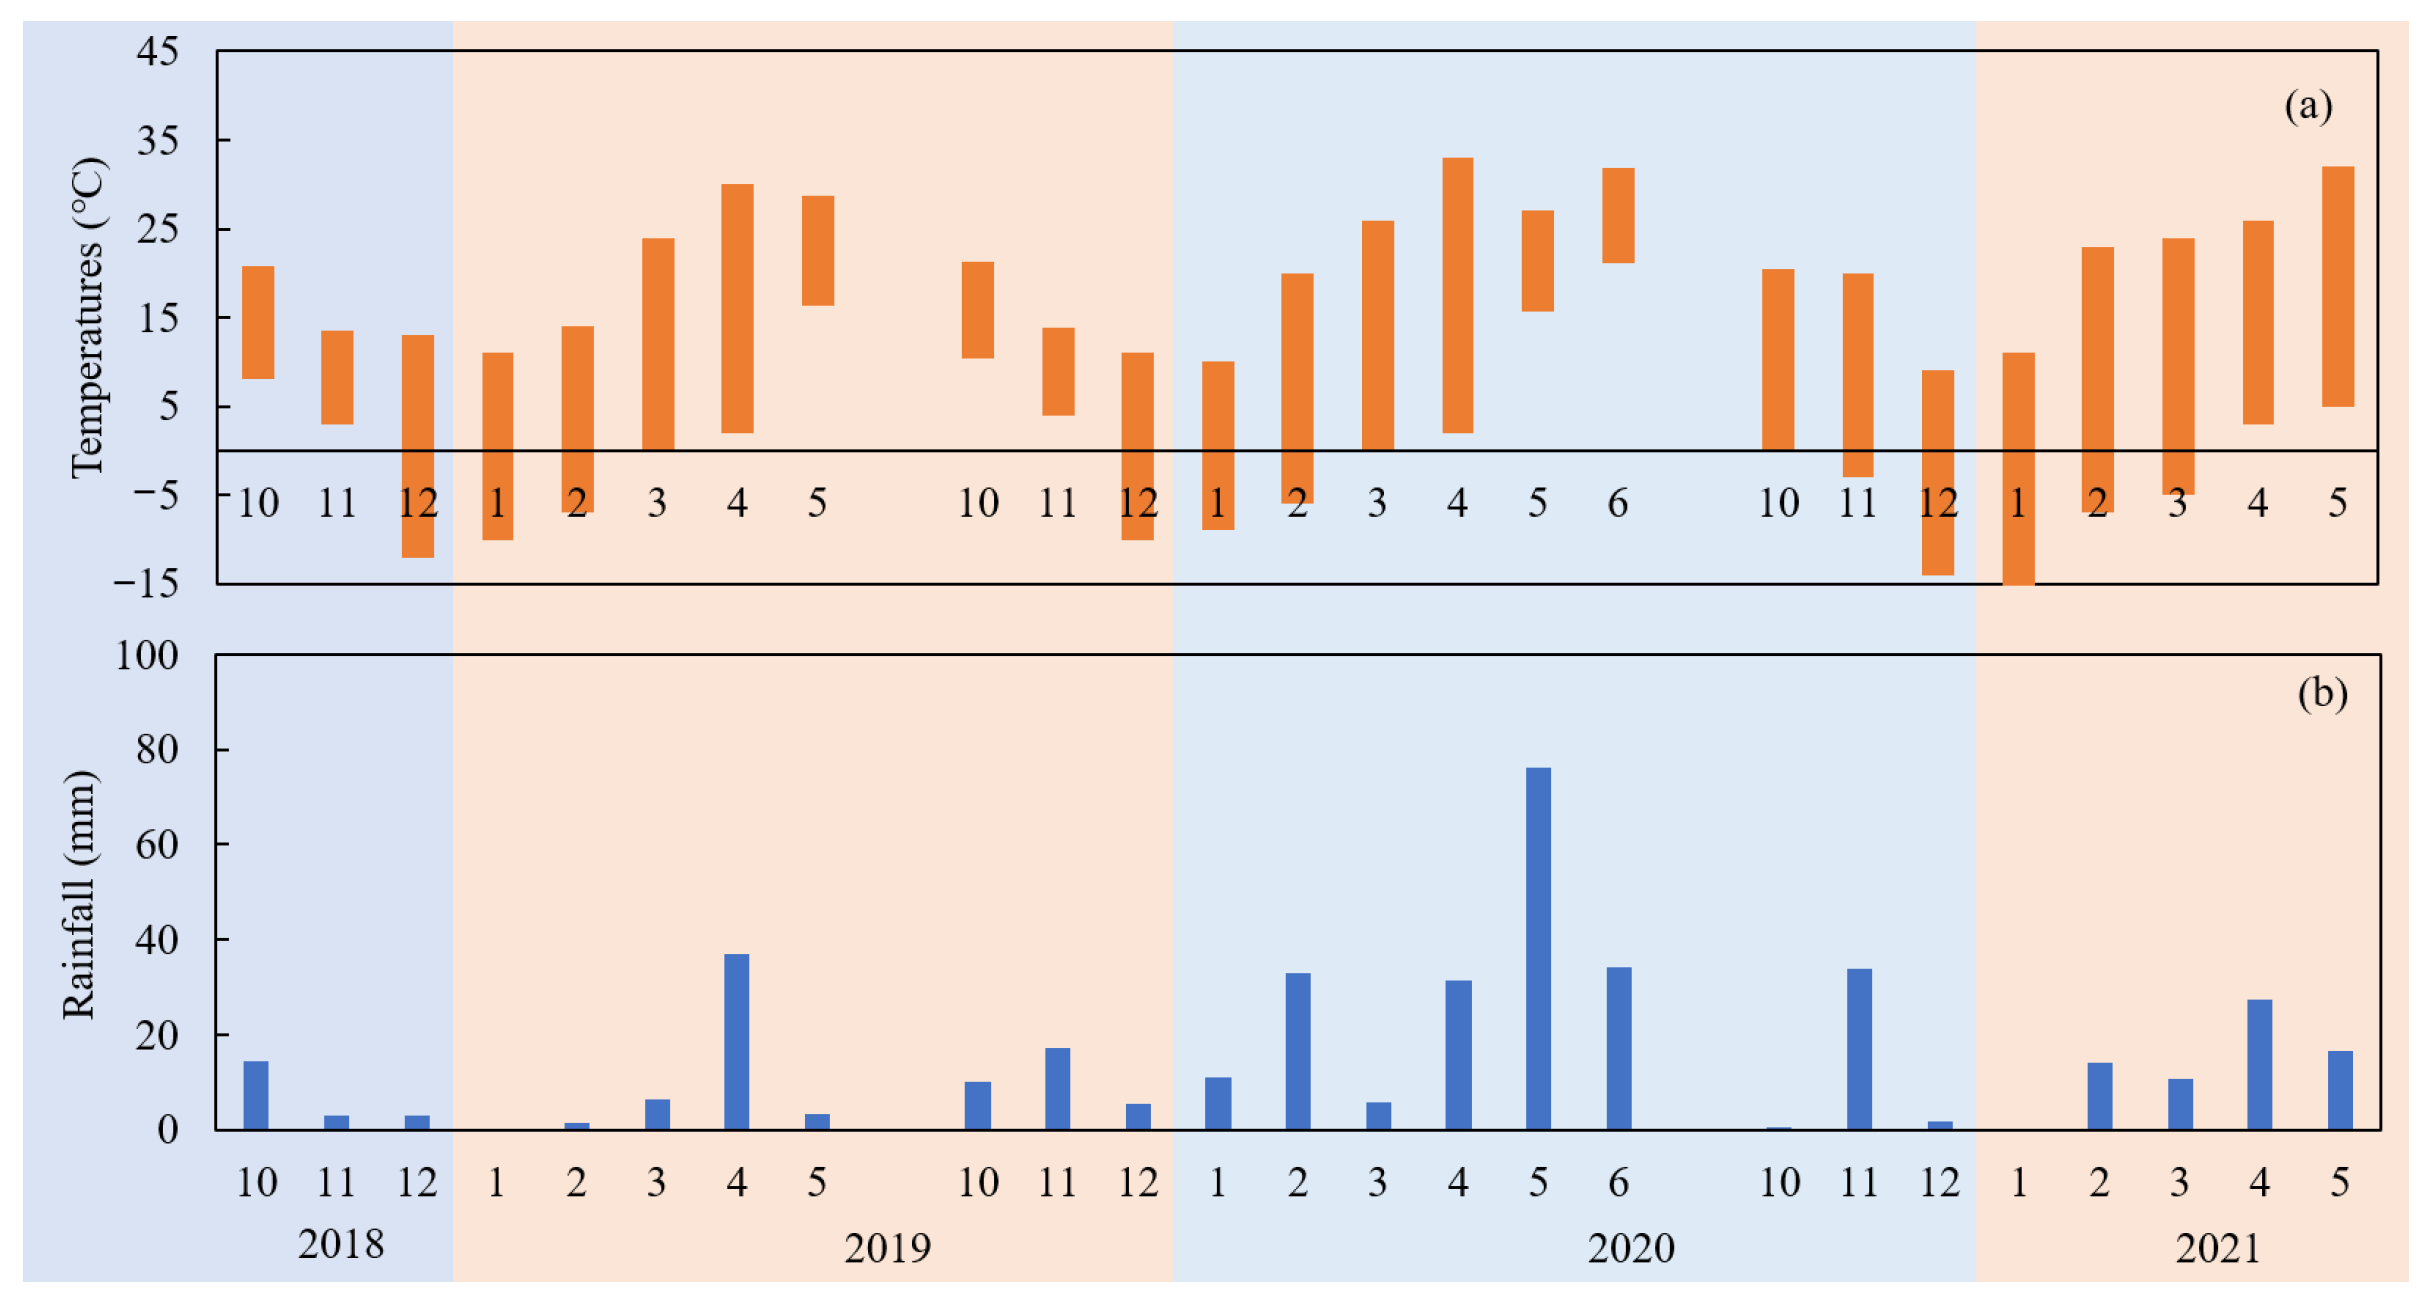
2.1. Site and Experiments

This experiment was conducted at Shuofeng Family Farm in Wudi County, Binzhou (37.77° N, 117.63° E). The wheat variety tested in this study was Jimai 22. The planting dates for winter wheat were 24 October 2018, 29 October 2019 and 25 October 2020, while the harvest dates were 20 May 2019, 1 June 2020 and 28 May 2021. Temperature and rainfall data during the growing season are shown in Figure 1. The fundamental physical and chemical properties of the experimental soil are summarized in Table 1; specifically, Table 1 presents the soil’s conductivity, pH, organic matter, alkaline hydrolyzable nitrogen, available phosphorus, and available potassium at three depths (0–20 cm, 20–40 cm, and 40–60 cm).

2.2. Experimental Design

The crop rotation is spring maize–summer maize, with organic fertilizer applied at 1.4 t/ha before planting winter wheat. Each bag of the fertilizer weighed 40 kg and contained the following nutrient concentrations: 47% organic matter, 3.18% nitrogen (N), 4.06% phosphorus pentoxide (P2O5), and 2.55% potassium oxide (K2O). The nutrient contents of nitrogen, phosphorus, and potassium per hectare were calculated based on the measured concentrations, considering soil depth and bulk density, as well as the fertilizer requirements for winter wheat growth. Nitrogen fertilizer application rates were set at 100 kg/ha and 180 kg/ha, while phosphorus levels were set at 40 kg/ha, 80 kg/ha, and 120 kg/ha. The treatments were as follows: T1: 100 kg/ha–40 kg/ha, T2: 100 kg/ha–80 kg/ha, T3: 100 kg/ha–120 kg/ha, T4: 180 kg/ha–40 kg/ha, T5: 180 kg/ha–80 kg/ha, T6: 180 kg/ha–120 kg/ha. The fertilizers used were urea (46% N) for nitrogen, superphosphate (46% P2O5) for phosphorus. Nitrogen fertilizer was applied in a split application, with 50% applied as basal fertilizer and 50% applied as topdressing. Phosphorus and potassium fertilizers were applied entirely as basal fertilizers. The irrigation method used in this experiment was furrow irrigation. The timing and frequency of irrigation were determined based on the soil moisture content. Irrigation was carried out when the soil moisture reached 65% of its saturation capacity. The irrigation water volume and frequency were consistent across all treatments. Each treatment was replicated three times, with each plot having an area of 40 m2. The experiment was set up using a randomized complete block design (RCBD). At wheat harvest, biomass was measured from a 0.42 m2 area (0.6 m × 3 rows), alongside observations of plant height, grains per spike, and thousand-grain weight. Yield data were collected from a 4.2 m2 section (9 rows × 2.0 m) in each plot. Nutrient contents, specifically nitrogen, phosphorus, and potassium, were analyzed in various wheat parts.
The testing method for soil electrical conductivity (EC) involves taking a soil sample, mixing it with deionized water at a 1:1 ratio, stirring thoroughly, and allowing it to settle for 30 min. The conductivity is then measured using a conductivity meter (Thermo Fisher, Waltham, MA, USA). The testing method for soil pH involves taking a soil sample, mixing it with deionized water at a 1:1 ratio, and stirring thoroughly, and the pH is subsequently measured using a pH meter (Mettler Toledo, Switzerland, Zurich). The determination of soil organic matter was carried out using the potassium dichromate volumetric method [20]. The determination of soil alkaline hydrolyzable nitrogen was conducted using the alkaline dissolution diffusion method [21]. The determination of soil available phosphorus was performed using the sodium bicarbonate extraction molybdenum-antimony colorimetric method [15]. The determination of soil available potassium was carried out using the ammonium acetate extraction flame photometric method. The determination of nitrogen in plants was achieved using the Kjeldahl method [22]. The determination of phosphorus in plants was performed using the vanadomolybdate yellow colorimetric method [22]. The determination of potassium in plants was carried out using the flame photometric method [22]. Nutrient uptake is calculated by multiplying the nutrient concentration in the plant tissue (usually expressed in mg/g) by the total dry weight of the corresponding plant parts (grains or straw). The following indicators can be derived: grain phosphorus uptake (GPU); grain potassium uptake (GKU); straw nitrogen uptake (SNU); straw phosphorus uptake (SPU); straw potassium uptake (SKU).

2.3. Data Analysis

Following Ma et al. [15], the nitrogen physiological efficiency (NPE), phosphorus physiological efficiency (PPE), and potassium (KPE) physiological efficiency (KPE) were calculated using Equations (1)–(3):
NPE = GY GNU + SNU
PPE = GY GPU + SPU
KPE = GY GKU + SKU
where GY is grain yield, kg; GNU: grain nitrogen uptake, kg/ha; GPU: grain phosphorus uptake, kg/ha; GKU: grain potassium uptake, kg/ha; SNU: straw nitrogen uptake, kg/ha; SPU: straw phosphorus uptake, kg/ha; SKU: straw potassium uptake, kg/ha.

2.4. Statistical Analysis

Statistical analyses were conducted using SPSS (version 20.0, New York, NY, USA). Significant differences between mean values were assessed using paired t-tests, with Dunnett’s test applied at significance levels of p < 0.05 and p < 0.01. Based on the statistical analysis results, only the main factors, namely year and fertilization, had an impact on the parameters studied. No interactions between factors were found. Therefore, the effect of fertilization was similar across years; we analyzed the results by calculating the average values of different fertilization treatments across the three growth stages. Additionally, structural equation modeling (SEM) was used to assess the correlation between yield and soil and wheat nutritional parameters [22].

3. Results and Analysis

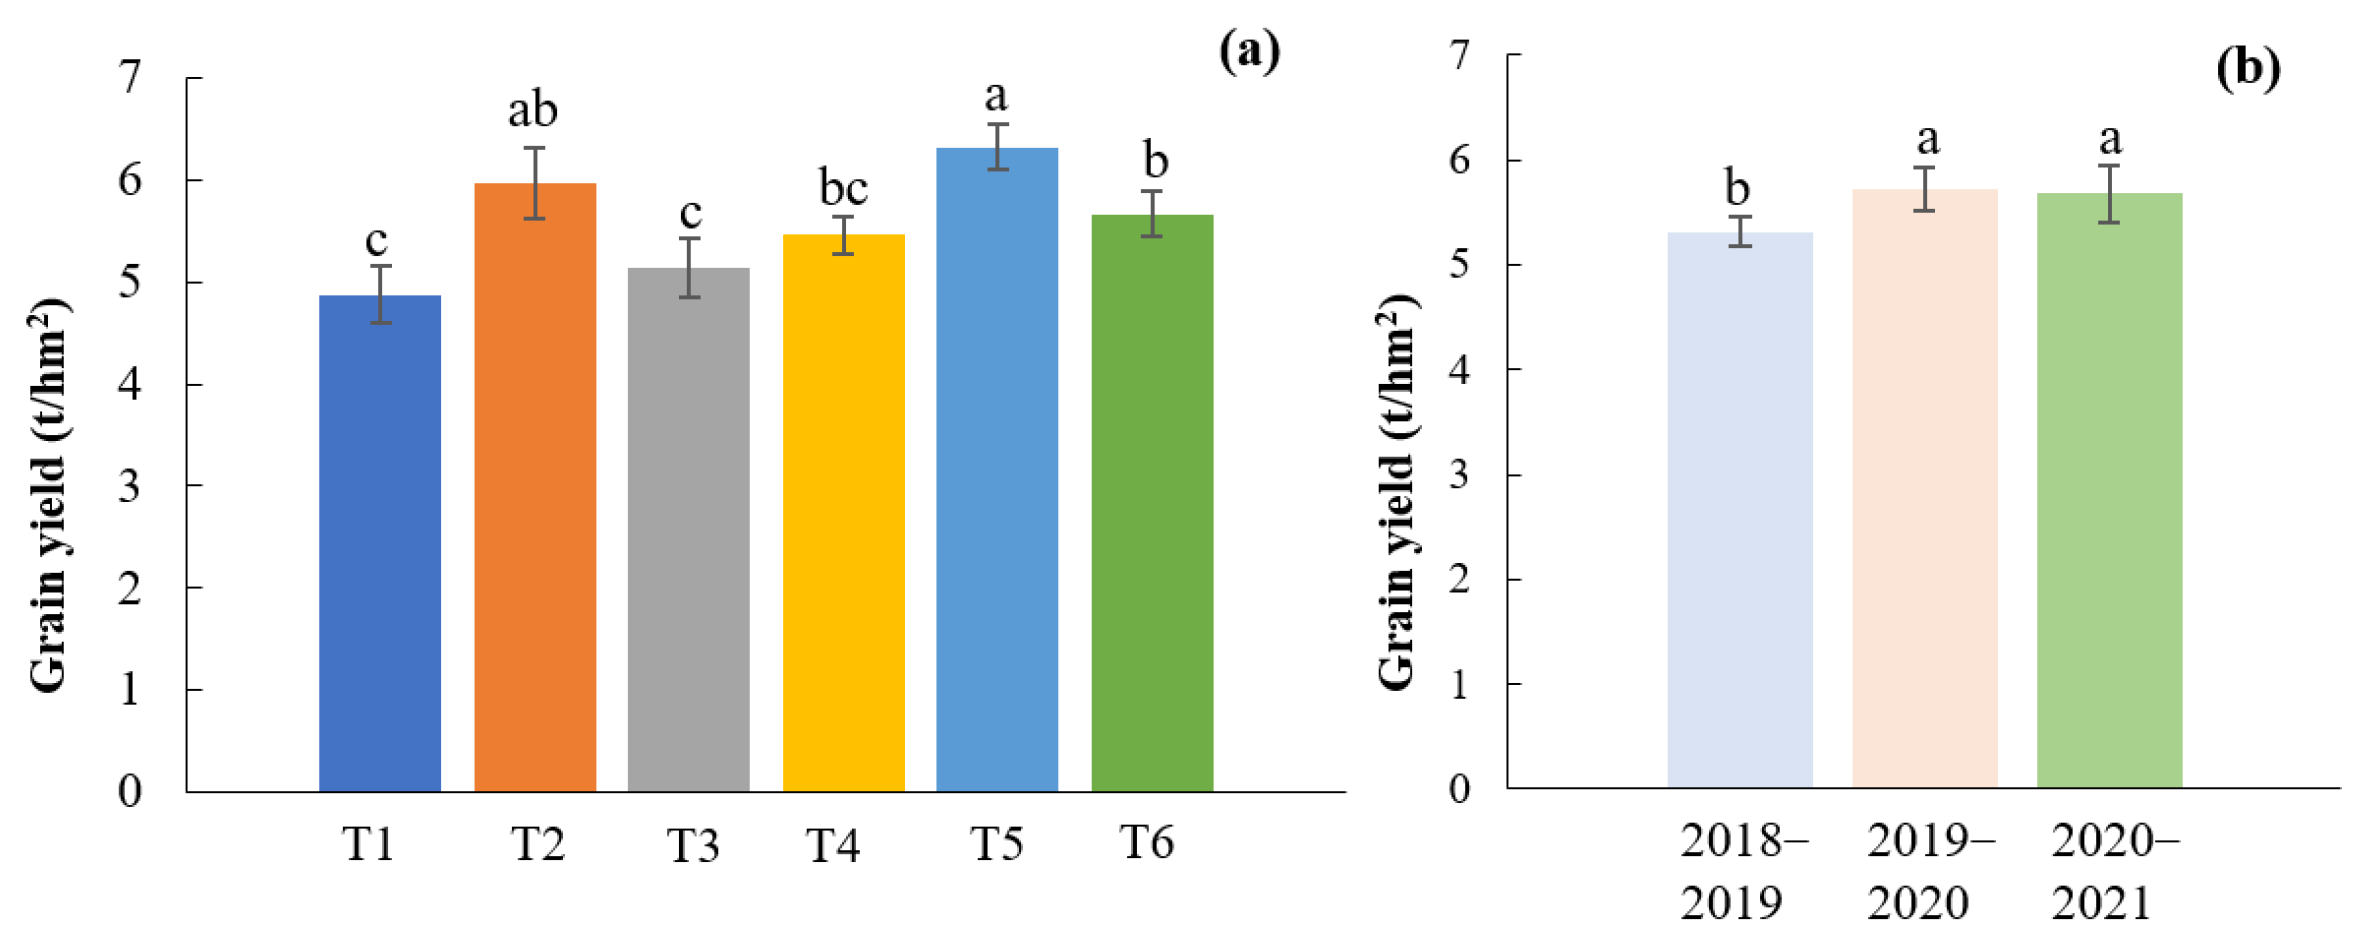
3.1. Effects of Fertilizer Application on Wheat Yield

As shown in Figure 2, over the three growing seasons, compared to the T1, yields under the T2, T3, T4, T5, and T6 treatments showed an increase of 5.4% to 29.7%. Under the same nitrogen application conditions, increasing phosphorus application showed an initial increase in yield followed by a decrease. Compared to a phosphorus application rate of 40 kg/ha, increasing the phosphorus rate to 80 kg/ha increased the average yield by 13.6% to 25.1%, while increasing it to 120 kg/ha only resulted in a 0.1% to 12.6% yield increase. Under the same phosphorus application conditions, increasing nitrogen from 100 kg/ha to 180 kg/ha resulted in an average yield increase of 2.6% to 17.6%.

3.2. Effects of Fertilizer Application on Wheat Biomass Yield and Thousand-Grain Weight

As shown in Figure 3, the biomass and thousand-grain weight over the three growing seasons were enhanced by appropriate nitrogen and phosphorus application rates. Compared to the T1 treatment, biomass and thousand-grain weight under the T2, T3, T4, T5, and T6 treatments were significantly higher. Specifically, biomass and thousand-grain weight increased with appropriate nitrogen and phosphorus application, but the effect of phosphorus application showed a non-linear response. Under the same nitrogen application conditions, increasing phosphorus application initially led to higher biomass and thousand-grain weight, but further increases in phosphorus application (above 80 kg/ha) resulted in reduced values. Similarly, increasing nitrogen from 100 kg/ha to 180 kg/ha consistently enhanced biomass and thousand-grain weight.

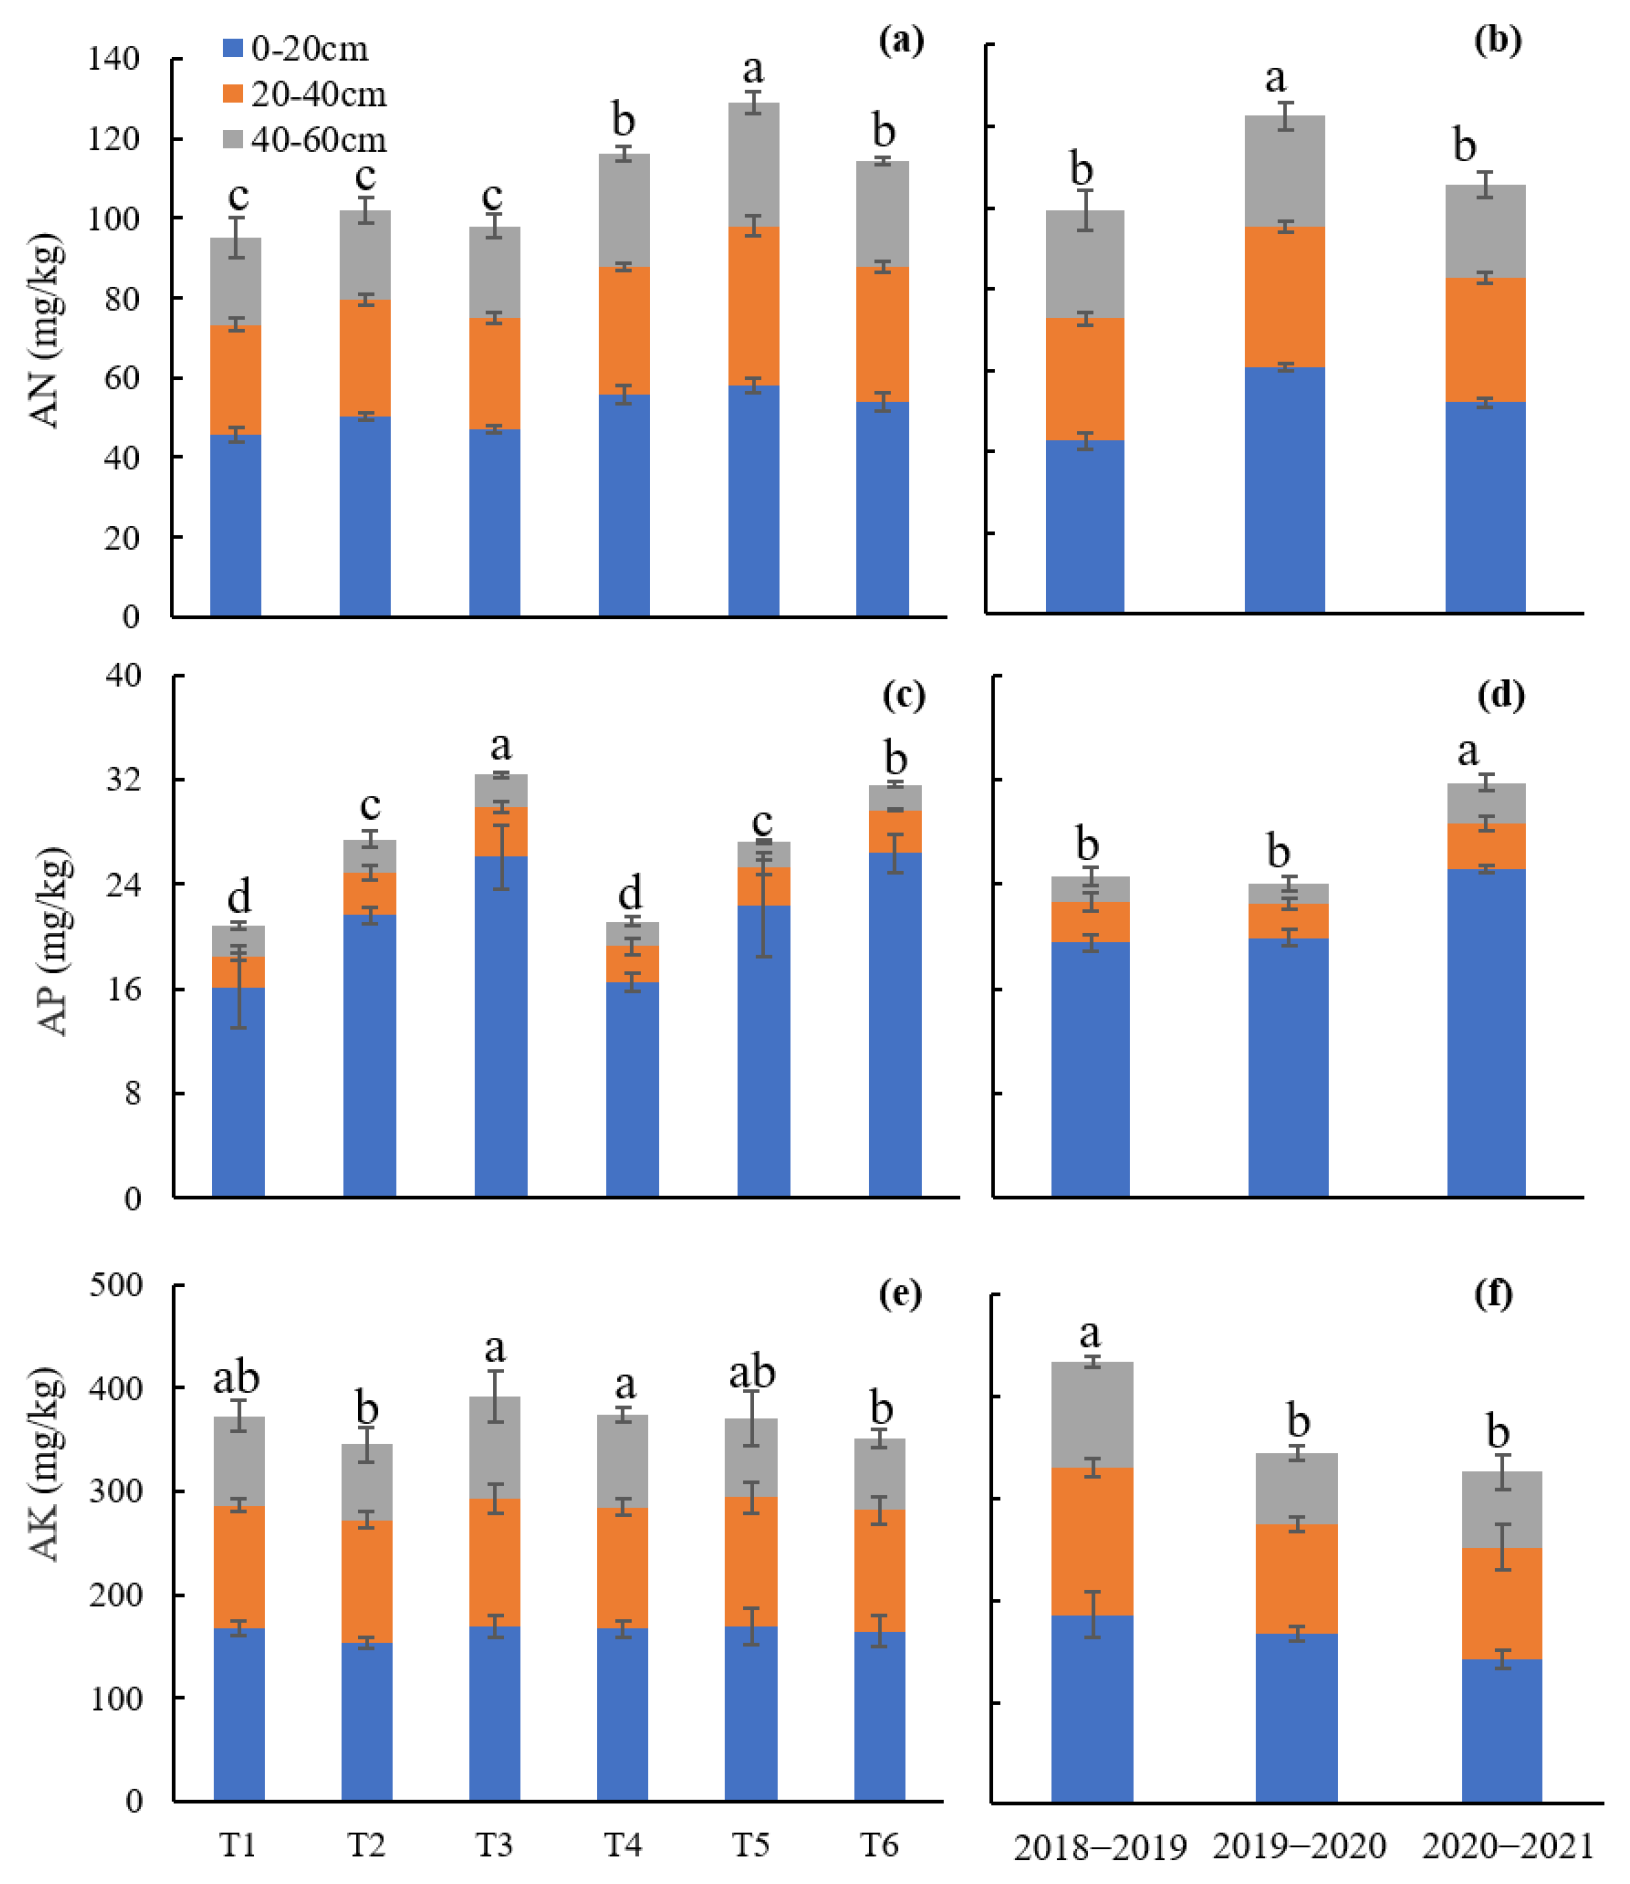
3.3. Effects of Fertilizer Application on Soil Nutrients

As shown in Figure 4, alkaline hydrolyzable nitrogen (AN), available phosphorus (AP), and quick-acting potassium (AK) in wheat were significantly affected by the application of fertilizers. For AN, increasing nitrogen fertilizer application from 100 kg/ha to 180 kg/ha increased total AN in the soil by 13.4–35.8%. Phosphorus fertilizer application had no significant effect on total AN in the soil. For AP in the soil, increasing phosphorus application from 40 kg/ha to 80 kg/ha and 120 kg/ha increased total AP by 16.4–39.9% and 35.8–106.1%, respectively. Increasing nitrogen fertilizer application had no significant effect on total AP in the soil. For AK in the soil, the application of nitrogen and phosphorus fertilizers had no significant effect on total AK in the soil.

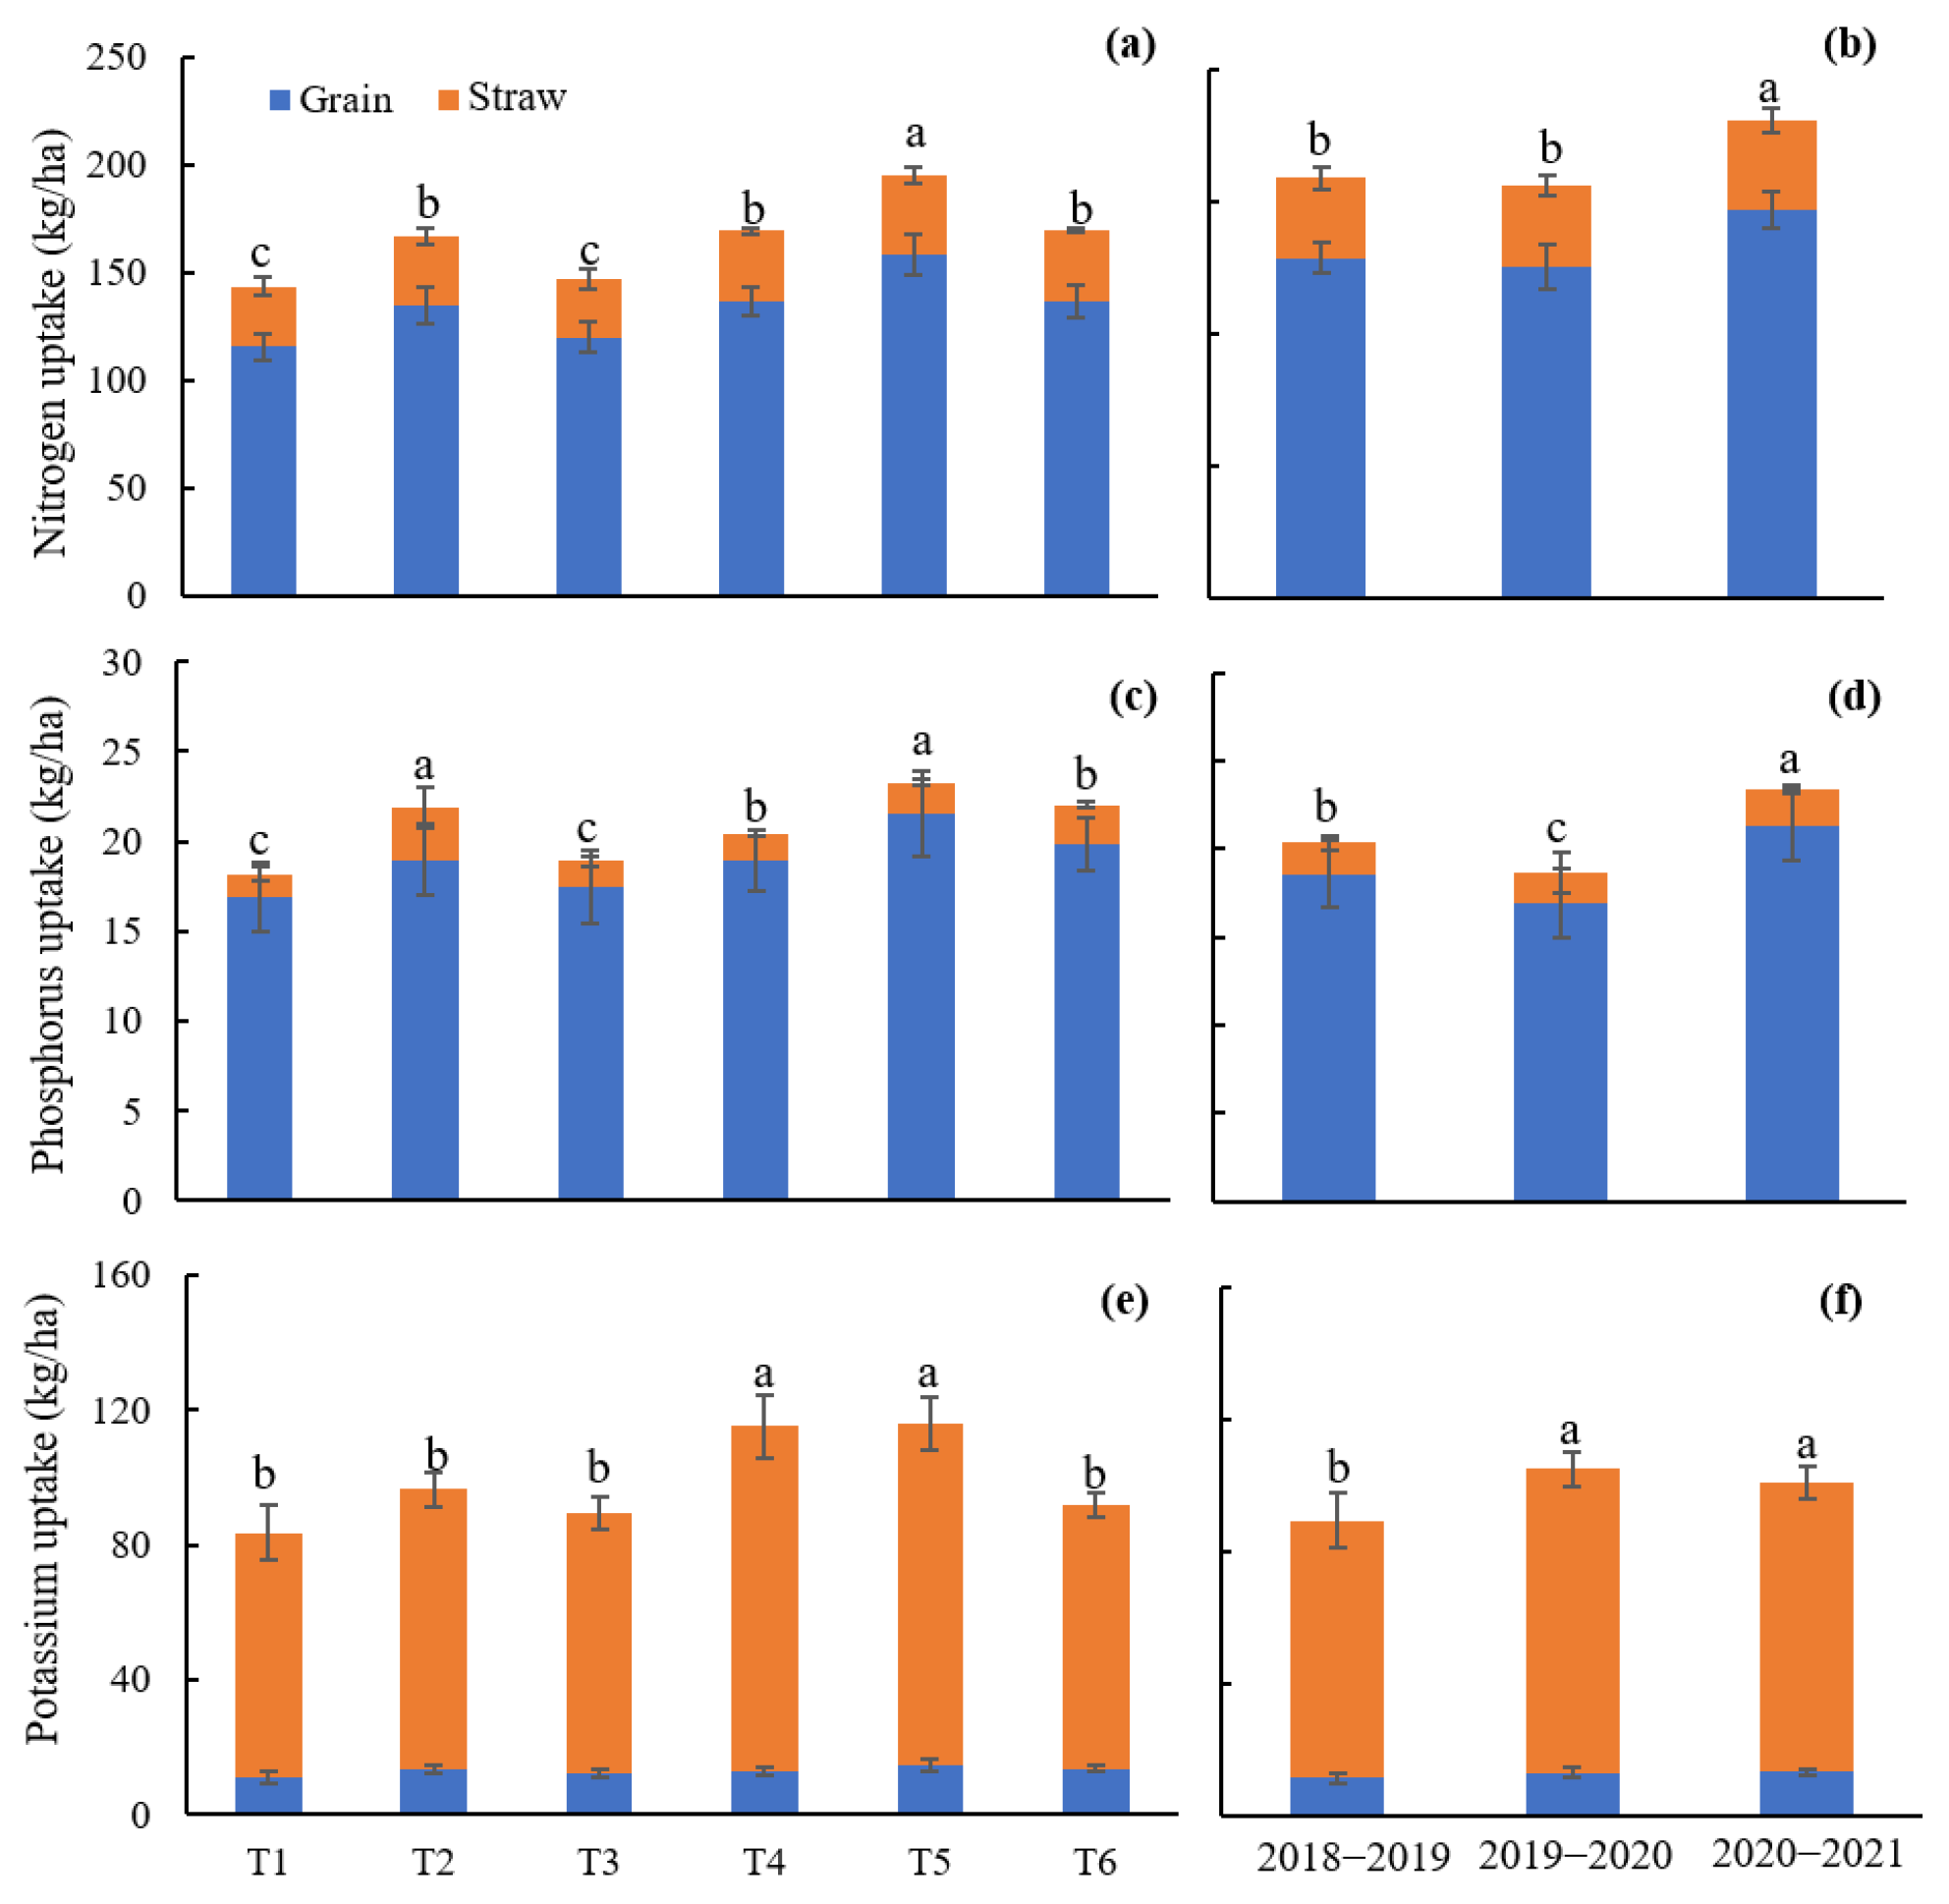
3.4. Effects of Fertilizer Application on Plant Nutrients

As shown in Figure 5, the total uptake of N, P, and K in wheat straw and grains over the three growing seasons was significantly influenced by fertilizer application rates (p < 0.05, Table 2). For nitrogen uptake, increasing nitrogen fertilizer from 100 kg/ha to 180 kg/ha resulted in a significant increase in nitrogen uptake in both grains and straw. The effect was more pronounced in straw, where the uptake increased by a higher percentage. Phosphorus fertilization also influenced nitrogen uptake, with a notable increase when phosphorus application was increased from 40 kg/ha to 80 kg/ha. However, further increasing phosphorus application to 120 kg/ha resulted in less consistent effects on nitrogen uptake, with some reductions observed, particularly in straw. For phosphorus uptake, nitrogen application increased phosphorus uptake in both grains and straw, with the most significant increases observed when nitrogen was increased from 100 kg/ha to 180 kg/ha. Similarly, phosphorus fertilization significantly increased phosphorus uptake, especially when phosphorus was applied at 80 kg/ha. However, when phosphorus application reached 120 kg/ha, the increases were less pronounced, and some reductions were noted in grains. For potassium uptake, nitrogen and phosphorus fertilization rates did not significantly affect potassium uptake in grains. However, nitrogen application resulted in a substantial increase in potassium uptake in straw. The effect of phosphorus application on potassium uptake was variable, with increases observed at lower rates (40 kg/ha to 80 kg/ha), but a decline in uptake at higher phosphorus levels (120 kg/ha), especially in straw.

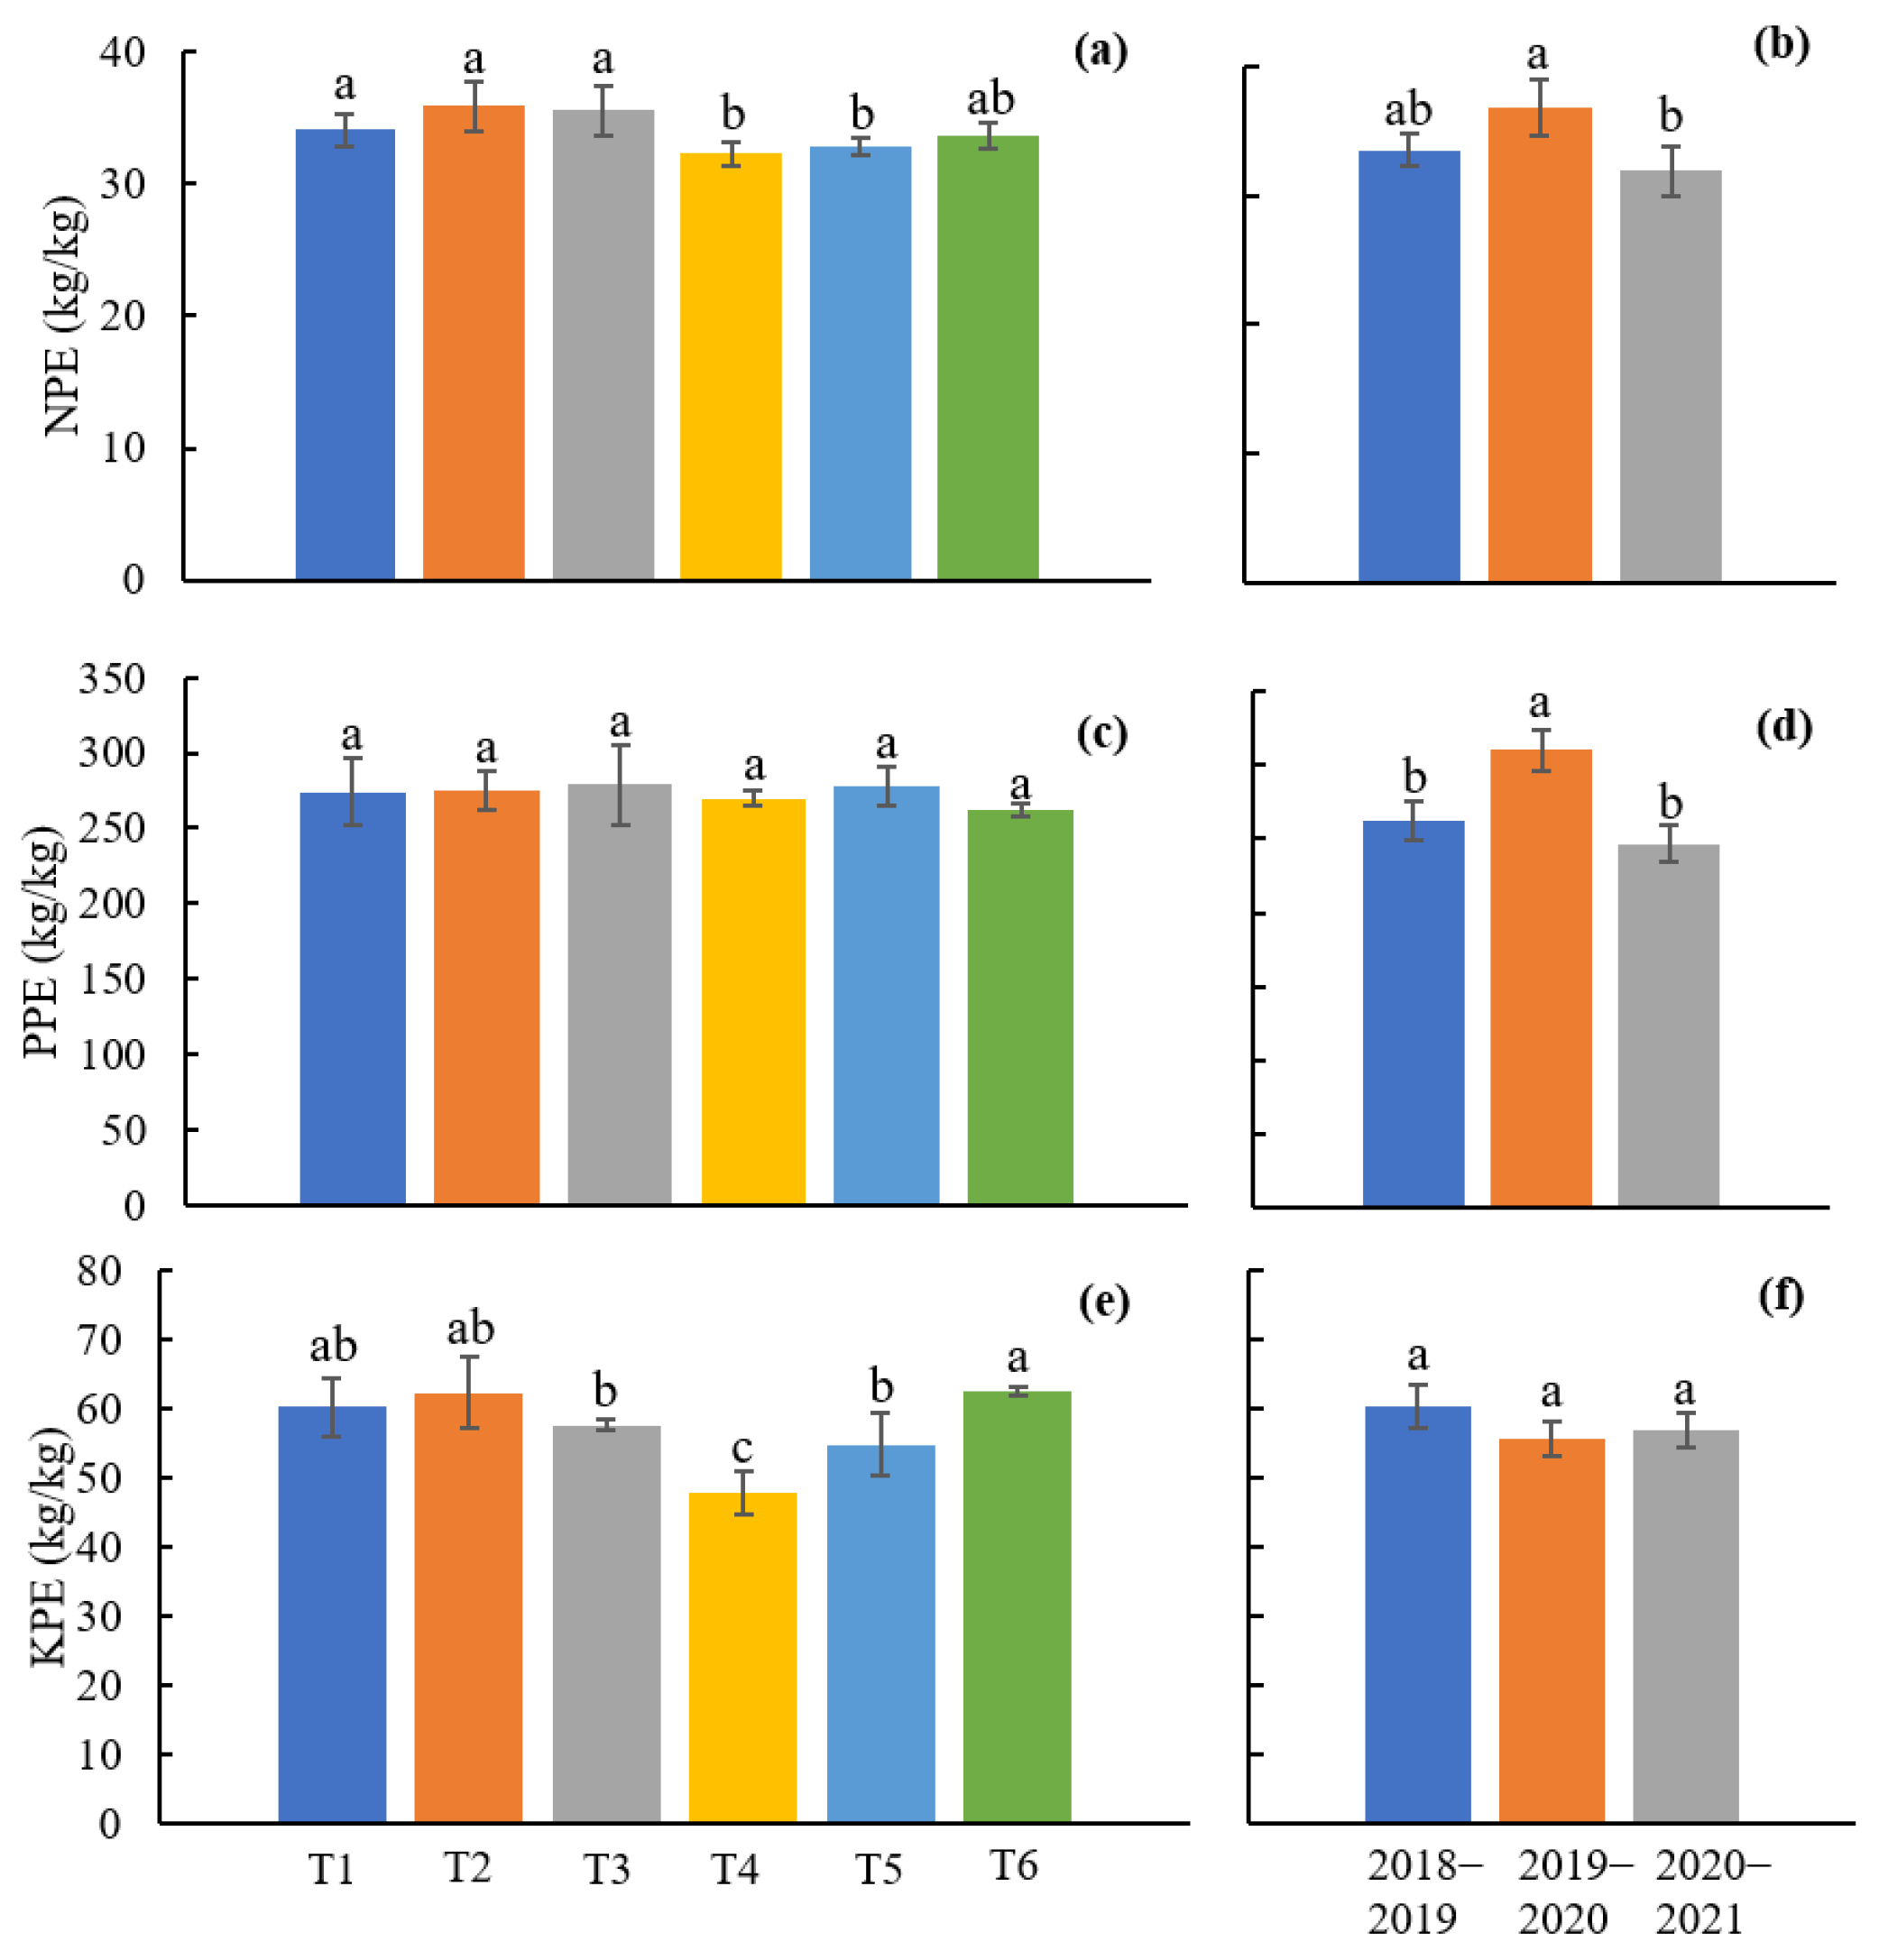
3.5. Effects of Fertilizer Application on Production Efficiency

As shown in Figure 6, the nitrogen, phosphorus, and potassium production efficiency of wheat was affected by the application rates of fertilizers. For nitrogen production efficiency, increasing nitrogen application from 100 kg/ha to 180 kg/ha, under constant phosphorus application, resulted in varying effects: nitrogen production efficiency increased by up to 14.1%, while phosphorus and potassium efficiencies showed more mixed responses, with values ranging from −14.7% to 6.6% for phosphorus and −23.9% to 22.6% for potassium. Under the same nitrogen application conditions, increasing phosphorus application from 40 kg/ha to 80 kg/ha improved nitrogen production efficiency by 0.1% to 10.8%, phosphorus efficiency by −13.0% to 11.2%, and potassium efficiency by 2.9% to 22.7%. When phosphorus application was further increased to 120 kg/ha, nitrogen, phosphorus, and potassium production efficiencies increased by −0.2% to 9.4%, −8.9% to 13.8%, and −3.8% to 55.1%, respectively.

3.6. Path Analysis of Factors Affecting Wheat Yield

Structural equation model analysis (SEMA, Figure 7) was constructed to further determine the direct and indirect pathway of wheat yield. The combined application of nitrogen and phosphorus effectively influenced soil AN, AP, AK, total nitrogen uptake (TNU), total phosphorus uptake (TPU), and total potassium uptake (TKU), which in turn altered wheat biomass and thousand-grain weight, thereby affecting grain yield. The impact on biomass was more significant (Standardized Path Coefficient (SPC) = 0.84). The main factors influencing wheat biomass yield were soil AN (SPC = 0.35), TUP (SPC = 0.39), and TUK (SPC = 0.60). The main factors influencing wheat thousand-grain weight were soil available phosphorus (SPC = −0.32) and nitrogen uptake (SPC = 0.33).

4. Discussion

4.1. Optimal Nitrogen and Phosphorus Application Rates for Wheat Cultivation in Alkali Soils

This study found that optimal nitrogen and phosphorus application rates contribute to increasing yield. Under the same phosphorus application conditions, increasing nitrogen fertilizer application from 100 kg/ha to 180 kg/ha resulted in an average yield increase of 2.6% to 17.6%. This is primarily due to nitrogen’s crucial role in the formation of essential organic compounds. As a key element in plant metabolism, nitrogen directly regulates metabolic processes, enhancing overall plant growth and development [23]. In contrast, the effect of phosphorus fertilizer follows a distinct pattern. With a constant nitrogen level, yield initially increases with higher phosphorus application but begins to decline once the phosphorus rate surpasses a certain threshold. This decline is primarily attributed to the fact that while phosphorus supplementation initially enhances soil phosphorus availability and promotes crop growth, excessive phosphorus can lead to accumulation in the soil [24,25,26,27].
Given these dynamics, identifying the optimal nitrogen and phosphorus application rates is essential for maximizing wheat yields in alkali soils. The findings of this study align with previous research that suggests careful management of these fertilizers is necessary for sustainable crop production [28,29,30]. For instance, Li et al. [31] found that applying nitrogen at 196 kg/ha and phosphorus at 120 kg/ha optimally balances nutrient use in fertilizers, achieving high wheat yields. Similarly, Dai et al. [32] recommended a lower nitrogen application rate of below 160 kg/ha and a phosphorus rate of about 100 kg/ha for the region. However, our study highlights that, under alkali soil conditions, a nitrogen application rate of 180 kg/ha coupled with a phosphorus application rate of 80 kg/ha offers the best balance, improving wheat yield while minimizing the environmental impact associated with excessive phosphorus use.

4.2. Impact of Pathways of Fertilizer Application on Wheat Yield

This study observed that phosphorus fertilization alters soil alkali-hydrolyzable nitrogen, available phosphorus, and available potassium, which in turn enhances wheat uptake of nitrogen, phosphorus, and potassium, ultimately influencing grain yield. The application of nitrogen fertilizer increases the level of alkali-hydrolyzable nitrogen (AN) in the soil, facilitating nitrogen accumulation and transport within the plant. This process enhances protein synthesis, thereby promoting biomass accumulation and increasing thousand-grain weight, which contributes to higher wheat yields [23]. Similarly, phosphorus application significantly increases available phosphorus in the soil, supporting root growth and expanding the root zone’s phosphorus uptake capacity, which enhances phosphorus uptake by the plant [33]. However, excessive phosphorus application can reduce total nitrogen and phosphorus uptake by plants. This effect is likely due to nutrient-induced stimulation of both root and shoot growth. When soil phosphorus levels are sufficiently high, luxury consumption of phosphorus may occur, meaning the plant absorbs more phosphorus than it can use, which limits its uptake by the grain and reduces phosphorus use efficiency [34]. Furthermore, nitrogen and phosphorus applications influence soil potassium levels, as these fertilizers are interconnected and can mutually affect crop nutrient uptake and utilization [35,36]. Under alkali soil conditions, where the available potassium content is often higher, the application of nitrogen and phosphorus fertilizers promotes the uptake and efficient utilization of available potassium, leading to improved crop yield [15].
The findings of this study suggest that, under controlled phosphorus application, wheat yield and phosphorus uptake initially increase. However, beyond a certain point, additional phosphorus application does not improve yield or uptake but leads to excessive phosphorus accumulation in the soil. This buildup could result in an environmental risk, particularly in soils with medium to high phosphorus levels. Therefore, in low-phosphorus soils, high phosphorus application can be beneficial in increasing available phosphorus and enhancing crop uptake. Additionally, significant variations in alkali-hydrolyzable nitrogen, available phosphorus, available potassium, nitrogen uptake, phosphorus uptake, potassium uptake, and soil moisture content were observed across different growth stages and soil depths. These differences are likely driven by fluctuations in climate conditions, such as rainfall and temperature, over the years, which influence soil microbial activity, plant processes, and nutrient dynamics, leading to changes in both plant and soil parameters. This study focused exclusively on the measurement of nitrogen, phosphorus, and potassium levels in both soil and plant tissues. It did not include other essential nutrients such as calcium (Ca), magnesium (Mg), and micronutrients, which are likely to play significant roles in nutrient dynamics and overall crop performance. Incorporating these additional nutrients in future studies could provide a more comprehensive understanding of nutrient interactions in alkali soils and their effects on wheat growth and yield. Additionally, the soil system’s texture and properties were not extensively analyzed due to the scope of the study. Future research could benefit from a more thorough investigation of soil characteristics to further refine fertilizer recommendations.

5. Conclusions

Increasing phosphorus application under the same nitrogen conditions initially enhanced wheat yield, with yield improving as phosphorus levels increased, but the effect diminished at higher phosphorus rates. Similarly, increasing nitrogen application led to a notable increase in yield. The combined application of nitrogen and phosphorus significantly affected soil nutrient levels, such as alkali-hydrolyzable nitrogen, available phosphorus, and potassium, as well as wheat nutrient uptake. These changes influenced wheat biomass, thousand-grain weight, and ultimately grain yield, with biomass being the most significant factor. These findings highlight the importance of optimizing nitrogen and phosphorus fertilization to improve wheat yield and nutrient uptake, providing valuable insights for efficient fertilizer management.

Author Contributions

P.H.: Writing—review and editing, writing—original draft, methodology, investigation, conceptualization. B.L.: Project administration, formal analysis, data curation. E.C.: Software, data curation. Z.L.: Writing—review and editing, funding acquisition. Y.L.: Writing—review and editing. Z.S.: Writing—review and editing, funding acquisition, formal analysis. Y.X.: Writing-review & editing, Methodology, Software. C.M.: Writing—review and editing, methodology, investigation, conceptualization. All authors have read and agreed to the published version of the manuscript.

Funding

Funding support for this research was provided by the National Natural Science Foundation of China (U24A20359), the Key R&D Program of Shandong Province, China (2023TZXD087, 2023TZXD088, 2024CXPT075), the Technical System of Ecological Agriculture of Modern Agricultural Technology System in Shandong Province (SDAIT-30-01, SDAIT-30-15), the Taishan Scholars Program (tstp20230646), the Key R&D and Promotion Special Project of Henan Province (252102321111), the Key Scientific Research Project of Higher Education Institutions in Henan Province (25A570003), the “Unveiling and Leading” Project (GYJ2023006).

Data Availability Statement

Data will be made available on request.

Conflicts of Interest

The authors declare that they have no known competing financial interests or personal relationships that could have appeared to influence the work reported in this paper.

References

  1. FAO. Global Report on Food Crises. 2022. Available online: https://www.fao.org/3/cb9997en/cb9997en (accessed on 4 May 2022).
  2. Liu, S.L.; Hou, X.Y.; Yang, M.; Cheng, F.Y.; Coxixo, A.; Wu, X.; Zhang, Y.Q. Factors driving the relationships between vegetation and soil properties in the Yellow River Delta, China. Catena 2018, 165, 279–285. [Google Scholar] [CrossRef]
  3. Xia, J.B.; Ren, J.Y.; Zhang, S.Y.; Wang, Y.H.; Fang, Y. Forest and grass composite patterns improve the soil quality in the coastal alkali land of the Yellow River Delta, China. Geoderma 2019, 349, 25–35. [Google Scholar] [CrossRef]
  4. Shrivastava, P.; Kumar, R. Soil salinity: A serious environmental issue and plant growth promoting bacteria as one of the tools for its alleviation. Saudi J. Biol. Sci. 2015, 22, 123–131. [Google Scholar] [CrossRef]
  5. Huang, M.Y.; Zhang, Z.Y.; Zhai, Y.M.; Lu, P.R.; Zhu, C.L. Effect of straw biochar on soil properties and wheat production under saline water irrigation. Agronomy 2019, 9, 457. [Google Scholar] [CrossRef]
  6. Huang, X.M.; Xu, X.P.; Zhu, Q.C.; Zhang, Y.T. Optimizing water and nitrogen inputs for sustainable wheat yields and minimal environmental impacts. Agric. Syst. 2024, 220, 104061. [Google Scholar] [CrossRef]
  7. Xie, H.; Li, J.; Zhang, Y.; Xu, X.; Wang, L.; Ouyang, Z. Evaluation of coastal farming under salinization and optimized fertilization strategies in China. Sci. Total Environ. 2021, 797, 149038. [Google Scholar] [CrossRef]
  8. Eynard, A.; Lal, R.; Wiebe, K. Crop Response in Salt-Affected Soils. J. Sustain. Agric. 2005, 27, 5–50. [Google Scholar] [CrossRef]
  9. Wang, X.; Shi, W.; Sun, X.; Wang, M. Comprehensive benefits evaluation and its spatial simulation for well-facilitated farmland projects in the Huang-Huai-Hai Region of China. Land Degrad. Dev. 2020, 31, 1837–1850. [Google Scholar] [CrossRef]
  10. Yan, S.; Wu, Y.; Fan, J.; Zhang, F.; Zheng, J.; Qiang, S.; Guo, J.; Xiang, Y.; Zou, H.; Wu, L. Dynamic change and accumulation of grain macronutrient (N, P and K) concentrations in winter wheat under different drip fertigation regimes. Field Crops Res. 2020, 250, 107767. [Google Scholar] [CrossRef]
  11. Zörb, C.; Ludewig, U.; Hawkesford, M.J. Perspective on Wheat Yield and Quality with Reduced Nitrogen Supply. Trends Plant Sci. 2018, 23, 1029–1037. [Google Scholar] [CrossRef]
  12. Wang, Y.J.; Wang, D.M.; Tao, Z.Q.; Yang, Y.S.; Gao, Z.X.; Zhao, G.C.; Chang, X.H. Impacts of Nitrogen Deficiency on Wheat (Triticum aestivum L.) Grain During the Medium Filling Stage: Transcriptomic and Metabolomic Comparisons. Front. Plant Sci. 2021, 12, 674433. [Google Scholar] [CrossRef] [PubMed]
  13. Song, X.; Zhou, G.; Ma, B.L.; Wu, W.; Ahmad, I.; Zhu, G.; Yan, W.; Jiao, X. Nitrogen application improved photosynthetic productivity, chlorophyll fluorescence, yield and yield components of two oat genotypes under saline conditions. Agronomy 2019, 9, 115. [Google Scholar] [CrossRef]
  14. Johan, P.D.; Ahmed, O.h.; Omar, L.; Hasbullah, N.A. Phosphorus Transformation in Soils Following Co-Application of Charcoal and Wood Ash. Agronomy 2021, 11, 2010. [Google Scholar] [CrossRef]
  15. Ma, C.J.; Yuan, H.; Shi, N.; Sun, Z.; Liu, S.; Wang, X.; Li, B.; Li, S.; Liu, Z. Effects of phosphate application rate on grain yield and nutrition use of summer maize under the Coastal Alkali Land. Agronomy 2023, 13, 2668. [Google Scholar] [CrossRef]
  16. Shen, Q.; Wen, Z.H.; Dong, Y.; Li, H.G.; Miao, Y.X.; Shen, J.B. The responses of root morphology and phosphorus-mobilizing exudations in wheat to increasing shoot phosphorus concentration. AoB Plants 2018, 10, ply054. [Google Scholar] [CrossRef]
  17. Chen, X.; Yan, X.; Wang, M.; Cai, Y.; Weng, X.; Su, D.; Guo, J.; Wang, W.; Hou, Y.; Ye, D. Long-term excessive phosphorus fertilization alters soil phosphorus fractions in the acidic soil of pomelo orchards. Soil. Tillage Res. 2022, 215, 105214. [Google Scholar] [CrossRef]
  18. Kim, G.W.; Lim, J.Y.; Islam-Bhuiyan, M.S.; Das, S.; Khan, M.I.; Kim, P.J. Investigating the arable land that is the main contributor to global warming between paddy and upland vegetable crops under excessive nitrogen fertilization. J. Clean. Prod. 2022, 346, 131197. [Google Scholar] [CrossRef]
  19. Wang, H.; Ren, H.; Han, K.; He, Q.; Zhang, L.; Zhao, Y.; Liu, Y.; Zhang, J.; Zhao, B.; Ren, B. Sustainable improvement strategies for summer maize yield, nitrogen use efficiency and greenhouse gas emission intensity in the North China Plain. Eur. J. Agron. 2023, 143, 126712. [Google Scholar] [CrossRef]
  20. Walkley, A.; Black, I.A. An Examination of the Degtjareff Method for Determining Soil Organic Matter and a Proposed Modification of the Chromic Acid Titration Method. Soil. Sci. 1934, 37, 29–38. [Google Scholar] [CrossRef]
  21. Chen, B.L.; Yang, H.K.; Song, W.C.; Liu, C.Y.; Wu, J.; Zhao, W.Q.; Zhou, Z.G. Effect of N fertilization rate on soil alkali-hydrolyzable N, subtending leaf N concentration, fiber yield, and quality of cotton. Crop J. 2016, 4, 323–330. [Google Scholar] [CrossRef]
  22. Ma, C.J.; Wu, W.B.; Hou, P.; Wang, Y.; Li, B.W.; Yuan, H.B.; Liu, L.N.; Wang, X.J.; Sun, Z.Q.; Li, Y. Effect of combined nitrogen and phosphorus fertilization on summer maize yield and soil fertility in coastal alkali land. Agric. Water Manag. 2025, 309, 109277. [Google Scholar] [CrossRef]
  23. Mu, X.H.; Chen, Q.W.; Chen, F.J.; Yuan, L.X.; Mi, G.H. Within-lea nitrogen allocation in adaptation to low nitrogen supply in maize during grain-filling stage. Front. Plant Sci. 2016, 7, 699. [Google Scholar] [CrossRef] [PubMed]
  24. Zhang, Y.; Wei, W.; Gao, W.; Cui, H.; Xu, X.; Jiang, W.; Liu, S. Content patterns of maize endogenous hormones and grain yield influenced by field phosphorus application. Agronomy 2023, 13, 1911. [Google Scholar] [CrossRef]
  25. Zhang, Z.B.; Jia, C.L.; Ren, B.Z.; Liu, P.; Zhao, B.; Zhang, J.W. Effects of combined application of nitrogen and phosphorus on yield and leaf senescence physiological characteristics in summer maize. Acta Agron. Sin. 2023, 49, 1616–1629. [Google Scholar]
  26. Hussain, M.Z.; Hamilton, S.K.; Robertson, G.P.; Basso, B. Phosphorus availability and leaching losses in annual and perennial cropping systems in an upper US Midwest landscape. Sci. Rep. 2021, 11, 20367. [Google Scholar] [CrossRef]
  27. Cecilia, C.I.; Fabrizio, D.I.A.; Rosa, G.A. Phosphorus downward movement in soil highly charged with cattle manure. Environ. Earth Sci. 2016, 75, 5687. [Google Scholar] [CrossRef]
  28. Luo, X.; Mazer, S.J.; Guo, H.; Zhang, N.; Weiner, J.; Hu, S. Nitrogen: Phosphorous supply ratio and allometry in five alpine plant species. Ecol. Evol. 2016, 6, 8881–8892. [Google Scholar] [CrossRef]
  29. Plaza-Bonilla, D.; Lampurlanes, J.; Fernandez, F.G.; Cantero-Martinez, C. Nitrogen fertilization strategies for improved Mediterranean rainfed wheat and barley performance and water and nitrogen use efficiency. Eur. J. Agron. 2021, 124, 126238. [Google Scholar] [CrossRef]
  30. Shi, Z.; Liu, D.; Liu, M.; Hafeez, M.B.; Wen, P.; Wang, X.; Wang, R.; Zhang, X.; Li, J. Optimized fertilizer recommendation method for nitrate residue control in a wheat–maize double cropping system in dryland farming. Field Crops Res. 2021, 271, 108258. [Google Scholar] [CrossRef]
  31. Li, Y.H.; Zhou, B.B.; Ren, P.Q.; Shan, Y.Y.; Xue, W.Q. Effects of water and fertilizer regulation modes on water fertilizer and utilization efficiency of spring maize in coastal saline–alkali land. J. Irrig. Drain. Eng. 2023, 41, 80–88. [Google Scholar] [CrossRef]
  32. Dai, J.; Wang, Z.; Li, M.; He, G.; Li, Q.; Cao, H.; Wang, S.; Gao, Y.; Hui, X. Winter wheat grain yield and summer nitrate leaching: Long-term effects of nitrogen and phosphorus rates on the Loess Plateau of China. J. Field Crops Res. 2016, 196, 180–190. [Google Scholar] [CrossRef]
  33. Wen, Z.; Shen, J.; Blackwell, M.; Li, H.; Zhao, B.; Yuan, H. Combined applications of nitrogen and phosphorus fertilizers with manure increase maize yield and nutrient uptake via stimulating root growth in a long-term experiment. Pedosphere 2016, 26, 62–73. [Google Scholar] [CrossRef]
  34. Khan, A.; Lu, G.; Ayaz, M.; Zhang, H.; Wang, R.; Lv, F.; Yang, X.; Sun, B.; Zhang, S. Phosphorus efficiency, soil phosphorus dynamics and critical phosphorus level under long-term fertilization for single and double cropping systems. Agr Ecosyst. Environ. 2018, 256, 1–11. [Google Scholar] [CrossRef]
  35. Galindo, F.S.; Strock, J.S.; Pagliari, P.H. Nutrient accumulation affected by corn stover management associated with nitrogen and phosphorus fertilization. Agriculture 2021, 11, 1118. [Google Scholar] [CrossRef]
  36. Schlegel, A.J.; Havlin, J.L. Corn yield and grain nutrient uptake from 50 years of nitrogen and phosphorus fertilization. Agron. J. 2017, 109, 335–342. [Google Scholar] [CrossRef]
Figure 1. Maximum and minimum air temperature and monthly rainfall during the wheat seasons: (a) temperatures; (b) rainfall.
Agronomy 15 00734 g001
Figure 2. Influence of different fertilizer rates on grain yield. (a) Grain yield depending on fertilization rates (average from 3 seasons, ±SD, n = 9). (b) Grain yield depending on seasons (average from 6 fertilization rates, ±SD, n = 18); T: treatment; Y: year; T1: N 100 kg/ha—P 40 kg/ha; T2: N 100 kg/ha—P 80 kg/ha; T3: N 100 kg/ha—P 120 kg/ha; T4: N 180 kg/ha—P 40 kg/ha; T5: N 180 kg/ha—P 80 kg/ha; T6: N 180 kg/ha—P 120 kg/ha. The letters “a, b, c, ab, bc.” represent the significance differences between groups. Same letters indicate that there is no significant difference between the groups, while different letters indicate that the differences between the groups are significant.
Agronomy 15 00734 g002
Figure 3. Influence of different fertilizer rates on biomass yield and thousand-grain weight. (a) Biomass yield depending on fertilization rates (average from 3 seasons, ±SD, n = 9). (b) Biomass yield depending on seasons (average from 6 fertilization rates, ±SD, n = 18). (c) Thousand-grain weight depending on fertilization rates (average from 3 seasons, ±SD, n = 9). (d) Thousand-grain weight depending on seasons (average from 6 fertilization rates, ±SD, n = 18); T: treatment; Y: year; T1: N 100 kg/ha—P 40 kg/ha; T2: N 100 kg/ha—P 80 kg/ha; T3: N 100 kg/ha—P 120 kg/ha; T4: N 180 kg/ha—P 40 kg/ha; T5: N 180 kg/ha—P 80 kg/ha; T6: N 180 kg/ha—P 120 kg/ha. The letters “a, b, c, ab, bc.” represent the significance differences between groups. Same letters indicate that there is no significant difference between the groups, while different letters indicate that the differences between the groups are significant.
Agronomy 15 00734 g003
Figure 4. Differences in soil alkaline hydrolyzable nitrogen, available phosphorus, and quick-acting potassium. (a) Alkaline hydrolyzable nitrogen depending on fertilization rates (average from 3 seasons, ±SD, n = 9). (b) Alkaline hydrolyzable nitrogen depending on seasons (average from 6 fertilization rates, ±SD, n = 18). (c) Available phosphorus weight depending on fertilization rates (average from 3 seasons, ±SD, n = 9). (d) Available phosphorus depending on seasons (average from 6 fertilization rates, ±SD, n = 18). (e) Quick-acting potassium depending on fertilization rates (average from 3 seasons, ±SD, n = 9). (f) Quick-acting potassium depending on seasons (average from 6 fertilization rates, ±SD, n = 18); T: treatment; Y: year; T1: N 100 kg/ha—P 40 kg/ha; T2: N 100 kg/ha—P 80 kg/ha; T3: N 100 kg/ha—P 120 kg/ha; T4: N 180 kg/ha—P 40 kg/ha; T5: N 180 kg/ha—P 80 kg/ha; T6: N 180 kg/ha—P 120 kg/ha; AN: alkaline hydrolyzable nitrogen; AP: available phosphorus; AK: quick-acting potassium. The letters “a, b, c, ab, d.” represent the significance differences between groups. Same letters indicate that there is no significant difference between the groups, while different letters indicate that the differences between the groups are significant.
Agronomy 15 00734 g004
Figure 5. Differences in nitrogen uptake, phosphorus uptake, and potassium uptake. (a) Nitrogen uptake depending on fertilization rates (average from 3 seasons, ±SD, n = 9). (b) Nitrogen uptake depending on seasons (average from 6 fertilization rates, ±SD, n = 18). (c) Phosphorus uptake weight depending on fertilization rates (average from 3 seasons, ±SD, n = 9). (d) Phosphorus uptake depending on seasons (average from 6 fertilization rates, ±SD, n = 18). (e) Potassium uptake depending on fertilization rates (average from 3 seasons, ±SD, n = 9). (f) Potassium uptake depending on seasons (average from 6 fertilization rates, ±SD, n = 18); T: treatment; Y: year; T1: N 100 kg/ha—P 40 kg/ha; T2: N 100 kg/ha—P 80 kg/ha; T3: N 100 kg/ha—P 120 kg/ha; T4: N 180 kg/ha—P 40 kg/ha; T5: N 180 kg/ha—P 80 kg/ha; T6: N 180 kg/ha—P 120 kg/ha. The letters “a, b, c.” represent the significance differences between groups. Same letters indicate that there is no significant difference between the groups, while different letters indicate that the differences between the groups are significant.
Agronomy 15 00734 g005
Figure 6. Influence of different phosphate fertilizer rates on nitrogen physiological efficiency (NPE), phosphorus physiological efficiency (PPE), and potassium physiological efficiency (KPE). (a) NPE depending on fertilization rates (average from 3 seasons, ±SD, n = 9); (b) NPE depending on seasons (average from 6 fertilization rates, ±SD, n = 18); (c) PPE depending on fertilization rates (average from 3 seasons, ±SD, n = 9); (d) PPE depending on seasons (average from 6 fertilization rates, ±SD, n = 18); (e) KPE depending on fertilization rates (average from 3 seasons, ±SD, n = 9); (f) KPE depending on seasons (average from 6 fertilization rates, ±SD, n = 18); T: treatment; Y: year; T1: N 100 kg/ha—P 40 kg/ha; T2: N 100 kg/ha—P 80 kg/ha; T3: N 100 kg/ha—P 120 kg/ha; T4: N 180 kg/ha—P 40 kg/ha; T5: N 180 kg/ha—P 80 kg/ha; T6: N 180 kg/ha—P 120 kg/ha. The letters “a, b, c, ab.” represent the significance differences between groups. Same letters indicate that there is no significant difference between the groups, while different letters indicate that the differences between the groups are significant.
Agronomy 15 00734 g006
Figure 7. Analysis of the impact path of wheat yield in the 2018–2019, 2019–2020 and 2020–2021 seasons; different letters indicate a significant difference at * p < 0.05; ** p < 0.01. TNU: total nitrogen uptake; TPU: total phosphorus uptake; TKU: total potassium uptake; AN: alkaline hydrolyzable nitrogen; AP: available phosphorus; AK: quick-acting potassium; BY: biomass yield; TGW: thousand-grain weight; GY: grain yield. The blue arrows represent positive effects, while the red arrows represent negative effects. Additionally, the thickness of the arrows indicates the degree of impact.
Agronomy 15 00734 g007
Table 1. Main chemical properties of test soil.
Soil Depth
(cm)
Conductivity
(mS cm−1)
pHOrganic Matter
(g kg−1)
Alkaline Hydrolyzable Nitrogen
(mg kg−1)
Available Phosphorus
(mg kg−1)
Available Potassium
(mg kg−1)
0–200.218.169.6350.7210.36152
20–400.478.076.8356.175.96122
40–600.598.013.6823.295.7959
Table 2. Two-factor ANOVA parameters for grain and straw nutrient content.
GNUGPUGKUSNUSPUSKU
Treatment8.76 **10.32 **11.69 **2.12 *0.73 ns1.72 *
Year74.57 **56.97 **74.46 **6.14 **10.98 **19.71 **
Treatment × year2.18 *ns1.73 ns2.23 *1.97 ns0.90 ns3.14 **
Note: GNU: grain nitrogen uptake; GPU: grain phosphorus uptake; GKU: grain potassium uptake; SNU: straw nitrogen uptake; SPU: straw phosphorus uptake; SKU: straw potassium uptake. Different letters indicate a significant difference at * p < 0.05; ** p < 0.01; ns p > 0.05.
Disclaimer/Publisher’s Note: The statements, opinions and data contained in all publications are solely those of the individual author(s) and contributor(s) and not of MDPI and/or the editor(s). MDPI and/or the editor(s) disclaim responsibility for any injury to people or property resulting from any ideas, methods, instructions or products referred to in the content.

