Article

Latitude, Planting Density, and Soil Available Potassium Are the Key Driving Factors of the Cotton Harvest Index in Arid Regions

1
Xinjiang Production and Construction Corps Key Laboratory of Oasis Town and Mountain-Basin System, College of Life Sciences, Shihezi University, Shihezi 832003, China
2
Xinjiang Uygur Autonomous Region Agricultural Ecology and Resources Protection Station, Urumqi 830002, China
*
Author to whom correspondence should be addressed.
There authors contributed equally to this work.
Agronomy 2025, 15(3), 743; https://doi.org/10.3390/agronomy15030743
Submission received: 3 February 2025 / Revised: 14 March 2025 / Accepted: 14 March 2025 / Published: 19 March 2025
(This article belongs to the Section Farming Sustainability)

Abstract

:
The lint harvest index (HI) of cotton is the ratio of cotton lint yield to the total aboveground biomass of cotton, which is not yet clear in arid-zone cotton areas. In 2022–2023, large-scale sampling was carried out in Xinjiang, and the HI of different variety types of cotton in Xinjiang and their key drivers were clarified using methods such as random forest modeling (RFM) and structural equation modeling (SEM). The results show that the overall cotton HI in Xinjiang ranged from 0.276 to 0.333 and 0.279 to 0.328 for the Xinluzao (XLzao) variety types, and from 0.276 to 0.333 for the Xinluzhong (XLzhong) variety types. The results of the SEM analysis show that the latitude (−0.99) and planting density (0.50), in the climatic geography factors, and available potassium in soil (0.88), in the soil nutrient factors, have the greatest effects on the overall cotton HI in Xinjiang. The key driving factors of cotton HI were found to be different among different variety types. This study aimed to clarify the HI of different variety types of cotton in arid-zone cotton and to explore its key driving factors. This was undertaken in order to provide a theoretical basis for the accurate estimation of cotton and cotton straw yields in the arid zone.

1. Introduction

Cotton (Gossypium hirsutum L.) is a natural fiber and oil crop with high economic value that is widely grown worldwide. Global cotton cultivation has reached 34.5 million hectares, with an average annual yield of 2.14 tons per hectare [1,2,3]. Xinjiang, China, is the center of cotton production, accounting for 90% of the country’s cotton output and 20% of the world’s total [4]. Cotton straw is a by-product of cotton, mainly including cotton stems, branches, buds, leaves, husks, and other parts of cotton, accounting for the main part of its aboveground biomass [3]. Cotton is an important agricultural renewable resource that is carbon-neutral, clean, and stable; it is a high-quality biomass material that can act as organic fertilizer and ruminant feed and has a high value for exploitation [5,6,7,8,9,10,11,12,13]. The rational utilization of cotton straw plays an important role in realizing the goal of “double carbon”, upgrading the soil quality of cotton fields, and developing animal husbandry in cotton-growing areas. Therefore, the resource utilization of cotton straw will become increasingly important in the future. There are many studies on cotton yield, but there are very few studies on the amount of cotton straw resources or on the relationship between the cotton harvest index (HI) and cotton yield or cotton straw resources [4,14,15,16,17,18].
The allocation of biomass to reproductive organs is a key feature of plant fitness, which, in crops, is known as the harvest index [19]. The crop HI is an important concept in agricultural science research, which reflects the ratio of crop seed yield (e.g., seeds, fruits, etc.) to the total aboveground biomass [20,21,22,23,24]. It is the core parameter for calculating crop yield and crop straw yield. The cotton lint HI is the ratio of cotton lint weight to the total aboveground biomass of cotton (cotton straw yield) [25,26]. However, the accuracy of the cotton HI of the six major global cotton countries—China, India, the United States, Pakistan, Brazil, and Australia—show a great deal of variability: 0.10–0.27 in Xinjiang, the China cotton area of China; 0.16–0.25 in the Yellow River Basin and Yangtze River Basin of China; 0.35–0.40 in India; 0.16–0.20 in the USA; 0.22–0.29 in Pakistan; 0.3–0.35 in Brazil; and 0.14–0.21 in Australia [3,22,26,27,28]. The variability in the cotton HI resulted in both large differences in cotton yields and the amount of cotton straw resources. Therefore, determining the causes of the differences in the cotton HI is important for the accurate measurement of cotton yield and cotton straw yield.
Plant biomass allocation is jointly regulated by biotic and abiotic factors, with biotic factors including plant genes or metabolic mechanisms and abiotic factors including environmental factors, which themselves include climatic–geographic factors, agronomic management factors, and soil nutrient factors [29]. The allocation of resources to reproductive and growth organs reflects the optimal allocation of resources by plants. The theory of optimal plant allocation explains the response of plants to the regulation of environmental factors, i.e., when a resource in the environment is constrained, plants prioritize the allocation of that resource to organs that can fully utilize it to ensure plant survival [30,31,32]. In agricultural production, the goal of breeding is to allocate more resources to reproductive organs, and cotton breeding has significantly increased cotton yields by improving cotton varieties. Therefore, cotton varieties are the fundamental factors leading to the allocation of cotton biomass [26,33,34,35]. Abiotic factors include climatic–geographic factors, such as temperature, longitude, latitude, and altitude above sea level [36,37]; agronomic management factors include planting density, plant height, fertilizer application, and soil nutrient factors, such as soil organic matter, available nitrogen, phosphorus, and potassium, total nitrogen, phosphorus and potassium, bulk weight, water content, and pH [12,38,39].
Drought is a major abiotic stress limiting the growth of land plants, soil moisture and nutrients are the main factors limiting plant growth in arid zones, and drought-induced water stress also severely affects plant biomass allocation [40,41,42,43]. About one-fifth of the world’s land is facing moderate to severe drought [44]. The Xinjiang cotton region of China is the largest arid cotton region in the world, and the main form of agriculture in the Xinjiang cotton region is irrigation-based oasis agriculture. During a sampling period in 2022 and 2023, we investigated and found that cotton cultivation in Xinjiang comprehensively uses under-membrane irrigation technology, with water drip irrigation every 6–10 days, on average, after seedling emergence. Additionally, we found that nitrogen, phosphorus, and potassium fertilizers are added to each drip irrigation, which is dripped into the cotton field with water, and that the fertilizer dosage is adjusted according to the growth period of cotton. Although the amount of irrigation and fertilizer applied will vary at each sampling point, they will all meet the growth requirements of cotton. As a result, the amounts of irrigation and applied fertilizer, which are the usual focus of previous studies on cotton in arid zones, were not included in the analysis in this study [45,46].
In this study, the effects of various abiotic factors on the cotton harvest index were analyzed using a combination of random forest analysis (RFA), to quantify the relative importance of each factor on the change in the cotton HI, and structural equation modeling (SEM), to analyze the relationships between the factors and the direct and indirect relationships of each factor on the change in the cotton harvest index. With the widespread use of machine learning in various research areas, the random forest algorithm is widely used in fields such as bio-informatics and computational biology [47,48]. Compared with traditional influencing factor research methods such as logistic regression, random forest analysis can not only reveal the importance of influencing factors but also show the contribution value of each influencing factor to the research objective. Structural equation modeling is currently one of the main approaches to ecological data analysis, with a modeling process driven by theoretical assumptions and the ability to quantify direct and indirect causal relationships between multiple variables simultaneously [49,50].
In this study, we collected and measured 21 environmental factors, including 4 climatic–geographic factors, 6 agronomic management factors, and 11 soil nutrient factors, to analyze the key drivers of the cotton HI of different variety types in arid zones. The following two key questions were addressed: (1) What is the cotton HI in the arid zone? How is it distributed? (2) What are the key drivers of changes in the cotton HI among different variety types in arid areas?

2. Materials and Methods

2.1. Experimental Site

In Xinjiang, China (73°40′∼96°18′ E, 34°25′∼48°10′ N), cotton is mainly grown in the southern and northwestern regions (Figure 1). The climate types in Xinjiang are mainly temperate arid and alpine; the soil types are mainly desert and mountain soils; and the annual rainfall is low and highly variable, with high evaporation. Xinjiang has annual sunshine hours of 2550–3500 h, which are long and intense [2], and large daily (12.9–15 °C) and annual differences in temperature [2,4,51]. The vegetation is sparse and varied, with drought-tolerant herbs and shrubs; the soil is infertile, low in water content, and saline and alkaline; and the type of agriculture is irrigated oasis agriculture. The Tianshan Mountains divide Xinjiang into southern Xinjiang and northern Xinjiang. Southern Xinjiang has less precipitation and a higher annual average temperature, while northern Xinjiang has more precipitation and a lower annual average temperature [52,53].

2.2. Sampling and Measurements

2.2.1. Cotton Sampling and Lint Harvest Index Calculation

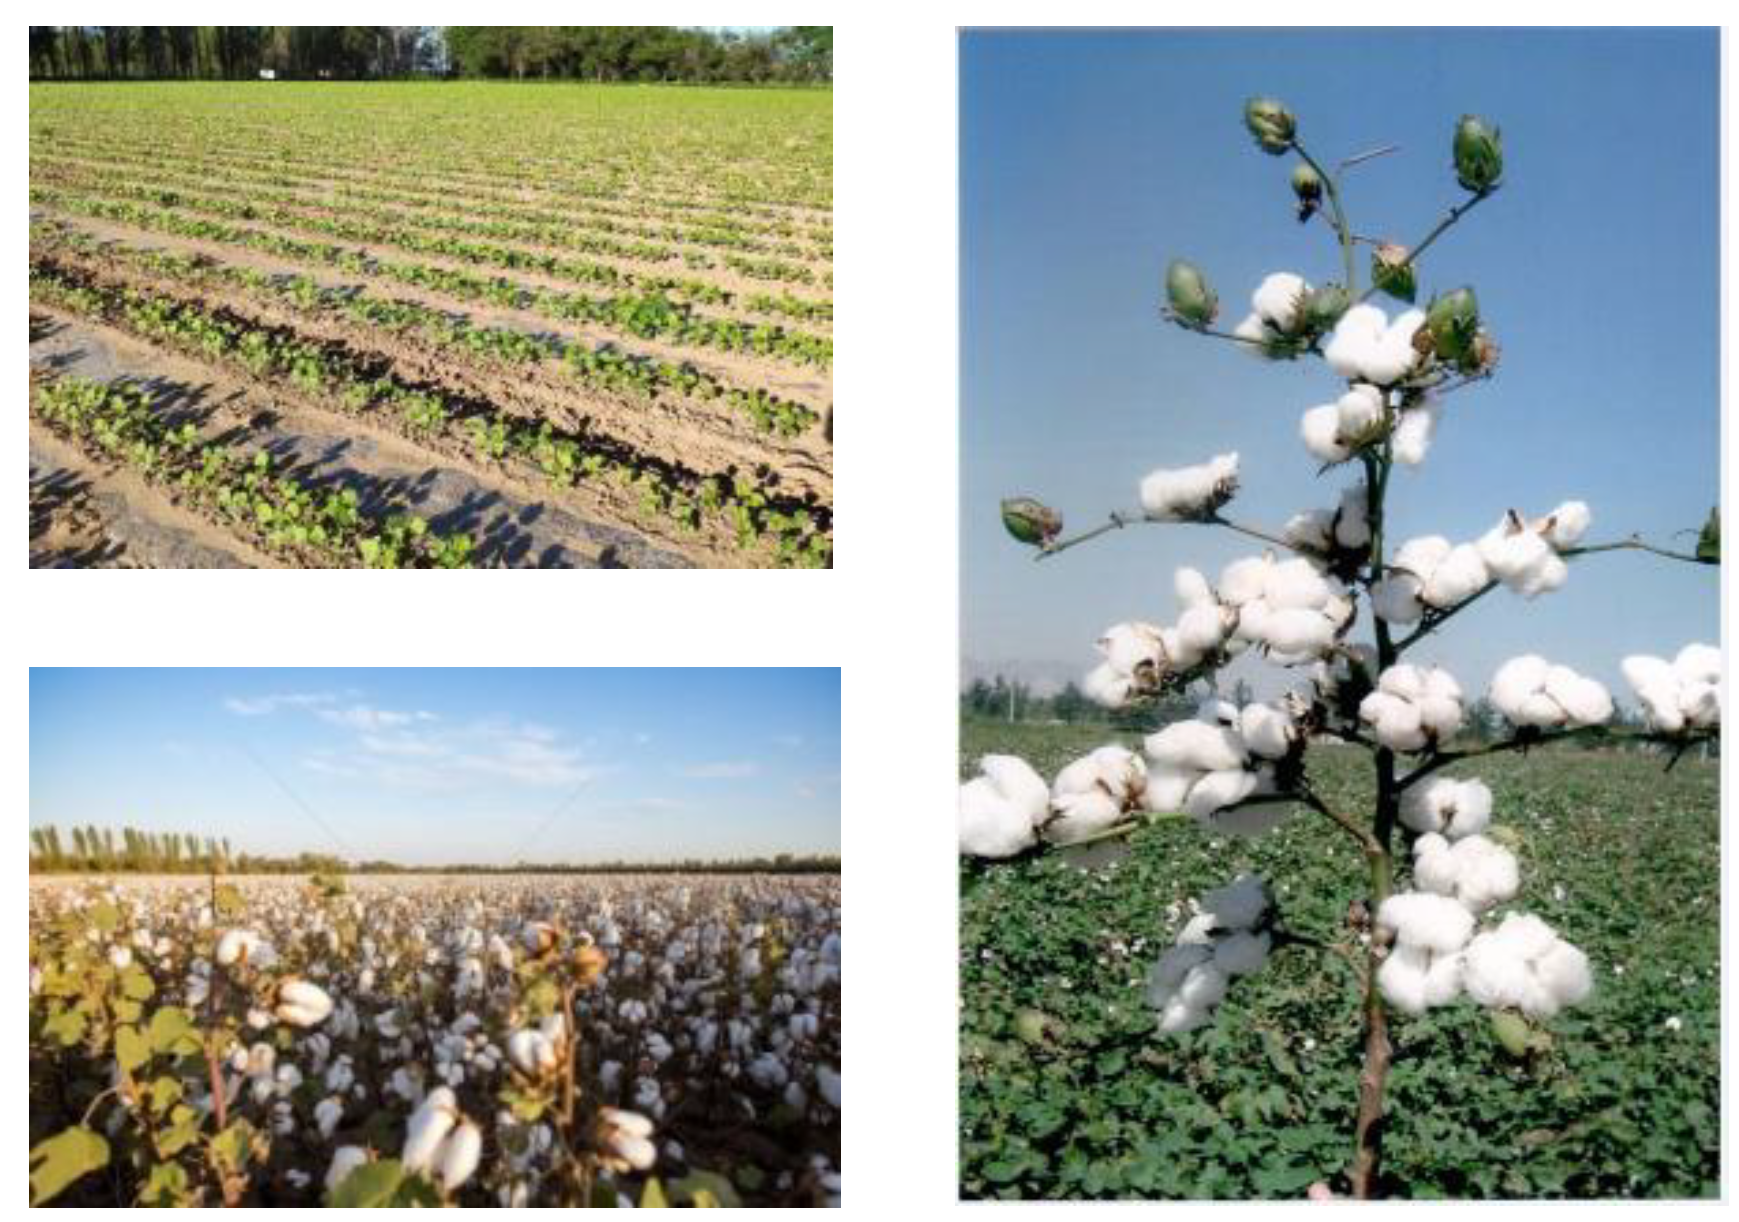
From 2022 to 2023, during the cotton maturity period, we selected a total of 11 sampling areas (five of these were in 2022 and six in 2023) for sampling in the whole of Xinjiang. In each sampling area, 10 plots larger than 1 hectare and more than 1 km apart were selected for sampling. There was a total of 110 plots, of which 44 were Xlzao varieties and 66 were Xlzhong varieties. Using the “five-point sampling method”, 125 cotton plants were manually mown close to the ground in each sampling plot, and the bolls were separated from the cotton plants for preservation (Figure 2). Dust and other impurities on the surface of the cotton and plants were removed so as not to affect the results. The oven was first set at 105 °C for 30 minutes of drying. Samples were then weighed and recorded after the oven temperature was set at 75 °C for continuous drying to constant weight. We calculated the harvest index as follows: Harvest index (HI) = Yield/DMA, where Yield is cotton lint production, Kg/ha, and DMA is aboveground biomass dry matter accumulation, Kg/ha [54,55].

2.2.2. Climatic–Geographic Factors

Temperature is one of the most important environmental factors affecting the growth and development of cotton. The longitude, latitude, and elevation of the sampling points directly affect the temperature at those points. Longitude affects the cycle of day and night and the temperature difference; latitude is related to the amount of solar radiation that can be received. The lower the latitude, the more sunlight is received and the higher the temperature; the higher the latitude, the less sunlight is received and the lower the temperature. A change in altitude above sea level will also cause the temperature to change. In high-altitude areas, it is cold, while in low-altitude areas, it is warmer [56]. The longitude, latitude, and altitude above sea level data of the sampling points were recorded by a Hua Si GPS receiver (X90 series) during cotton sampling. Growing degree days (GDDs) refers to the total sum of effective temperatures throughout the growing season of crops. It is an important indicator that reflects the heat demand of crop growth and development, and it can more accurately reflect the linear relationship between the crop growth rate and temperature [57]. Therefore, we selected temperatures ≥10 °C during the growing seasons of cotton (April, May, June, July, August, September, October) to calculate the total effective accumulated temperature of cotton during the whole reproductive period [Air temperature data were obtained from China Meteorological Information Sharing System (https://data.cma.cn, accessed on 12 June 2024)].

2.2.3. Agronomic Management Factors

Planting density is directly related to the yield, quality, and economic benefits of cotton, and it affects the efficiency of light energy use, ventilation, and light transmission of cotton. An appropriate planting density can improve the stress tolerance of cotton [58]. Planting density (Den, plants/m2): we use steel tape measure row spacing and planting distance of cotton to calculate. Next, determined the number of cotton plants per square meter in the sampling area and computed the number of cotton plants per hectare. Plant height (PHt, cm), during the cotton harvest, we designated more than five plots in each cotton sampling area and within each plot, we randomly chosen over ten cotton plants for measurement. Using a steel tape measure with an accuracy of 1 mm, the height from the base to the top growth point of each cotton plant was measured. Calculated and considered the average height across all plots within the sampling area as the representative plant height (PHt, cm). Lint yield (LY, Kg/ha) and cotton straw yield (CSY, Kg/ha), measured the weight of lint and straw from 25 randomly selected plants in each sampling site. From this, the weight of individual lint and straw plants was calculated. Subsequently, the lint and straw yields per hectare for the sampling site were computed based on the planting density specific to each site.

2.2.4. Soil Nutrient Factors

Soil nutrient factors include both the physical and chemical properties of soil; the soil water content and bulk density are important indicators of the physical properties of soil. Soil volumetric water content per unit volume refers to the ratio of the volume of the water contained in a unit volume of soil to the total volume of soil. It affects the aeration and structure of soil. Soil moisture content (SMC, g/cm3): use a ring knife (Φ200) obtained the top layer of soil and then oven-dried at 105 °C to constant weight. First, we weighed before and after drying soil samples in the aluminum boxes, and then, calculated the water content per unit volume of soil. Bulk density (BD, g/cm3), we measured the weight per unit volume of soil by using a ring knife (Φ200), then removing the top layer of soil and drying it in an oven at 105 °C. Soil chemistry is an important indicator of soil fertility and environmental function, including pH, organic matter, and nutrients. pH refers to the acidity or alkalinity of the soil, which affects nutrient availability and microbial activity. Different plants have different pH requirements. Soil organic matter (SOM) refers to the amount of organic matter in the soil that can provide nutrients, improve soil structure, increase water-holding capacity, and enhance microbial activity. Soil nutrients are the nitrogen, phosphorus, and potassium content of soil. Quick-release nitrogen, phosphorus, and potassium refer to the amount of nitrogen, phosphorus, and potassium that plants can absorb directly, reflecting the nutrient supply capacity. Total nitrogen, phosphorus, and potassium refer to the nutrients that include all forms of nitrogen, phosphorus, and potassium, which can be used to assess long-term fertility [59]. The specific measurements were obtained as follows: Regarding soil organic matter (SOM, g/Kg), potassium dichromate capacity was determined by the external heating method. Total Nitrogen in Soil (TN, g/Kg) was determined using Perchloric Acid–Sulfuric Acid Digestion (FOSS 1035 Automatic Nitrogen Determination, Kjeltec™ 9, FOSS, Hilleroed, Denmark). Total Phosphorus in Soil (TP, g/Kg) was determined using the acid dissolution–molybdenum antimony colorimetric method (Agilent CARY60 UV spectrophotometer, Cary 60 UV-Vis, Agilent, Santa Clara, CA, USA). Total Potassium in Soil (TK, g/Kg) was determined using Acid Dissolution–Atomic Absorption (Thermo Fisher S-Series Atomic Absorption Spectrometer, ICE™ 3300GF, Thermo Fisher, Waltham, MA, USA). Alkali Hydrolyzable Nitrogen in Soil (ASN, mg/Kg) was determined using the alkali-diffusion method. Available Phosphorus in Soil (AP, mg/Kg) was determined using the Sodium bicarbonate leaching–Molybdenum antimony colorimetric method (Agilent CARY60 UV spectrophotometer, Cary 60 UV-Vis, Agilent, Santa Clara, CA, USA). Available potassium in soil (AK, mg/Kg) was determined using Ammonium Acetate Leach–Atomic Absorption (Thermo Fisher S-Series Atomic Absorption Spectrometer, ICE™ 3300GF, Thermo Fisher, Waltham, MA, USA). pH was measured using a pH meter (PHS-2F, Shanghai Thunder Magnetism Instrument Plant, Shanghai, China). Soil Electrical Conductivity (EC, mS/cm) was measured using a conductivity meter (DDSJ-308F, Shanghai Thunder Magnetism Instrument Plant, Shanghai, China).

2.3. Data Analysis

GraphPad prism 10.1.2 was used to plot the comparative cotton harvest index of New Land Early and New Land Medium varieties and the linear regression of the cotton harvest index with each influencing factor in 2022 and 2023. In ArcGIS 10.8, we performed spatial interpolation using the Kriging interpolation method by importing the sampling area map and the longitude and latitude coordinates of the sampling points. Kriging interpolation is a spatial interpolation method based on the principle of similarity in the first law of geography. It performs the best-unbiased estimation by semi-variogram [60]. It takes into account the spatial relationships between sample points and provides an optimal unbiased estimation of the values of the unknown points by means of a variational function and structural analysis. The core of Kriging’s algorithm is the semi-variational function, which is used to quantify the spatial variability in the observations as a response to the distance between the observations. In this experiment, the ordinary Kriging method in Kriging interpolation was chosen for analysis based on the sampling point characteristics and data characteristics at the same time after preliminary testing and comparison, and the trend function was chosen to be represented by a second-order polynomial. The Shapiro–Wilk (S-W) test was performed on the data using SPSS27 before performing the interpolation analysis. It was found that p < 0.05, that is, the data did not conform to a normal distribution, so the data were log-transformed first for Kriging interpolation analysis. Given a control variable Z(x) defined at spatial location x, the experimental semi-variational function of Z is estimated from the observed data as:
γ ^ ( h ) = E [ ( Z ( x ) Z ( x + h ) ) 2 ] 2
where Z(x) and Z(x + h) are any pair of observations of Z at distance h and E is the average operator among all pairs of points with similar h, grouped at discrete h intervals [61].
The spatial variability in the cotton yield index was expressed by calculating the semi-variance function of the cotton yield index. The nugget effect analysis (C0/C0 + C) is defined as nugget to still and is used to describe the proportion of spatially independent random factors in the total variability in variables at a given scale. C is the value at which the variance function reaches a stationary state, representing the maximum variability in the spatial variable across the entire study area. In Kriging interpolation, C serves as a baseline measure of overall spatial variability and is a crucial parameter for calculating the weight coefficients. C0 represents spatial variation over very short distances (theoretically zero distance), typically attributed to measurement errors or small-scale, random spatial variations not captured by the model. C0 is incorporated into the model to account for spatial variability even at close ranges. The size of the nugget value reflects the proportion of the random part; the larger the nugget value, the greater the spatial variability caused by the random part. If the ratio is <25%, it means that the system has strong spatial correlation; if the ratio is between 25% and 75%, it means that the system has moderate spatial correlation; and if the ratio is >75%, it means that the system has weak spatial correlation.
M E = i = 1 N [ Z ( s i ) z ( s i ) ] n
R M S E = i = 1 N [ Z ( s i ) z ( s i ) ] 2 n
R M S S E = i = 1 N Z ( s i ) z ( s i ) σ ( s i ) ^ n
Intra-group correlation heat maps are a color-coded visualization tool used to display the correlations between variables in a dataset. Typically, the correlation coefficient is used to measure the correlations. The Spearman correlation coefficient is used to measure the monotonic relationship between two variables; it is not constrained by the distribution pattern of the data. Intra-group correlation heat maps between the cotton harvest index and the influencing factors were analyzed and plotted using Origin2022 software. Random forest (RF) is an ensemble learning algorithm that constructs multiple decision trees and combines the results of these trees for classification or regression. It can directly handle high-dimensional data and provide an assessment of the importance of features, thereby improving the stability and accuracy of predictions. In R4.4.1, a random forest model was used to predict the influencing factors of the cotton harvest index by employing the random forest package. Structural equation modeling (SEM) is a statistical framework that combines multiple structural models to model multivariate relationships. It consists of two parts: a measurement model and a structural model. It can analyze multiple dependent variables simultaneously and allows for measurement error in both independent and dependent variables, thereby improving the accuracy of the analysis. The Piecewise-SEM package in R4.4.1 was used to perform the structural equation modeling of the cotton harvest index and the influencing factors and to synthesize and analyze the direct and indirect effects of the influencing factors on the cotton harvest index.

3. Results

3.1. The Harvest Index and Spatial Distribution of Cotton in Arid Areas

In 2022, the mean value of the cotton harvest index was 0.299 for the XLzao variety types and 0.306 for the XLzhong variety types. One-way ANOVA showed that there was a highly significant difference (p < 0.01) between the cotton harvest index of the two variety types. In 2023, the mean value of the cotton harvest index was 0.298 for the XLzao variety types and 0.305 for the XLzhong variety types, and the results of the one-way ANOVA showed that there was a significant difference (p < 0.05) between the cotton harvest index of two variety types. However, there was no difference in the cotton harvest index between the XLzao and XLzhong variety types between the two years, indicating that the variety type has a significant effect on the cotton harvest index. The results of the two years’ data showed that the cotton harvest index of the XLzhong variety types was greater than that of the XLzao variety types, with an average of 2.3 percent higher in both years (Figure 3).
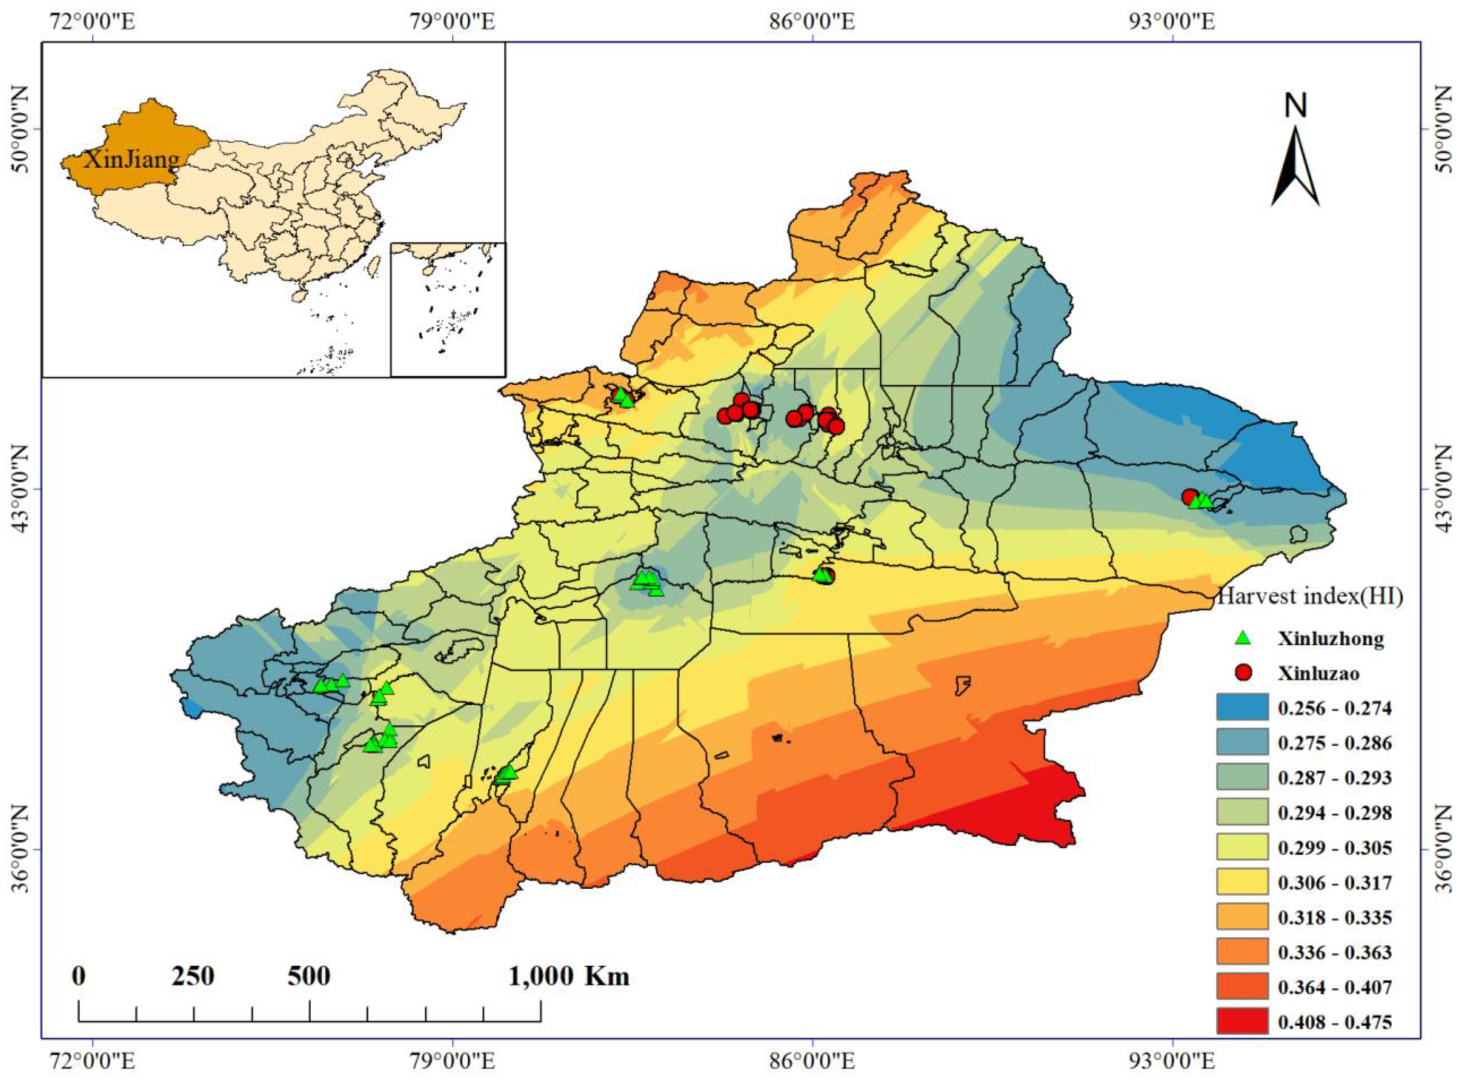
The spatial distribution map of the cotton harvest index was analyzed using ordinary Kriging interpolation in Arcgis, and the results showed that the value of the overall cotton harvest index in Xinjiang was in the range of 0.275–0.318. The XLzao variety types of cotton are mainly planted in north Xinjiang; the XLzhong variety types of cotton are mainly planted in southern Xinjiang (Figure 4).
In Table 1, the block base ratio of the overall cotton harvest index in Xinjiang is 19.66%, with very strong spatial autocorrelation. Combined with the analysis of the coefficient of variation, the overall cotton harvest index in Xinjiang is 4.66%, indicating that there is basically no difference in the spatial distribution of the cotton harvest index in Xinjiang. Table 2 shows the spatial interpolation results of the cotton harvest index. The ME and RMSE values are very close to 0, and the RMSSE value is greater than 0.85, indicating that the interpolation results are more accurate and that the results are credible.

3.2. Key Drivers of the Cotton Harvest Index in Arid Zones

3.2.1. Heat Map of the Intra-Group Correlation of the Cotton Harvest Index and Its Influencing Factors

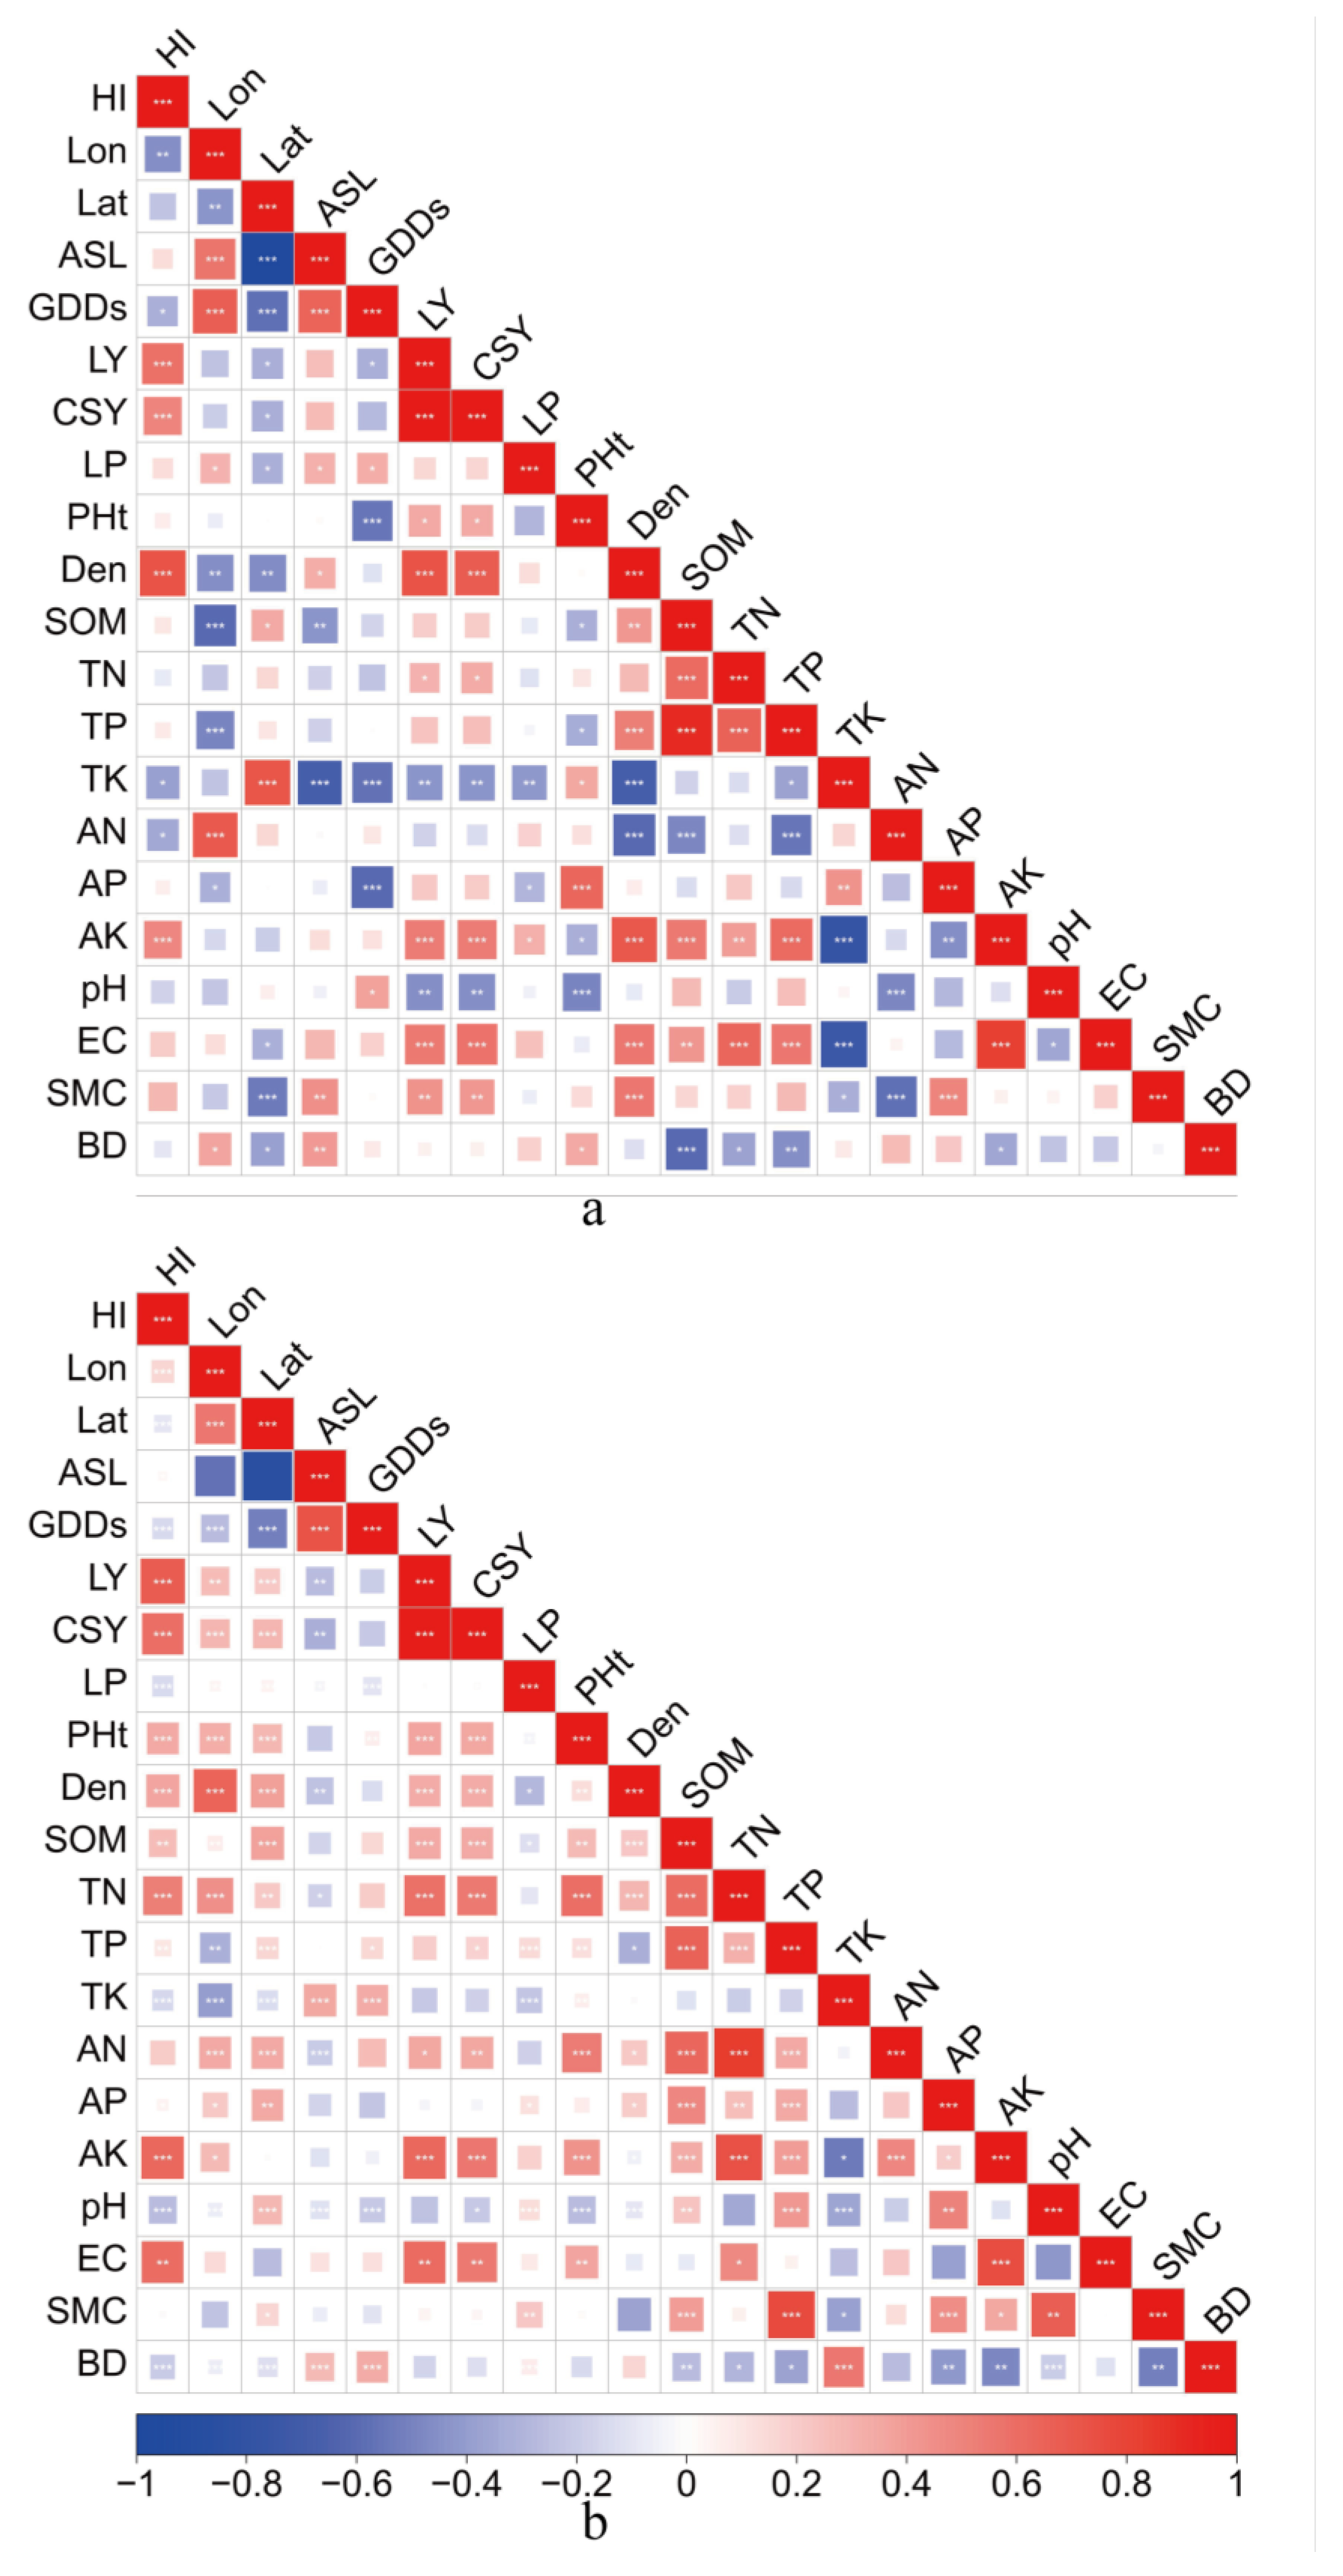
In the Spearman correlation analysis heat map, the results showed that the overall cotton harvest index in Xinjiang was significantly and positively correlated with planting density, total aboveground biomass, and lint yield, among the agronomic management factors (p < 0.001); it was significantly and positively correlated (p < 0.001) with AK and electrical conductivity, among the soil nutrient factors. In addition, the cotton harvest index was clustered with AK. The cotton harvest index was significantly and positively correlated (p < 0.001) with planting density, among agronomic management factors, and the cotton harvest index was clustered with SMC in the XLzao variety types. The cotton harvest index of the XLzhong variety types was significantly and positively correlated with the total aboveground biomass and LY of cotton, among the agronomic management factors (p < 0.001); positively correlated with TN, among the soil nutrient factors (p < 0.01); and significantly and positively correlated with AK, among the soil nutrient factors (p < 0.001). The cotton harvest index of the XLzhong variety types clustered with PHt and TN (Supplementary Figure S1a and Figure 5a,b).
The tree charts on the left and top of the Spearman correlation analysis heat map show the clustering results between different factors (Supplementary Figure S1b). Lat and Lon are clustered together in the climate geography factor. AGB, CSY, and LY are clustered together in the agronomic management factors, and SOM, AN, AP, TK, TP, SMC, and pH are clustered together in the soil nutrient factors. Based on the color of the boxes and the relevance symbols, Lon and Lat are positively off, GDDs and ASL are positively correlated, and Lon and Lat are negatively correlated with GDDs and ASL, among the climate geography factors. CSY, AGB, and LY are significantly and positively correlated with each other, among the agronomic management factors. TN, AN, and SOM are positively correlated with each other, and pH was negatively correlated with TN, AN, EC, and AK, among the soil nutrient factors (Supplementary Figure S1b).

3.2.2. Importance Analysis of Influencing Factors Based on the Random Forest Model

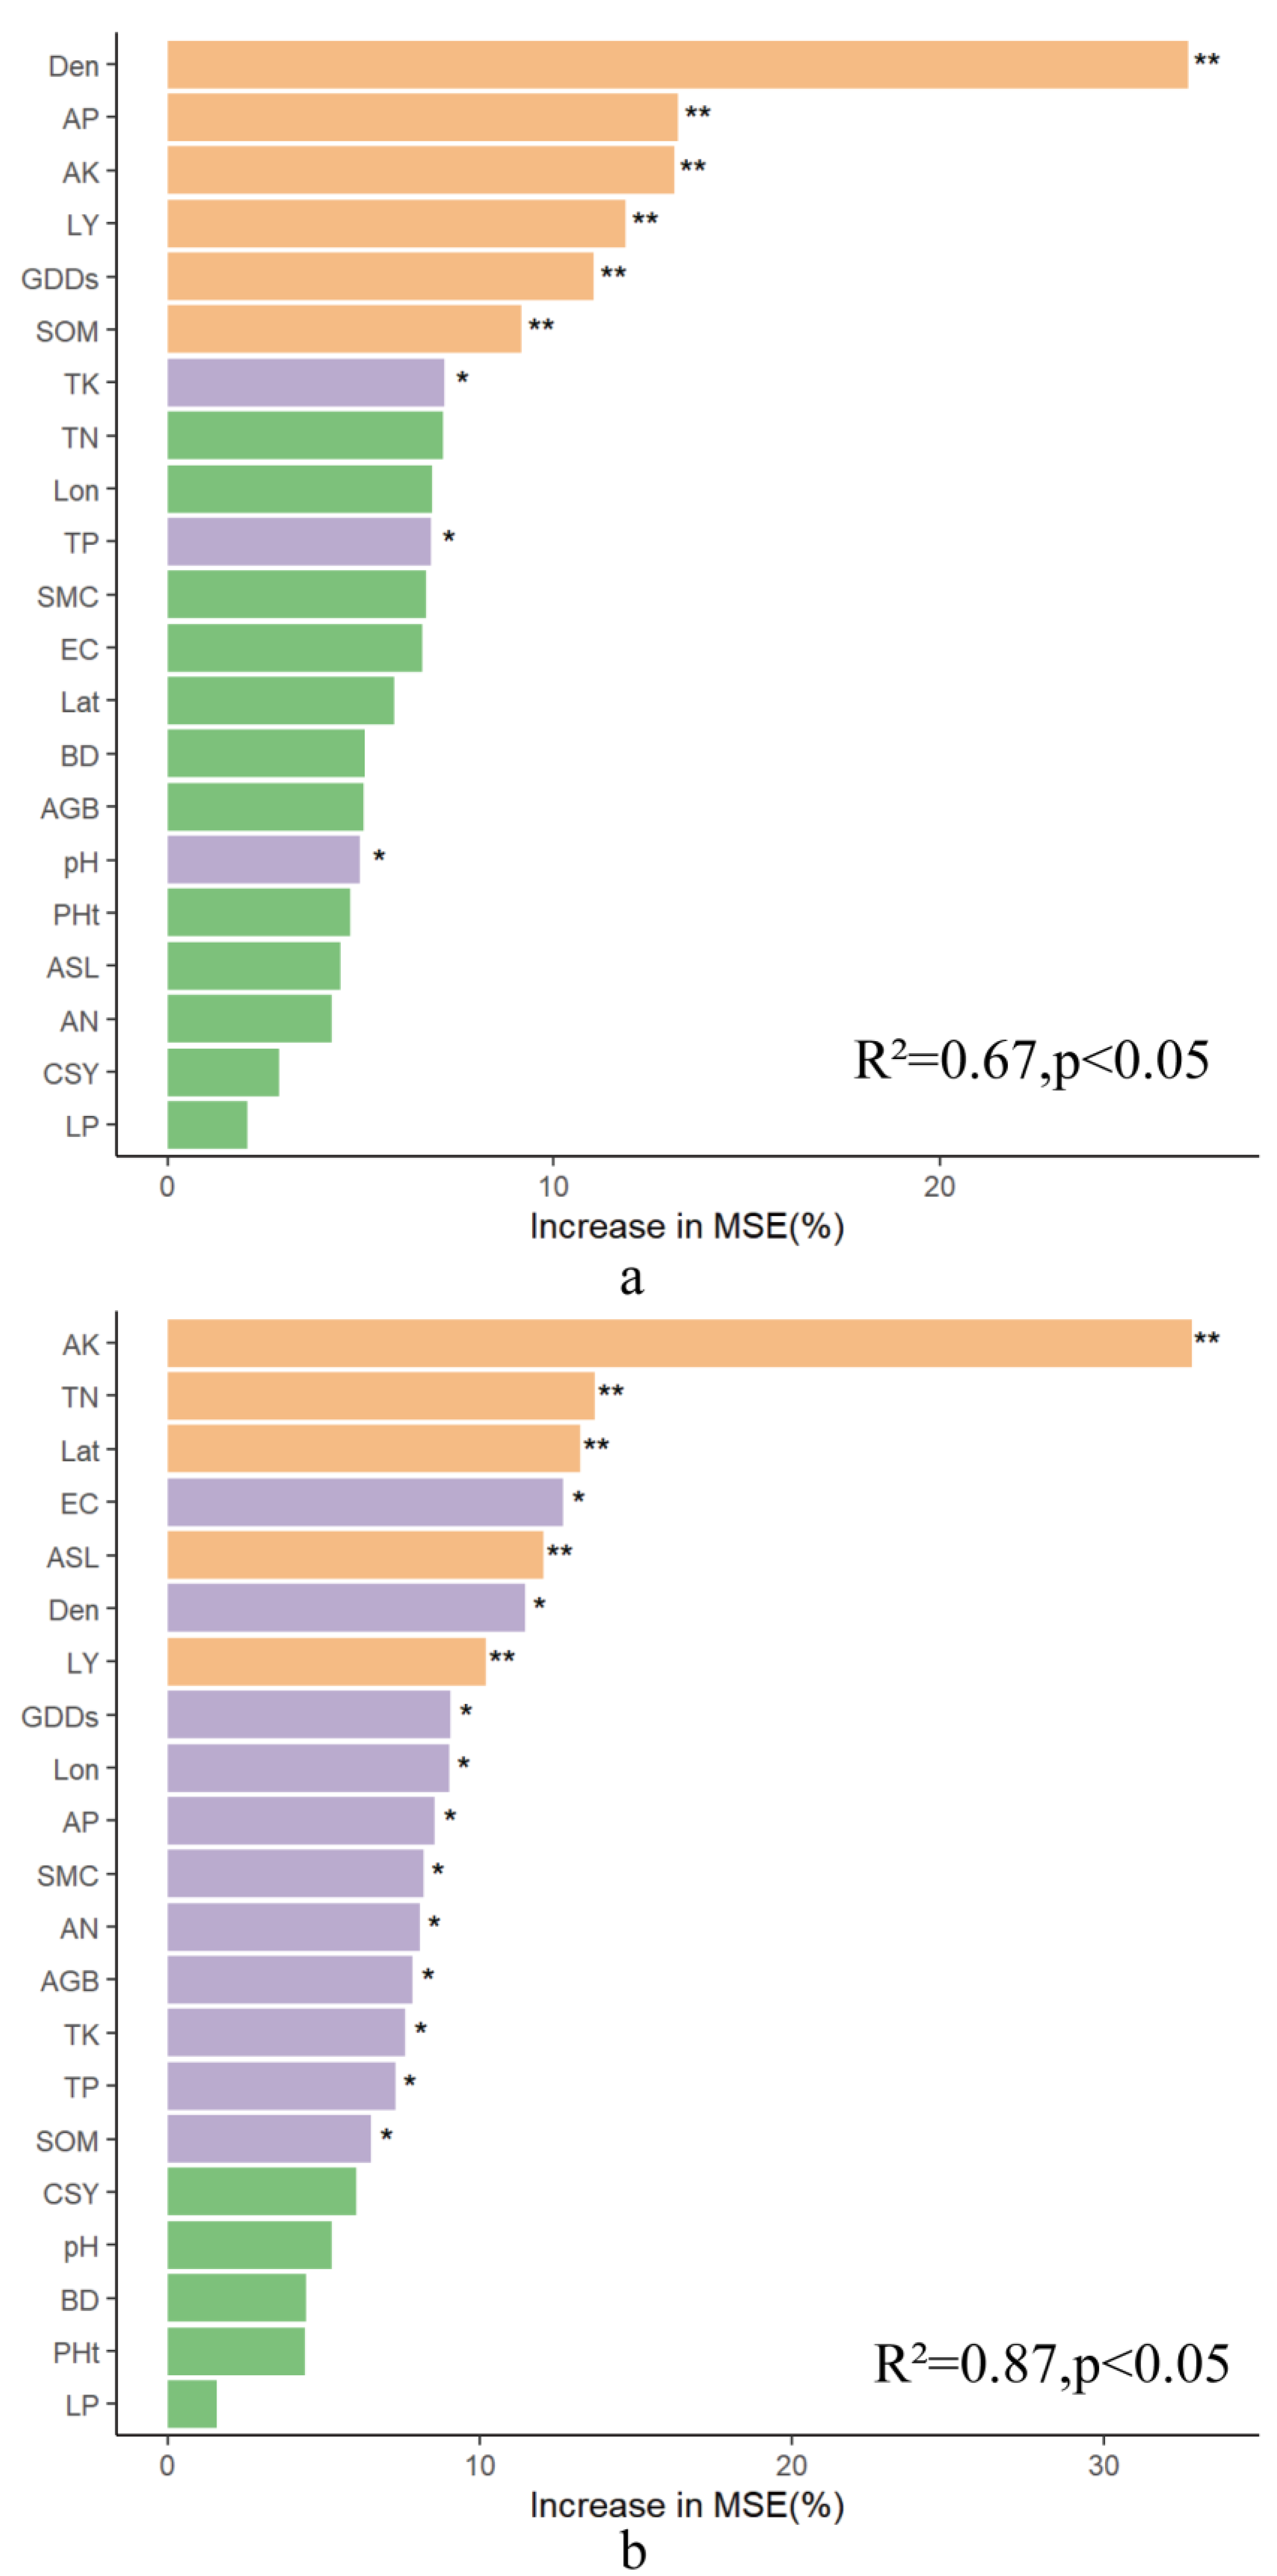
The relative importance of all the influencing factors on the harvest indices of the three types of cotton was analyzed by random forest analysis, which explained 84%, 67%, and 87% of the harvest indices of Xinjiang cotton as a whole, the XLzao variety types, and the XLzhong variety types, respectively. The relative importance of the factors influencing the overall cotton harvest index in Xinjiang, in order of importance, was AK (importance > 30%), Den (importance > 20%), and EC, Lat, LY, AP, AN, and GDDs (importance > 10%) (p < 0.01) (Supplementary Figure S2). The relative importance of the factors influencing the cotton harvest index of the XLzao variety types, in order of importance, was as follows: Den (importance > 25%), AK, AP, and GDDs (importance > 10%), and SOM, TK, Lon, and EC (importance > 5%) (p < 0.01) (Figure 6a). The relative importance of the factors influencing the cotton harvest index of the XLzhong variety types, in order of importance, was as follows: AK (importance > 30%), Lat, TN, EC, LY, and Lon (importance > 10%) (p < 0.01), and Den and ASL (importance > 10%) (p < 0.05) (Figure 6b).

3.2.3. The Effects of Influencing Factors on the Cotton Harvest Index Analyzed Based on the Structural Equation Model (SEM)

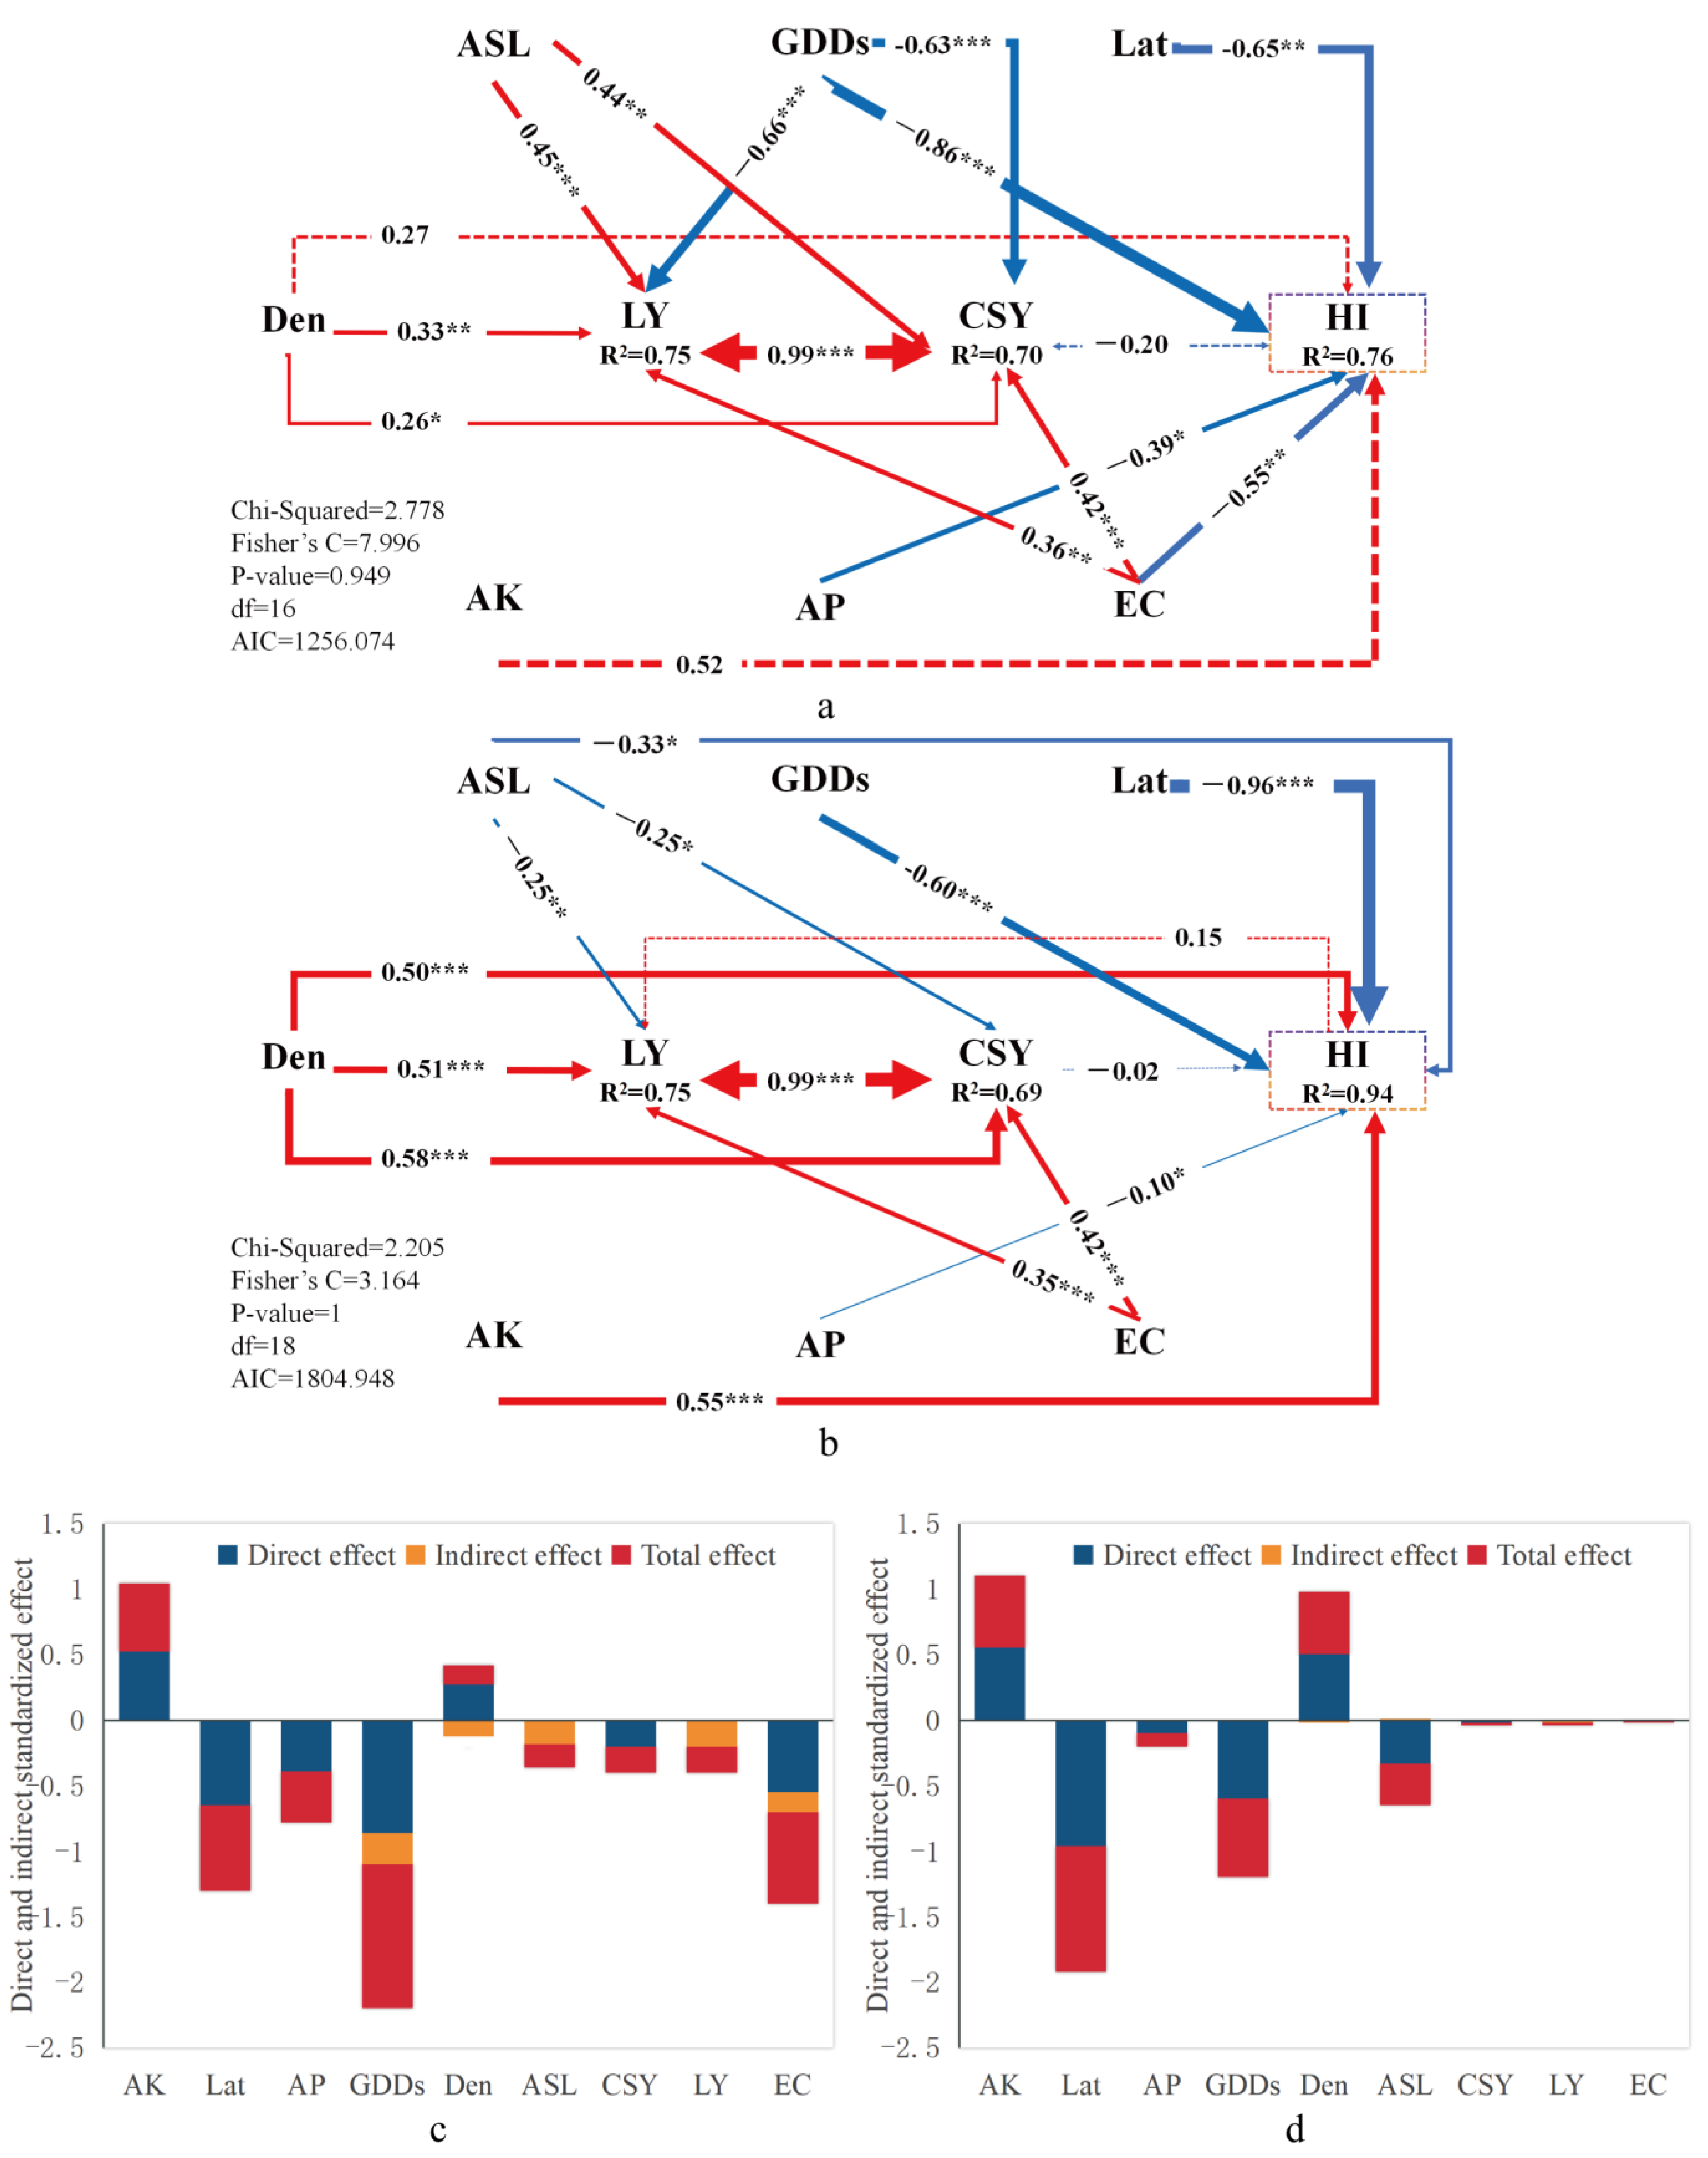
Nine impact factors, including ASL, Lat, and GDDs, among the climatic–geographic factors, LY, CSY, and Den, among the agronomic management factors, and AK, AP, and EC, among the soil nutrient factors, were selected by combining the above analyses, and structural equation modeling (SEM) was applied to further analyze the direct and indirect effects of the nine factors on the HI. The direct effect is defined as the immediate influence of the independent variable on the dependent variable without the involvement of any mediating variables. In structural equation modeling (SEM), this relationship is typically represented by the direct path coefficient from the independent variable to the dependent variable. The indirect effect, on the other hand, refers to the influence of the independent variable on the dependent variable through one or more mediating variables. Specifically, the independent variable first impacts the mediating variable(s), which subsequently affects the dependent variable. Calculating the indirect effect is more complex and involves multiplying the path coefficients along the indirect paths, specifically the path coefficient from the independent variable to the mediating variable and the path coefficient from the mediating variable to the dependent variable. SEM explained 85% of the variation in the overall cotton harvest index in Xinjiang, 76% of the variation in the XLzao variety types, and 94% in the XLzhong variety types. For the overall cotton harvest index in Xinjiang, the largest direct effects on the cotton harvest index were Lat (−0.99) and ASL (0.89), among the geographic factors, followed by GDDs (−0.82) and AK (0.88), among the soil physicochemical factors, and EC (−0.55) followed by Den (0.27), among the management factors (Supplementary Figure S3). For the XLzao variety types, the largest direct effects on the cotton harvest index were GDDs (−0.86) and Lat (−0.65), among the geographic factors, and EC (−0.55) and AP (−0.39), among the soil physicochemical factors, followed by AK (0.52) (Figure 7a). For the XLzhong variety types, the largest direct effects were Lat (−0.96), among the geographic factors (−0.96), GDDs (−0.60) followed by ASL (−0.33) and Den (0.50), among the management factors, and AK (0.55), among the soil physicochemical factors (Figure 7b).
The direct and indirect effects of SEM showed that in the influencing factors of the overall cotton harvest index in Xinjiang, AK and Den had a positive effect, while Lat, AP, and GDDs had a negative effect, which affected the cotton harvest index mainly through direct effects (Supplementary Figure S3b). For the XLzao variety types, AK and Den had a positive effect on the cotton harvest index, while Lat, AP, GDDs, and EC had a negative effect, mainly through direct effects (Figure 7c). For the XLzhong variety types, AK and Den had a positive effect, while Lat, GDDs, and ASL had a negative effect, which was mainly affected by the direct effect (Figure 7d).

3.2.4. Regression Analysis of Cotton Lint Yield, Cotton Stalk Yield, and Available Potassium with the Cotton Harvest Index

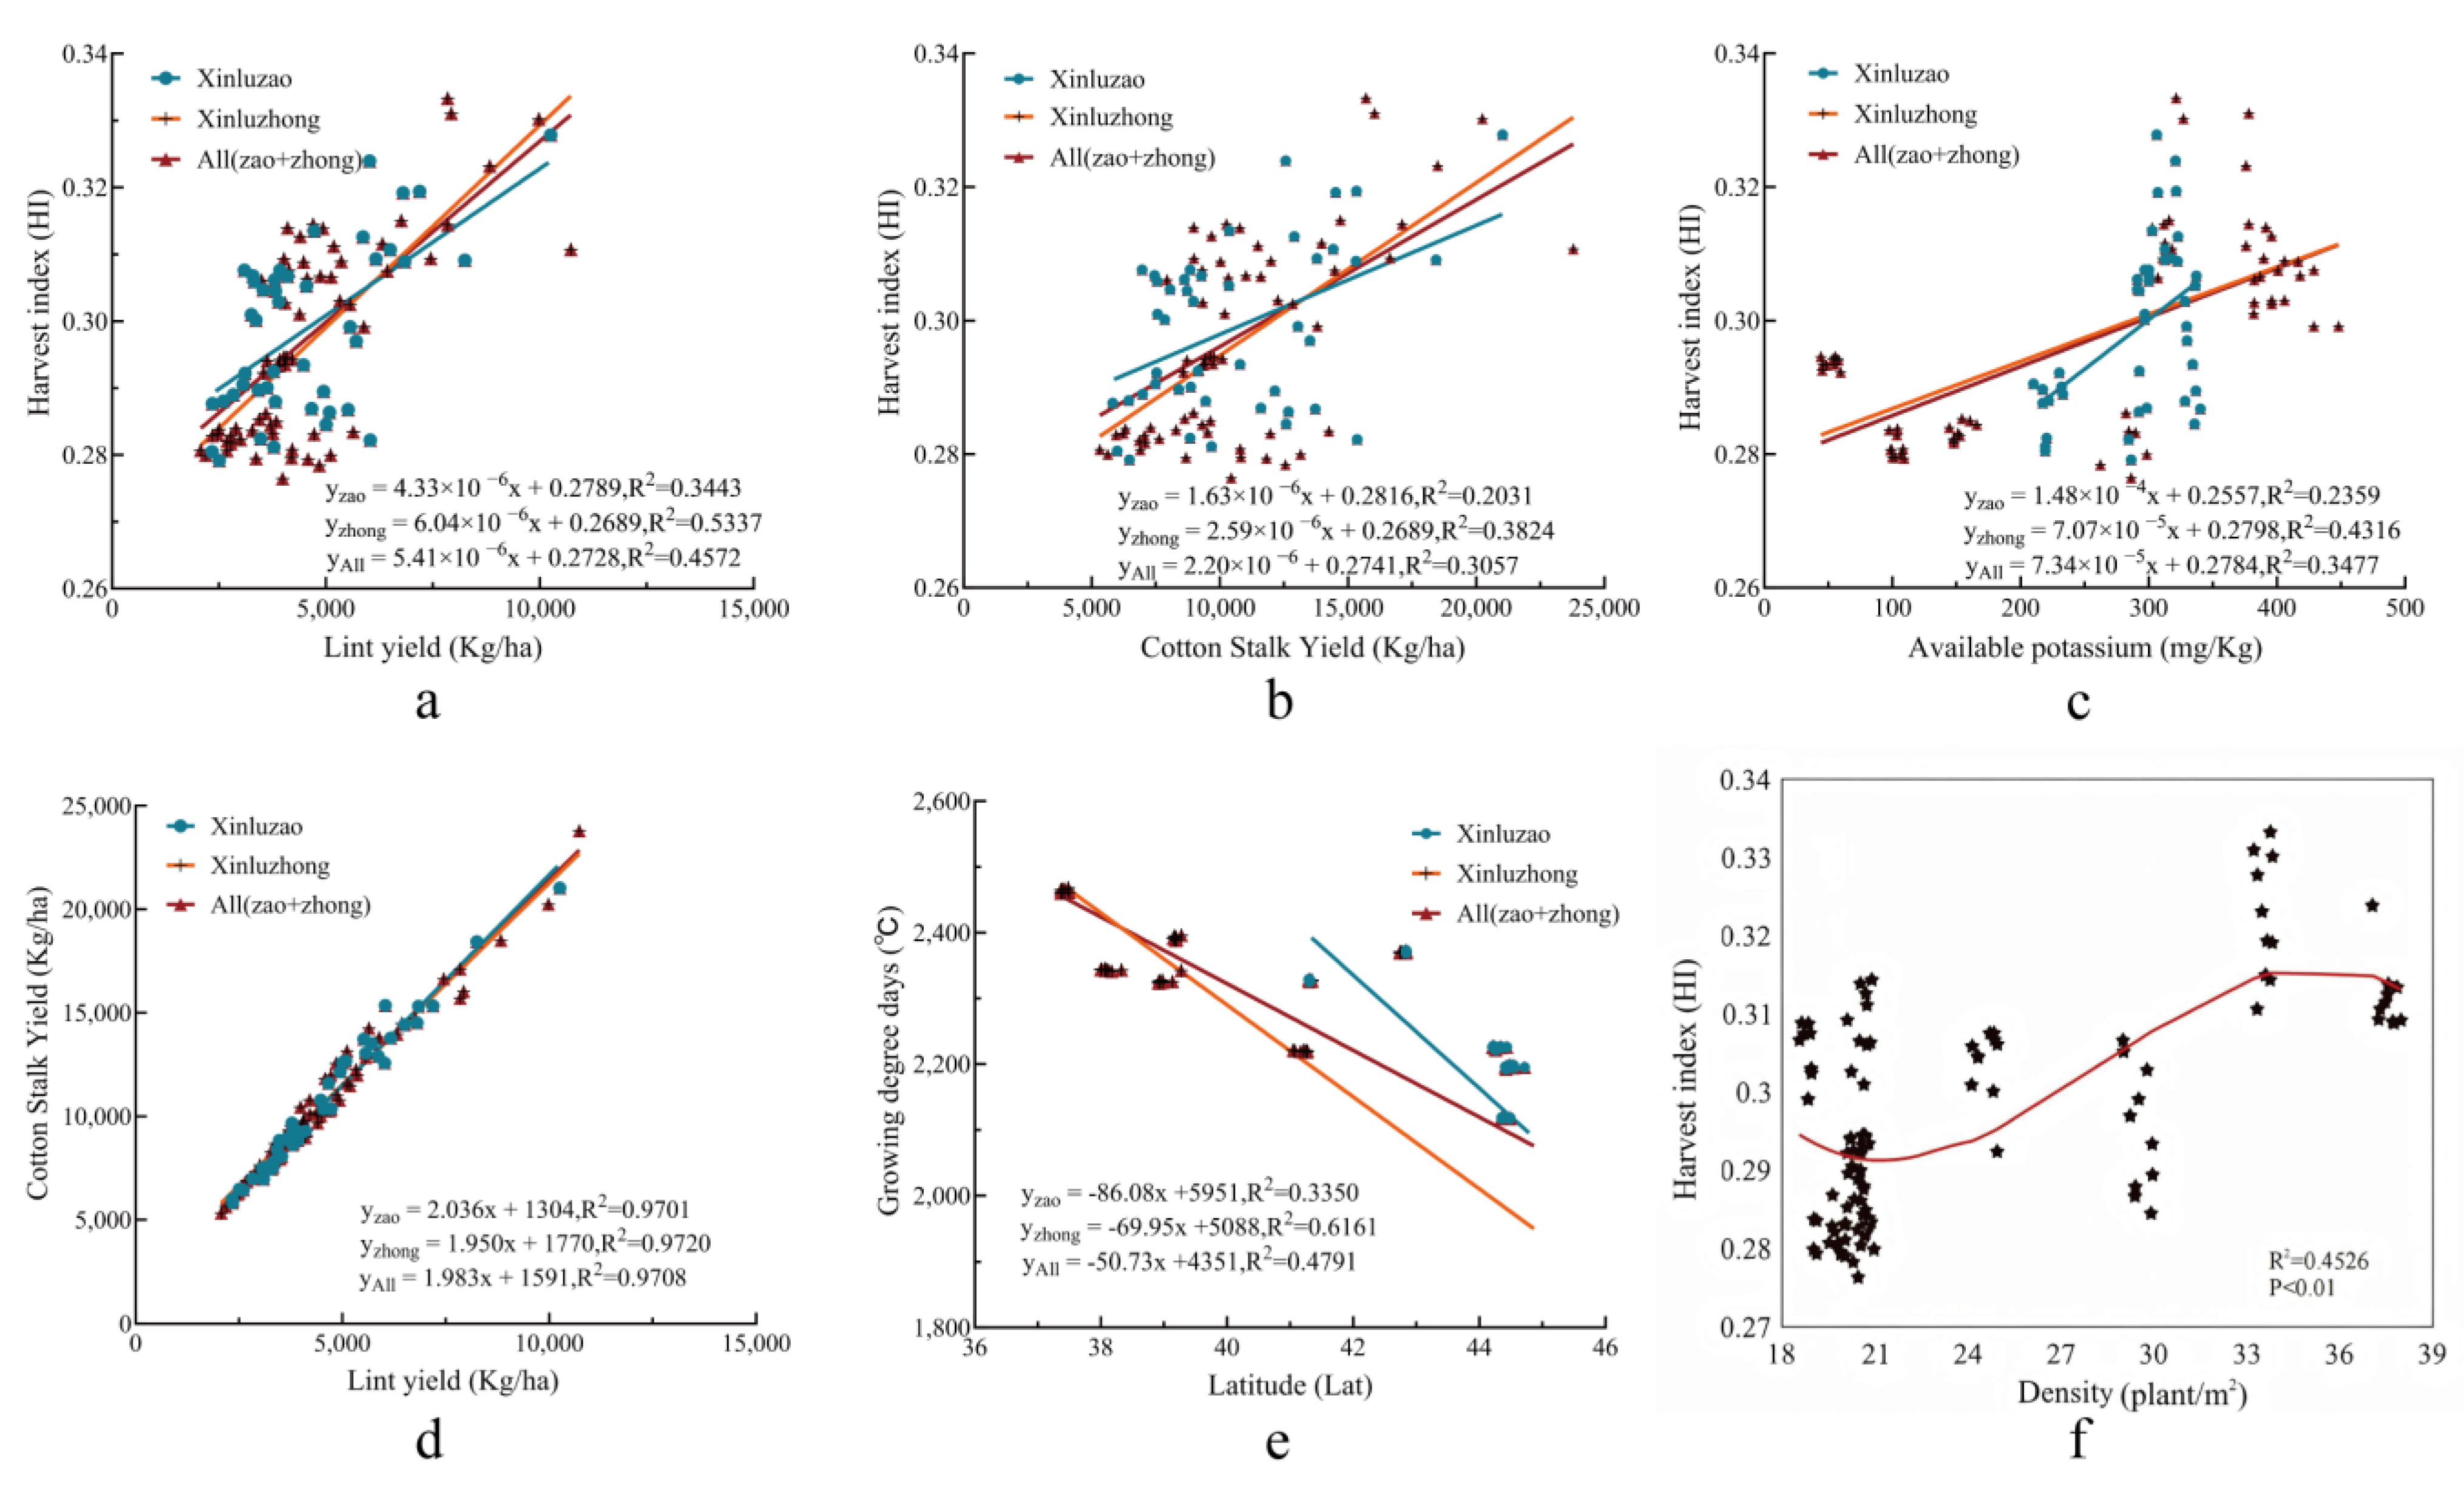
The cotton lint yield are positively correlated with the harvest index. The correlation equation between the cotton lint yield of the XLzao variety types and the harvest index is as follows: y = 4.33 × 10⁻⁶x + 0.2789 (R2 = 0.3443). The equation for the XLzhong variety types is as follows: y = 6.04 × 10⁻⁶x + 0.2689 (R2 = 0.5337). The equation for the Xinjiang is as follows: y = 5.41 × 10⁻⁶x + 0.2728 (R2 = 0.4572) (Figure 8a). The correlation equation between the cotton stalk yield of the XLzao variety types and the harvest index is as follows: y = 1.63 × 10⁻⁶x + 0.2816 (R2 = 0.2031). The equation for the XLzhong variety types is as follows: y = 2.59 × 10⁻⁶x + 0.2689 (R2 = 0.3824). The equation for Xinjiang is as follows: y = 2.20 × 10⁻⁶x + 0.2744 (R2 = 0.3057) (Figure 8b). The correlation equation between the available potassium of the XLzao variety types and the harvest index is as follows: y = 1.48 × 10⁻⁴x + 0.2557 (R2 = 0.2359). The equation for the XLzhong variety types is as follows: y = 7.07 × 10⁻⁵x + 0.2798 (R2 = 0.4316). The equation for Xinjiang is as follows: y = 7.34 × 10⁻⁵x + 0.2784 (R2 = 0.3477) (Figure 8c). The correlation equation between the cotton lint yield of the XLzao variety types and the cotton stalk yield is as follows: y = 2.036x + 1304 (R2 = 0.9701). The equation for the XLzhong variety types is as follows: y = 1.950x + 1770 (R2 = 0.9720). The equation for Xinjiang is as follows: y = 1.983x + 1591 (R2 = 0.9708) (Figure 8d). Variation in latitude significantly affects cumulative and instantaneous temperatures, and there was a significant negative correlation (R2 = 0.4791) between the latitude of the sampling sites and the effective cumulative temperature. There was a significant negative correlation (R2 = 0.4791) between them (Figure 8e). The HI was minimized when the planting density was 21–24 plants/m2, and the HI was maximized when the planting density was 33–36 plants/m2. It then showed a decreasing trend with increasing planting density (Figure 8f).

4. Discussion

4.1. The Cotton Harvest Index and Its Spatial Distribution in Arid Areas

Cotton-growing areas in Xinjiang are characterized by a dry climate, abundant light and heat resources, and a large number of people and little land, which is conducive to the promotion of large-scale cultivation and mechanized production. This has gradually formed the “world cotton look at China, China cotton look at Xinjiang” situation [62]. The harvest index of cotton in the Xinjiang cotton region was much higher than that in the non-arid regions, which were 0.15 in Xinjiang, 0.20 in the Yellow River Basin and Yangtze River Basin of China, 0.30 in India, 0.18 in the USA, 0.25 in Pakistan, 0.30 in Brazil, and 0.19 in Australia. This may be closely related to the improvement in cotton varieties in Xinjiang, the planting pattern of “short, dense, and early”, the widespread use of ground-film mulching and drip irrigation, and the high degree of mechanization of the planting process [63,64].
In this study, the cotton harvest index of the XLzao variety types was 0.299, and that of the XLzhong variety types was 0.306. The cotton harvest index of the XLzao variety types was significantly lower than that of the XLzhong variety types (Figure 2). The XLzao variety types are mainly planted in north Xinjiang, and the XLzhong variety types are mainly planted in south Xinjiang. The theoretical growing period of cotton of the XLzao and XLzhong variety types is about 120 days and 133 days, respectively. However, in actual production, due to the early spring thawing and delayed winter freezing of the land in the cotton-growing areas of the XLzhong variety types, the growing period of cotton of the XLzhong variety types is much higher than that of the XLzao variety types. Also, the light and heat resources in the planting area of the middle variety type in XLzhong are generally higher than those in the planting area of the early variety type in XLzao [65]. All of these factors may also account for the differences in the cotton harvest indices between the two variety types in Xinjiang [2,52,66,67].

4.2. Key Drivers of the HI in Arid Zones

The overall latitude of Xinjiang, China, is 34°25′ N–49°10′ N, and the overall latitudinal distribution of the experimental sampling sites in this study is 37°20′ N–44°35′ N, which belongs to the mid-latitude region. Growing degree days can represent the comprehensive effect of temperature on crop growth [68], and temperature is the factor most closely related to the timing and rate of cotton growth and development [69]. Temperature significantly affects cotton germination, growth, pollination, maturity, biomass allocation, and yield [70,71,72,73,74]. This has also been found in studies of other plants and crops [75,76,77]. In this study, the effect of growing degree days (GDDs) on the cotton yield index is second only to that of latitude (Figure 7). While the direct influence of GDDs on the cotton yield index is less pronounced compared to latitude, GDDs indirectly affect the cotton yield index by influencing both the cotton lint yield and straw yield [78]. This variability in the degree of influence on lint and straw yields results in less pronounced changes in the cotton yield index. Changes in altitude not only impact temperature but also affect various ecological factors, such as light, humidity, and soil [79]. As altitude increases, crops must adapt to lower temperatures and greater diurnal temperature variations. This may lead to alterations in crop leaf structure, extension of the growth cycle, and differences in reproductive growth, resulting in changes to the aboveground biomass and yield of crops, which in turn affect the crop harvest index [78]. The distribution of longitude at the sampling points in this study is very narrow, so the influence of longitude on the cotton harvest index is not prominent. So, latitude is the most important climatic–geographic factor influencing the cotton harvest index (Figure 7) [80].
Planting density is one of the most important agronomic measures in cotton production [81]. As the world’s largest and most dominant arid-zone cotton-growing region, Xinjiang has, in recent years, widely practiced the planting pattern of “multiple row spacing, combination of wide and narrow row spacing”, under which the theoretical planting density ranges from 21.9 to 29.2 plants/m2 [82,83,84]. The average density of cotton planted in this study was 24.2 plants/m2, with 26.9 plants/m2 for the XLzao variety types and 22.3 plants/m2 for the XLzhong variety types, both of which were planted at high densities. This may be related to the increase in cotton water utilization efficiency and the relative decrease in soil moisture evaporation under high-density planting. The water utilization efficiency of cotton under different planting densities is different; moreover, increased planting density reduces the net photosynthetic rate, which affects the accumulation of cotton biomass and yield formation [39,85]. Cotton has higher aboveground biomass and seed cotton yield when it is planted at higher densities [81,86,87], so planting density is the main agronomic management factor affecting the cotton harvest index (Figure 7). The law of maximum yield constancy also explains this phenomenon: at lower planting densities, there is less competition between plants, more efficient resource utilization, and higher overall yields, while when planting densities are too high, competition is increased, and individual plant growth is limited, ultimately leading to lower yields [88]. The cotton harvest index is positively correlated with both cotton lint yield and straw yield (Figure 8a,b). The straw yield is closely related to the economic yield of the crop. In cotton production, the lint yield serves as the economic yield, and there is a certain proportional relationship between it and the straw yield [89]. This proportional relationship is known as the grass-to-grain ratio or the straw coefficient. The straw coefficient can be calculated using the formula (straw coefficient = (1/harvest index) − 1) [90]. This means that as the harvest index increases, the straw-to-fiber ratio coefficient decreases, indicating that the proportion of straw yield to fiber yield is decreasing. The lint yield is directly related to the cotton harvest index (Figure 8d). The higher the harvest index, the more biomass is converted into the economic yield (lint) per unit area, thereby increasing the lint yield. As mentioned above, the proportional relationship between the straw yield and lint yield is determined by the grass/grain ratio coefficient, and the grass/grain ratio coefficient is closely related to the harvest index [34]. Therefore, the straw yield indirectly reflects the cotton harvest index. When the harvest index increases, the proportion of the straw yield to the lint yield decreases, and vice versa. Plant height is one of the important factors in determining plant biomass and can indirectly affect cotton fiber yield. The harvest index refers to the proportion of the cotton economic yield (e.g., cotton lint) to total biological yield and reflects the economic efficiency and harvest level of cotton. The relationship between plant height and the yield index is usually negatively correlated, i.e., the higher the plant height, the lower the yield index tends to be [91]. The crop harvest index, as a key indicator for assessing the efficiency of resource allocation between the economic yield and biomass (or growth) yield of crops, occupies a crucial position in the study of crop production performance and the optimization of cropping strategies [92]. Despite the importance of this index in guiding agricultural production practices, in-depth research on specific crops, such as cotton, is relatively scarce. In particular, the relationship between the actual yield of cotton lint and straw and the cotton harvest index, and whether there is an inherent relationship or balancing mechanism between cotton lint and straw yields, has received relatively little research attention. There is still a considerable knowledge gap in this regard. Therefore, in order to better understand the production characteristics of cotton and to improve the economic benefits and resource use efficiency of cotton production, more focused and in-depth scientific research is needed to fill the research gap in this area.
Potassium is an activator of many enzymes and controls major elements of many biological and metabolic processes in crop production, including water regulation and photosynthesis [93]. Cotton is more sensitive to the effectiveness of potassium levels than other crops, and cotton can exhibit potassium deficiencies even on potassium-rich soils [35]. Adequate potassium levels can improve water use efficiency in cotton [94,95], but potassium deficiency leads to abnormal cotton development and affects biomass allocation [96,97,98]. Soil bulk density is an important physical property of soil that affects looseness, aeration, and water retention. It affects plant growth and development by influencing the interaction between plant roots and soil nutrients. Soil organic matter is a major source of plant nutrients [99]. Humus in organic matter is the main cementing agent of soil aggregates and can promote the formation of soil macropores [100]. Macropore structure is conducive to improving soil aeration and water permeability, increasing soil looseness and water and fertilizer holding capacity [101]. In this study, soil bulk density and the soil organic matter content were positively correlated with the cotton harvest index (Figure 5). N, P, and K are the most fundamental elements required for the growth and development of plants. The levels of Alkalihydrolyzable Nitrogen in Soil and available phosphorus and potassium can influence soil conductivity, but this relationship is nonlinear, as conductivity is also affected by various other salts. Available phosphorus stands as one of the essential nutrient elements for cotton growth and development, significantly impacting root development, shoot growth, and yield formation [102,103]. Phosphorus deficiency can hinder cotton growth, impair root development, and cause leaf yellowing and other symptoms, ultimately affecting cotton yield and quality. Electrical conductivity, closely related to soil salt content, measures the conductivity of soil solution. Excessively high electrical conductivity (i.e., excessive soil salt content) can negatively impact cotton growth and development. High-salt soil can impede water absorption by cotton roots, potentially leading to root damage and even death. Additionally, a high salt content disrupts the normal physiological metabolic processes of cotton, resulting in growth retardation, yield decline, and other issues. In Xinjiang, where nitrogen fertilizer is over-applied during cotton cultivation but no attention is paid to the application of potash, it has been demonstrated that the harvest index of cotton decreases as the amount of nitrogen applied increases. This is why cotton cultivation should pay attention to the application of potash fertilizer [86,104]. Therefore, the quick-acting potassium content is the main soil nutrient factor affecting the cotton harvest index (Figure 7).

5. Conclusions

In this study, we updated the cotton harvest index in the arid zone. We also explored the three factors with the most significant influence on the cotton harvest index in the arid zone among a total of 21 influencing factors, including climatic–geographic, agronomic management, and soil nutrients, and quantified the relationship between the key driving factors and the cotton harvest index. The cotton harvest index in arid zones differs greatly from that in non-arid zones, and there are obvious differences between different cotton variety types. The most important climatic and geographic factors, agronomic management factors, and soil nutrient factors affecting the cotton harvest index in the arid zone are latitude, planting density, and soil available potassium, respectively. Latitude is negatively correlated with the cotton harvest index, a planting density of 33–36 plants/m2 is the largest cotton harvest index, and soil available potassium is positively correlated with the cotton harvest index. This provides a reference for the study of cotton biomass allocation and driving factors in the arid zone, as well as an important basis for the accurate estimation of cotton yield and straw yield in the arid zone.

Supplementary Materials

The following supporting information can be downloaded at: https://www.mdpi.com/article/10.3390/agronomy15030743/s1, Figure S1: Heat map of intra-group correlation clustering labeling between the cotton harvest index and influencing factors; Figure S2: Random forest model prediction of factors influencing the HI. The overall cotton HI in Xinjiang; Figure S3: Impact factor on the overall cotton HI in Xinjiang.

Author Contributions

H.D., X.Y. and W.Y. provided the idea for this research. H.D., X.Y. and W.Y. contributed to the experimental design. X.Y., W.Y. and D.Z. collected the data at the study site. X.Y. and W.Y. led the writing of this manuscript. J.H. and Q.L. contributed to the data analysis and figure-making. All authors have read and agreed to the published version of the manuscript.

Funding

This research was funded by the National Natural Science Foundation of China (Grant No. 32460352).

Data Availability Statement

The datasets presented in this article are not readily available because the data are part of an ongoing study. Requests to access the datasets should be directed to Hegan Dong.

Acknowledgments

We thank the Meteorological Data Sharing Service Network in China and the Agricultural Meteorological Observatory of Xinjiang Meteorological Bureau for supplying weather data.

Conflicts of Interest

The authors declare that they have no known competing financial interests or personal relationships that could have appeared to influence the work reported in this paper.

Abbreviations

The following abbreviations are used in this manuscript:
HIharvest index
Lonlongitude
Latlatitude
PHtplant height
ASLaltitude above sea level
AGBaboveground biomass
LYlint yield
CSYcotton stalk yield
Dendensity
LPlint percentage
GDDsgrowing degree days
SOMsoil organic matter
TNTotal Nitrogen in Soil
TPTotal Phosphorus in Soil
TKTotal Potassium in Soil
ANSAlkalihydrolyzable Nitrogen in Soil
APAvailable Phosphorus in Soil
AKavailable potassium in soil
ECsoil electrical conductivity
SMCsoil moisture content
BDsoil bulk density
DMAaboveground biomass dry matter accumulation
DEMDigital Elevation Model
MEMean Error
RMSERoot Mean Square Error
RMSSENormalized Root Mean Square Error
RFrandom forest

References

  1. Jans, Y.; von Bloh, W.; Schaphoff, S.; Müller, C. Global Cotton Production under Climate Change—Implications for Yield and Water Consumption. Hydrol. Earth Syst. Sci. 2021, 25, 2027–2044. [Google Scholar] [CrossRef]
  2. Li, N.; Lin, H.; Wang, T.; Li, Y.; Liu, Y.; Chen, X.; Hu, X. Impact of Climate Change on Cotton Growth and Yields in Xinjiang, China. Field Crops Res. 2020, 247, 107590. [Google Scholar] [CrossRef]
  3. Cai, C.; Wang, Z.; Ma, L.; Xu, Z.; Yu, J.; Li, F. Cotton Stalk Valorization towards Bio-Based Materials, Chemicals, and Biofuels: A Review. Renew. Sustain. Energy Rev. 2024, 202, 114651. [Google Scholar] [CrossRef]
  4. Zhou, Y.; Li, F.; Xin, Q.; Li, Y.; Lin, Z. Historical Variability of Cotton Yield and Response to Climate and Agronomic Management in Xinjiang, China. Sci. Total Environ. 2024, 912, 169327. [Google Scholar] [CrossRef]
  5. Civelek Yoruklu, H.; Koroglu, E.O.; Ozdemir, O.K.; Demir, A.; Ozkaya, B. Bioenergy Production from Cotton Straws Using Different Pretreatment Methods. Int. J. Hydrogen Energy 2020, 45, 34720–34729. [Google Scholar] [CrossRef]
  6. Li, S.; Song, H.; Hu, J.; Yang, H.; Zou, J.; Zhu, Y.; Tang, Z.; Chen, H. CO2 Gasification of Straw Biomass and Its Correlation with the Feedstock Characteristics. Fuel 2021, 297, 120780. [Google Scholar] [CrossRef]
  7. Palamutcu, S.; Devrent, N. Mini Review on Organic Cotton. J. Text. Eng. Fash. Technol. 2017, 3, 610–614. [Google Scholar] [CrossRef]
  8. Xiao, W.; Wang, S.; Wei, B.; Wang, J.; Chen, L.; Liu, K.; Wang, T. Effect of Temperature and Pressure on the Transformation Characteristics of Inorganic Elements in Cotton Straw Ash. Fuel 2023, 340, 127443. [Google Scholar] [CrossRef]
  9. Qian, B.; Shao, C.; Yang, F. Spatial Suitability Evaluation of the Conversion and Utilization of Crop Straw Resources in China. Environ. Impact Assess. Rev. 2024, 105, 107438. [Google Scholar] [CrossRef]
  10. Reddy, G.V.N.; Reddy, M.R. Effects of Ammoniation and Processing of Cotton Straw as the Sole Source of Roughage in Complete Feeds on Ruman Characteristics with Murrah Buffaloes. Anim. Feed Sci. Technol. 1986, 14, 95–102. [Google Scholar] [CrossRef]
  11. Kirubanath, K.; Narsimha Reddy, D.; Nagalakshmi, D. Effect of Processing Cotton Straw Based Complete Diet with Expander-Extruder on Performance of Crossbred Calves. Asian-Australas. J. Anim. Sci. 2003, 16, 1572–1576. [Google Scholar] [CrossRef]
  12. Patel, H.; Maiti, S.; Müller, F.; Maiti, P. Sustainable Methodology for Production of Potassic Fertilizer from Agro-Residues: Case Study Using Empty Cotton Boll. J. Clean. Prod. 2019, 215, 22–33. [Google Scholar] [CrossRef]
  13. Zhou, L.; Xie, Y.; Wang, X.; Li, P.; Liu, Y.; Wang, Z.; Dai, J.; Zhang, H.; Yang, X. Influence of Different Microbial Inoculants on Nitrogen Retention and Diazotroph Community Succession during Cotton Straw Composting. Process Saf. Environ. Prot. 2023, 172, 882–893. [Google Scholar] [CrossRef]
  14. Qaim, M. Bt Cotton, Yields and Farmers’ Benefits. Nat. Plants 2020, 6, 1318–1319. [Google Scholar] [CrossRef]
  15. Nouri, A.; Yoder, D.C.; Raji, M.; Ceylan, S.; Jagadamma, S.; Lee, J.; Walker, F.R.; Yin, X.; Fitzpatrick, J.; Trexler, B.; et al. Conservation Agriculture Increases the Soil Resilience and Cotton Yield Stability in Climate Extremes of the Southeast US. Commun. Earth Environ. 2021, 2, 155. [Google Scholar] [CrossRef]
  16. Cordeiro, L.F.d.S.; Cordeiro, C.F.d.S.; Ferrari, S. Cotton Yield and Boron Dynamics Affected by Cover Crops and Boron Fertilization in a Tropical Sandy Soil. Field Crops Res. 2022, 284, 108575. [Google Scholar] [CrossRef]
  17. Liu, X.; Yan, F.; Wu, L.; Zhang, F.; Yin, F.; Abdelghany, A.E.; Fan, J.; Xiao, C.; Li, J.; Li, Z. Leaching Amount and Timing Modified the Ionic Composition of Saline-Alkaline Soil and Increased Seed Cotton Yield under Mulched Drip Irrigation. Field Crops Res. 2023, 299, 108988. [Google Scholar] [CrossRef]
  18. Zhang, J.; Wang, H.; Feng, D.; Cao, C.; Zheng, C.; Dang, H.; Li, K.; Gao, Y.; Sun, C. Evaluating the Impacts of Long-Term Saline Water Irrigation on Soil Salinity and Cotton Yield under Plastic Film Mulching: A 15-Year Field Study. Agric. Water Manag. 2024, 293, 108703. [Google Scholar] [CrossRef]
  19. Chen, J.; Engbersen, N.; Stefan, L.; Schmid, B.; Sun, H.; Schöb, C. Diversity Increases Yield but Reduces Harvest Index in Crop Mixtures. Nat. Plants 2021, 7, 893–898. [Google Scholar] [CrossRef]
  20. Donald, C.M.; Hamblin, J. The Biological Yield and Harvest Index of Cereals as Agronomic and Plant Breeding Criteria. In Advances in Agronomy; Brady, N.C., Ed.; Academic Press: Cambridge, MA, USA, 1976; Volume 28, pp. 361–405. [Google Scholar]
  21. Unkovich, M.; Baldock, J.; Forbes, M. Chapter 5—Variability in Harvest Index of Grain Crops and Potential Significance for Carbon Accounting: Examples from Australian Agriculture. In Advances in Agronomy; Academic Press: Cambridge, MA, USA, 2010; Volume 105, pp. 173–219. [Google Scholar]
  22. Conaty, W.C.; Constable, G.A. Factors Responsible for Yield Improvement in New Gossypium Hirsutum L. Cotton Cultivars. Field Crops Res. 2020, 250, 107780. [Google Scholar] [CrossRef]
  23. Fu, Z.; Zhi, Z. Harvest index of Chinese crops. Agric. Sci. China 1990, 2, 83–87. [Google Scholar]
  24. Guang, X.; Xiao, W.; Dong, H. Harvest index and straw coefficient of non-cereal field crops in China. J. China Agric. Univ. 2011, 16, 9–17. [Google Scholar]
  25. Xue, W.; Li, X.; Zeng, F. Inter-Annual Variations of Seed Cotton Yield in Relation to Soil Organic Carbon and Harvest Index in Reclaimed Desertified Land. Field Crops Res. 2021, 272, 108267. [Google Scholar] [CrossRef]
  26. Singh, J.; Gamble, A.V.; Brown, S.; Campbell, B.T.; Jenkins, J.; Koebernick, J.; Bartley, P.C.; Sanz-Saez, A. 65 Years of Cotton Lint Yield Progress in the USA: Uncovering Key Influential Yield Components. Field Crops Res. 2023, 302, 109058. [Google Scholar] [CrossRef]
  27. Xu, Z.; Yu, B.; Hong, W.; Chun, G.; Lei, W.; Ya, W. Estimation and Suitability Evaluation of Cotton Stalk Resources in China. In Proceedings of the 17th Annual Meeting of the China Association for Science and Technology—15 International Symposium on Technological Innovation and Investment and Financing of Emerging Green Industries; China Association for Science and Technology, Guangdong Provincial People’s Government: Guangzhou, China, 2015; p. 7. [Google Scholar]
  28. Yu, B.; Chun, G.; Ya, W. Quantity estimation of straw resources in China. Trans. Agric. Eng. 2009, 25, 211–217. [Google Scholar]
  29. Pan, Y.; Zhang, Z.; Zhang, M.; Huang, P.; Dai, L.; Ma, Z.; Liu, J. Climate vs. Nutrient Control: A Global Analysis of Driving Environmental Factors of Wetland Plant Biomass Allocation Strategy. J. Clean. Prod. 2023, 406, 136983. [Google Scholar] [CrossRef]
  30. Zhou, L.; Zhou, X.; He, Y.; Fu, Y.; Du, Z.; Lu, M.; Sun, X.; Li, C.; Lu, C.; Liu, R.; et al. Global Systematic Review with Meta-Analysis Shows That Warming Effects on Terrestrial Plant Biomass Allocation Are Influenced by Precipitation and Mycorrhizal Association. Nat. Commun. 2022, 13, 4914. [Google Scholar] [CrossRef]
  31. Bloom, A.J.; Chapin, F.S., III; Mooney, H.A. Resource Limitation in Plants-An Economic Analogy. Annu. Rev. Ecol. Evol. Syst. 1985, 16, 363–392. [Google Scholar] [CrossRef]
  32. Golan, G.; Weiner, J.; Zhao, Y.; Schnurbusch, T. Agroecological Genetics of Biomass Allocation in Wheat Uncovers Genotype Interactions with Canopy Shade and Plant Size. New Phytol. 2024, 242, 107–120. [Google Scholar] [CrossRef]
  33. Blomqvist, L.; Yates, L.; Brook, B.W. Drivers of Increasing Global Crop Production: A Decomposition Analysis. Environ. Res. Lett. 2020, 15, 0940b6. [Google Scholar] [CrossRef]
  34. Liu, Y.; Dai, Y.; Liu, Z.; Sun, S.; Wu, S.; Du, J.; Chen, Y.; Zhang, X.; Chen, D.; Chen, Y. Boll/Leaf Ratio Improves the Source–Sink Relationship and Lint Yield during the Boll Setting Stage of Cotton. Field Crops Res. 2024, 310, 109342. [Google Scholar] [CrossRef]
  35. Rochester, I.J.; Constable, G.A. Improvements in Nutrient Uptake and Nutrient Use-Efficiency in Cotton Cultivars Released between 1973 and 2006. Field Crops Res. 2015, 173, 14–21. [Google Scholar] [CrossRef]
  36. Kumar Sharma, R.; Dhillon, J.; Kumar, P.; Raja Reddy, K.; Reed, V.; Dodds, D.M.; Reddy, K.N. Modelling the Climate Change and Cotton Yield Relationship in Mississippi: Autoregressive Distributed Lag Approach. Ecol. Indic. 2024, 166, 112573. [Google Scholar] [CrossRef]
  37. Chi, B.; Liu, J.; Dai, J.; Li, Z.; Zhang, D.; Xu, S.; Nie, J.; Wan, S.; Li, C.; Dong, H. Alternate Intercropping of Cotton and Peanut Increases Productivity by Increasing Canopy Photosynthesis and Nutrient Uptake under the Influence of Rhizobacteria. Field Crops Res. 2023, 302, 109059. [Google Scholar] [CrossRef]
  38. Hassan, M.; Maqsood, M.; Wajid, S.A.; Ranjha, A.M. Impact of moisture stress and nitrogen on crop growth rate, nitrogen use efficiency, and harvest index of cotton (Gossypium hirsutum L.). PAKJAS 2016, 53, 171–180. [Google Scholar] [CrossRef]
  39. Chen, J.; Wang, Y.; Zhi, X.; Qiu, Y.; Han, Y.; Feng, L.; Wang, Z.; Li, X.; Lei, Y.; Xiong, S.; et al. Modifying the Planting Density to Change Water Utilization in Various Soil Layers and Regulate Plant Growth and Yield Formation of Cotton. Field Crops Res. 2022, 289, 108738. [Google Scholar] [CrossRef]
  40. Ferreira, W.; Lacerda, C.; Costa, R.; Filho, S. Effect of Water Stress on Seedling Growth in Two Species with Different Abundances: The Importance of Stress Resistance Syndrome in Seasonally Dry Tropical Forest. Acta Bot. Bras. 2015, 29, 375–382. [Google Scholar] [CrossRef]
  41. Eziz, A.; Yan, Z.; Tian, D.; Han, W.; Tang, Z.; Fang, J. Drought Effect on Plant Biomass Allocation: A Meta-Analysis. Ecol. Evol. 2017, 7, 11002–11010. [Google Scholar] [CrossRef]
  42. Schimel, J.P. Life in Dry Soils: Effects of Drought on Soil Microbial Communities and Processes. Annu. Rev. Ecol. Evol. Syst. 2018, 49, 409–432. [Google Scholar] [CrossRef]
  43. Kröel-Dulay, G.; Mojzes, A.; Szitár, K.; Bahn, M.; Batáry, P.; Beier, C.; Bilton, M.; De Boeck, H.J.; Dukes, J.S.; Estiarte, M.; et al. Field Experiments Underestimate Aboveground Biomass Response to Drought. Nat. Ecol. Evol. 2022, 6, 540–545. [Google Scholar] [CrossRef]
  44. Ul-Allah, S.; Rehman, A.; Hussain, M.; Farooq, M. Fiber Yield and Quality in Cotton under Drought: Effects and Management. Agric. Water Manag. 2021, 255, 106994. [Google Scholar] [CrossRef]
  45. Welsh, J.M.; Taschetto, A.S.; Quinn, J.P. Climate and Agricultural Risk: Assessing the Impacts of Major Climate Drivers on Australian Cotton Production. Eur. J. Agron. 2022, 140, 126604. [Google Scholar] [CrossRef]
  46. Yang, G.; Tang, H.; Nie, Y.; Zhang, X. Responses of Cotton Growth, Yield, and Biomass to Nitrogen Split Application Ratio. Eur. J. Agron. 2011, 35, 164–170. [Google Scholar] [CrossRef]
  47. Denisko, D.; Hoffman, M.M. Classification and Interaction in Random Forests. Proc. Natl. Acad. Sci. USA 2018, 115, 1690–1692. [Google Scholar] [CrossRef] [PubMed]
  48. Kanerva, N.; Erkkola, M.; Nevalainen, J.; Männistö, S. Random Forest Analysis in Identifying the Importance of Obesity Risk Factors: Noora Kanerva. Eur. J. Public Health 2013, 23, ckt124.042. [Google Scholar] [CrossRef]
  49. Grace, J.B. Structural Equation Modeling and Natural Systems; Cambridge University Press: Cambridge, UK, 2006; ISBN 978-0-521-54653-9. [Google Scholar]
  50. Grace, J.B.; Anderson, T.M.; Olff, H.; Scheiner, S.M. On the Specification of Structural Equation Models for Ecological Systems. Ecol. Monogr. 2010, 80, 67–87. [Google Scholar] [CrossRef]
  51. Yao, J.; Zhao, Y.; Chen, Y.; Yu, X.; Zhang, R. Multi-Scale Assessments of Droughts: A Case Study in Xinjiang, China. Sci. Total Environ. 2018, 630, 444–452. [Google Scholar] [CrossRef]
  52. Du, J.; Jiaerheng, A.; Zhao, C.; Fang, G.; Yin, J.; Xiang, B.; Yuan, X.; Fang, S. Dynamic changes in vegetation NDVI from 1982 to 2012 and its responses to climate change and human activities in Xinjiang, China. Ying Yong Sheng Tai Xue Bao 2015, 26, 3567–3578. [Google Scholar]
  53. Jiapaer, G.; Liang, S.; Yi, Q.; Liu, J. Vegetation Dynamics and Responses to Recent Climate Change in Xinjiang Using Leaf Area Index as an Indicator. Ecol. Indic. 2015, 58, 64–76. [Google Scholar] [CrossRef]
  54. Bai, Z.; Xie, C.; Yu, J.; Bai, W.; Pei, S.; Li, Y.; Li, Z.; Zhang, F.; Fan, J.; Yin, F. Effects of Irrigation and Nitrogen Levels on Yield and Water-Nitrogen-Radiation Use Efficiency of Drip-Fertigated Cotton in South Xinjiang of China. Field Crops Res. 2024, 308, 109280. [Google Scholar] [CrossRef]
  55. Xu, P.; Wang, P.; Liu, H.; Ning, H.; Wang, J. Evaluation and Application of AquaCrop in Simulation of Alternate Irrigation with Brackish and Fresh Water for Cotton under Mulch Drip Irrigation in Southern Xinjiang. Ind. Crops Prod. 2025, 225, 120548. [Google Scholar] [CrossRef]
  56. Jing, F. Quantitative Evaluation of the Impact of Geographical Elements on Temperature Distribution in China. Acta Ecol. Sin. 1992, 12, 97–104. [Google Scholar]
  57. Hou, P.; Liu, Y.; Xie, R.; Ming, B.; Ma, D.; Li, S.; Mei, X. Temporal and Spatial Variation in Accumulated Temperature Requirements of Maize. Field Crops Res. 2014, 158, 55–64. [Google Scholar] [CrossRef]
  58. Khan, A.; Najeeb, U.; Wang, L.; Tan, D.K.Y.; Yang, G.; Munsif, F.; Ali, S.; Hafeez, A. Planting Density and Sowing Date Strongly Influence Growth and Lint Yield of Cotton Crops. Field Crops Res. 2017, 209, 129–135. [Google Scholar] [CrossRef]
  59. Mtama, J.G.; Msanya, B.M.; Burras, C.L. Pedology at Four Representative Sites of Southern Highland Zone of Tanzania. Am. J. Agric. For. 2018, 6, 111–121. [Google Scholar] [CrossRef]
  60. Wagner, P.D.; Fiener, P.; Wilken, F.; Kumar, S.; Schneider, K. Comparison and Evaluation of Spatial Interpolation Schemes for Daily Rainfall in Data Scarce Regions. J. Hydrol. 2012, 464–465, 388–400. [Google Scholar] [CrossRef]
  61. Oriani, F.; Mariethoz, G.; Chevalier, M. EUPollMap: The European Atlas of Contemporary Pollen Distribution Maps Derived from an Integrated Kriging Interpolation Approach. Earth Syst. Sci. Data 2024, 16, 731–742. [Google Scholar] [CrossRef]
  62. Mao, L.; Zhang, L.; Sun, X.; van der Werf, W.; Evers, J.B.; Zhao, X.; Zhang, S.; Song, X.; Li, Z. Use of the Beta Growth Function to Quantitatively Characterize the Effects of Plant Density and a Growth Regulator on Growth and Biomass Partitioning in Cotton. Field Crops Res. 2018, 224, 28–36. [Google Scholar] [CrossRef]
  63. Shan, L.; He, D.; Xiao, T. History, present situation and prospect of cultivation of “short, dense and early” cotton in Xinjiang. Agric. Sci. China 2021, 54, 720–732. [Google Scholar]
  64. Ming, X.; Zhan, W.; Ying, H. Development review, current situation analysis and measure suggestion of machine picking cotton in Xinjiang. China Agric. Sci. Technol. Her. 2021, 23, 11–20. [Google Scholar] [CrossRef]
  65. Zhou, H.; Chen, J.; Ding, X.; Qin, Q.; Han, L. Future Climate Change Will Strengthen Cotton Production but Have Substantial Environmental Costs—A Focus on Xinjiang by APSIM Modelling. J. Clean. Prod. 2025, 491, 144803. [Google Scholar] [CrossRef]
  66. Sheng, F.; Wei, F.; Zhen, T.; Xiao, M. Research on comprehensive evaluation of cotton varieties in early and middle ripening areas of Xinjiang based on DTOPSIS method. Tianjin Agric. Sci. 2024, 30, 45–51. [Google Scholar]
  67. Guan, Q.; Jian, F.; Ren, Y. Analysis of main agronomic traits of approved early-maturing cotton varieties in Xinjiang Uygur Autonomous Region from 2017 to 2022. Chin. Seed Ind. 2024, 89–95+100. [Google Scholar] [CrossRef]
  68. Wang, J.Y. A Critique of the Heat Unit Approach to Plant Response Studies. Ecology 1960, 41, 785–790. [Google Scholar] [CrossRef]
  69. Guo, S.; Han, Y.; Wang, G.; Wu, F.; Jia, Y.; Chen, J.; Li, X.; Du, W.; Li, Y.; Feng, L. Quantifying Physiological Contributions to Yield Loss in Response to Planting Date in Short-Season Cotton under a Cottonwheat Double-Cropping System. Eur. J. Agron. 2024, 154, 127089. [Google Scholar] [CrossRef]
  70. Bhattacharya, A. Effect of Low-Temperature Stress on Germination, Growth, and Phenology of Plants: A Review. In Physiological Processes in Plants Under Low Temperature Stress; Bhattacharya, A., Ed.; Springer: Singapore, 2022; pp. 1–106. ISBN 9789811690372. [Google Scholar]
  71. Christiansen, M.N.; Thomas, R.O. Season-Long Effects of Chilling Treatments Applied to Germinating Cottonseed. Crop Sci. 1969, 9, 672–673. [Google Scholar] [CrossRef]
  72. Reddy, K.R.; Hodges, H.F.; Reddy, V.R. Temperature Effects on Cotton Fruit Retention. Agron. J. 1992, 84, 26–30. [Google Scholar] [CrossRef]
  73. Reddy, V.R. Modeling Cotton Growth and Phenology in Response to Temperature. Comput. Electron. Agric. 1994, 10, 63–73. [Google Scholar] [CrossRef]
  74. Sawan, Z.M. Climatic Variables: Evaporation, Sunshine, Relative Humidity, Soil and Air Temperature and Its Adverse Effects on Cotton Production. Inf. Process. Agric. 2018, 5, 134–148. [Google Scholar] [CrossRef]
  75. AL-Ani, M.K.A.; Hay, R.K.M. The Influence of Growing Temperature on the Growth and Morphology of Cereal Seedling Root Systems. J. Exp. Bot. 1983, 34, 1720–1730. [Google Scholar] [CrossRef]
  76. Alsajri, F.A.; Singh, B.; Wijewardana, C.; Irby, J.T.; Gao, W.; Reddy, K.R. Evaluating Soybean Cultivars for Low- and High-Temperature Tolerance During the Seedling Growth Stage. Agronomy 2019, 9, 13. [Google Scholar] [CrossRef]
  77. Shi, Y.; Ma, H.; Li, T.; Guo, E.; Zhang, T.; Zhang, X.; Yang, X.; Wang, L.; Jiang, S.; Deng, Y.; et al. Innovative Modeling on the Effects of Low-Temperature Stress on Rice Yields. J. Exp. Bot. 2024, 76, 1230–1243. [Google Scholar] [CrossRef]
  78. Zhao, Y.; Zhu, Y.; Feng, S.; Zhao, T.; Wang, L.; Zheng, Z.; Ai, N.; Guan, X. The Impact of Temperature on Cotton Yield and Production in Xinjiang, China. NPJ Sustain. Agric. 2024, 2, 33. [Google Scholar] [CrossRef]
  79. Zhang, S.; Fu, W.; Zhang, Z.; Fan, Y.; Liu, T. Effects of Elevated CO2 Concentration and Temperature on Some Physiological Characteristics of Cotton (Gossypium hirsutum L.) Leaves. Environ. Exp. Bot. 2017, 133, 108–117. [Google Scholar] [CrossRef]
  80. Ojha, R. Assessing Seasonal Variation of near Surface Air Temperature Lapse Rate across India. Int. J. Climatol. 2017, 37, 3413–3426. [Google Scholar] [CrossRef]
  81. Adams, C.; Thapa, S.; Kimura, E. Determination of a Plant Population Density Threshold for Optimizing Cotton Lint Yield: A Synthesis. Field Crops Res. 2019, 230, 11–16. [Google Scholar] [CrossRef]
  82. Balkcom, K.S.; Price, A.J.; Van Santen, E.; Delaney, D.P.; Boykin, D.L.; Arriaga, F.J.; Bergtold, J.S.; Kornecki, T.S.; Raper, R.L. Row Spacing, Tillage System, and Herbicide Technology Affects Cotton Plant Growth and Yield. Field Crops Res. 2010, 117, 219–225. [Google Scholar] [CrossRef]
  83. Dai, J.; Dong, H. Intensive Cotton Farming Technologies in China: Achievements, Challenges and Countermeasures. Field Crops Res. 2014, 155, 99–110. [Google Scholar] [CrossRef]
  84. Dai, J.; Li, W.; Tang, W.; Zhang, D.; Li, Z.; Lu, H.; Eneji, A.E.; Dong, H. Manipulation of Dry Matter Accumulation and Partitioning with Plant Density in Relation to Yield Stability of Cotton under Intensive Management. Field Crops Res. 2015, 180, 207–215. [Google Scholar] [CrossRef]
  85. Echer, F.R.; Rosolem, C.A. Cotton Yield and Fiber Quality Affected by Row Spacing and Shading at Different Growth Stages. Eur. J. Agron. 2015, 65, 18–26. [Google Scholar] [CrossRef]
  86. Dong, H.; Li, W.; Eneji, A.E.; Zhang, D. Nitrogen Rate and Plant Density Effects on Yield and Late-Season Leaf Senescence of Cotton Raised on a Saline Field. Field Crops Res. 2012, 126, 137–144. [Google Scholar] [CrossRef]
  87. Zhi, X.; Han, Y.; Li, Y.; Wang, G.; Du, W.; Li, X.; Mao, S.; Feng, L. Effects of Plant Density on Cotton Yield Components and Quality. J. Integr. Agric. 2016, 15, 1469–1479. [Google Scholar] [CrossRef]
  88. Thornley, J.H.M. Crop Yield and Planting Density. Ann. Bot. 1983, 52, 257–259. [Google Scholar] [CrossRef]
  89. Dai, J.; Bean, B.; Brown, B.; Bruening, W.; Edwards, J.; Flowers, M.; Karow, R.; Lee, C.; Morgan, G.; Ottman, M.; et al. Harvest Index and Straw Yield of Five Classes of Wheat. Biomass Bioenergy 2016, 85, 223–227. [Google Scholar] [CrossRef]
  90. Lorenz, A.J.; Gustafson, T.J.; Coors, J.G.; de Leon, N. Breeding Maize for a Bioeconomy: A Literature Survey Examining Harvest Index and Stover Yield and Their Relationship to Grain Yield. Crop Sci. 2010, 50, 1–12. [Google Scholar] [CrossRef]
  91. Thapa, S.; Stewart, B.A.; Xue, Q.; Rhoades, M.B.; Angira, B.; Reznik, J. Canopy Temperature, Yield, and Harvest Index of Corn as Affected by Planting Geometry in a Semi-Arid Environment. Field Crops Res. 2018, 227, 110–118. [Google Scholar] [CrossRef]
  92. Karlen, D.L.; Birrell, S.J.; Johnson, J.M.F.; Osborne, S.L.; Schumacher, T.E.; Varvel, G.E.; Ferguson, R.B.; Novak, J.M.; Fredrick, J.R.; Baker, J.M.; et al. Multilocation Corn Stover Harvest Effects on Crop Yields and Nutrient Removal. Bioenerg. Res. 2014, 7, 528–539. [Google Scholar] [CrossRef]
  93. Pettigrew, W.T. Potassium Influences on Yield and Quality Production for Maize, Wheat, Soybean and Cotton. Physiol Plant 2008, 133, 670–681. [Google Scholar] [CrossRef]
  94. Tsialtas, I.T.; Shabala, S.; Baxevanos, D.; Matsi, T. Effect of Potassium Fertilization on Leaf Physiology, Fiber Yield and Quality in Cotton (Gossypium Hirsutum L.) under Irrigated Mediterranean Conditions. Field Crops Res. 2016, 193, 94–103. [Google Scholar] [CrossRef]
  95. Lewis, K.; Morgan, G.; Frame, W.H.; Fromme, D.; Dodds, D.M.; Edmisten, K.L.; Robertson, B.; Boman, R.; Cutts, T.; Delaney, D.P.; et al. Cotton Yield Response to Soil Applied Potassium across the U. S. Cotton Belt. Agron. J. 2021, 113, 3600–3614. [Google Scholar] [CrossRef]
  96. Lokhande, S.; Reddy, K.R. Reproductive Performance and Fiber Quality Responses of Cotton to Potassium Nutrition. Am. J. Plant Sci. 2015, 6, 911–924. [Google Scholar] [CrossRef]
  97. Pabuayon, I.L.B.; Lewis, K.L.; Ritchie, G.L. Dry Matter and Nutrient Partitioning Changes for the Past 30 Years of Cotton Production. Agron. J. 2020, 112, 4373–4385. [Google Scholar] [CrossRef]
  98. Kommineni, V.; Bhandari, A.B. Effects of Potassium Application on Growth, Yield, and Quality of Dryland Cotton. Agron. J. 2024, 116, 3222–3230. [Google Scholar] [CrossRef]
  99. Wood, S.A.; Sokol, N.; Bell, C.W.; Bradford, M.A.; Naeem, S.; Wallenstein, M.D.; Palm, C.A. Opposing Effects of Different Soil Organic Matter Fractions on Crop Yields. Ecol. Appl. 2016, 26, 2072–2085. [Google Scholar] [CrossRef]
  100. Bieluczyk, W.; Piccolo, M.d.C.; Pereira, M.G.; de Moraes, M.T.; Soltangheisi, A.; Bernardi, A.C.d.C.; Pezzopane, J.R.M.; Oliveira, P.P.A.; Moreira, M.Z.; de Camargo, P.B.; et al. Integrated Farming Systems Influence Soil Organic Matter Dynamics in Southeastern Brazil. Geoderma 2020, 371, 114368. [Google Scholar] [CrossRef]
  101. Kim, K.; Daly, E.J.; Gorzelak, M.; Hernandez-Ramirez, G. Soil Organic Matter Pools Response to Perennial Grain Cropping and Nitrogen Fertilizer. Soil Tillage Res. 2022, 220, 105376. [Google Scholar] [CrossRef]
  102. Lyu, Q.; Shen, Y.; Li, X.; Chen, G.; Li, D.; Fan, C. Early Effects of Crop Tree Management on Undergrowth Plant Diversity and Soil Physicochemical Properties in a Pinus Massoniana Plantation. PeerJ 2021, 9, e11852. [Google Scholar] [CrossRef]
  103. Peng, X.; Ren, J.; Chen, P.; Yang, L.; Luo, K.; Yuan, X.; Lin, P.; Fu, Z.; Li, Y.; Li, Y.; et al. Effects of Soil Physicochemical Environment on the Plasticity of Root Growth and Land Productivity in Maize Soybean Relay Strip Intercropping System. J. Sci. Food Agric. 2024, 104, 3865–3882. [Google Scholar] [CrossRef]
  104. Li, P.; Dong, H.; Zheng, C.; Sun, M.; Liu, A.; Wang, G.; Liu, S.; Zhang, S.; Chen, J.; Li, Y.; et al. Optimizing Nitrogen Application Rate and Plant Density for Improving Cotton Yield and Nitrogen Use Efficiency in the North China Plain. PLoS ONE 2017, 12, e0185550. [Google Scholar] [CrossRef]
Figure 1. Map of Xinjiang DEM elevation data and location of cotton sampling points in 2022 and 2023.
Agronomy 15 00743 g001
Figure 2. Photos of cotton plants and cotton.
Agronomy 15 00743 g002
Figure 3. Comparison of the cotton harvest index of the XLzao and XLzhong variety types in 2022 and 2023 (* indicates the statistical significance level: ** p < 0.01, * p < 0.05 and ns: no significant difference).
Agronomy 15 00743 g003
Figure 4. Spatial distribution of the cotton harvest index in Xinjiang.
Agronomy 15 00743 g004
Figure 5. Heat map of intra-group correlation clustering labeling between the cotton harvest index and influencing factors (*** p < 0.001, ** p < 0.01, * p < 0.05). (a) Heat map of the correlation between the HI and influencing factors in the XLzao variety type correlation heat map; (b) correlation heat map between the cotton harvest index of the XLzhong variety types and influencing factors. (The color of the boxes in the figure indicates the strength of the correlation. Red represents a strong positive correlation, while blue indicates a strong negative correlation).
Agronomy 15 00743 g005
Figure 6. Random forest model prediction of factors influencing the HI. (a) The cotton HI of the XLzao variety types; (b) the cotton HI of the XLzhong variety types. (Different colored bars represent different levels of significance: ** p < 0.01, * p < 0.05).
Agronomy 15 00743 g006
Figure 7. Influencing factors on the cotton HI of the XLzao variety types (a) and the cotton HI of the XLzhong variety types (b). (c) (XLzao) and (d) (XLzhong) show the bar charts of the direct, indirect, and total effect sizes of the factors influencing the cotton harvest index derived through structural equation modeling. R2: the total explanation rate. The numbers on the arrows in the figure indicate the standardized path coefficients; the degree of thickness of the arrows indicates the size of the standardized path coefficients; arrows of different colors indicate positive or negative correlations, with red arrows indicating positive correlations and blue arrows indicating negative correlations (*** p < 0.01, ** p < 0.05, * p < 0.1).
Agronomy 15 00743 g007
Figure 8. (a) Regression analysis plot of the cotton lint yield and harvest index, (b) regression analysis plot of the cotton stalk yield and harvest index, (c) regression analysis plot of the available potassium and harvest index, (d) regression analysis plot of the cotton lint yield and cotton stalk yield, (e) regression analysis plot of latitude and growing degree days, and (f) the fitting curve of density and the harvest index.
Agronomy 15 00743 g008
Table 1. Parameters of the semi-variance function model for the cotton harvest index in arid zones.
Nugget
C0
Sill
C + C0
Proportion
(C0/C + C0)
Theoretical ModelCV
Harvest index0.000230.0011719.66%Exp4.66%
Note: Exp: exponential model, CV: coefficient of variation.
Table 2. Error analysis of Kriging interpolation results.
ME (10−4)RMSE (10−2)RMSSE
Harvest index0.800.510.9606
Disclaimer/Publisher’s Note: The statements, opinions and data contained in all publications are solely those of the individual author(s) and contributor(s) and not of MDPI and/or the editor(s). MDPI and/or the editor(s) disclaim responsibility for any injury to people or property resulting from any ideas, methods, instructions or products referred to in the content.