Article

Soil Organic Carbon Stocks Under Daylily Cultivation and Their Influencing Factors in the Agro-Pastoral Ecotone of Northern China

1
College of Resources and Environment, Shanxi Agricultural University, Jinzhong 030801, China
2
Datong Daylily Industrial Development Research Institute, Datong 037004, China
*
Author to whom correspondence should be addressed.
Agronomy 2025, 15(3), 756; https://doi.org/10.3390/agronomy15030756
Submission received: 26 February 2025 / Revised: 15 March 2025 / Accepted: 18 March 2025 / Published: 20 March 2025
(This article belongs to the Special Issue New Pathways Towards Carbon Neutrality in Agricultural Systems)

Abstract

:
Perennial crops are crucial for enhancing soil organic carbon (SOC) stocks to mitigate climate change, yet the effects of planting duration on SOC stocks remain inconsistent. In the agro-pastoral ecotone of northern China, where soil degradation is a growing concern, daylily, a perennial crop cultivated for over 600 years, presents both ecological and agricultural potential. This study evaluates the impact of long-term (LD, >10 years) and short-term (SD, ~5 years) daylily cultivation on SOC stocks and identifies key drivers. Paired soil samples (0–100 cm) from eight sites under LD, SD, and long-term maize cultivation (CK) were analyzed using analysis of variance (ANOVA), correlation analysis, random forest, and structural equation modeling (SEM). LD significantly increased SOC stocks by 19.63% compared to CK, while SD showed no significant difference. The sampling site had a greater impact on SOC stocks than the treatment across different geographic locations. At the same location, SEM revealed that soil factors influenced SOC differently across treatments: for LD, soil total nitrogen (TN) > pH > soil water content (SWC); for SD, TN > SWC > soil available phosphorus (AP); for CK, TN > soil available potassium (AK) > SWC. This study provides insights for regional soil management and carbon sequestration strategies, highlighting the role of LD in enhancing soil quality and promoting ecological restoration.

1. Introduction

Perennial crops often develop deep root systems, which contribute to enhanced soil structure and the continuous input of organic matter. A previous study demonstrated that perennial crops have the potential to increase soil organic carbon (SOC) stocks compared to annual crops [1]. Crops like miscanthus, poplar, willow, and conventionally cut grasses have been studied for their role in carbon sequestration and long-term sustainability [2,3,4]. For example, perennial species such as switchgrass and miscanthus have been found to increase SOC by 0.8 and 1.3 Mg C ha−1 year−1 (0–15 cm soil depth), whereas no significant changes in SOC were observed in annual crops, regardless of sampling depth [4].
In a 29-year field trial in the north–central United States, perennial grasslands managed with rotational grazing demonstrated an 18–29% increase in SOC at the 0–30 cm depth compared to both annual monoculture and crop rotation systems [5]. Additionally, several studies have examined the temporal changes in SOC after converting annual crops to perennials. For instance, Ledo et al. found that switching from annual crops to perennial crops typically resulted in an average SOC increase of 20% at the 0–30 cm depth [6]. Similarly, Siddique et al. reported that while SOC stocks initially decreased (within the first five years) after planting perennial crops, long-term cultivation (beyond ten years) significantly enhanced SOC stocks at the 0–30 cm depth [7].
Like other perennial crops, the daylily (Hemerocallis citrina Baroni), a perennial root herb, typically grows for 12–15 years, thriving over multiple growing seasons without the need for annual replanting. Its roots, which are distributed in the 20–50 cm soil layer, help effectively prevent soil erosion [8,9]. Due to their drought tolerance, ability to grow in poor soil, and cold resistance, daylilies are widely cultivated in the agro-pastoral zone of north China, where they play a vital role in ecological protection. In addition to their ecological benefits, the daylily is an important cash crop with edible, medicinal, and various economic uses, providing a stable source of income for local farmers [10,11]. The effects of soil properties on the yield and agronomic traits of daylilies were explored in a previous study [12]. However, the characteristics of SOC stocks under long-term and short-term daylily cultivation remain unclear.
Previous studies examined the main factors influencing SOC stocks, including climate, plant biological traits, and soil properties [13,14,15]. Climate variables, such as precipitation and temperature, are generally considered critical, because they directly affect organic carbon input through plant CO2 assimilation and output through microbial aerobic and anaerobic respiration [16]. However, climate variables are affected by the geographical location, which determines the oxidation, decomposition, mineralization, and enrichment efficiencies of organic carbon [17]. Additionally, the plant type is closely related to SOC storage and its vertical distribution and is considered a major factor in SOC depth distribution [18]. Finally, although geographical and vegetation-type factors (e.g., plant carbon input) can regulate the magnitude or rate of apparent SOC transfer from one state to another, the ultimate SOC stocks are usually controlled by the physical and chemical properties of the soil [19]. There is growing evidence that soil geochemistry and physical structure provide physicochemical barriers to microbial accessibility to SOC [20,21]. Owing to physical, chemical, and biochemical protection mechanisms, the stability of SOC has shown substantial changes [22,23].
Geography, vegetation type, and soil factors usually interact and jointly regulate SOC dynamics through different processes and mechanisms [24,25]. Previous studies mostly focused on the surface soil (0–30 cm) because changes in organic carbon storage are more obvious in surface soil than in deeper soil [26], and sampling deeper soil can be more costly [27]. However, Gauder et al. found that approximately 50% of the total SOC reserves were located in the subsoil below 30 cm [28], which prompted us to extend our soil sampling to 100 cm to gain a more thorough understanding of deep SOC stocks.
Owing to the long-term effects of drought, strong winds, and unsustainable human activities—such as intensive farming, overgrazing, and overharvesting—the agro-pastoral ecotone in northern China is sensitive to environmental changes and has low ecological resilience, making it ecologically fragile [29]. We hypothesize that, despite these challenging environmental conditions, daylily cultivation could still improve SOC stocks, resulting in the enhancement of soil structure, thereby contributing to the ecological protection of the area. Therefore, the objectives of this study are to (1) investigate the characteristics of SOC stocks at depths of 0–100 cm under short-term and long-term daylily cultivation, compared to the dominant local annual crop of maize, (2) identify the influencing factors of SOC stocks across different geographic locations, and (3) examine the effects of SOC variation between daylily and maize cultivation under similar geographic conditions.

2. Materials and Methods

2.1. Site Description

The agro-pastoral ecotone in northern China, located in semi-arid and arid zones with an annual precipitation of 300–400 mm, is characterized by the overlap of agriculture and animal husbandry both spatially and temporally [30,31]. Yunzhou District (40°06′00.22″ N, 113°34′12.18″ E), one of China’s four main daylily production areas, is located in the middle of the agricultural–pastoral ecotone in northern China (Figure 1), covering 1478 km2. The region has a temperate monsoon continental climate with an average annual temperature of 6.4 °C, precipitation of 392 mm, and a frost-free period of 125 days. The average altitude is 1157 m, and the terrain slopes from northwest to southeast. The dominant soil type, Chestnut-Calcareous, which is characterized by high pH, poor water retention, and low SOC content, covers 86.33% of the presented district area.
Yunzhou District, known as the “Hometown of Yellow Flowers in China,” has over 600 years of daylily cultivation history. Its unique natural conditions, including significant diurnal temperature variation, abundant groundwater, and volcanic soil rich in trace elements, provide ideal conditions for daylily growth. Along with maize, daylilies form the foundation of agricultural production in the region.

2.2. Soil Sampling

Soil sample collection for this experiment was conducted in late August 2023. The selection of sampling points was based on a comprehensive consideration of the terrain, the soil type, and the planting status of daylilies in the study area. To ensure the comparability of the results, all sample sites met the following criteria: (1) they were geographically close to each other (within 200 m) to minimize the impact of factors such as elevation and soil type, (2) the crops were growing robustly, reducing the influence of tillage management practices on the experimental results, and (3) no organic fertilizer was used during the planting process to avoid interference with the experimental results. After conducting field investigations, eight sampling points that met these criteria were selected (Figure 1 and Table 1). Fields of long-term daylily planting (more than 10 years, LD), short-term daylily planting (around 5 years, SD), and long-term maize cultivation (CK) were selected for each sampling point.
In the central area of each sample plot, a 2 × 2 m square area was demarcated, and after removing the litter from the surface, a soil profile at a depth of 1 m was excavated. The soil profile was divided into six layers: 0–10, 10–20, 20–30, 30–50, 50–70, and 70–100 cm. In each layer of soil, we used a ring-knife soil sampler with a volume of 200 cm3 to collect the undisturbed soil, and sampling was performed thrice per layer. The collected ring-knife samples were immediately packed into ziplock bags and shipped to the laboratory. Additionally, composite soil samples were separately collected from each layer. After removing rocks, roots, and nodules, the stratified soil samples were dried naturally under ventilation conditions. The well-mixed sample was divided into two parts: one was ground and passed through a 2 mm sieve for the subsequent determination of physical and chemical properties, and the other part was kept as a reserve (backup) sample.

2.3. Analysis of Soil Physical and Chemical Parameters

Soil bulk density (BD, g cm−3) was measured using the ring-knife method (200 cm3). The soil water content (SWC, %) was determined by drying the soil samples at 105 °C to a constant weight. The particle size distribution, defined as clay (<2 μm), silt (2–50 μm), or sand (50–2000 μm), was measured by a Mastersizer 3000 analyzer (Malvern Instruments, Malvern, UK).
SOC (g kg−1) content was determined using the dichromate oxidation method [32]. Soil total nitrogen (TN, g kg−1) was determined using the Kjeldahl method [32]. Soil pH was measured by the potentiometric method (soil–water ratio was 1:2.5) using a STARTER3100 Portable pH Meter (Ohaus International Trading (Shanghai) Co., Ltd., Shanghai, China) [32]. Soil available phosphorus (AP, mg kg−1) was determined using the sodium hydrogen carbonate solution–Mo-Sb anti-spectrophotometric method with a 722E Visible Spectrophotometer (Shanghai Spectrum Instrument Co., Ltd., Shanghai, China) [32]. Soil available potassium (AK, mg kg−1) was determined using the flame photometer method with an FP640 Flame Photometer (Shanghai INESA Analytical Instruments Co., Ltd., Shanghai, China) [32].

2.4. Statistical Analysis

The SOC density was calculated as follows [33]:
S O C   d e n s i t y i = S O C i × B D i × D i / 100
where SOC densityi is the SOC density (kg m−2) of layer i, SOCi is the SOC content (g kg−1) of layer i, BDi is the BD (g cm−3) of layer i, and Di is the soil layer thickness (cm) of layer i.
SOC stocks at 0–100 cm depth are the sum of the SOC densities of soil layers 0–100 cm, and the calculation of SOC stocks at 0–30 cm depth and SOC stocks at 30–100 cm depth was performed analogously.
The relative change in SOC stocks was calculated as follows [33]:
R e l a t i v e   C h a n g e   o f   S O C   s t o c k s = ( S O C   s t o c k s t S O C   s t o c k s c ) / S O C   s t o c k s c × 100
where Relative Change of SOC stocks is the relative change (%) in the SOC stocks of the treatment group versus the SOC stocks of the control group. SOC stockst and SOC stocksc are SOC stocks in the treatment group and control group, respectively. LD and SD were the treatment groups, while CK was the control group.
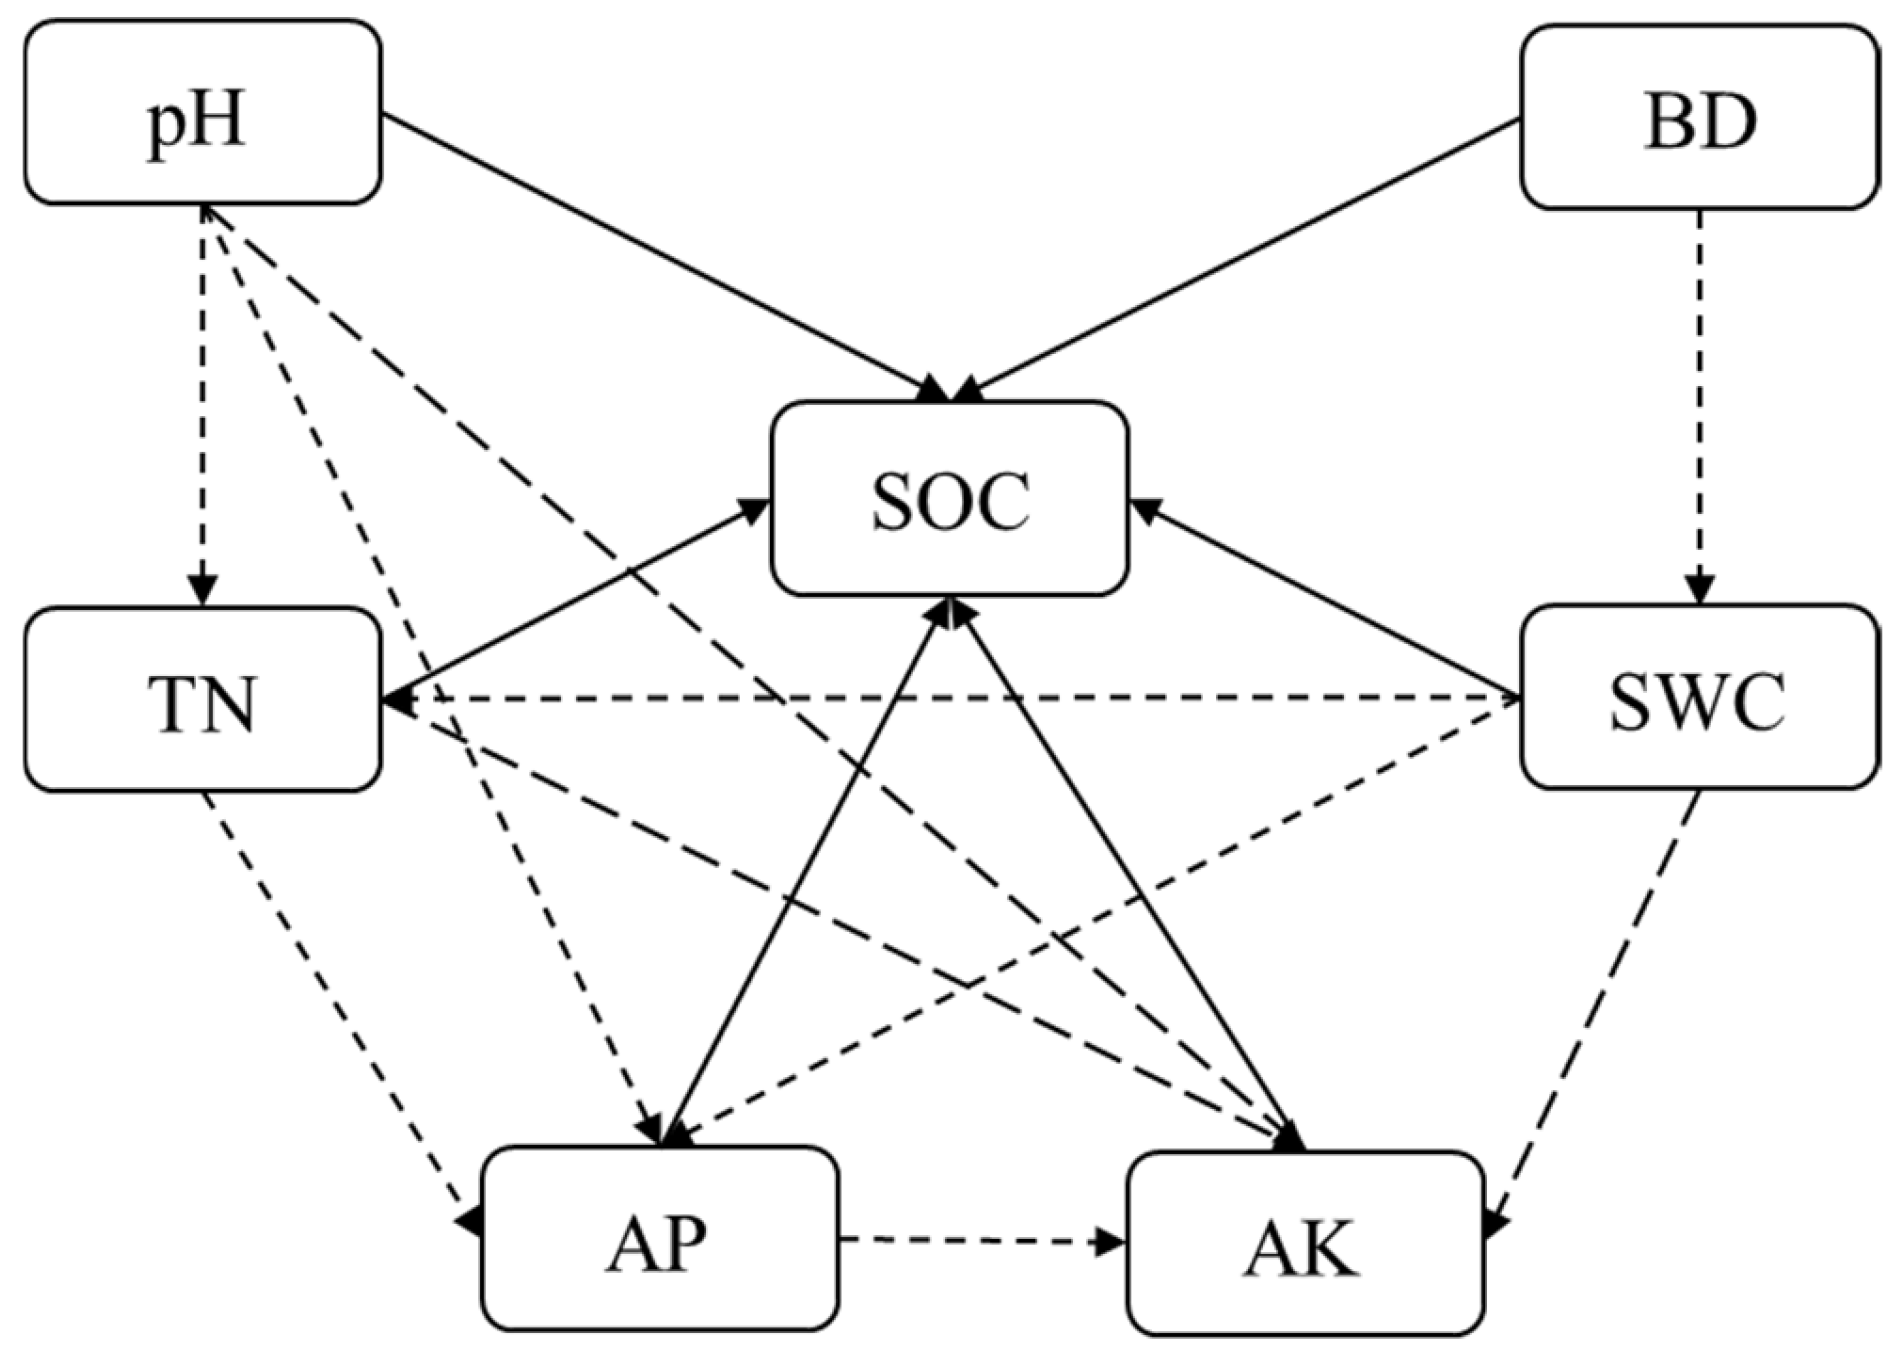
Structural equation modeling (SEM) is a combination of factor analysis and path analysis and is widely used in the analysis of relationships between variables in the covariance matrix of natural ecosystem variables [34,35,36]. Therefore, SEM was used to further analyze the effect of soil physical and chemical properties on SOC variations. A conceptual model illustrating the direct and indirect effects of soil physical and chemical properties on SOC content is shown in Figure 2, which is based on the following assumptions: various physical and chemical properties directly affect SOC; BD directly affects SWC; SWC and pH indirectly affect SOC through TN, AP, and AK; and AP directly affects AK.
A one-way analysis of variance (ANOVA) was conducted for SOC stocks at 0–100 cm depth to explore the differences in SOC stocks at 0–100 cm depth between different treatments and different sampling points. Duncan’s new multiple range test was used for multiple comparisons to determine statistical significance. To further explore the differences in the vertical distribution of SOC densities under different treatments, a variance analysis was performed based on soil layers with different treatments as fixed factors and different sampling points as random factors. To explore the relationship between SOC stocks at 0–100 cm depth and geographical factors, the correlation between SOC stocks at 0–100 cm depth and latitude and longitude, elevation, aspect, or slope was analyzed, and the “Random Forest” method based on classification trees was used for regression prediction analysis to explore the relative influence of geographical factors on SOC stocks at 0–100 cm depth. To reveal the internal relationship between the SOC density and soil physicochemical properties, Pearson’s correlation coefficient was used to measure the degree of the linear relationship between the SOC density and soil physicochemical factors, and SEM was used to explore the direct, indirect, and overall effects of soil physicochemical properties on the SOC density under different treatments. In view of the differences in soil properties across different soil layers, the influence of SOC content was analyzed instead of the SOC density to obtain more scientifically accurate and comparable results. General statistical analysis was performed using SPSS 27 (IBM, Armonk, NY, USA). SEM was performed using the AMOS (Analysis of Moment Structures) 21.0 module of SPSS. Model fit was evaluated by χ2/df (ideal range: 1–3), RMSEA (Root Mean Square Error of Approximation; ≤0.08), GFI (Goodness-of-Fit Index; ≥0.90), NFI (Normed Fit Index; ≥0.90), TLI (Tucker–Lewis Index; ≥0.90), and CFI (Comparative Fit Index; ≥0.95).

3. Results

3.1. Effects of Planting Daylilies on SOC Stocks at 0–100 cm Depth

Compared with CK, planting daylilies led to an increase in SOC stocks at a depth of 0–100 cm, particularly under the LD treatment, which significantly enhanced SOC stocks (p < 0.05). With the increase in the duration of daylily planting, there was a slight increase in SOC stocks, but the change was not significant (Table 2).
The average SOC stocks at 0–100 cm depth in the study area was 5.15 kg m−2, with significant differences among the sampling points (Table 2).

3.2. Effect of Planting Daylily on SOC Density of Profile

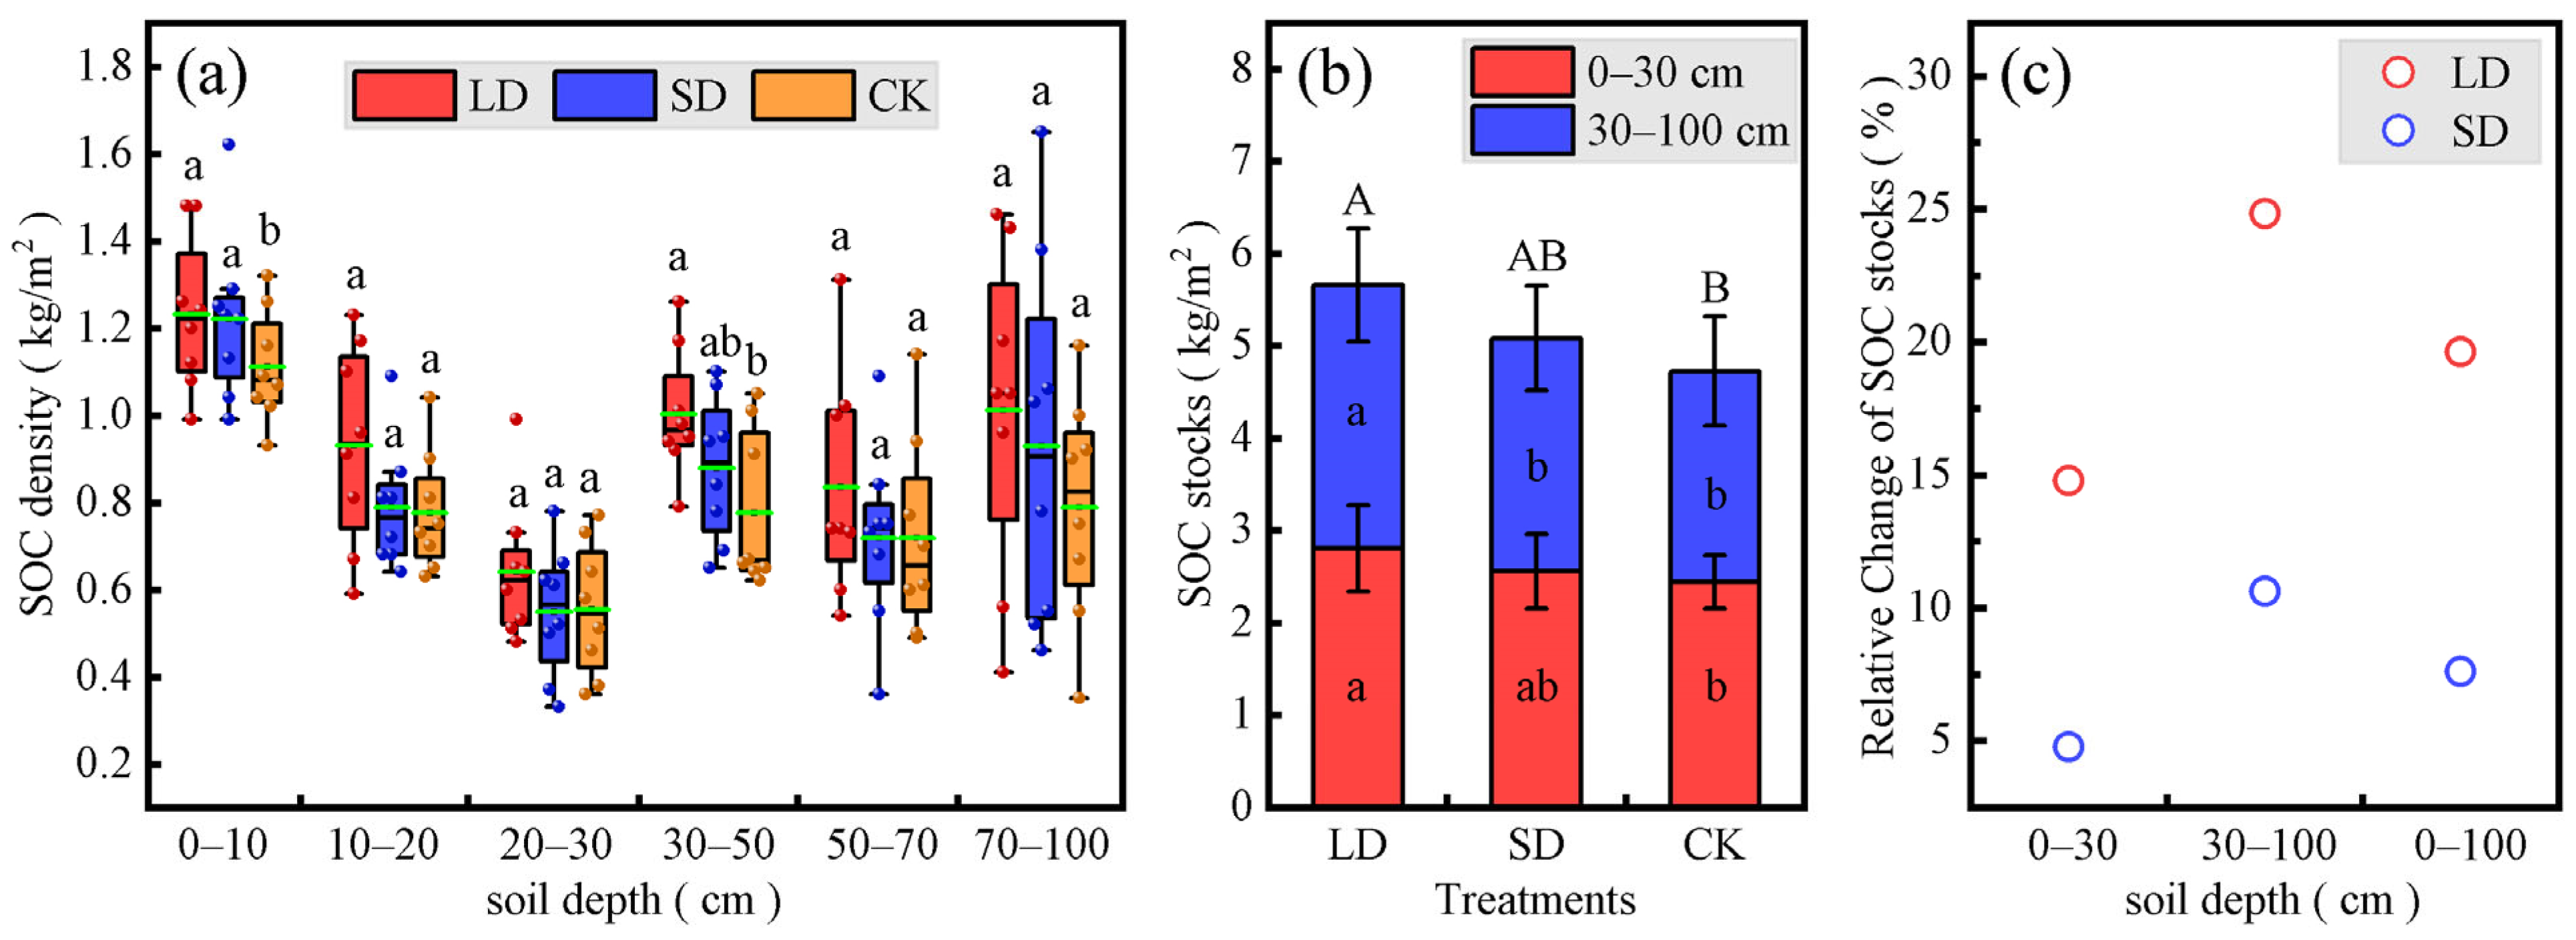
At 0–10 cm soil depth, the SOC densities of LD (1.23 kg m−2) and SD (1.22 kg m−2) were significantly higher than that of CK (1.11 kg m−2). At 30–50 cm soil depth, the SOC density of LD (1.00 kg m−2) was significantly greater than that of CK (0.78 kg m−2). The SOC densities of SD at soil depths of 10–20, 20–30, and 50–70 cm were similar to those of CK, whereas the SOC densities of LD in other soil layers were greater than those of CK, although the differences were not statistically significant (Figure 3a).
At a soil depth of 0–100 cm, the SOC stocks of LD (5.66 kg m−2) increased by 19.63% and SD (5.09 kg m−2) increased by 7.60% compared with those of CK (4.72 kg m−2) (Table 2 and Figure 3c). Further, the soil profile of 0–100 cm was divided into 0–30 cm (topsoil) and 30–100 cm (bottom soil) for analysis, which is an arbitrary cut-off value that is often used in studies related to SOC stocks [37]. In the topsoil, the SOC stocks at 0–30 cm depth of LD (2.80 kg m−2) were significantly increased by 14.79%, and those of SD (2.56 kg m−2) were increased by 4.76% compared with those of CK (2.44 kg m−2). In the bottom soil, the SOC stocks at 30–100 cm depth of LD (2.86 kg m−2) were significantly increased by 24.81% compared with those of CK (2.28 kg m−2), and SOC stocks at 30–100 cm depth of SD (2.53 kg m−2) were increased by 10.63% compared with those of CK (Figure 3b,c).

3.3. Influence of Geographic Factors on SOC Stocks at 0–100 cm Depth

The relationship between geographic factors and SOC stocks at 0–100 cm depth is shown in Figure 4. The relationship between SOC stocks and longitude (Figure 4a, R2 = 0.18, p = 0.13) was a quadratic function, and SOC stocks showed a decreasing trend with increasing longitude. SOC stocks were negatively correlated with latitude (Figure 4b, R2 = 0.12, p = 0.09) and elevation (Figure 4c, R2 = 0.20, p < 0.05). SOC stocks and aspect (Figure 4d, R2 = 0.21, p = 0.08) showed a quadratic function relationship; SOC stocks were higher on the northwest and north slopes and lower on the southeast and south slopes. SOC stocks were negatively correlated with the slope (Figure 4e, R2 = 0.15, p = 0.06).
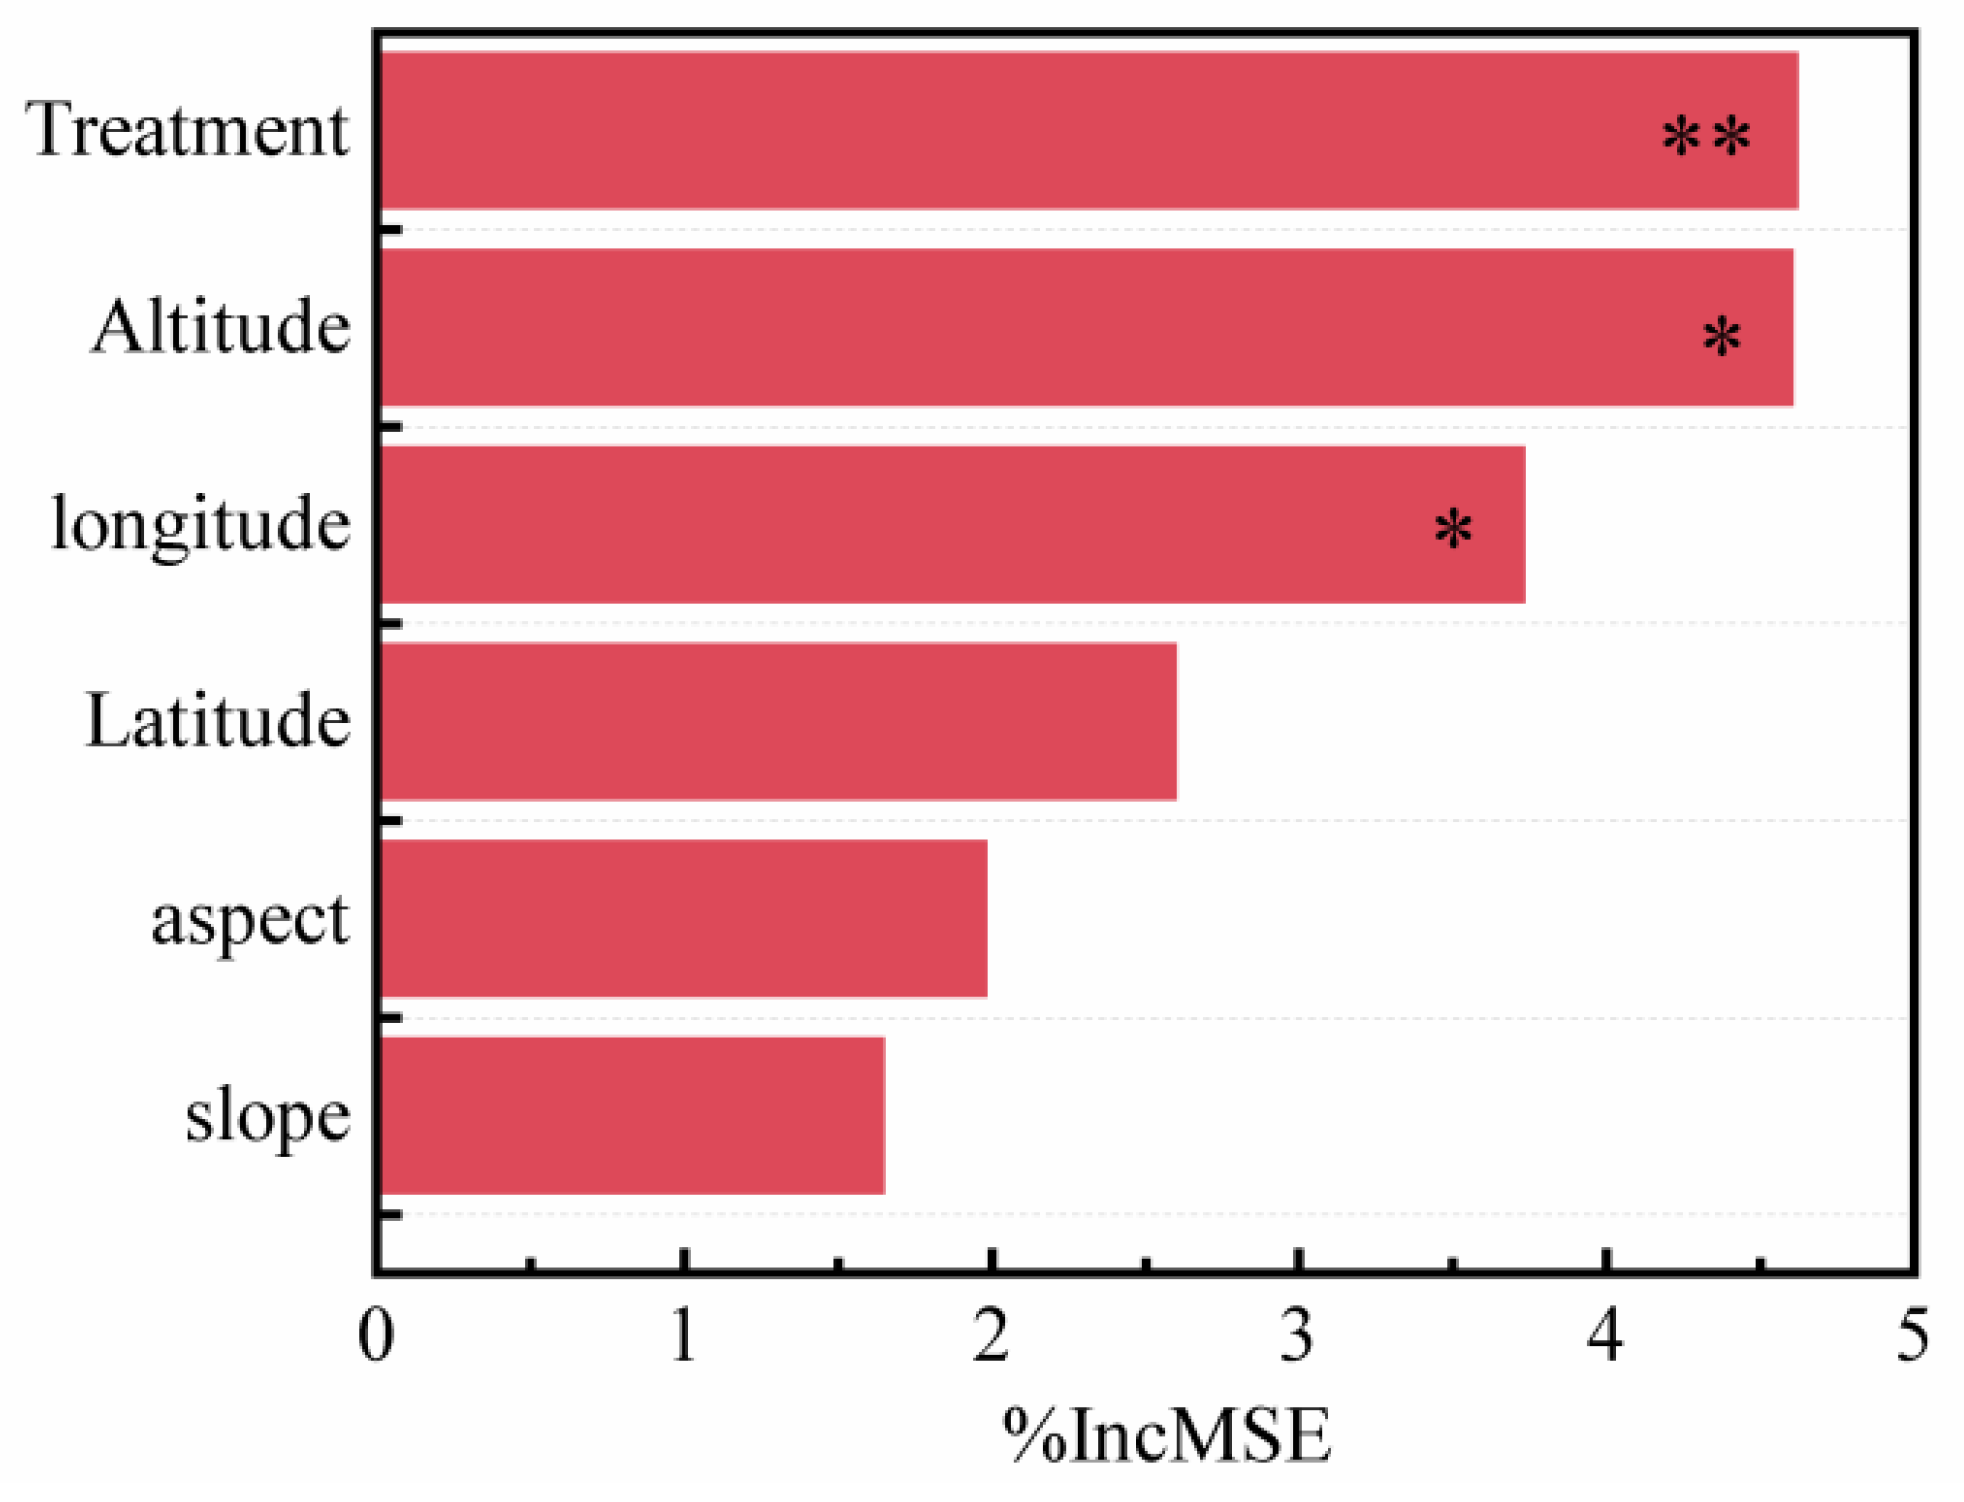
The random forest approach was used to perform the regression prediction analysis of SOC stocks at 0–100 cm depth changes, and the relative importance of the impact factors was obtained. The relative importance of the influencing factors for SOC stocks at 0–100 cm depth was as follows: treatment > elevation > longitude (p < 0.05, Figure 5). The influence of site effects on SOC stocks at 0–100 cm depth was the sum of the influences of various geographic factors. Therefore, the influence of site effects on SOC stocks was greater than that of different treatments. When studying SOC stocks in different crop types, paired sampling should be considered to reduce the influence of geographical factors.

3.4. Influence of Soil Physical and Chemical Properties on SOC Density

Soil properties differed to varying degrees under different treatments (Table 3). SOC and TN were significantly different among LD, SD, and CK, whereas other properties showed no significant differences. The SOC (4.92 g kg−1) and TN (0.48 g kg−1) of LD were significantly higher than those of CK, with no significant differences between SD and CK. The AP, AK, BD, and SWC of LD were lower than those of CK, whereas pH and clay content were higher, though the differences were not statistically significant.
The correlation analysis revealed differences in the relationships between the SOC density and soil physicochemical properties under LD, SD, and CK conditions (Figure 6). Under different treatments (LD, SD, and CK), soil nutrients (TN, AP, and AK) showed a strong positive correlation with SOC density (p < 0.01). Under the CK treatment, soil texture (clay, silt, and sand) showed significant correlations with SOC density (p < 0.05), whereas no significant correlations were observed between soil texture and SOC density under the LD or SD treatment. SWC showed a highly significant negative correlation with the SOC density under CK and SD (p < 0.01), but no significant negative correlation was observed under LD.
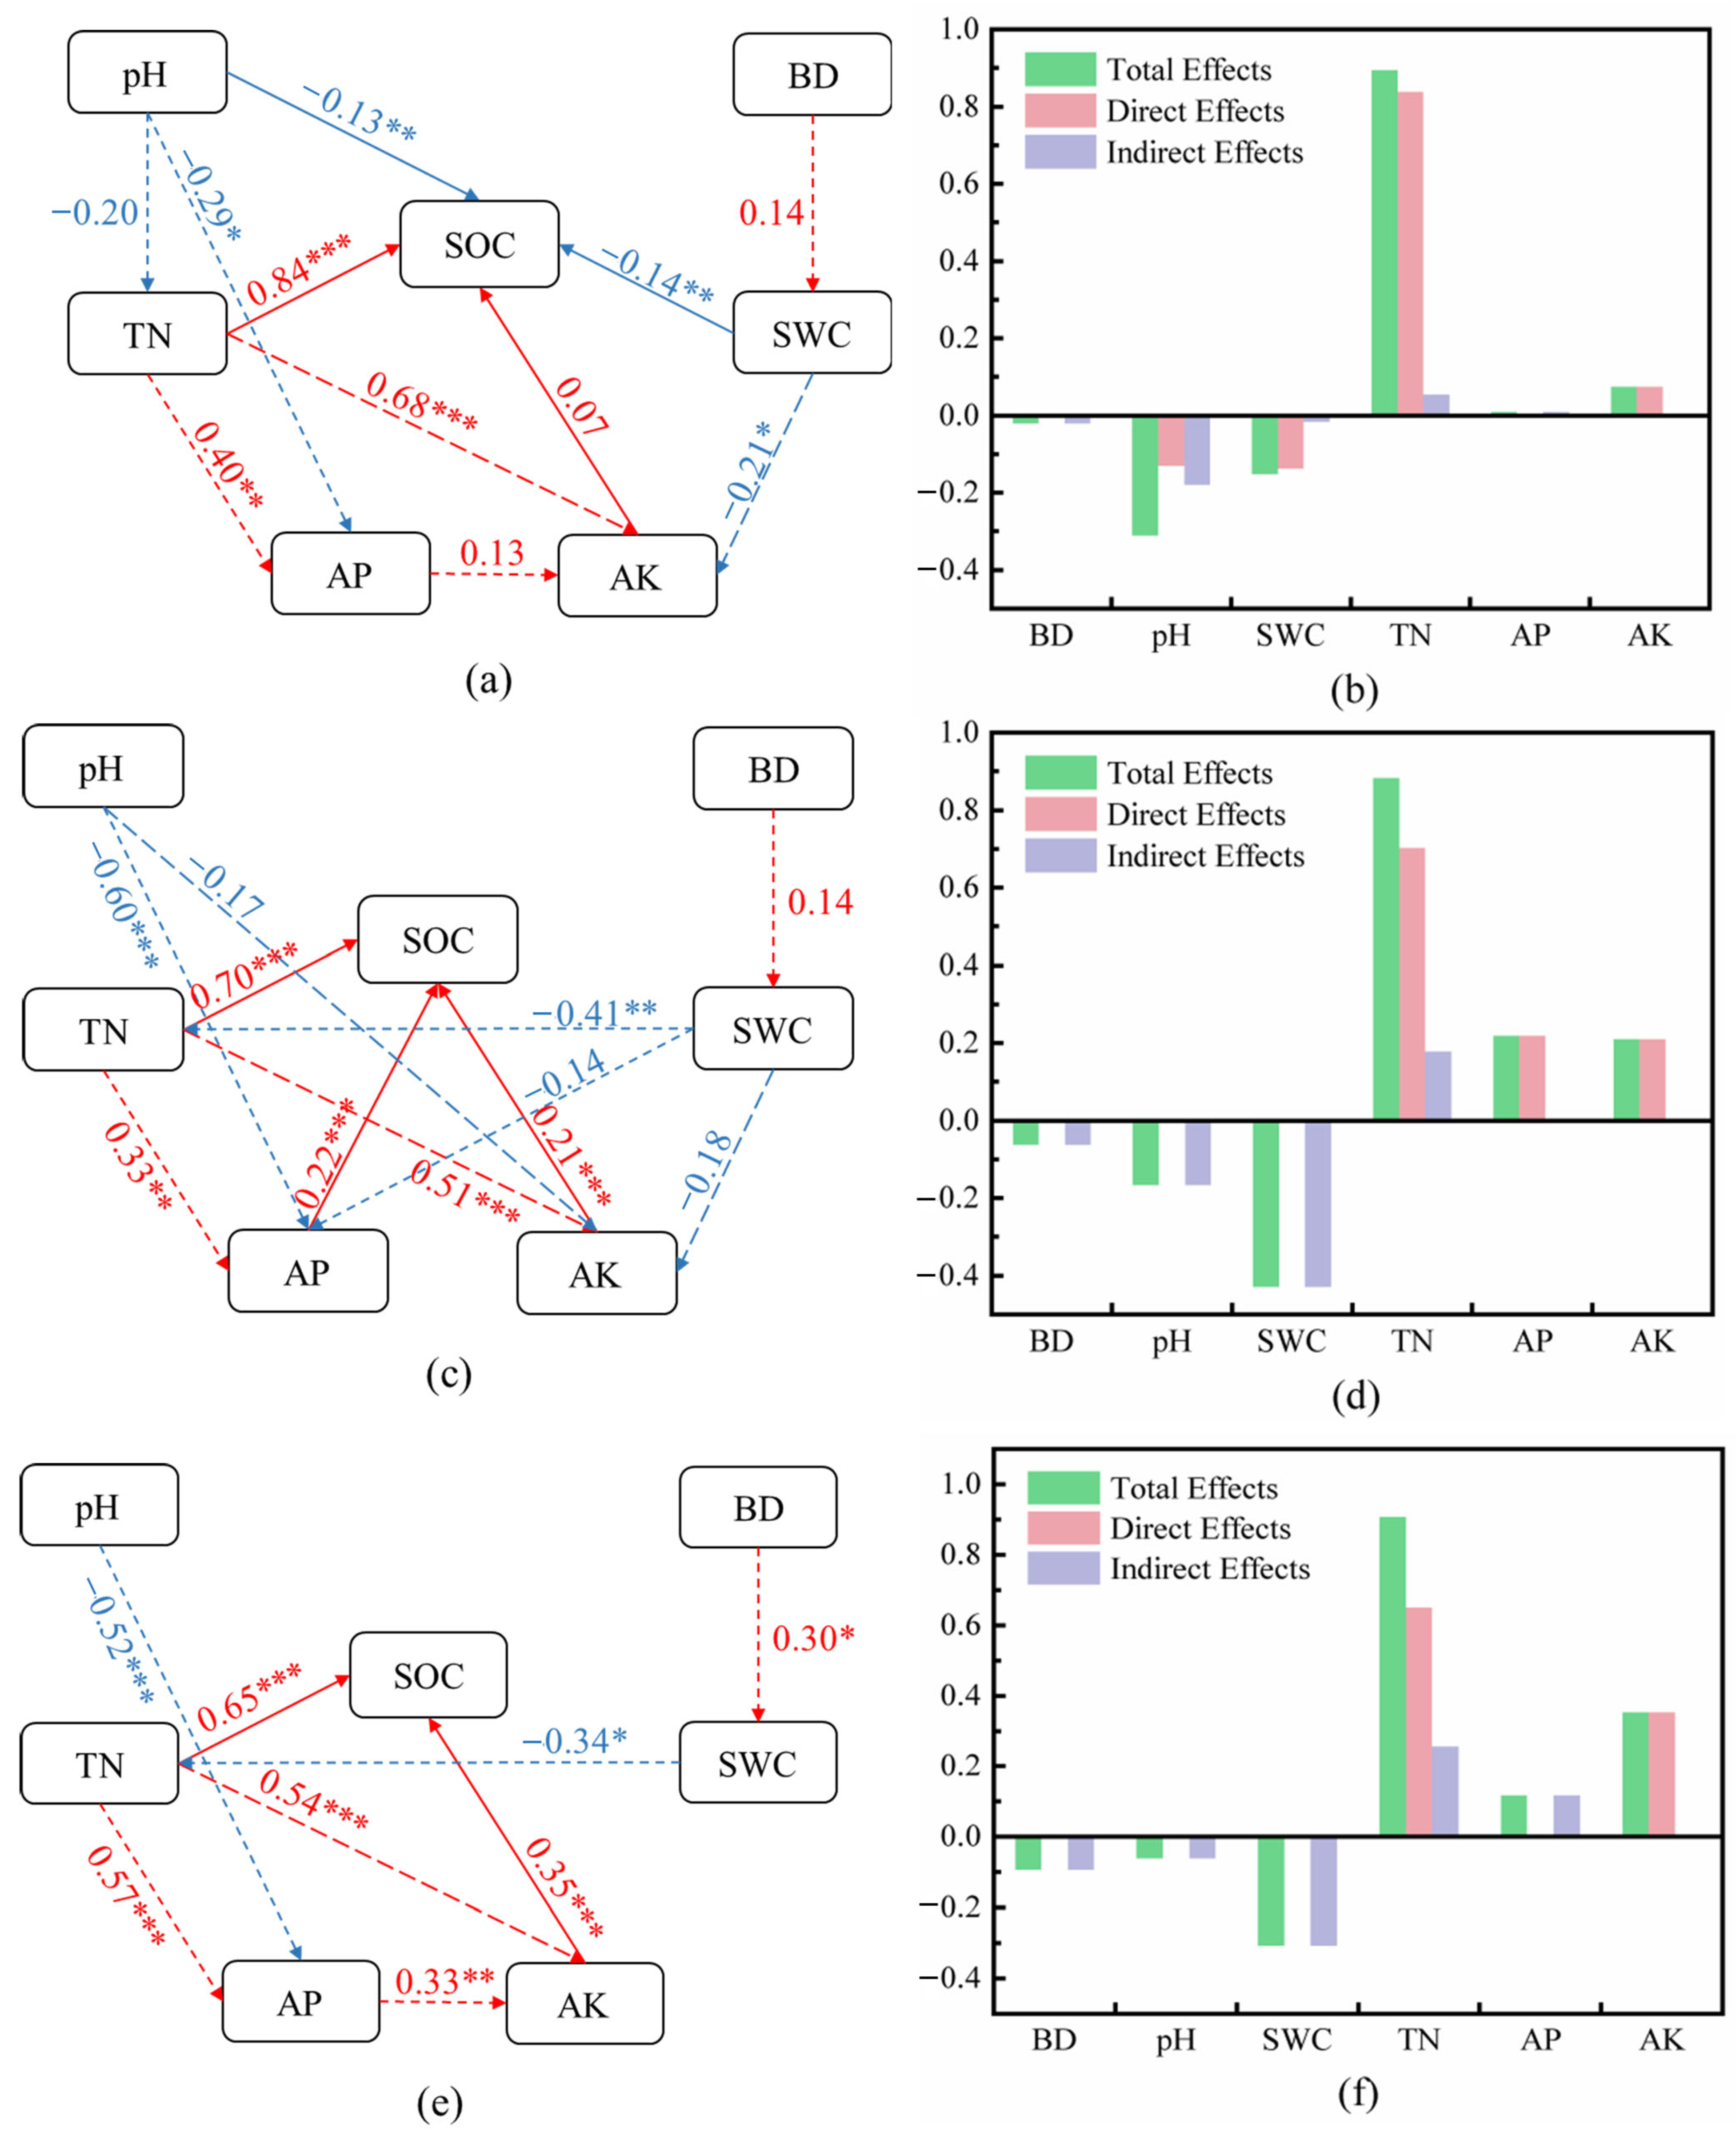
When analyzing the influences of soil physical and chemical properties on the SOC density under different treatments, the difference in soil properties in different soil layers is taken into account. To be more scientific and accurate, the influences of soil physical and chemical properties on SOC content under different treatments were analyzed instead of the SOC density. The effects of soil physical and chemical properties on the SOC content under different treatments were investigated using SEM. The physical and chemical properties of the soil explained 89%, 91%, and 88% of the SOC content changes under the LD, SD, and CK treatments, respectively (Figure 7). The SOC content of LD was directly affected by TN, AK, SWC, and pH (Figure 7a); that of SD was directly affected by TN, AP, and AK (Figure 7c); and that of CK was directly affected by TN and AK (Figure 7e). Regarding the total effect of soil physicochemical properties on SOC, LD was most affected by TN, followed by pH, SWC, AK, BD, and AP (Figure 7b). For SD, TN had the largest effect, followed by SWC, AP, AK, pH, and BD (Figure 7d). For CK, TN had the largest effect, followed by AK, SWC, AP, BD, and pH (Figure 7f).

4. Discussion

4.1. Effects of Daylilies on SOC Stocks at 0–100 cm Depth and Profile SOC Density

SOC stocks at 0–100 cm depth of LD (19.63%) in the agro-pastoral ecotone of northern China significantly increased compared with those of CK; SOC stocks at 0–100 cm depth of SD (7.60%) increased compared with those of CK, although this difference was not significant. These results are consistent with the findings of Ledo et al., who showed that organic carbon increased by 11% (±8.5) in the 0–100 cm soil profile of perennial crops, and that perennial crops accumulate SOC over time [6]. However, these findings differed from the results of Zhou et al., who demonstrated that short-term planting of mugwort is conducive to facilitating soil carbon fixation and carbon neutrality, rather than long-term planting of mugwort [38]. The first reason for this inconsistency may be that Zhou et al. selected only one site, which limited the robustness of their conclusions [38]. In contrast, Gentile et al. showed more robust and accurate results using multiple matching points [39]. The second reason is that the sampling depth was limited to just 0–20 cm. Chen et al. mentioned that SOC stocks are depth-dependent, the carbon sequestration mechanism of topsoil and subsoil is potentially different, and subsoil contains more than half of the organic carbon; therefore, it is necessary to study the subsoil [40].
In the vertical profile, the SOC densities of LD and SD were significantly higher than that of CK at 0–10 cm depth, and the SOC density of LD was significantly higher than that of CK at 30–50 cm depth. At 0–10 cm depth, the great root biomass may represent the main reason why the SOC density of daylilies was greater than that of CK. Compared with CK, LD and SD produced more biomass, and high root biomass is considered one of the most important factors for high SOC content [41]. At 30–50 cm depth, the SOC density of LD was significantly higher than that of CK, which may have resulted from the deeper roots of LD [42], root penetration changing the soil texture [43], and the growth of fine roots in deeper soil. The high turnover and secretion rates of fine roots affect the accumulation and stability of SOC [44]. According to Rasse et al., SOC is mainly derived from root C, root exudates, and fine root turnover [45].
The SOC density of LD had different degrees of enhancement in each layer compared with those of CK, whereas the SOC density of SD was similar to that of CK at 10–20 cm and 20–30 cm. This difference may be attributed to the priming effect [46,47] or interference when planting daylilies [48] and low productivity in the first years after the establishment of daylilies [49,50]. In addition, the relative increases in the SOC stocks of LD and SD compared with that of CK were higher in the subsoil than in the topsoil. This result may reflect the deeper roots of daylilies and the higher turnover and secretion rate of fine roots, which increase the quantity of SOC input. Consistent with the findings of WU et al., the SOC sequestration rate of perennial crops in the soil layers of 30–60 cm and >60 cm was significantly higher than that in the surface layer (0–30 cm) [51].

4.2. Influencing Factors of SOC Stocks and Profile SOC Density

The SOC stocks showed significant differences among different sampling points (p < 0.05) (Table 2). These variations can be attributed to natural geographic factors such as longitude, latitude, elevation, slope aspect, and slope gradient, which influence the microclimate and microtopography, thereby affecting SOC input and decomposition processes. SOC stocks were negatively correlated with both latitude and elevation, likely due to the decreasing temperatures at higher latitudes and elevations. This temperature reduction limits vegetation primary productivity [52], leading to reduced organic matter input into the soil and, consequently, lower SOC stocks. Longitude also exhibited a negative correlation with SOC stocks, possibly because increased precipitation at higher longitudes accelerates the decomposition of SOC [53], resulting in reduced SOC stocks. Moreover, SOC stocks on northern slopes were higher than on southern slopes. This is likely because northern slopes receive less sunlight, which lowers soil temperatures, while reduced evaporation enhances soil moisture retention, slowing the decomposition of SOC [54] and thereby increasing SOC stocks. Additionally, a linear negative correlation was observed between SOC stocks and the slope gradient. Steeper slopes may lead to faster water flow and more intense soil erosion, causing organic carbon to be more easily washed away and reducing its accumulation in the soil [55]. The relatively low R2 values obtained from the correlation analysis between geographical factors and SOC stocks in Figure 4 indicate that SOC storage is influenced by a complex interplay of multiple factors, and individual geographical factors have limited explanatory power [56]. However, this does not imply that the model is invalid. Instead, it highlights the necessity to incorporate additional potential influencing factors, such as vegetation types and soil nutrients [57], to provide a more comprehensive interpretation of the spatial distribution of SOC stocks.
SOC storage is influenced by site effects (including the natural geographic environment of the sampling points) and different treatments (including planting types and planting duration). The random forest analysis revealed that the relative importance of factors influencing SOC stocks at 0–100 cm depth was ranked as follows: treatment > elevation > longitude (p < 0.05, Figure 5). The influence of site effects on SOC stocks at 0–100 cm depth was the sum of the influences of various geographic factors. Therefore, the influence of site effects was greater than that of different treatments. This result is consistent with the conclusions of Rosinger et al., who found that the potential of SOC sequestration in farmlands is mainly affected by site effects rather than management measures [58]. Consequently, when studying the effects of different crop types on SOC stocks, paired sampling should be considered to minimize the influence of geographic factors on the results.
In addition to geographical factors, human factors significantly influence the SOC density. On the one hand, mechanical perturbations such as biomass harvesting and tillage reduce the quantity and quality of organic matter input to the soil and increase the decomposition rate of organic carbon in agro-ecosystems [59]. On the other hand, management activities such as fertilization, irrigation, and soil erosion control increase the accumulation of organic carbon [60,61]. The SOC content was positively correlated with TN, AP, and AK in the present study, indicating that fertilization, especially the application of nitrogen fertilizer, increased the accumulation of SOC. Rosinger et al. showed that soil organic matter concentration was positively correlated with soil N, P, and K [58]. The input of N and P can activate the crystalline Fe in the soil, which can enhance the stability of SOC by reducing its oxidation rate [62]. We found that the SOC content was negatively correlated with pH, which is consistent with the findings of Mora et al., who found that low pH can promote SOC storage by enhancing the formation of metal–humus complexes [63]. However, an excessively high pH value may lead to a decrease in microbial activity and affect the formation process of SOC. The negative correlation between the SOC density and BD is consistent with the results of Hobley et al.; although this correlation appears in the formula used to calculate the SOC density, it may be the result of the inverse relationship between the SOC content and BD [64].
At the local scale, the plant type can change the physical and chemical properties of the soil and is considered the main factor determining the depth distribution of SOC [63,65]. Using Pearson’s correlation analysis to explore the relationship between soil physicochemical properties and SOC density under different treatments (LD, SD, and CK), the results showed that soil texture (clay, silt, and sand contents) was significantly correlated with SOC density in CK, but the relationship was not significant in LD and SD. This may be because CK relies more heavily on the physical protection of SOC, while daylily planting (LD and SD) might influence root exudates or soil microbial activity, thereby weakening the significant impact of texture on the SOC density [66]. SWC was significantly negatively correlated with SOC density in CK and SD but not significantly correlated in LD. This could be attributed to the higher SWC in CK and SD treatments promoting the decomposition rate of organic matter, which, in turn, affects the SOC density. However, in the LD treatment, the deep-rooting characteristics and drought tolerance of the daylily may mitigate the negative effects of water content on the SOC density [67]. We quantified the specific mechanisms and pathways through which soil physicochemical properties directly or indirectly influence SOC content under different treatments (LD, SD, and CK) using SEM. The SOC content under LD was directly affected by TN, AK, SWC, and pH. In contrast, the SOC content under SD was directly affected by TN, AP, and AK, while the SOC content under CK was directly affected by TN and AK. LD affected soil physicochemical factors and their correlation with SOC content, thus affecting SOC accumulation.

4.3. Significance and Limitations

This study demonstrates the significant role of LD in enhancing SOC stocks. As a critical component of the global carbon cycle, increasing SOC stocks contributes to mitigating climate change [60]. Therefore, LD is vital not only for addressing climate change but also for promoting soil carbon sequestration, which has long-term environmental benefits. Beyond its contribution to carbon storage, LD also improves soil fertility, enhances water retention capacity, and helps reduce soil erosion. The benefits are particularly important in regions with poor ecological resilience, such as the agro-pastoral ecotone, where sustainable agricultural development is essential. By fostering healthier soils, LD can contribute to both ecological restoration and long-term agricultural productivity, ensuring a more sustainable future for these vulnerable regions.
Although this study highlights the positive effects of daylily cultivation on increasing SOC stocks, further research is needed to explore its underlying mechanisms. Future studies could focus on various aspects, including differences in aboveground and belowground biomass, the accumulation and transformation of different carbon fractions, and the roles of root systems and microbial activity in carbon cycling. These investigations would provide a theoretical foundation for a more comprehensive understanding of the impact of daylily cultivation on SOC accumulation and offer practical guidance for soil carbon management and ecological restoration.

5. Conclusions

This study explored the effects of LD and SD on SOC stocks and the factors influencing them in the agro-pastoral ecotone of northern China. It was found that LD significantly increased SOC stocks at 0–100 cm depth compared with CK, whereas SD showed no significant differences from CK. Site effects were found to have a stronger influence on SOC stocks at 0–100 cm depth than the crop type across different geographic locations. At the same location, SEM revealed that soil factors influenced SOC differently across treatments: for LD, TN > pH > SWC; for SD, TN > SWC > AP; and for CK, TN > AK > SWC. Considering the economic and ecological benefits of daylily planting, LD represents a promising strategy for enhancing carbon sequestration in the agro-pastoral ecotone of northern China.

Author Contributions

Conceptualization, Z.W. and R.B.; data curation, R.B. and Z.W.; formal analysis, Z.W. and Z.Y.; funding acquisition, R.B.; investigation, Z.W. and Z.Y.; methodology, Z.W. and Z.Y.; resources, Z.W. and Z.Y.; software, Z.W.; supervision, R.B., H.Z. and Z.W.; writing—original draft, Z.W.; writing—review and editing, Z.W., H.Z. and R.B. All authors have read and agreed to the published version of the manuscript.

Funding

This work was supported by the National Key Research and Development Program of China (2021YFD1600301), the National Natural Science Foundation of China (32371971), and the School-level Educational Reform Project (JG-202212).

Data Availability Statement

The original contributions presented in the study are included in the article. Further inquiries can be directed to the corresponding author.

Conflicts of Interest

The authors declare no conflicts of interest.

Abbreviations

The following abbreviations are used in this manuscript:
LDLong-term daylily cultivation
SDShort-term daylily cultivation
CKLong-term maize cultivation
S.D.Standard deviation
BDSoil bulk density
SWCSoil water content
SOCSoil organic carbon
TNSoil total nitrogen
APSoil available phosphorus
AKSoil available potassium
SEMstructural equation modeling

References

  1. Ferchaud, F.; Vitte, G.; Mary, B. Changes in soil carbon stocks under perennial and annual bioenergy crops. GCB Bioenergy 2016, 8, 290–306. [Google Scholar] [CrossRef]
  2. Carvalho, J.L.N.; Hudiburg, T.W.; Franco, H.C.J.; DeLucia, E.H. Contribution of above- and belowground bioenergy crop residues to soil carbon. GCB Bioenergy 2017, 9, 1333–1343. [Google Scholar] [CrossRef]
  3. Chimento, C.; Almagro, M.; Amaducci, S. Carbon sequestration potential in perennial bioenergy crops: The importance of organic matter inputs and its physical protection. GCB Bioenergy 2016, 8, 111–121. [Google Scholar] [CrossRef]
  4. McGowan, A.R.; Nicoloso, R.S.; Diop, H.E.; Roozeboom, K.L.; Rice, C.W. Soil Organic Carbon, Aggregation, and Microbial Community Structure in Annual and Perennial Biofuel Crops. Agron. J. 2019, 111, 128–142. [Google Scholar] [CrossRef]
  5. Rui, Y.; Jackson, R.D.; Cotrufo, M.F.; Sanford, G.R.; Spiesman, B.J.; Deiss, L.; Culman, S.W.; Liang, C.; Ruark, M.D. Persistent soil carbon enhanced in Mollisols by well-managed grasslands but not annual grain or dairy forage cropping systems. Proc. Natl. Acad. Sci. USA 2022, 119, e2118931119. [Google Scholar] [CrossRef]
  6. Ledo, A.; Smith, P.; Zerihun, A.; Whitaker, J.; Vicente-Vicente, J.L.; Qin, Z.C.; McNamara, N.P.; Zinn, Y.L.; Llorente, M.; Liebig, M.; et al. Changes in soil organic carbon under perennial crops. Global Change Biol. 2020, 26, 4158–4168. [Google Scholar] [CrossRef]
  7. Siddique, I.A.; Grados, D.; Chen, J.; Laerke, P.E.; Jorgensen, U. Soil organic carbon stock change following perennialization: A meta-analysis. Agron. Sustain. Dev. 2023, 43, 18. [Google Scholar] [CrossRef]
  8. Wang, L.; Tang, L.L.; Wang, X.; Chen, F. Effects of alley crop planting on soil and nutrient losses in the citrus orchards of the Three Gorges Region. Soil Tillage Res. 2010, 110, 243–250. [Google Scholar] [CrossRef]
  9. Zheng, H.J.; Li, H.R.; Mo, M.H.; Song, Y.J.; Liu, Z.; Zhang, H.M. Quantified Benefits of Cultivating Daylily (Hemerocallis citrina) Hedgerows over Multiple Years on Sloped Red-Soil Farmland, Southern China. J. Soil Sci. Plant Nutr. 2021, 21, 69–80. [Google Scholar] [CrossRef]
  10. Li, X.K.; Cui, J.L.; Qin, X.M.; Wang, J.H.; Wang, M.L. Metabolic and transcriptional regulatory mechanisms of differential carbohydrates formation from flower buds to flowers of Hemerocallis citrina. Sci. Hortic. 2023, 308, 111553. [Google Scholar] [CrossRef]
  11. Ou, X.; Liu, G.; Wu, L.-H. The complete chloroplast genome of Hemerocallis citrina (Asphodelaceae), an ornamental and medicinal plant. Mitochondrial DNA B 2020, 5, 1109–1110. [Google Scholar] [CrossRef] [PubMed]
  12. Ma, X.R.; Wang, L.D.; Zhu, H.F.; Peng, J.J.; Bi, R.T. Impact of Soil Factors on the Yield and Agronomic Traits of Hemerocallis citrina Baroni in the Agro-Pastoral Ecotone of Northern China. Agronomy 2024, 14, 967. [Google Scholar] [CrossRef]
  13. Dungait, J.A.; Hopkins, D.W.; Gregory, A.S.; Whitmore, A.P. Soil organic matter turnover is governed by accessibility not recalcitrance. Global Change Biol. 2012, 18, 1781–1796. [Google Scholar] [CrossRef]
  14. Lehmann, J.; Kleber, M. The contentious nature of soil organic matter. Nature 2015, 528, 60–68. [Google Scholar] [CrossRef] [PubMed]
  15. Luo, Z.; Feng, W.; Luo, Y.; Baldock, J.; Wang, E. Soil organic carbon dynamics jointly controlled by climate, carbon inputs, soil properties and soil carbon fractions. Global Change Biol. 2017, 23, 4430–4439. [Google Scholar] [CrossRef]
  16. Carvalhais, N.; Forkel, M.; Khomik, M.; Bellarby, J.; Jung, M.; Migliavacca, M.; Saatchi, S.; Santoro, M.; Thurner, M.; Weber, U. Global covariation of carbon turnover times with climate in terrestrial ecosystems. Nature 2014, 514, 213–217. [Google Scholar] [CrossRef]
  17. Xin, Z.; Qin, Y.; Yu, X. Spatial variability in soil organic carbon and its influencing factors in a hilly watershed of the Loess Plateau, China. Catena 2016, 137, 660–669. [Google Scholar] [CrossRef]
  18. Jackson, R.; Schenk, H.; Jobbagy, E.; Canadell, J.; Colello, G.; Dickinson, R.; Field, C.; Friedlingstein, P.; Heimann, M.; Hibbard, K. Belowground consequences of vegetation change and their treatment in models. Ecol. Appl. 2000, 10, 470–483. [Google Scholar]
  19. Xia, S.; Song, Z.; Van Zwieten, L.; Guo, L.; Yu, C.; Wang, W.; Li, Q.; Hartley, I.P.; Yang, Y.; Liu, H. Storage, patterns and influencing factors for soil organic carbon in coastal wetlands of China. Global Change Biol. 2022, 28, 6065–6085. [Google Scholar] [CrossRef]
  20. Sun, H.; Jiang, J.; Cui, L.; Feng, W.; Wang, Y.; Zhang, J. Soil organic carbon stabilization mechanisms in a subtropical mangrove and salt marsh ecosystems. Sci. Total Environ. 2019, 673, 502–510. [Google Scholar] [CrossRef]
  21. Duan, X.; Yu, X.; Li, Z.; Wang, Q.; Liu, Z.; Zou, Y. Iron-bound organic carbon is conserved in the rhizosphere soil of freshwater wetlands. Soil Biol. Biochem. 2020, 149, 107949. [Google Scholar] [CrossRef]
  22. Feng, W.; Plante, A.F.; Six, J. Improving estimates of maximal organic carbon stabilization by fine soil particles. Biogeochemistry 2013, 112, 81–93. [Google Scholar] [CrossRef]
  23. Sui, X.; Zhang, R.; Frey, B.; Yang, L.; Liu, Y.; Ni, H.; Li, M.H. Soil physicochemical properties drive the variation in soil microbial communities along a forest successional series in a degraded wetland in northeastern China. Ecol. Evol. 2021, 11, 2194–2208. [Google Scholar] [CrossRef]
  24. Zhang, Y.; Li, C.; Trettin, C.C.; Li, H.; Sun, G. An integrated model of soil, hydrology, and vegetation for carbon dynamics in wetland ecosystems. Global Biogeochem. Cycles 2002, 16, 1061. [Google Scholar] [CrossRef]
  25. Yang, R.M. Interacting Effects of Plant Invasion, Climate, and Soils on Soil Organic Carbon Storage in Coastal Wetlands. J. Geophys. Res. Biogeosci. 2019, 124, 2554–2564. [Google Scholar] [CrossRef]
  26. Shi, S.W.; Zhang, W.; Zhang, P.; Yu, Y.Q.; Ding, F. A synthesis of change in deep soil organic carbon stores with afforestation of agricultural soils. For. Ecol. Manag. 2013, 296, 53–63. [Google Scholar] [CrossRef]
  27. Syswerda, S.P.; Corbin, A.T.; Mokma, D.L.; Kravchenko, A.N.; Robertson, G.P. Agricultural Management and Soil Carbon Storage in Surface vs. Deep Layers. Soil Sci. Soc. Am. J. 2011, 75, 92–101. [Google Scholar] [CrossRef]
  28. Gauder, M.; Billen, N.; Zikeli, S.; Laub, M.; Graeff-Hönninger, S.; Claupein, W. Soil carbon stocks in different bioenergy cropping systems including subsoil. Soil Tillage Res. 2016, 155, 308–317. [Google Scholar] [CrossRef]
  29. Guo, Z.C.; Li, Y.Q.; Wang, X.Y.; Gong, X.W.; Chen, Y.; Cao, W.J. Remote Sensing of Soil Organic Carbon at Regional Scale Based on Deep Learning: A Case Study of Agro-Pastoral Ecotone in Northern China. Remote Sens. 2023, 15, 3846. [Google Scholar] [CrossRef]
  30. Wang, X.Y.; Li, Y.G.; Gong, X.W.; Niu, Y.Y.; Chen, Y.P.; Shi, X.P.; Li, W. Storage, pattern and driving factors of soil organic carbon in an ecologically fragile zone of northern China. Geoderma 2019, 343, 155–165. [Google Scholar] [CrossRef]
  31. Lu, H.Y.; Chen, X.Y.; Ma, K.; Zhou, S.W.; Yi, J.L.; Qi, Y.J.; Hao, J.L.; Chen, F.; Wen, X.Y. Soil health assessment under different soil and irrigation types in the agro-pastoral ecotone of northern China. Catena 2024, 235, 107655. [Google Scholar] [CrossRef]
  32. Bao, S. Soil Agro-Chemistrical Analysis; China Agriculture Press: Beijing, China, 2008. (In Chinese) [Google Scholar]
  33. Xu, Y.; Zhou, J.; Liu, C.Y.; Jia, R.; Ji, H.J.; Dippold, M.A.; Zhao, T.; Pavinato, P.S.; Peixoxo, L.; Yang, Y.D.; et al. Long-term rotational and perennial cropping benefit soil organic carbon stocks and ecosystem multifunctionality. Ind. Crops Prod. 2024, 209, 117980. [Google Scholar] [CrossRef]
  34. Jin, Z.W.; Ping, L.F.; Wong, M.H. Systematic relationship between soil properties and organic carbon mineralization based on structural equation modeling analysis. J. Clean. Prod. 2020, 277, 123338. [Google Scholar] [CrossRef]
  35. Zhu, H.F.; Zhao, Y.; Nan, F.; Duan, Y.H.; Bi, R.T. Relative influence of soil chemistry and topography on soil available micronutrients by structural equation modeling. J. Soil Sci. Plant Nutr. 2016, 16, 1038–1051. [Google Scholar] [CrossRef]
  36. Ding, H.X.; Zhu, H.F.; Sun, R.P.; Wen, W.J.; Bi, R.T. Variation in the physical properties of soil in relation to natural and anthropogenic factors in the hilly loess region of China. Catena 2024, 236, 107751. [Google Scholar] [CrossRef]
  37. Balesdent, J.; Basile-Doelsch, I.; Chadoeuf, J.; Cornu, S.; Derrien, D.; Fekiacova, Z.; Hatté, C. Atmosphere-soil carbon transfer as a function of soil depth. Nature 2018, 559, 599–602. [Google Scholar] [CrossRef]
  38. Zhou, Z.; Tian, F.; Zhao, X.; Zhang, K.; Han, S. Short-term but not long-term perennial mugwort cropping increases soil organic carbon in Northern China Plain. Front. Plant Sci. 2022, 13, 975169. [Google Scholar] [CrossRef]
  39. Gentile, R.M.; Malepfane, N.M.; van den Dijssel, C.; Arnold, N.; Liu, J.; Müller, K. Comparing deep soil organic carbon stocks under kiwifruit and pasture land uses in New Zealand. Agric. Ecosyst. Environ. 2021, 306, 107190. [Google Scholar] [CrossRef]
  40. Chen, J.; Luo, Y.Q.; Kätterer, T.; Olesen, J.E. Depth-dependent responses of soil organic carbon stock under annual and perennial cropping systems. Proc. Natl. Acad. Sci. USA 2022, 119, e2203486119. [Google Scholar] [CrossRef]
  41. Lemus, R.; Lal, R. Bioenergy crops and carbon sequestration. Crit. Rev. Plant Sci. 2005, 24, 1–21. [Google Scholar] [CrossRef]
  42. Tang, F.H.M.; Crews, T.E.; Brunsell, N.A.; Vico, G. Perennial intermediate wheatgrass accumulates more soil organic carbon than annual winter wheat—A model assessment. Plant Soil 2024, 494, 509–528. [Google Scholar] [CrossRef]
  43. Reynolds, W.D.; Bowman, B.T.; Drury, C.F.; Tan, C.S.; Lu, X. Indicators of good soil physical quality: Density and storage parameters. Geoderma 2002, 110, 131–146. [Google Scholar] [CrossRef]
  44. Shahzad, T.; Chenu, C.; Genet, P.; Barot, S.; Perveen, N.; Mougin, C.; Fontaine, S. Contribution of exudates, arbuscular mycorrhizal fungi and litter depositions to the rhizosphere priming effect induced by grassland species. Soil Biol. Biochem. 2015, 80, 146–155. [Google Scholar] [CrossRef]
  45. Rasse, D.P.; Rumpel, C.; Dignac, M.F. Is soil carbon mostly root carbon? Mechanisms for a specific stabilisation. Plant Soil 2005, 269, 341–356. [Google Scholar] [CrossRef]
  46. Thiessen, S.; Gleixner, G.; Wutzler, T.; Reichstein, M. Both priming and temperature sensitivity of soil organic matter decomposition depend on microbial biomass—An incubation study. Soil Biol. Biochem. 2013, 57, 739–748. [Google Scholar] [CrossRef]
  47. Wutzler, T.; Reichstein, M. Priming and substrate quality interactions in soil organic matter models. Biogeosciences 2013, 10, 2089–2103. [Google Scholar] [CrossRef]
  48. Smith, P. Soils as carbon sinks: The global context. Soil Use Manag. 2004, 20, 212–218. [Google Scholar] [CrossRef]
  49. Zhang, K.; Dang, H.; Tan, S.; Cheng, X.; Zhang, Q. Change in soil organic carbon following the ‘Grain-for-Green’programme in China. Land Degrad. Dev. 2010, 21, 13–23. [Google Scholar] [CrossRef]
  50. Laganiere, J.; Angers, D.A.; Pare, D. Carbon accumulation in agricultural soils after afforestation: A meta-analysis. Global Change Biol. 2010, 16, 439–453. [Google Scholar] [CrossRef]
  51. Wu, Y.N.; Huang, H.R.; Chen, F.; Tan, T.S.; Xu, Y. Soil organic carbon sequestration rate and spatiotemporal dynamics under perennial energy crops cultivation: A global meta-analysis. Soil Tillage Res. 2024, 240, 106064. [Google Scholar] [CrossRef]
  52. Wang, X.W.; Li, X.Z.; Hu, Y.M.; Lv, J.J.; Sun, J.; Li, Z.M.; Wu, Z.F. Effect of temperature and moisture on soil organic carbon mineralization of predominantly permafrost peatland in the Great Hing’an Mountains, Northeastern China. J. Environ. Sci. 2010, 22, 1057–1066. [Google Scholar] [CrossRef]
  53. Chen, S.T.; Huang, Y.; Zou, J.W.; Shi, Y.S. Mean residence time of global topsoil organic carbon depends on temperature, precipitation and soil nitrogen. Glob. Planet. Change 2013, 100, 99–108. [Google Scholar] [CrossRef]
  54. Bangroo, S.A.; Najar, G.R.; Rasool, A. Effect of altitude and aspect on soil organic carbon and nitrogen stocks in the Himalayan Mawer Forest Range. Catena 2017, 158, 63–68. [Google Scholar] [CrossRef]
  55. Zhu, H.F.; Nan, F.; Xu, Z.J.; Jing, Y.D.; Duan, Y.H.; Bi, R.T. Multi-scale spatial relationships between soil organic matter and influencing factors in basins of the Chinese Loess Plateau. Acta Ecol. Sin. 2017, 37, 8348–8360. [Google Scholar] [CrossRef]
  56. Nan, F.S.; Li, Z.X.; Zhang, X.P.; Cui, Q.; Li, Y.C.; Xiong, X.T.; Yang, X.J.; Yang, A.L. Spatial Distribution Characteristics and Influencing Factors of Soil Organic Carbon Density in Yellow River Basin Based on MGWR Mode. Environ. Sci. 2023, 44, 912–923. [Google Scholar] [CrossRef]
  57. Yang, J.G.; Zhang, L.W.; Guo, X.; Lu, Y.X.; Guo, H.; Zhang, Y.M.; Zhou, X.B. Vertical Distribution Characteristics and Influencing Factors of Soil Organic Carbon under Biological Soil Crusts in the Gurbantunggut Desert. Acta Ecol. Sin. 2024, 44, 2946–2954. [Google Scholar] [CrossRef]
  58. Rosinger, C.; Keiblinger, K.; Bieber, M.; Bernardini, L.G.; Huber, S.; Mentler, A.; Sae-Tun, O.; Scharf, B.; Bodner, G. On-farm soil organic carbon sequestration potentials are dominated by site effects, not by management practices. Geoderma 2023, 433, 116466. [Google Scholar] [CrossRef]
  59. Fan, L.; Han, W. Soil respiration after forest conversion to tea gardens: A chronosequence study. Catena 2020, 190, 104532. [Google Scholar] [CrossRef]
  60. Lal, R. Soil carbon sequestration impacts on global climate change and food security. Science 2004, 304, 1623–1627. [Google Scholar] [CrossRef]
  61. Thapa, R.B.; Budhathoki, S.; Shilpakar, C.; Panday, D.; Alsunuse, B.; Tang, S.X.; Stahl, P.D. Enhancing Corn Yield and Soil Quality in Irrigated Semiarid Region with Coal Char and Biochar Amendments. Soil Syst. 2024, 8, 82. [Google Scholar] [CrossRef]
  62. Di, S.; Zong, M.; Li, S.; Li, H.; Duan, C.; Peng, C.; Zhao, Y.; Bai, J.; Lin, C.; Feng, Y. The effects of the soil environment on soil organic carbon in tea plantations in Xishuangbanna, southwestern China. Agric. Ecosyst. Environ. 2020, 297, 106951. [Google Scholar] [CrossRef]
  63. Mora, J.L.; Guerra, J.A.; Armas-Herrera, C.M.; Arbelo, C.D.; Rodríguez-Rodríguez, A. Storage and depth distribution of organic carbon in volcanic soils as affected by environmental and pedological factors. Catena 2014, 123, 163–175. [Google Scholar] [CrossRef]
  64. Hobley, E.; Wilson, B.; Wilkie, A.; Gray, J.; Koen, T. Drivers of soil organic carbon storage and vertical distribution in Eastern Australia. Plant Soil 2015, 390, 111–127. [Google Scholar] [CrossRef]
  65. Jobbágy, E.G.; Jackson, R.B. The vertical distribution of soil organic carbon and its relation to climate and vegetation. Ecol. Appl. 2000, 10, 423–436. [Google Scholar] [CrossRef]
  66. Six, J.; Elliott, E.; Paustian, K. Soil structure and soil organic matter II. A normalized stability index and the effect of mineralogy. Soil Sci. Soc. Am. J. 2000, 64, 1042–1049. [Google Scholar] [CrossRef]
  67. Berhe, A.A.; Harte, J.; Harden, J.W.; Torn, M.S. The significance of the erosion-induced terrestrial carbon sink. Bioscience 2007, 57, 337–346. [Google Scholar] [CrossRef]
Figure 1. Geographical location and sampling points in the study area. Note: ZGZ is the abbreviation for Zhong Gao Zhuang Village, XYJ for Xia Yu Jian Village, DS for Du Shu Village, GJYT for Guo Jia Yao Tou Village, SYJ for Shang Yu Jian Village, SZZ for Shan Zi Zao Village, XJB for Xu Jia Bao Village, and SJZ for Su Jia Zhai Village.
Agronomy 15 00756 g001
Figure 2. Conceptual equation model of SOC content and soil physical and chemical properties. Solid lines represent the direct effects of soil physical and chemical properties on SOC content, while dotted lines indicate the indirect effects. Abbreviations: BD, soil bulk density; SWC, soil water content; SOC, soil organic carbon; TN, soil total nitrogen; AP, soil available phosphorus; pH, soil pH; AK, soil available potassium.
Agronomy 15 00756 g002
Figure 3. The influence of planting daylilies on the SOC density of the soil profile. (a) The vertical distribution of SOC densities for different treatments, (b) SOC stocks for different treatments in topsoil and bottom soil, and (c) relative change in SOC stocks of LD and SD compared with CK. The box displays 25%, 50%, and 75% values; the line shows the maximum and minimum ranges of normal values; a point outside the line indicates an outlier; and the green line indicates the average value. Whiskers represent the standard deviation. Different lowercase letters indicate significant differences (p < 0.05) between treatments within the same soil layer.
Agronomy 15 00756 g003
Figure 4. Relationship between SOC stocks at 0–100 cm depth and (a) longitude, (b) latitude, (c) elevation, (d) aspect, and (e) slope.
Agronomy 15 00756 g004
Figure 5. Relative importance of impact factors for SOC stocks at 0–100 cm depth. Note: * indicates significance at p < 0.05; ** indicates significance at p < 0.01.
Agronomy 15 00756 g005
Figure 6. Relationships between SOC density and soil physicochemical properties under (a) LD, (b) SD, and (c) CK. Note: SOS density was processed during the correlation analysis to eliminate the effect of different sampling intervals.
Agronomy 15 00756 g006
Figure 7. The structural equation model (SEM) and standardized effect sizes of the influence of soil physicochemical properties on SOC under LD, SD, and CK. (a) LD (χ2 = 12.275; df = 10; p = 0.267; RMSEA = 0.070; GFI = 0.938; NFI = 0.933; TLI = 0.970; CFI = 0.986). (c) SD (χ2 = 12.903; df = 10; p = 0.229; RMSEA = 0.079; GFI = 0.929; NFI = 0.934; TLI = 0.965; CFI = 0.983). (e) CK (χ2 = 16.776; df = 13; p = 0.210; RMSEA = 0.079; GFI = 0.916; NFI = 0.921; TLI = 0.968; CFI = 0.980). The graphs in (b,d,f) represent the standardized effect sizes of the impact factors on LD, SD, and CK, respectively. In (a,c,e), solid and dotted lines indicate the direct and indirect effects of soil physical and chemical properties on SOC content, respectively. Blue and red arrows represent negative and positive relationships between variables, numbers adjacent to arrows are standardized path coefficients, and the size of the number indicates the strength of the relationship. * Denotes significance at p < 0.05 level, ** denotes significance at p < 0.01 level, and *** denotes significance at p < 0.001.
Agronomy 15 00756 g007
Table 1. Sampling point description (0–10 cm).
Site
/Village
Latitude
(°N)
Longitude
(°E)
Elevation
(m)
Aspect
(°)
Slope
(°)
SOC
(g kg−1)
BD
(g cm−3)
SWC
(%)
pH
ZGZ40.10113.571108.85170.883.259.801.399.269.27
XYJ40.09113.541076.44237.843.598.491.415.918.96
DS40.08113.461047.08274.112.629.131.259.438.61
GJYT40.03113.511020.86266.756.068.291.415.619.53
SYJ40.11113.551116.84253.734.057.961.363.688.63
SZZ40.08113.701155.64126.384.058.491.255.069.13
XJB39.92113.691078.61206.442.457.651.354.459.20
SJZ39.99113.481000.97269.531.406.791.395.928.73
Note: ZGZ is the abbreviation for Zhong Gao Zhuang Village, XYJ for Xia Yu Jian Village, DS for Du Shu Village, GJYT for Guo Jia Yao Tou Village, SYJ for Shang Yu Jian Village, SZZ for Shan Zi Zao Village, XJB for Xu Jia Bao Village, and SJZ for Su Jia Zhai Village. Aspect refers to the orientation of a slope, measured in degrees (°). It is defined with north as 0° or 360° and increases in a clockwise direction. For example, 90° indicates an east-facing slope, 180° indicates a south-facing slope, and 270° indicates a west-facing slope.
Table 2. SOC stocks at 0–100 cm depth at each sampling point (kg m−2).
TreatmentsSite/VillageMean
ZGZXYJDSGJYTSYJSZZXJBSJZ
LD5.375.286.785.435.504.986.405.505.66 A
SD4.875.225.844.894.684.415.425.355.09 AB
CK4.085.245.284.794.114.025.334.924.72 B
Mean4.77 bc5.25 abc5.97 a5.04 abc4.77 bc4.47 c5.72 ab5.26 abc5.15
Note: Different capital letters indicate that there are significant differences between different treatments at the p < 0.05 level; different lowercase letters indicate significant differences at p < 0.05 at different sampling points. ZGZ is the abbreviation for Zhong Gao Zhuang Village, XYJ for Xia Yu Jian Village, DS for Du Shu Village, GJYT for Guo Jia Yao Tou Village, SYJ for Shang Yu Jian Village, SZZ for Shan Zi Zao Village, XJB for Xu Jia Bao Village, and SJZ for Su Jia Zhai Village.
Table 3. Description of physical and chemical properties of soil (0–100 cm) (Mean ± S.D.).
Soil PropertiesLDSDCK
SOC (g kg−1)4.92 ± 0.50 A4.32 ± 0.28 B4.03 ± 0.29 B
TN (g kg−1)0.48 ± 0.06 A0.43 ± 0.05 B0.40 ± 0.03 B
AP (mg kg−1)7.20 ± 1.716.73 ± 2.207.94 ± 2.48
AK (mg kg−1)67.52 ± 13.6363.29 ± 19.0869.54 ± 17.55
pH9.16 ± 0.329.07 ± 0.339.06 ± 0.34
BD (g cm−3)1.39 ± 0.081.43 ± 0.051.44 ± 0.06
SWC (%)8.79 ± 3.229.69 ± 2.359.25 ± 2.99
Clay (%)3.84 ± 2.063.38 ± 1.083.62 ± 1.15
Silt (%)38.91 ± 12.4139.20 ± 5.3839.28 ± 6.15
Sand (%)57.25 ± 14.0657.40 ± 6.3757.07 ± 7.07
Note: Different uppercase letters in the same line indicate significant differences between treatments. The same letters on the same line, or no marks, indicate that the differences between different treatments were not significant.
Disclaimer/Publisher’s Note: The statements, opinions and data contained in all publications are solely those of the individual author(s) and contributor(s) and not of MDPI and/or the editor(s). MDPI and/or the editor(s) disclaim responsibility for any injury to people or property resulting from any ideas, methods, instructions or products referred to in the content.