Article

YOLOv11-HRS: An Improved Model for Strawberry Ripeness Detection

School of Information Engineering, North China University of Water Resources and Electric Power, Zhengzhou 450046, China
*
Author to whom correspondence should be addressed.
Agronomy 2025, 15(5), 1026; https://doi.org/10.3390/agronomy15051026
Submission received: 12 March 2025 / Revised: 21 April 2025 / Accepted: 22 April 2025 / Published: 25 April 2025
(This article belongs to the Section Precision and Digital Agriculture)

Abstract

:
Automated ripeness detection in large-scale strawberry cultivation is often challenged by complex backgrounds, significant target scale variation, and small object size. To address these problems, an efficient strawberry ripeness detection model, YOLOv11-HRS, is proposed. This model incorporates a hybrid channel–space attention mechanism to enhance its attention to key features and to reduce interference from complex backgrounds. Furthermore, the RepNCSPELAN4_L module is devised to enhance multi-scale target representation through contextual feature aggregation. Simultaneously, a 160 × 160 small-target detection head is embedded in the feature pyramid to enhance the detection capability of small targets. It replaces the original SPPF module with the higher-performance SPPELAN module to further enhance detection accuracy. Experimental results on the self-constructed strawberry dataset SRD show that YOLOv11-HRS improves mAP@0.5 and mAP@0.5:0.95 by 3.4% and 6.3%, respectively, reduces the number of parameters by 19%, and maintains a stable inference speed compared to the baseline YOLOv11 model. This study presents an efficient and practical solution for strawberry ripeness detection in natural environments. It also provides essential technical support for advancing intelligent management in large-scale strawberry cultivation.

1. Introduction

With the rapid development of computer technology, the application of computer vision to promote agricultural automation and intelligence has become a major trend in the production and cultivation of agricultural products [1]. The YOLO model [2], an advanced computer vision algorithm, is widely used in various agricultural applications, such as ripeness detection [3,4,5,6,7], pest and disease detection [8,9,10,11], remote intelligent monitoring [12,13,14], and fruit defect detection [15,16], due to its strong generalization ability and robustness. In addition to fruit detection, deep learning-based computer vision approaches have been increasingly applied to broader agricultural automation tasks [17]. For instance, Jiang et al. proposed an apple detection algorithm that integrated the YOLOv4 network model with a visual attention mechanism, achieving excellent performance in handling low-quality images, such as those with shadows, blurs, and severe occlusions [18]. Wang et al. designed a lightweight, real-time cherry tomato maturity detection algorithm based on an improved YOLOv5n model, significantly enhancing the detection accuracy while maintaining the lightweight and real-time capabilities of the model [19]. Fan et al. introduced a strawberry ripeness recognition algorithm combining dark channel enhancement with YOLOv5, which outperformed the traditional SSD and EfficientDet single-stage detection methods in terms of recognition accuracy, efficiency, and robustness, providing technical support for automated strawberry picking [20]. Yang et al. developed a novel strawberry detection model (LS-YOLOv8s) that integrates YOLOv8 with LW-Swin transformer modules. This model captures the remote dependencies of input data through a multi-head attention mechanism and enhances the residual network, effectively improving the accuracy of strawberry ripeness detection and classification [21]. Wang et al. proposed an improved YOLOv8 model for strawberry ripeness recognition, which achieved high detection accuracy. The mAP50 curve steadily rises and converges to higher values, enabling accurate detection of strawberry ripeness in complex environments [22]. Feng et al. investigated blueberry detection by incorporating the SCConv module into the YOLOv9 network. This integration compressed the network parameters and introduced a channel attention mechanism in the feature fusion network, enhancing the feature representation ability of the network and improving the detection accuracy by 0.7% compared to the original model [23]. Moysiadis et al. employed YOLOv5 and Detectron2 for mushroom growth stage classification and growth monitoring, respectively, highlighting key challenges in the practical implementation of agricultural automation [24].
While previous studies have made significant advancements in fruit ripeness detection using YOLO-based models, accurately detecting small and multi-scale strawberry targets under complex field conditions remains a prevalent and unresolved challenge in current research. In the task of strawberry ripeness detection, strawberries often exhibit multi-scale characteristics due to uneven growth stages, lighting variations, and inconsistent nutrient distribution, which can lead the inspection system to overlook key features, especially when dealing with small targets. Additionally, complex natural environments, such as irregular plant backgrounds, diverse soil conditions, and randomly distributed agricultural facilities, further complicate the detection task. Specifically, the multi-scale distribution of strawberries and the high proportion of small targets significantly increase the detection challenge, placing greater demands on the accuracy and robustness of the system. To address these challenges, a strawberry ripeness detection model, YOLOv11-HRS, based on an enhanced version of YOLOv11, is put forward in this study. The significant contributions of this paper are listed as follows:
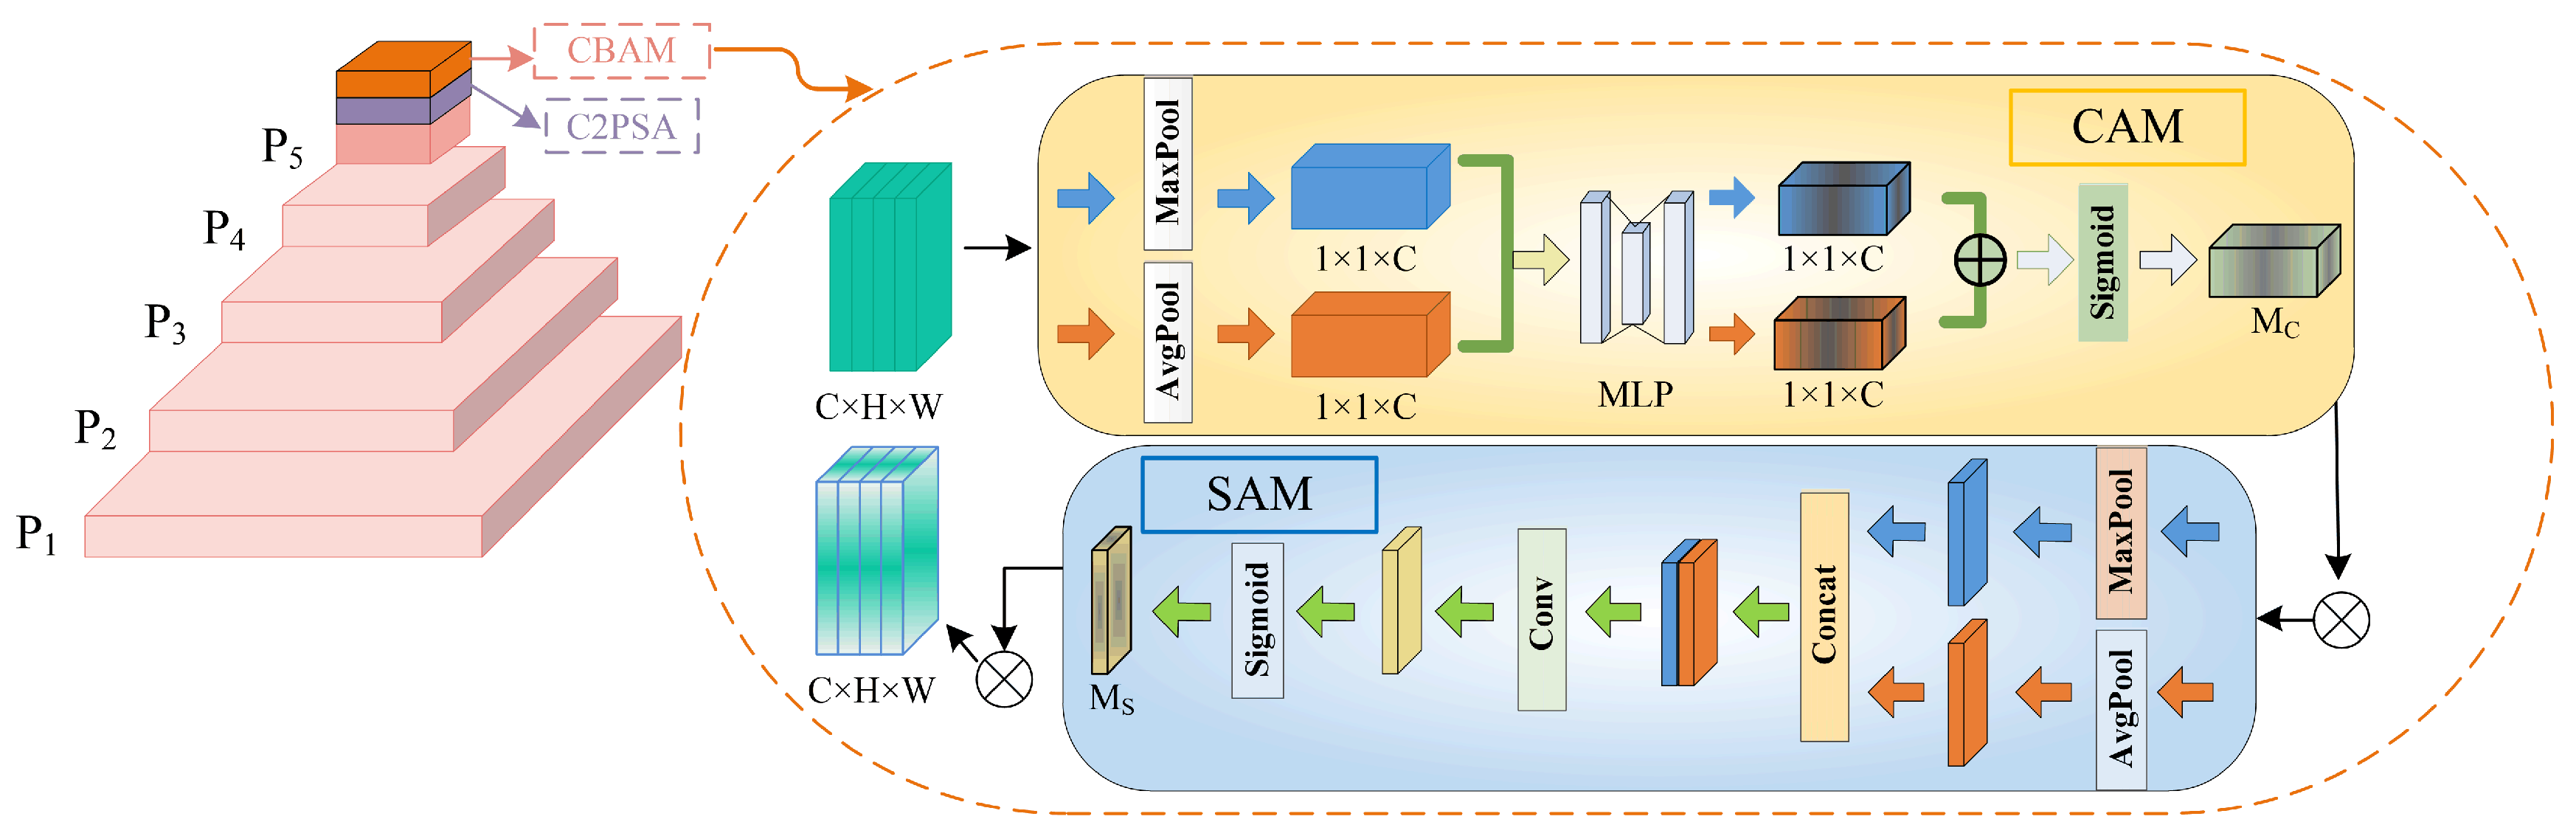
  • The hybrid attention mechanism is introduced into the backbone network, which effectively mitigates interference in strawberry detection within complex backgrounds by assigning higher weights to key features, allowing the model to focus more on important target regions while minimizing the processing of irrelevant information.
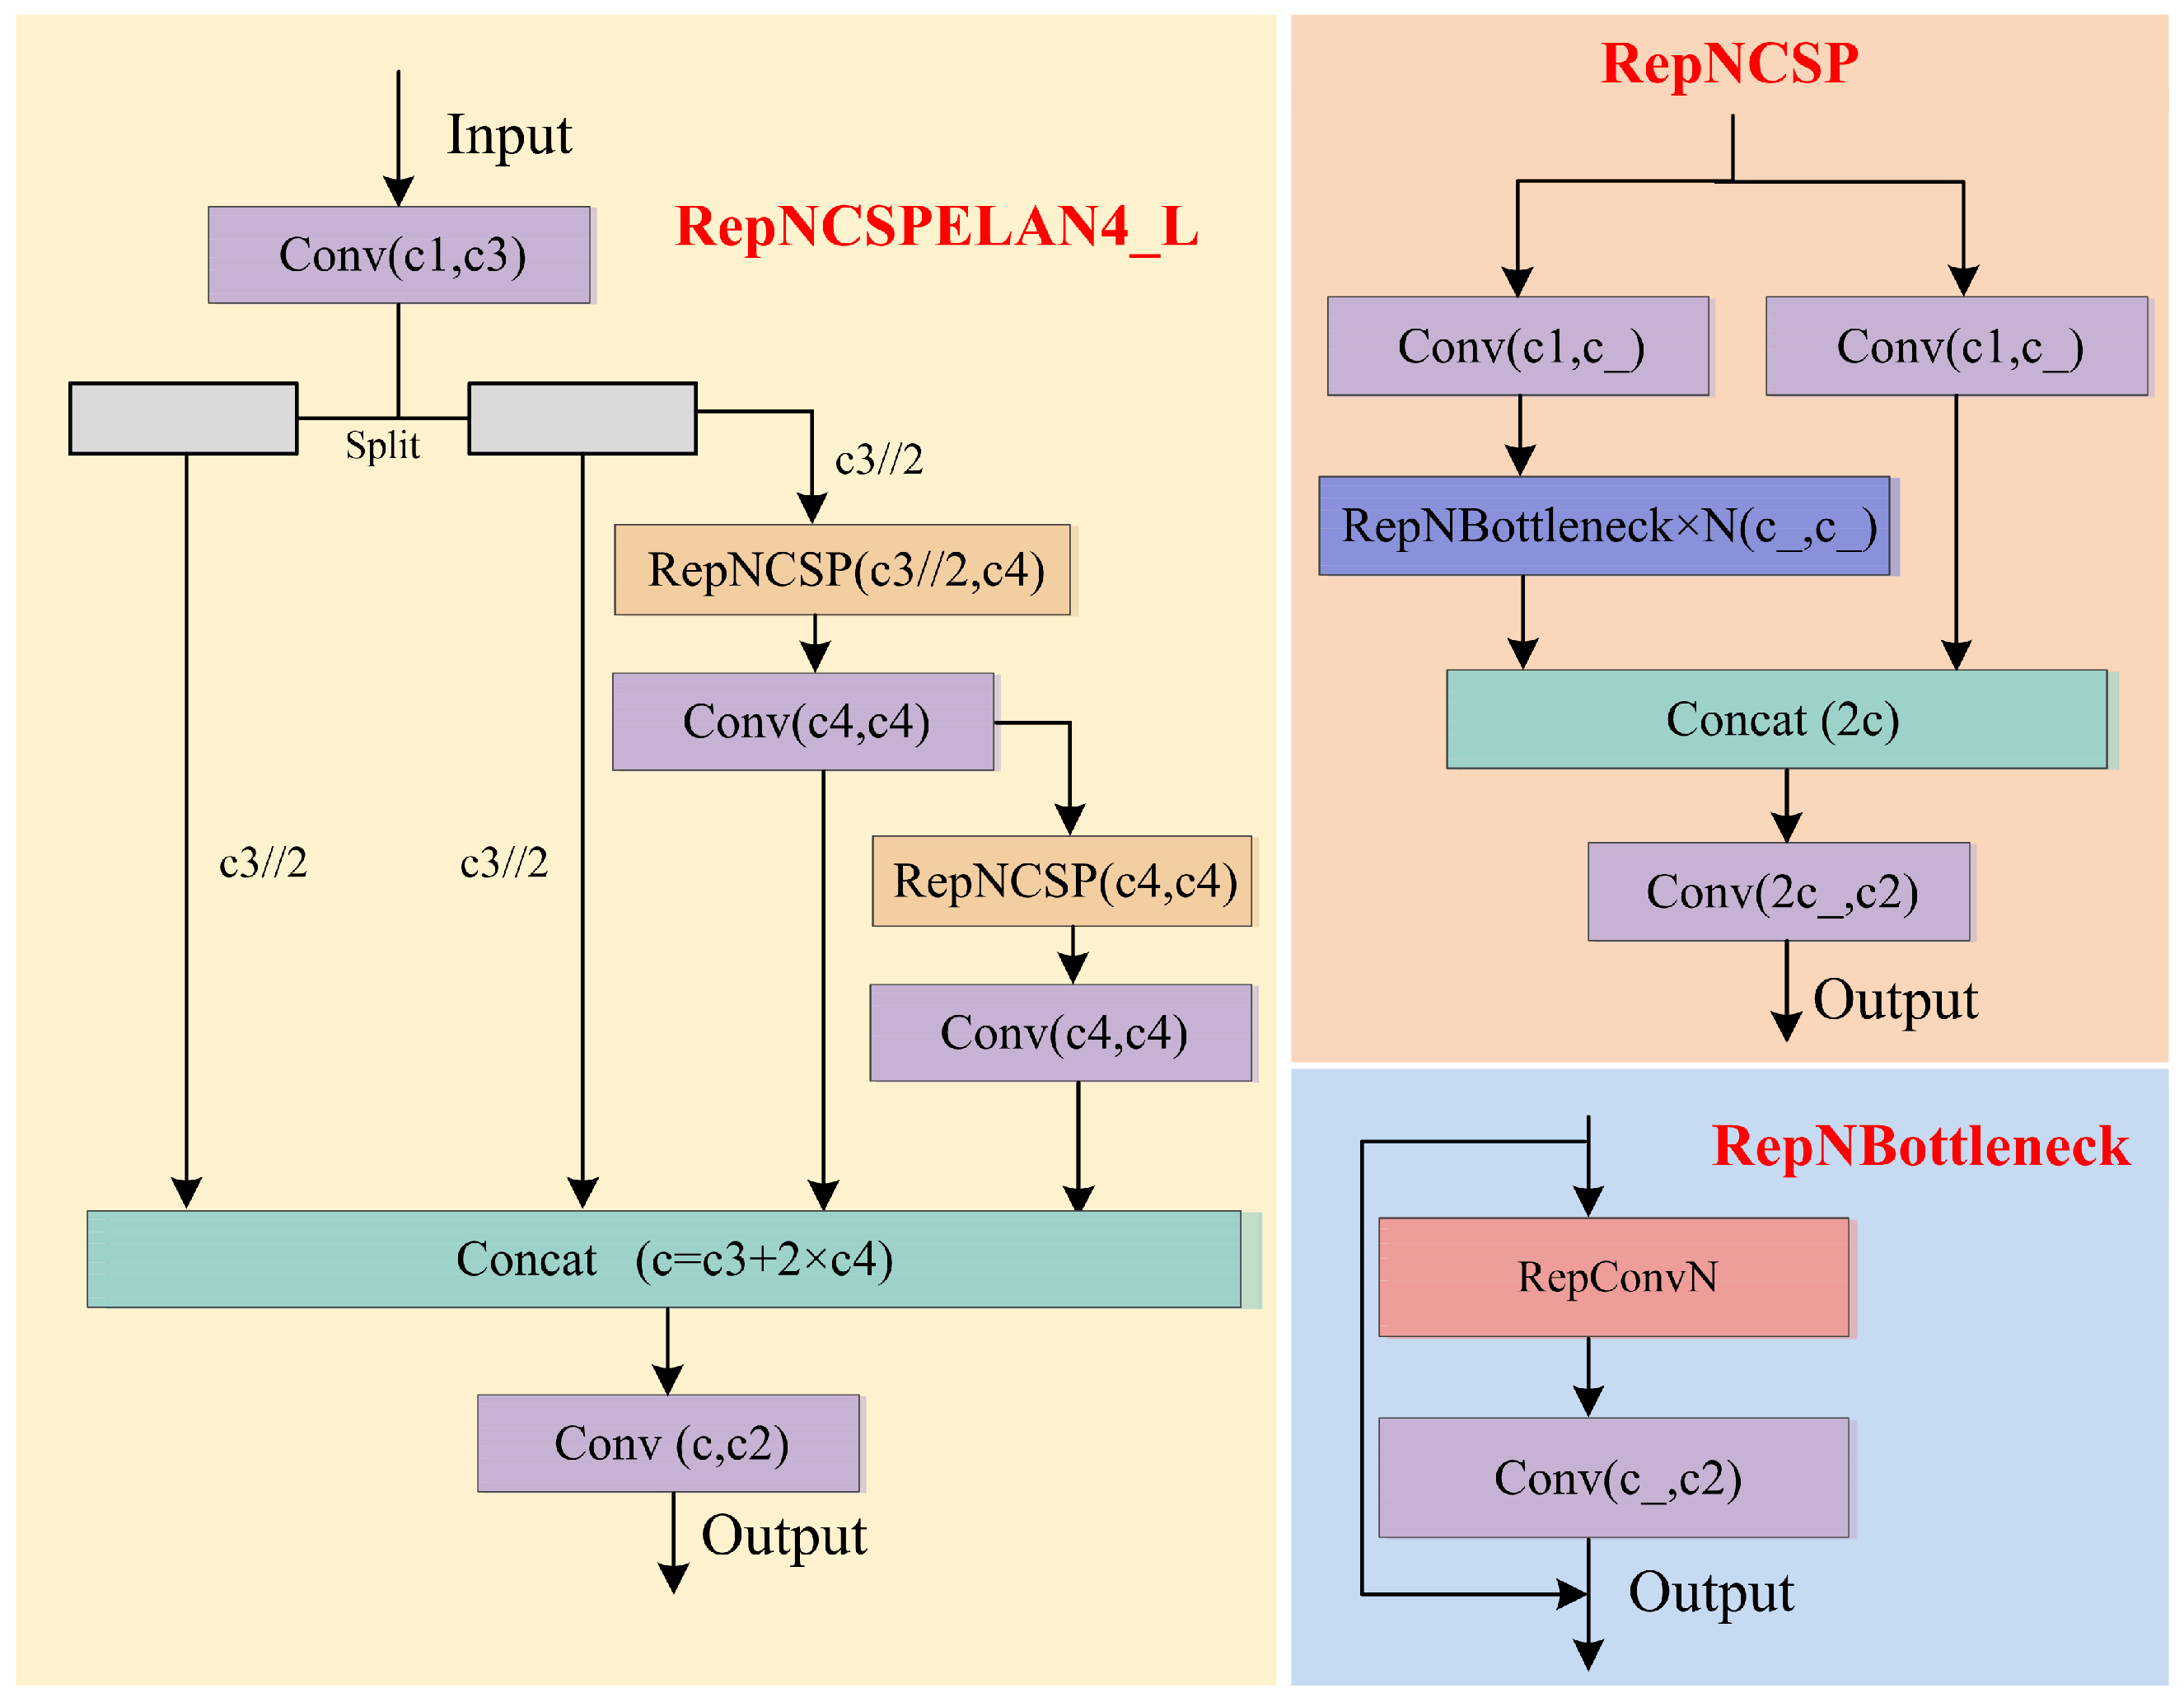
  • To better extract feature information from multi-scale targets, the concepts of module splitting and reorganization are employed, combined with the hierarchical processing method of the Generalized Efficient Layer Aggregation Network (GELAN) [25], resulting in the development of the multi-branch, layer-hopping-connected feature extraction module, RepNCSPELAN4_L. This module simplifies the network structure, enhances feature fusion through optimized feature aggregation and layer-hopping connections, and significantly improves the recognition of multi-scale targets.
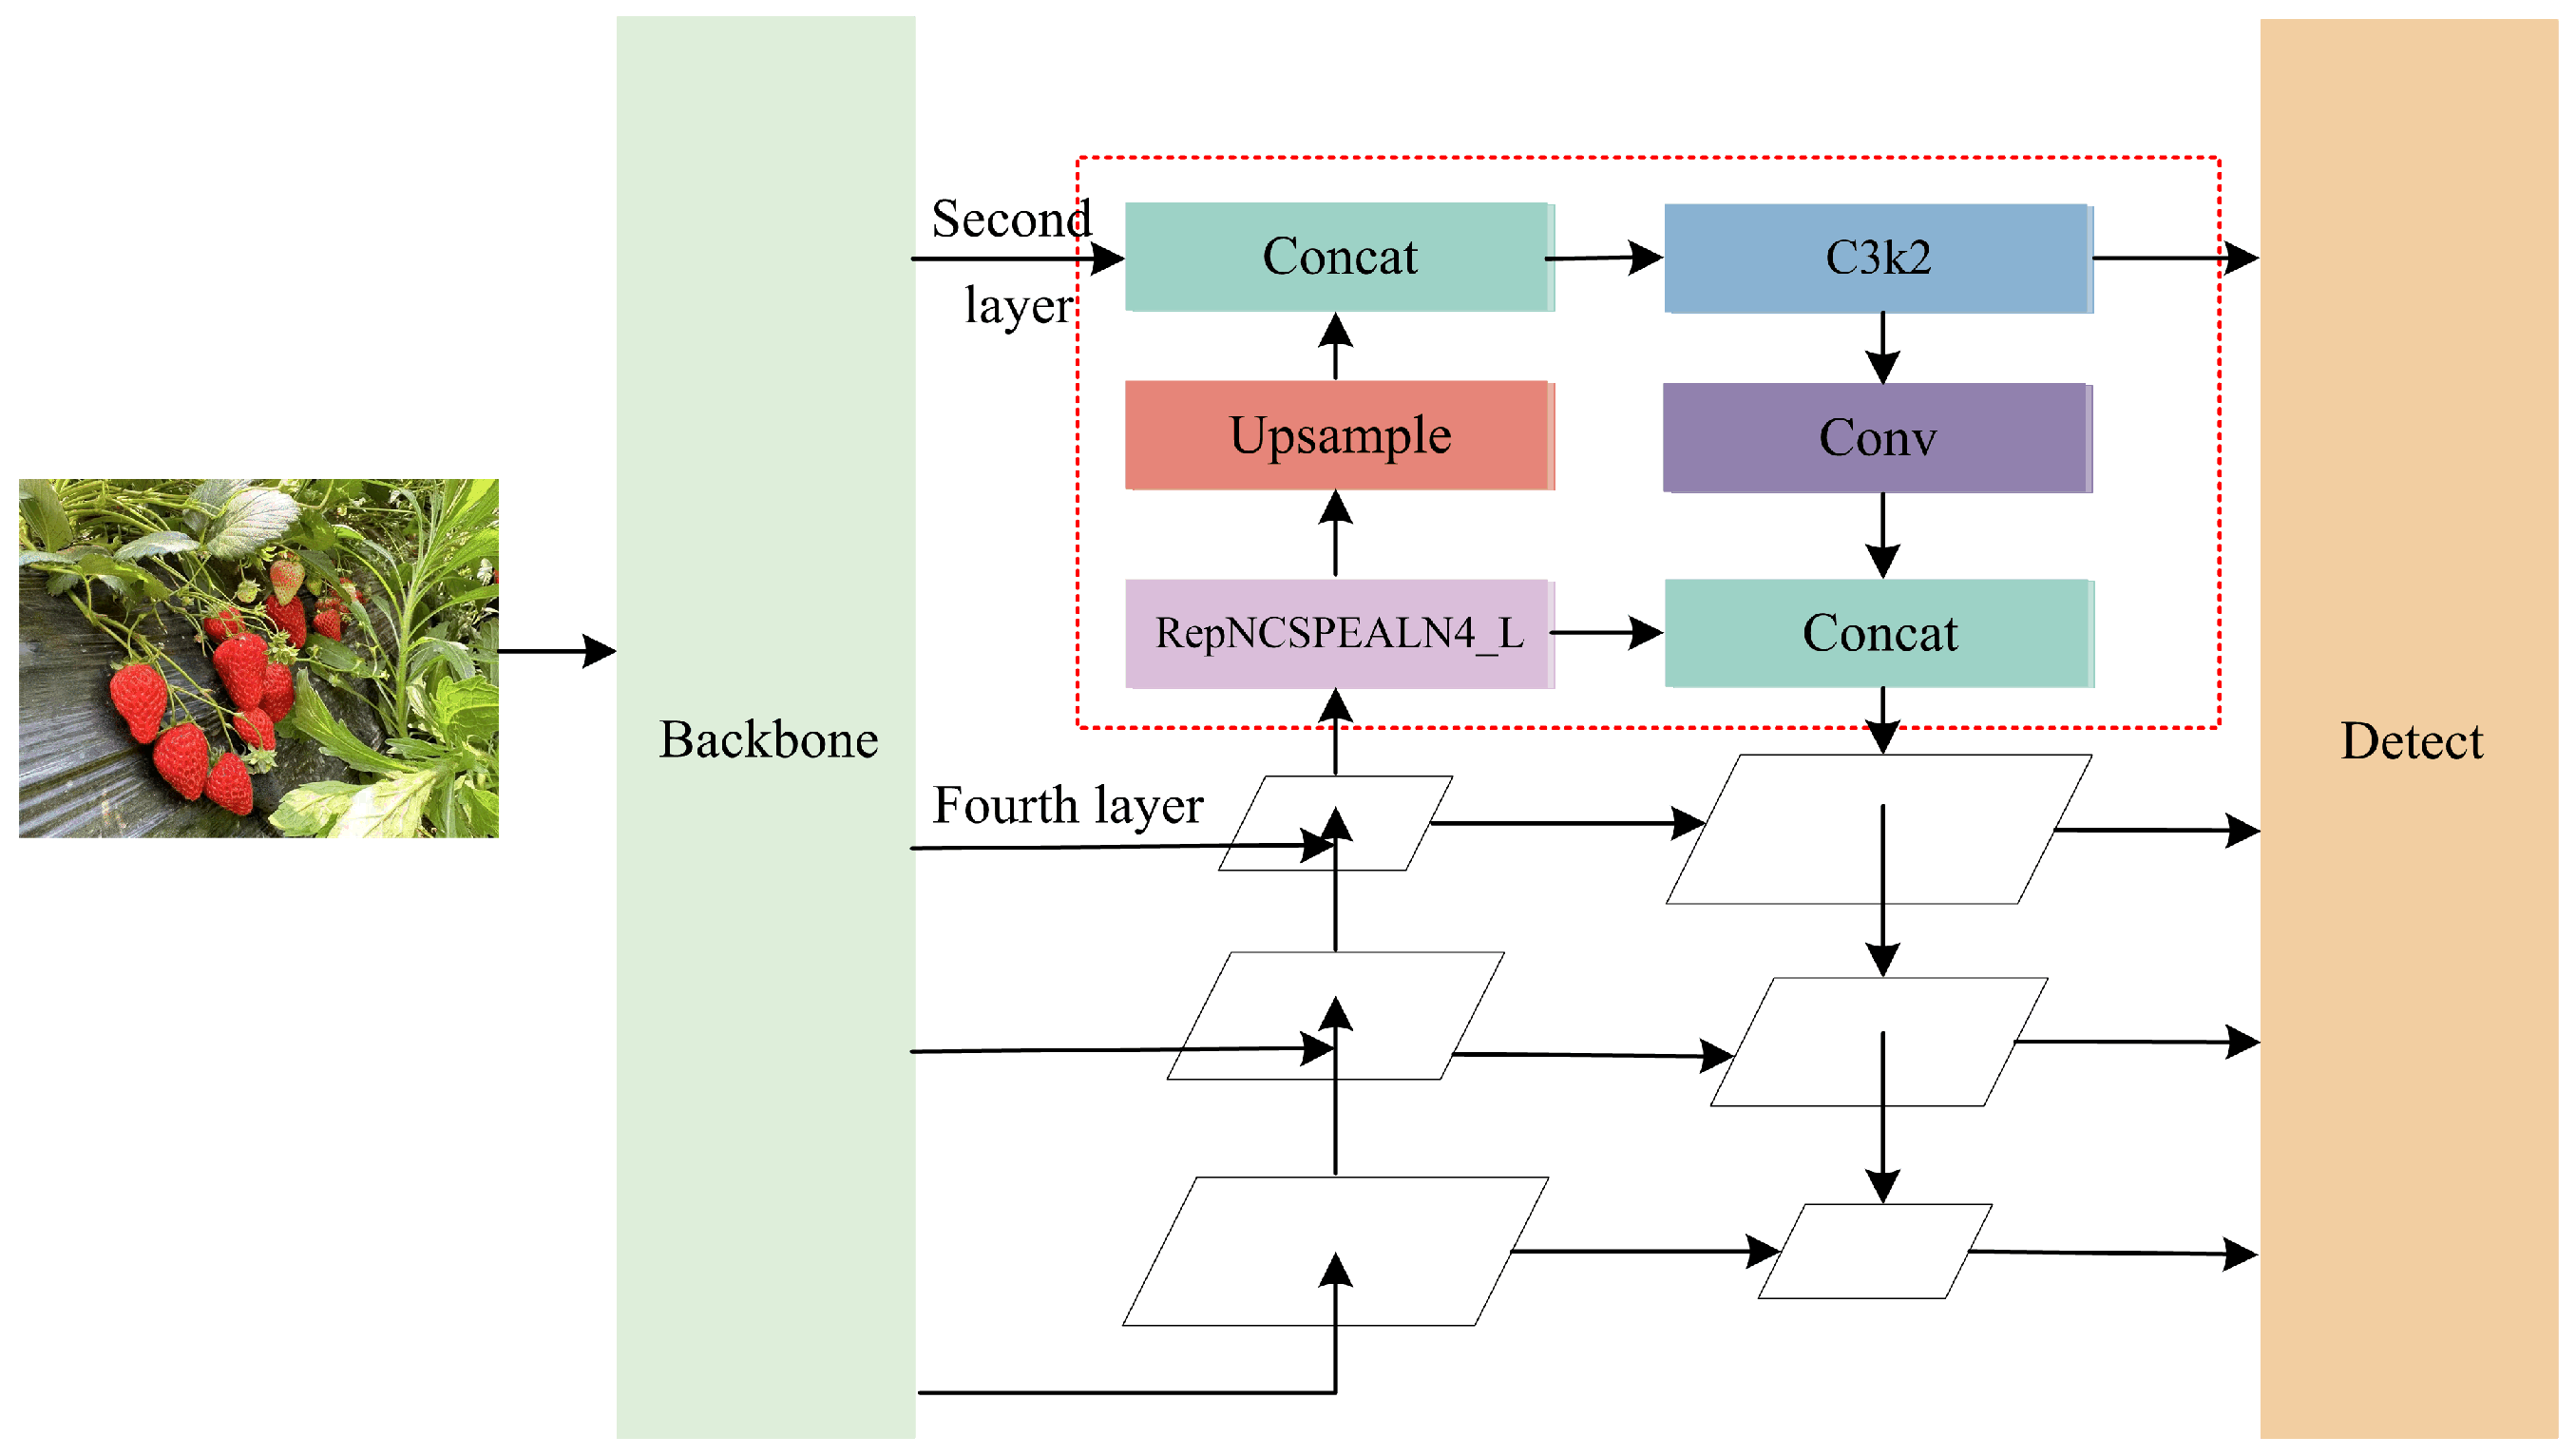
  • A 160 × 160-pixel detection layer, specifically designed for small targets, is introduced to enhance the integration of deep and shallow semantic information. This design leads to a significant enhancement in the feature representation of small objects.
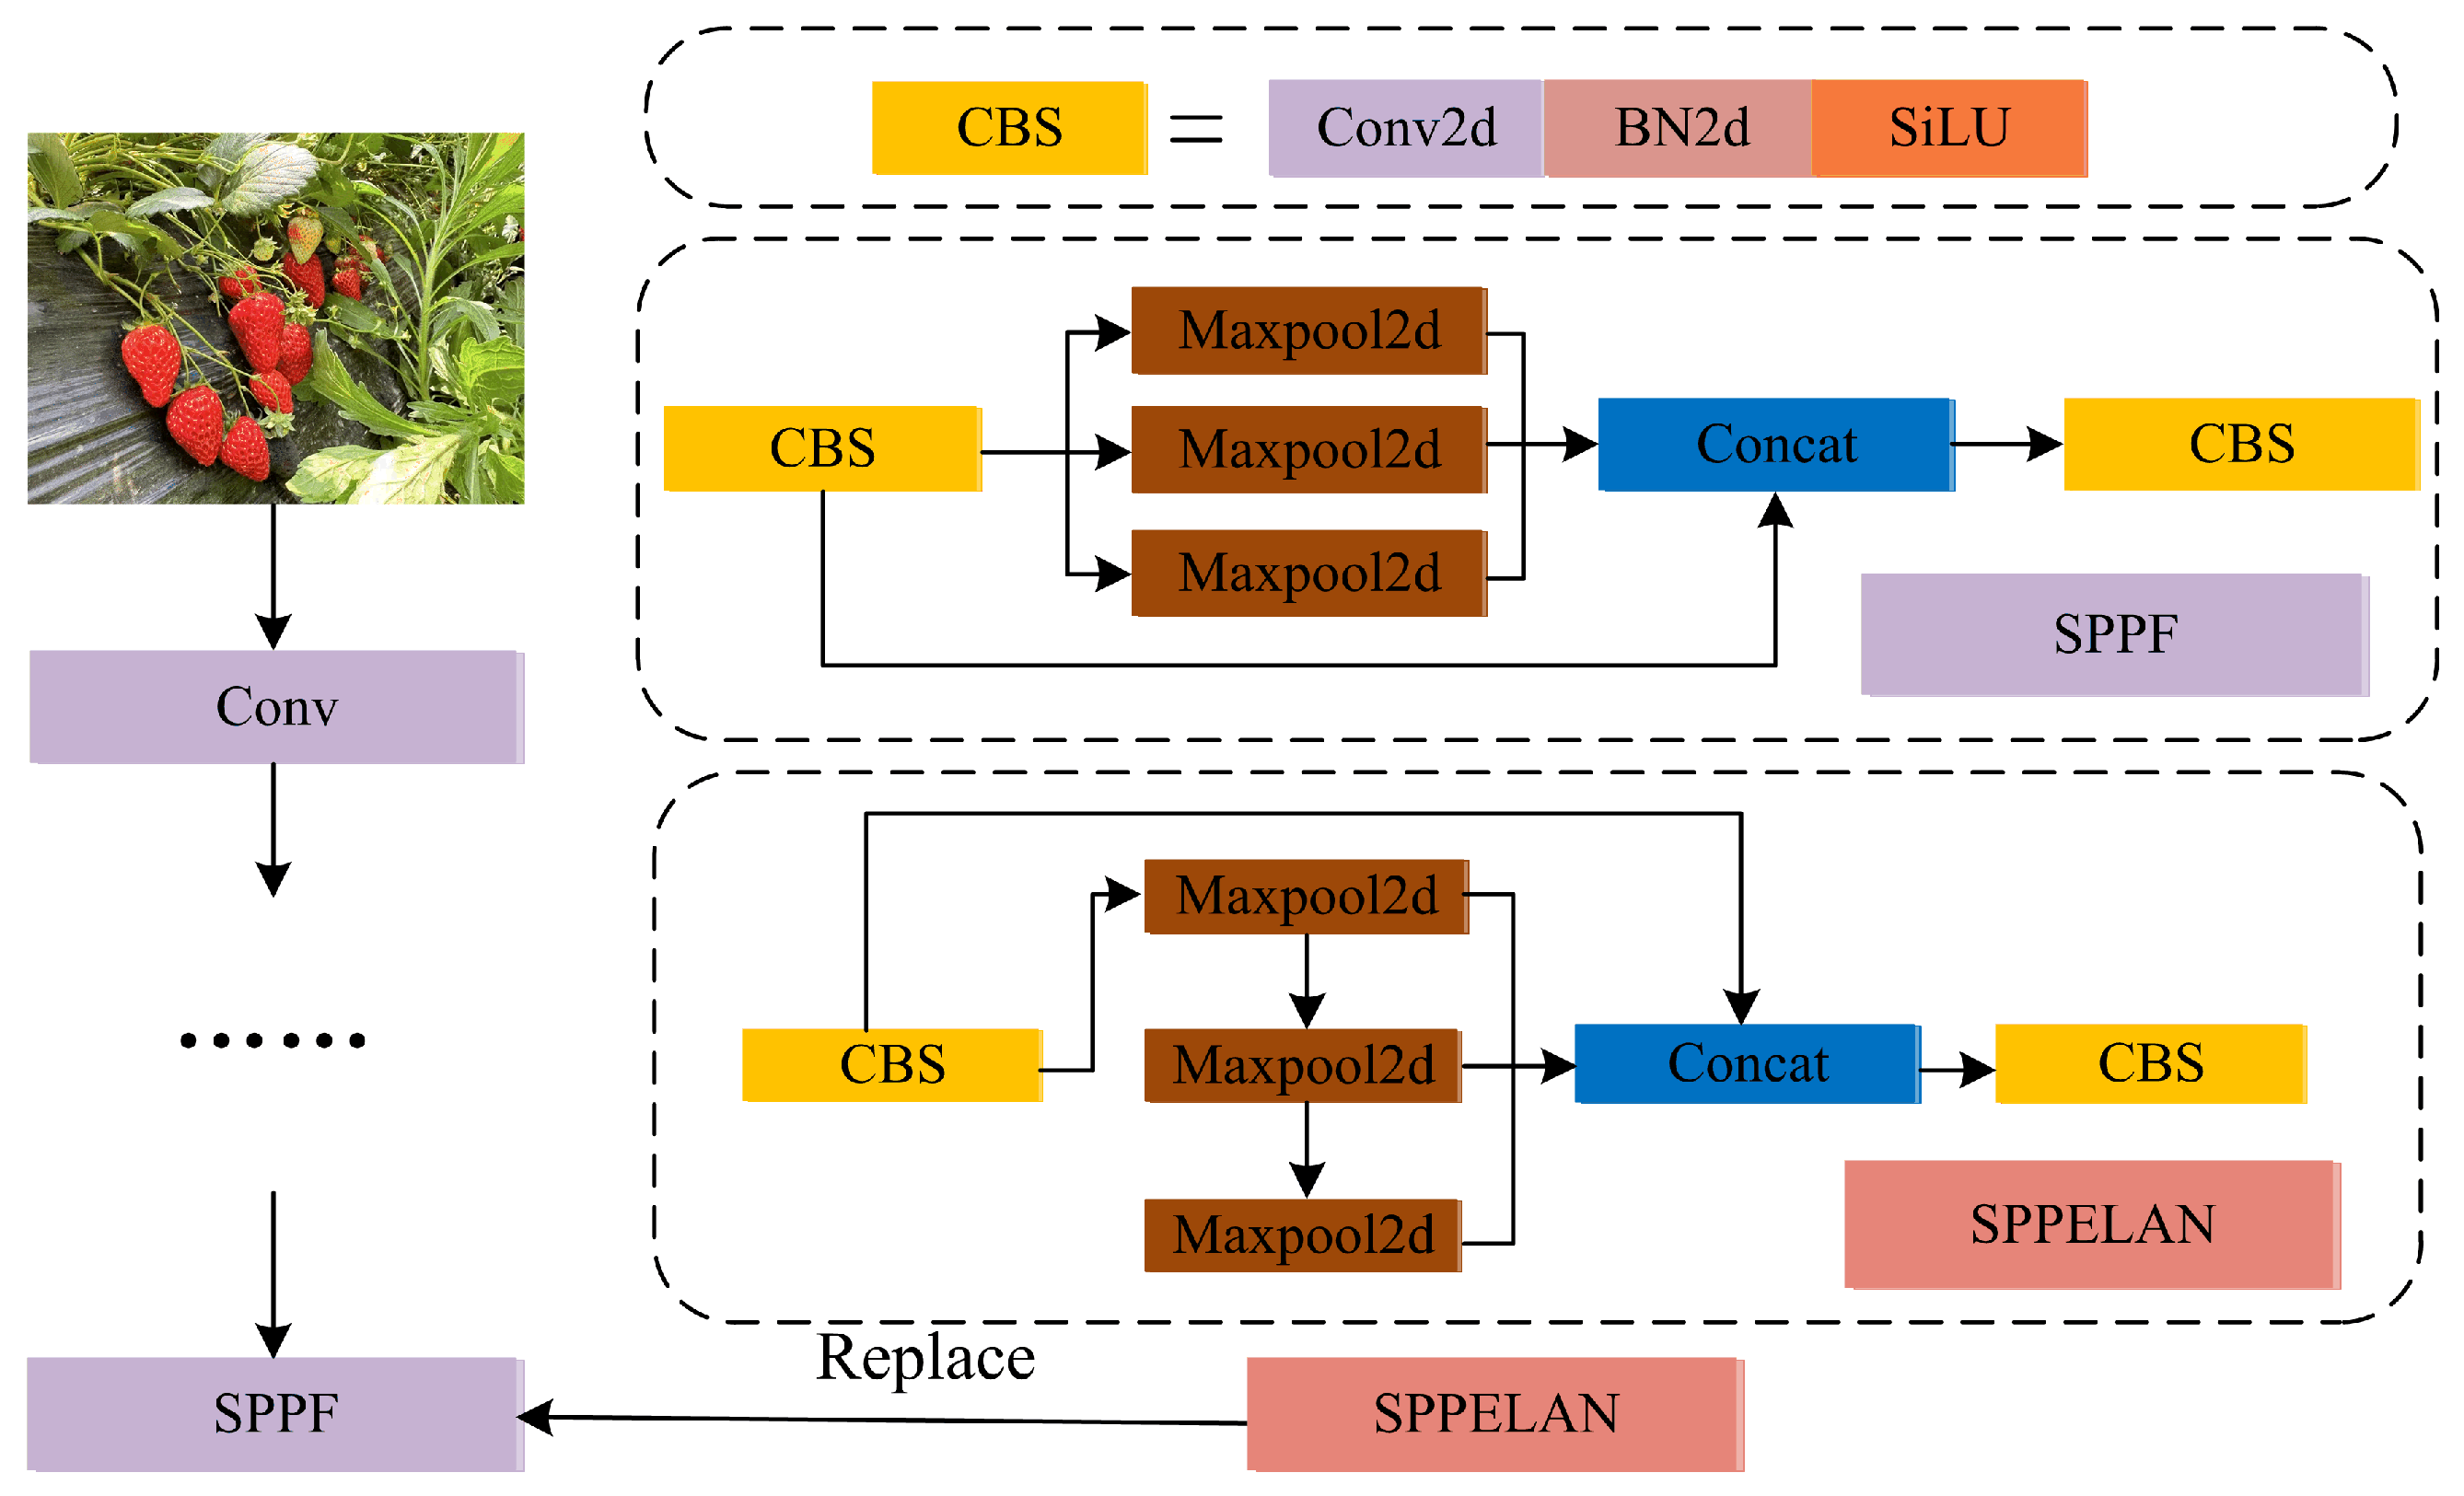
  • A novel SPPELAN module is introduced to replace the traditional SPPF. It fully utilizes the spatial pyramid pooling capability of SPP and the efficient feature aggregation capability of ELAN, enhancing the detection performance without increasing the number of parameters and computational complexity.
The remainder of this paper is organized as follows. Section 2 describes the proposed YOLOv11-HRS model, including the hybrid attention mechanism, RepNCSPELAN4_L, small-target detection head, and SPPELAN. Section 3 presents the experimental setup, evaluation metrics, datasets, and results, followed by a detailed performance analysis. Finally, Section 4 provides the conclusion.

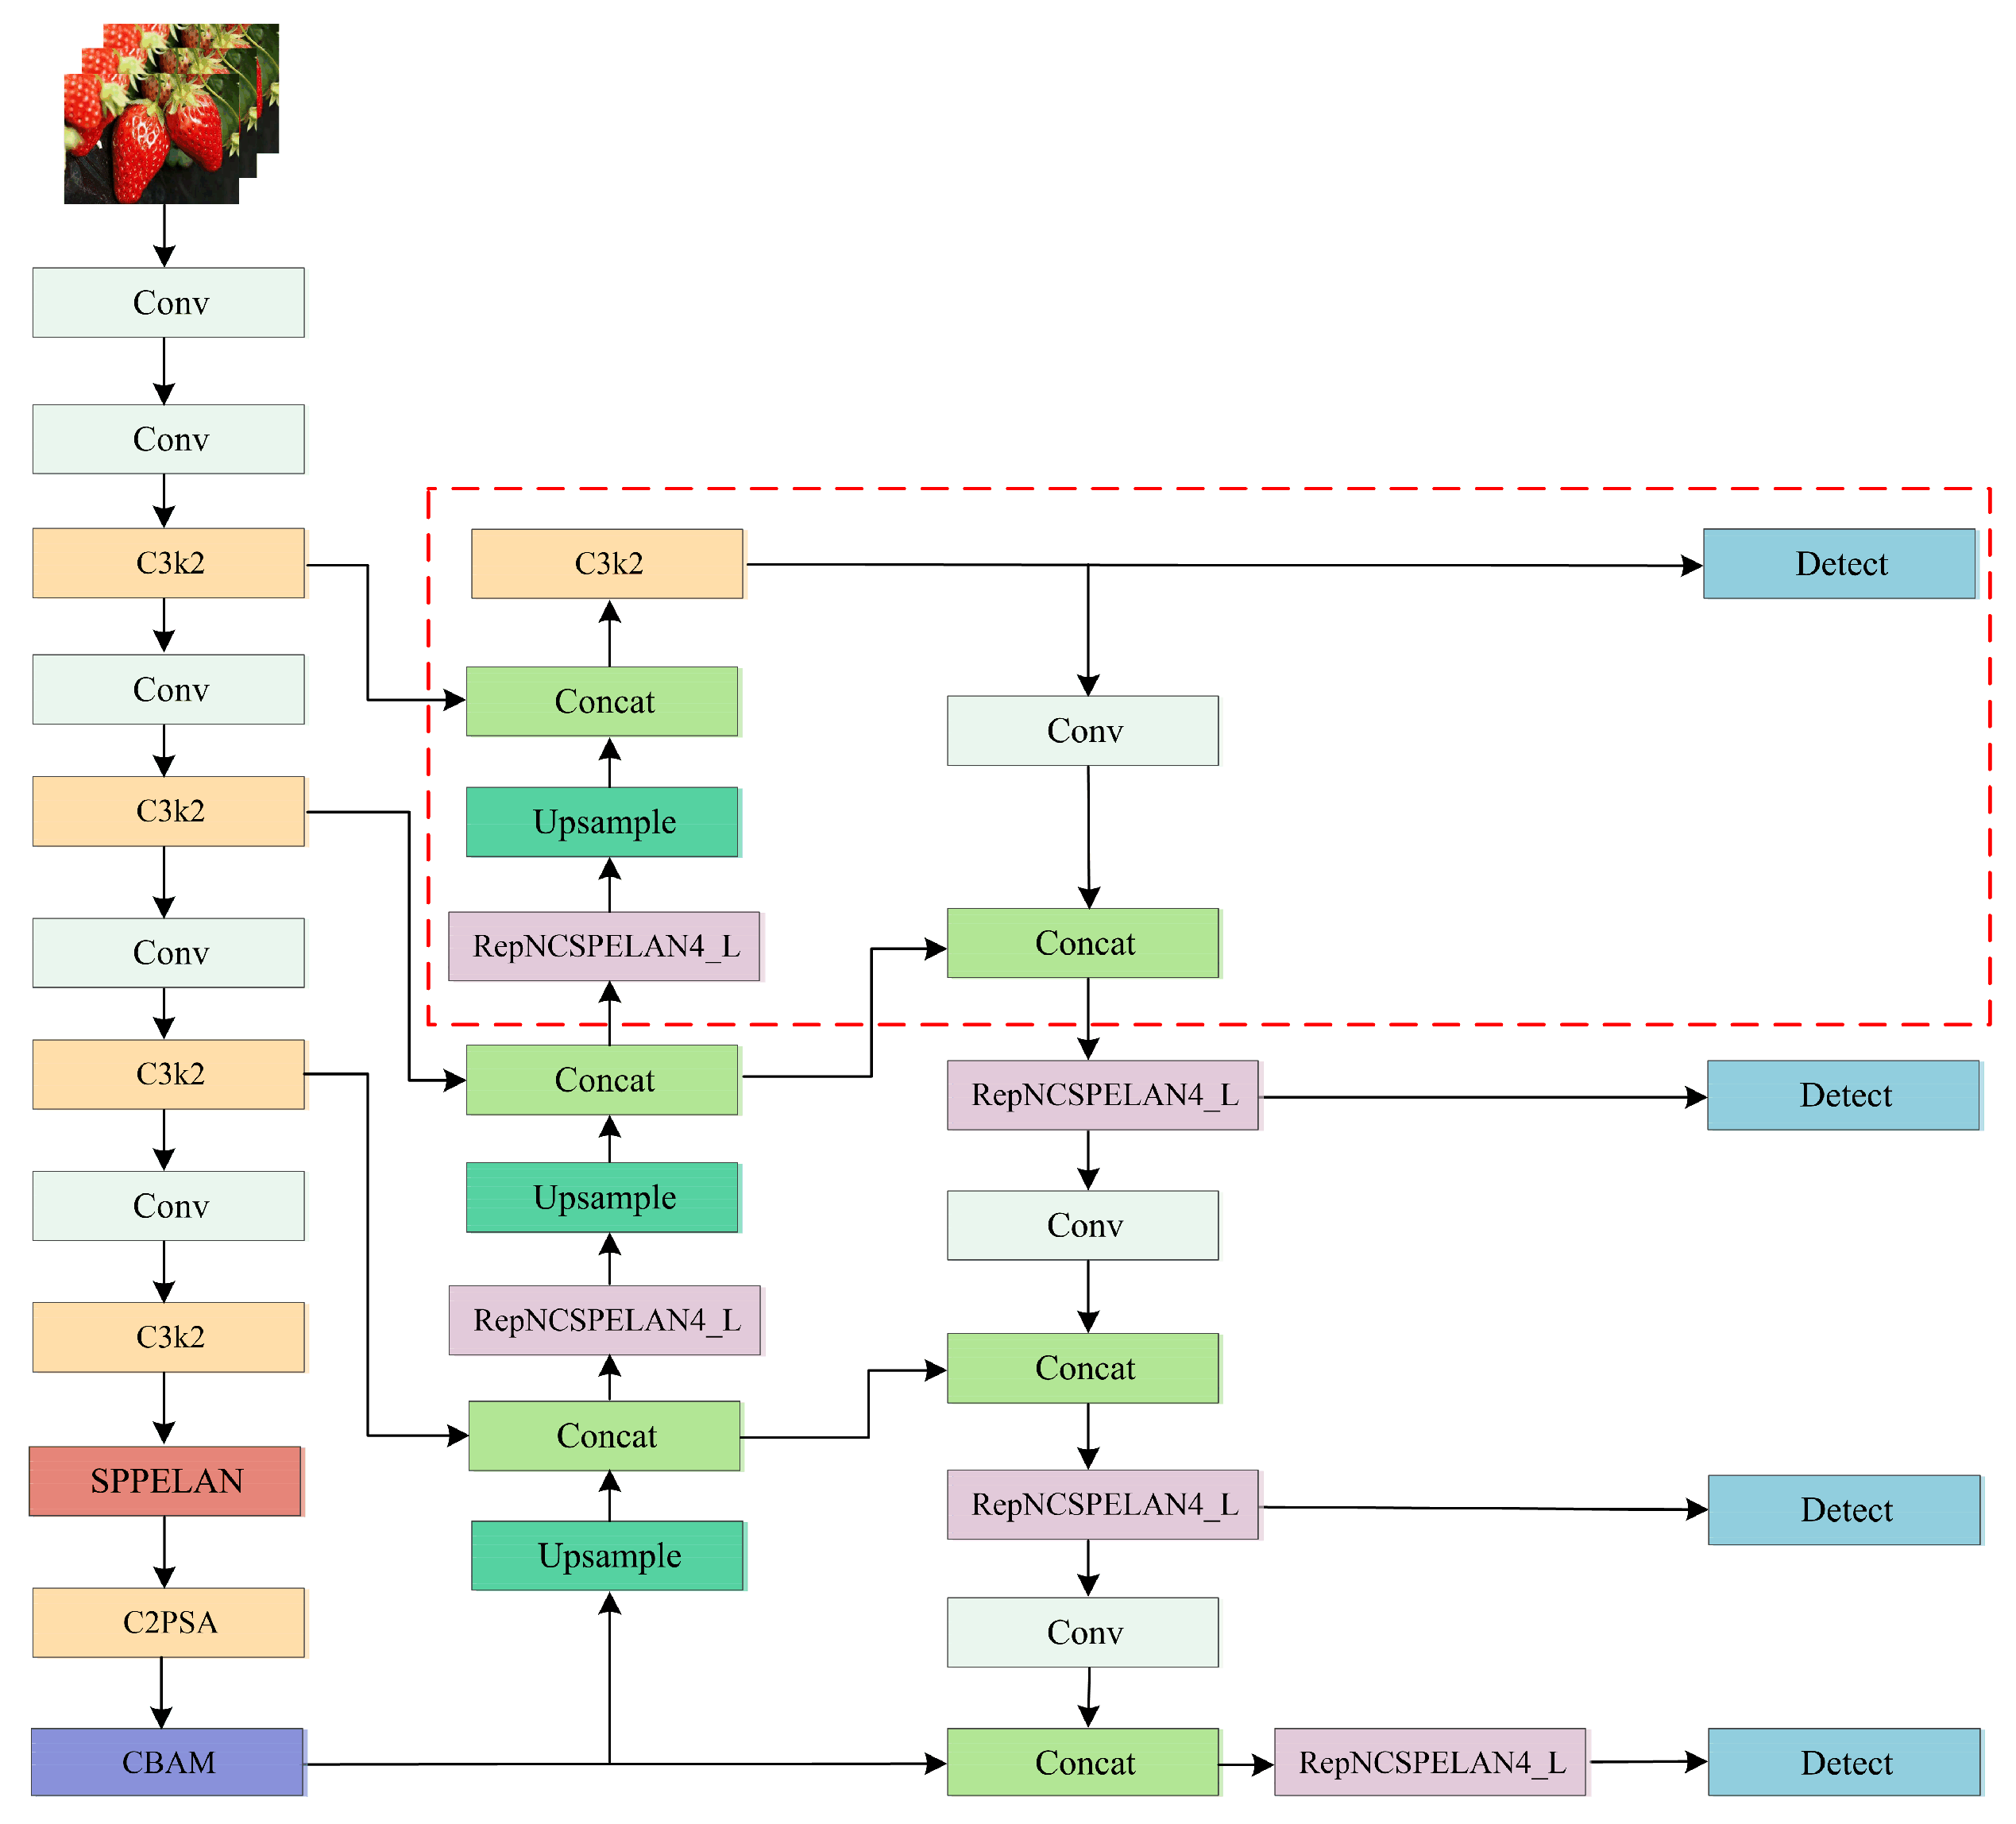
2. Improved YOLOv11-HRS Model

To address challenges such as complex environments, dense distribution of multi-scale targets, difficulty in detecting small targets, and low detection rates in strawberry ripeness detection, this study proposes the YOLOv11-HRS module, as illustrated in Figure 1. This module integrates an attention mechanism with a small-target detection unit and incorporates four key improvements: First, a hybrid attention mechanism is embedded in the backbone network to suppress interference from complex backgrounds. Second, the RepNCSPELAN4_L module is designed based on the feature extraction module of YOLOv9, enabling more efficient capture of detailed and high-level semantic information through multi-scale feature extraction and fusion, thereby improving the target detection accuracy. Additionally, a small 160 × 160 target detection layer is introduced at the neck (as shown in the red dashed box in Figure 1). Finally, the SPPELAN module, which combines Spatial Pyramid Pooling (SPP) and Efficient Layer Aggregation Network (ELAN), replaces the traditional SPPF. Through multi-level and multi-scale feature extraction, this module can better capture the detailed features of strawberries without increasing the number of parameters and computational complexity.

2.1. Hybrid Attention Mechanism

The complexity of the strawberry growing environment, particularly the similarity between immature strawberries and leaves, as well as the intricate soil background, often leads to poor performance of baseline models in detecting key areas and important features. This results in low detection accuracy and challenges in meeting the precise requirements for strawberry detection. To address these issues, a hybrid attention mechanism [26] is introduced. This mechanism enhances the ability of the model to focus on key regions within the input feature map, thereby improving the recognition of important features. It has been successfully applied to the task of feature extraction for strawberry detection.
As illustrated in Figure 2, within the network model, the output from the C2PSA convolution is passed as input features to the hybrid attention mechanism. Initially, it was processed using the Channel Attention Module (CAM), where global maximum pooling and global average pooling are utilized to extract information at different scales, resulting in two feature maps. These feature maps are then processed by a multilayer perceptron (MLP) to enhance the response to key features and suppress irrelevant information. Subsequently, the resulting feature maps are element-wise summed, and the channel attention map MC is generated using the Sigmoid activation function. Subsequently, the Spatial Attention Module (SAM) processes the output. In the SAM, the feature map output from the CAM is first taken as input and is subjected to max pooling and average pooling operations to generate two feature maps. These maps are then concatenated and passed through a convolutional layer to reduce the channel dimension to 1. Then, a Sigmoid activation function is applied to generate the spatial attention feature map denoted as MS. Finally, this feature map is multiplied element by element with the input feature map to obtain the final output feature.
M C F = σ MLP AvgPool F + MLP MaxPool F = σ W 1 W 0 F a v g C + W 1 W 0 F max C
M S F = σ f 7 × 7 AvgPool F ; MaxPool F = σ f 7 × 7 F a v g S ; F max S
where MC(F) and MS(F) denote the channel and spatial attention maps, respectively; F is the input feature map; AvgPool and MaxPool represent the AvgPool operation and the MaxPool operation, respectively; MLP is a multilayer perceptron; σ refers to the Sigmoid activation function; W0 and W1 are the weight parameters of Layer 1 and Layer 2 in the MLP, respectively; and f 7×7 is a 7 × 7 convolutional operation.

2.2. RepNCSPELAN4_L Module

To enhance feature extraction in multi-scale target detection tasks, the RepNCSPELAN module from YOLOv9 is redesigned into the RepNCSPELAN4_L module. Compared with the C3k2 module in YOLOv11, this module offers a larger receptive field and stronger feature expression capability, making it more effective in capturing scale-variant targets and improving detection accuracy.
The structure of RepNCSPELAN4_L is shown in Figure 3. This module primarily consists of RepNCSP and convolutional components. It extracts spatial features via convolution and splits the output into multiple parallel branches. RepNCSP divides the features into two parts. One part undergoes further processing via a convolutional path, each processing a distinct portion of the feature map independently. In one branch, RepNCSP divides the features into two parts. One part undergoes further processing via convolution and a RepNBottleneck structure, whereas the other follows a conventional convolutional path. The integration of these two pathways enhances the feature extraction capacity of the network and improves its ability to capture relevant information. The fused features are then passed through convolutional layers to produce the module output. RepNBottleneck serves as the basic unit and adopts a residual connection structure, which enhances feature propagation and stabilizes network training. Its number is dynamically determined by the model width, enabling flexible trade-offs between network complexity and performance.

2.3. Small-Target Detection Head Module

As shown by the red box in Figure 4, a 160 × 160-scale small-target detection head is added to the bottom network of the FPN and integrated with the C3k2 layer located at the base of the backbone network to better extract detailed information from images, thereby strengthening the semantic content and feature portrayal of small targets within strawberry detection.
As shown in Figure 4, the proposed layer includes a complementary fusion feature layer and an additional detection header designed to enhance the semantic information and feature representation of small targets. The implementation involves the following steps: First, the 80 × 80 feature layer from the fourth layer of the backbone network (starting from layer 0) is combined with the up-sampled feature layer from the neck network. After the application of up-sampling and C3k2 (which refines features from coarse to fine-grained), a deep semantic feature layer is created that encapsulates key information about the small targets. This deep semantic feature layer is then merged with a shallow location feature layer from the second layer of the backbone (starting from layer 0) to generate a comprehensive 160 × 160 fused feature layer that more accurately represents the semantic attributes and location data of the small targets. Finally, these features are directed to another separated header for further analysis.
The additional decoupled head is then processed through a convolutional layer and C3k2 to combine the deep semantic feature layer with the positional feature layer at layer 15 in the neck network. This integration achieves the key feature of transferring information about small targets to the original three-scale feature layer of the model, thus enhancing the feature fusion capability of the network and improving the accuracy of small target detection. The addition of this header enhances the ability of the network to detect strawberry targets, enabling it to recognize strawberry features more accurately, thus providing more reliable data support for assessing the growth status of strawberries.

2.4. SPPELAN Module

Although the SPPF module reduces computational complexity and improves inference efficiency through pooling and feature splicing, it may degrade the resolution of feature maps when detecting small targets, leading to the loss of fine-grained local features and reduced detection accuracy. To solve this problem, the SPPF module in the original YOLOv11 is replaced with the proposed SPPELAN module. As shown in Figure 5, SPPELAN comprises a CBS module, followed by three sequential Maxpool2d layers. SPPELAN integrates the spatial pooling capability of SPP with the efficient layer aggregation structure of ELAN. It extracts multi-level features through parallel branches and aggregates them efficiently, thereby enhancing performance while maintaining a low computational cost. The incorporation of SPPELAN enhances the model’s representation of multi-scale targets, improves robustness and generalization, and further reduces the overall computational burden due to the lightweight structure of ELAN, thereby maintaining a high inference efficiency.

3. Experiment

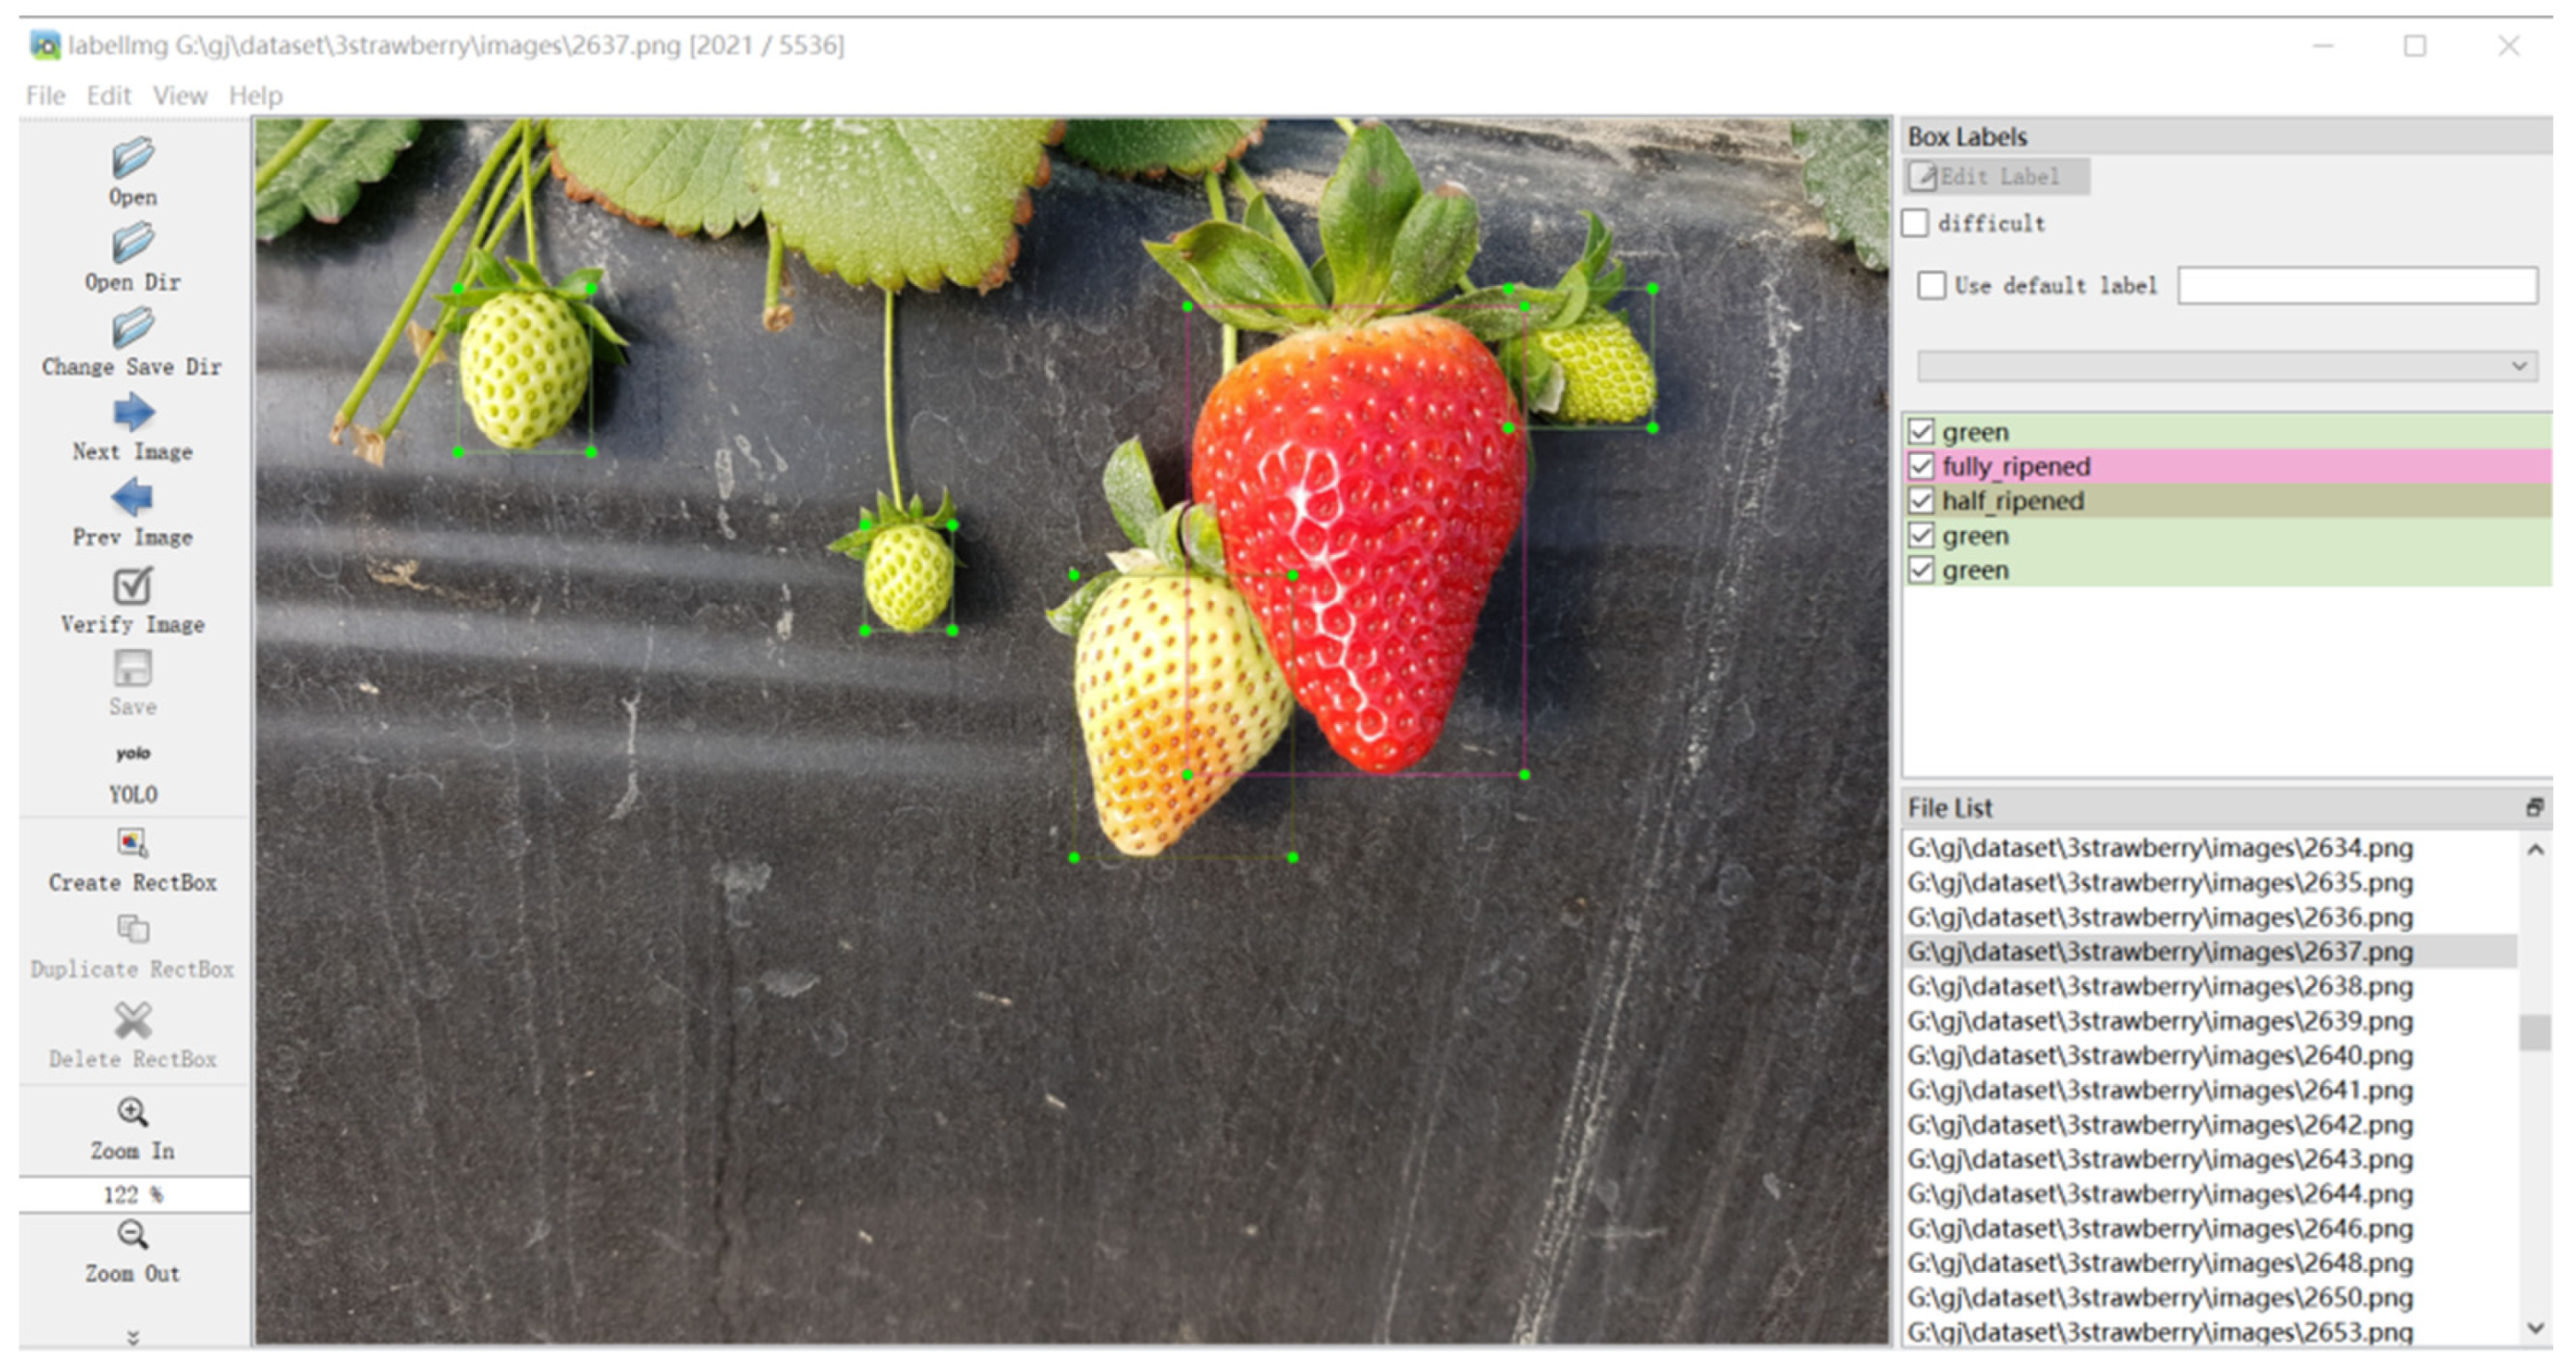
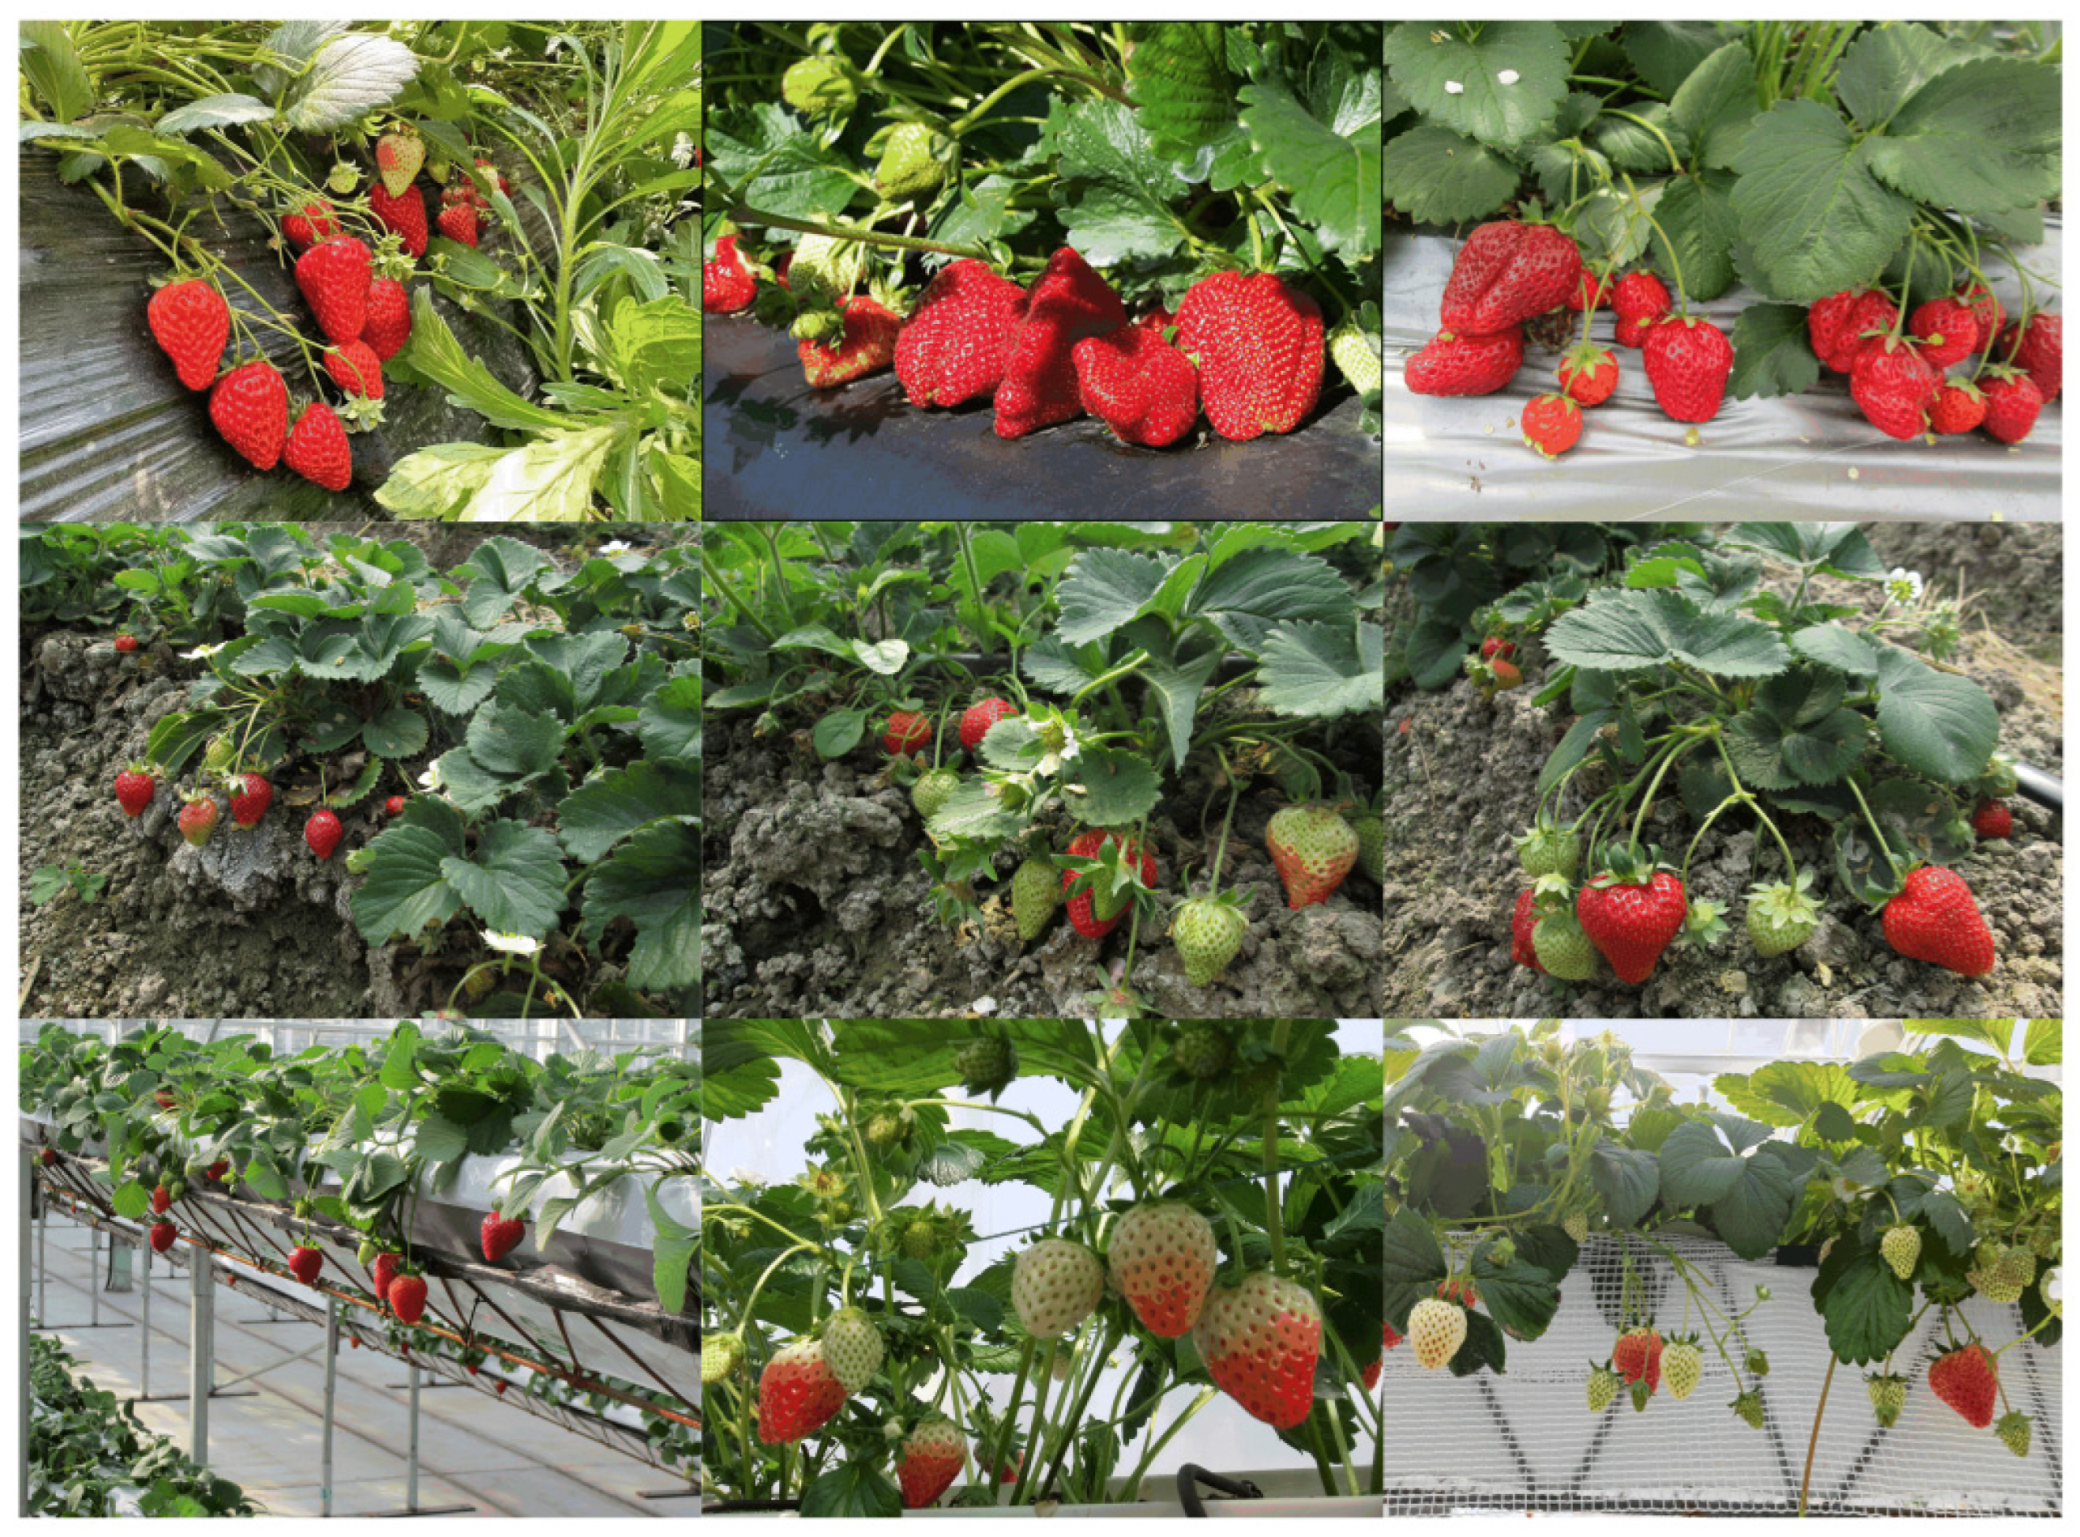
3.1. Construction of the Dataset

Currently, strawberries are grown in a variety of ways, and based on the consideration of the diversity of the dataset, the images in this dataset were partly collected from strawberry plantations in sheds and partly from outdoor growing areas and elevated strawberry plantations [27]. To enhance the applicability of this model in real-world scenarios, 7109 images were captured using an Android phone under diverse conditions, including different distances, lighting conditions, occlusion situations, viewing angles, and strawberry density levels. Each image has a resolution of 4608 × 3456 pixels. The dataset was divided into training, validation, and test sets in a ratio of 8:1:1, comprising 5687 images for training, 711 images for validation, and 711 images for testing. During strawberry growth, the shape and color change gradually, and each stage exhibits distinctive visual characteristics. Therefore, strawberries were categorized into three stages based on different maturity levels: green, half-ripened, and fully ripened, as shown in Figure 6. The dataset was named the Strawberry Ripeness Dataset (SRD). A statistical overview of the number of bounding boxes in the Strawberry Ripeness Dataset is presented in Table 1.
Subsequently, the LabelImg tool is used to annotate the 2D strawberries. The positions of the bounding boxes are recorded in the format [x1, y1, x2, y2], where (x1, y1) denotes the coordinates of the upper-left corner and (x2, y2) denotes the coordinates of the lower-right corner of the box. The coordinate origin is set at the top-left corner of the images [0, 0]. All annotation data are saved in .txt format, and the labeling process is illustrated in Figure 7. In order to visualize the dataset used for model training, some images from the dataset are selected in this section, as shown in Figure 8.

3.2. Experiment Environment and Evaluation Metrics

In order to ensure training efficiency and optimize model performance, this study conducts comparative experiments on hyperparameter selection under the hardware and software configurations listed in Table 2. Firstly, different initial learning rates are selected for the comparative experiments, which are set to 0.1, 0.01, and 0.001, respectively, while keeping all other hyperparameters unchanged to investigate the effect of the learning rate on training stability and convergence speed. The results in Figure 9 show that the training curve is smooth without noticeable oscillation when the learning rate is set to 0.01. In addition, evaluation metrics such as mAP@0.5 and mAP@0.5:0.95 indicate that the best performance is achieved at this learning rate.
Additionally, to further analyze the impact of training epochs on model performance, three sets of comparative experiments are conducted, with the number of training epochs set to 100, 150, and 200 to evaluate model convergence and changes in detection accuracy. As illustrated in Figure 10, when the number of training epochs is 100, this model has not yet fully converged, and there is still room for performance improvement. At 150 epochs, the model achieves optimal performance. Increasing the number of training epochs to 200 yields no further performance gains, indicating that the model has already converged at approximately 150 epochs. Therefore, to balance training efficiency and performance, the number of training epochs is finally set to 150, which avoids unnecessary resource waste and ensures good detection accuracy. The batch size is set to 32 based on empirical tuning and is considered by GPU memory limitations. The final hyperparameter settings used for training are listed in Table 3.
In terms of model detection performance, the number of parameters (params) and the amount of computation (GFLOPs) are used as evaluation metrics for model size. The number of parameters refers to the total number of trainable parameters in the model. It is commonly used to measure model size, that is, computational space complexity. GFLOPs represent the computational rate of floating-point operations and are used to estimate the execution time of the network, i.e., computational time complexity [28]. Frames Per Second (FPS) denotes the image processing rate of the model per second and is crucial for evaluating the efficiency of real-time target detection. It is calculated as in Equation (3).
FPS = 1 T pre + T in + T post 1000
In terms of detection model precision, this study adopts precision rate (P), recall rate (R), average precision (AP), and mean average precision (mAP) as the evaluation metrics of target detection algorithms. The formulas are calculated as Equations (4)–(7).
P = TP TP + FP
R = TP TP + FN
AP = i = 1 n P i dR i
mAP = 1 n j = 1 n AP j
where TP is the number of targets correctly detected by the model; FP is the number of background or non-targets incorrectly recognized as targets by the model; FN is the number of targets not detected by the model; P(i) is the precision of the i-th recall rate threshold; the recall rate increment is set to dR(i), and APj is the average precision in the j-th category. mAP@0.5 is the average of the sample AP@0.5 values across all the categories, and the calculated mAP score contains IoU thresholds from 0.5 to 0.95, evaluated in units of 0.05, and it is called mAP@0.5:0.95.

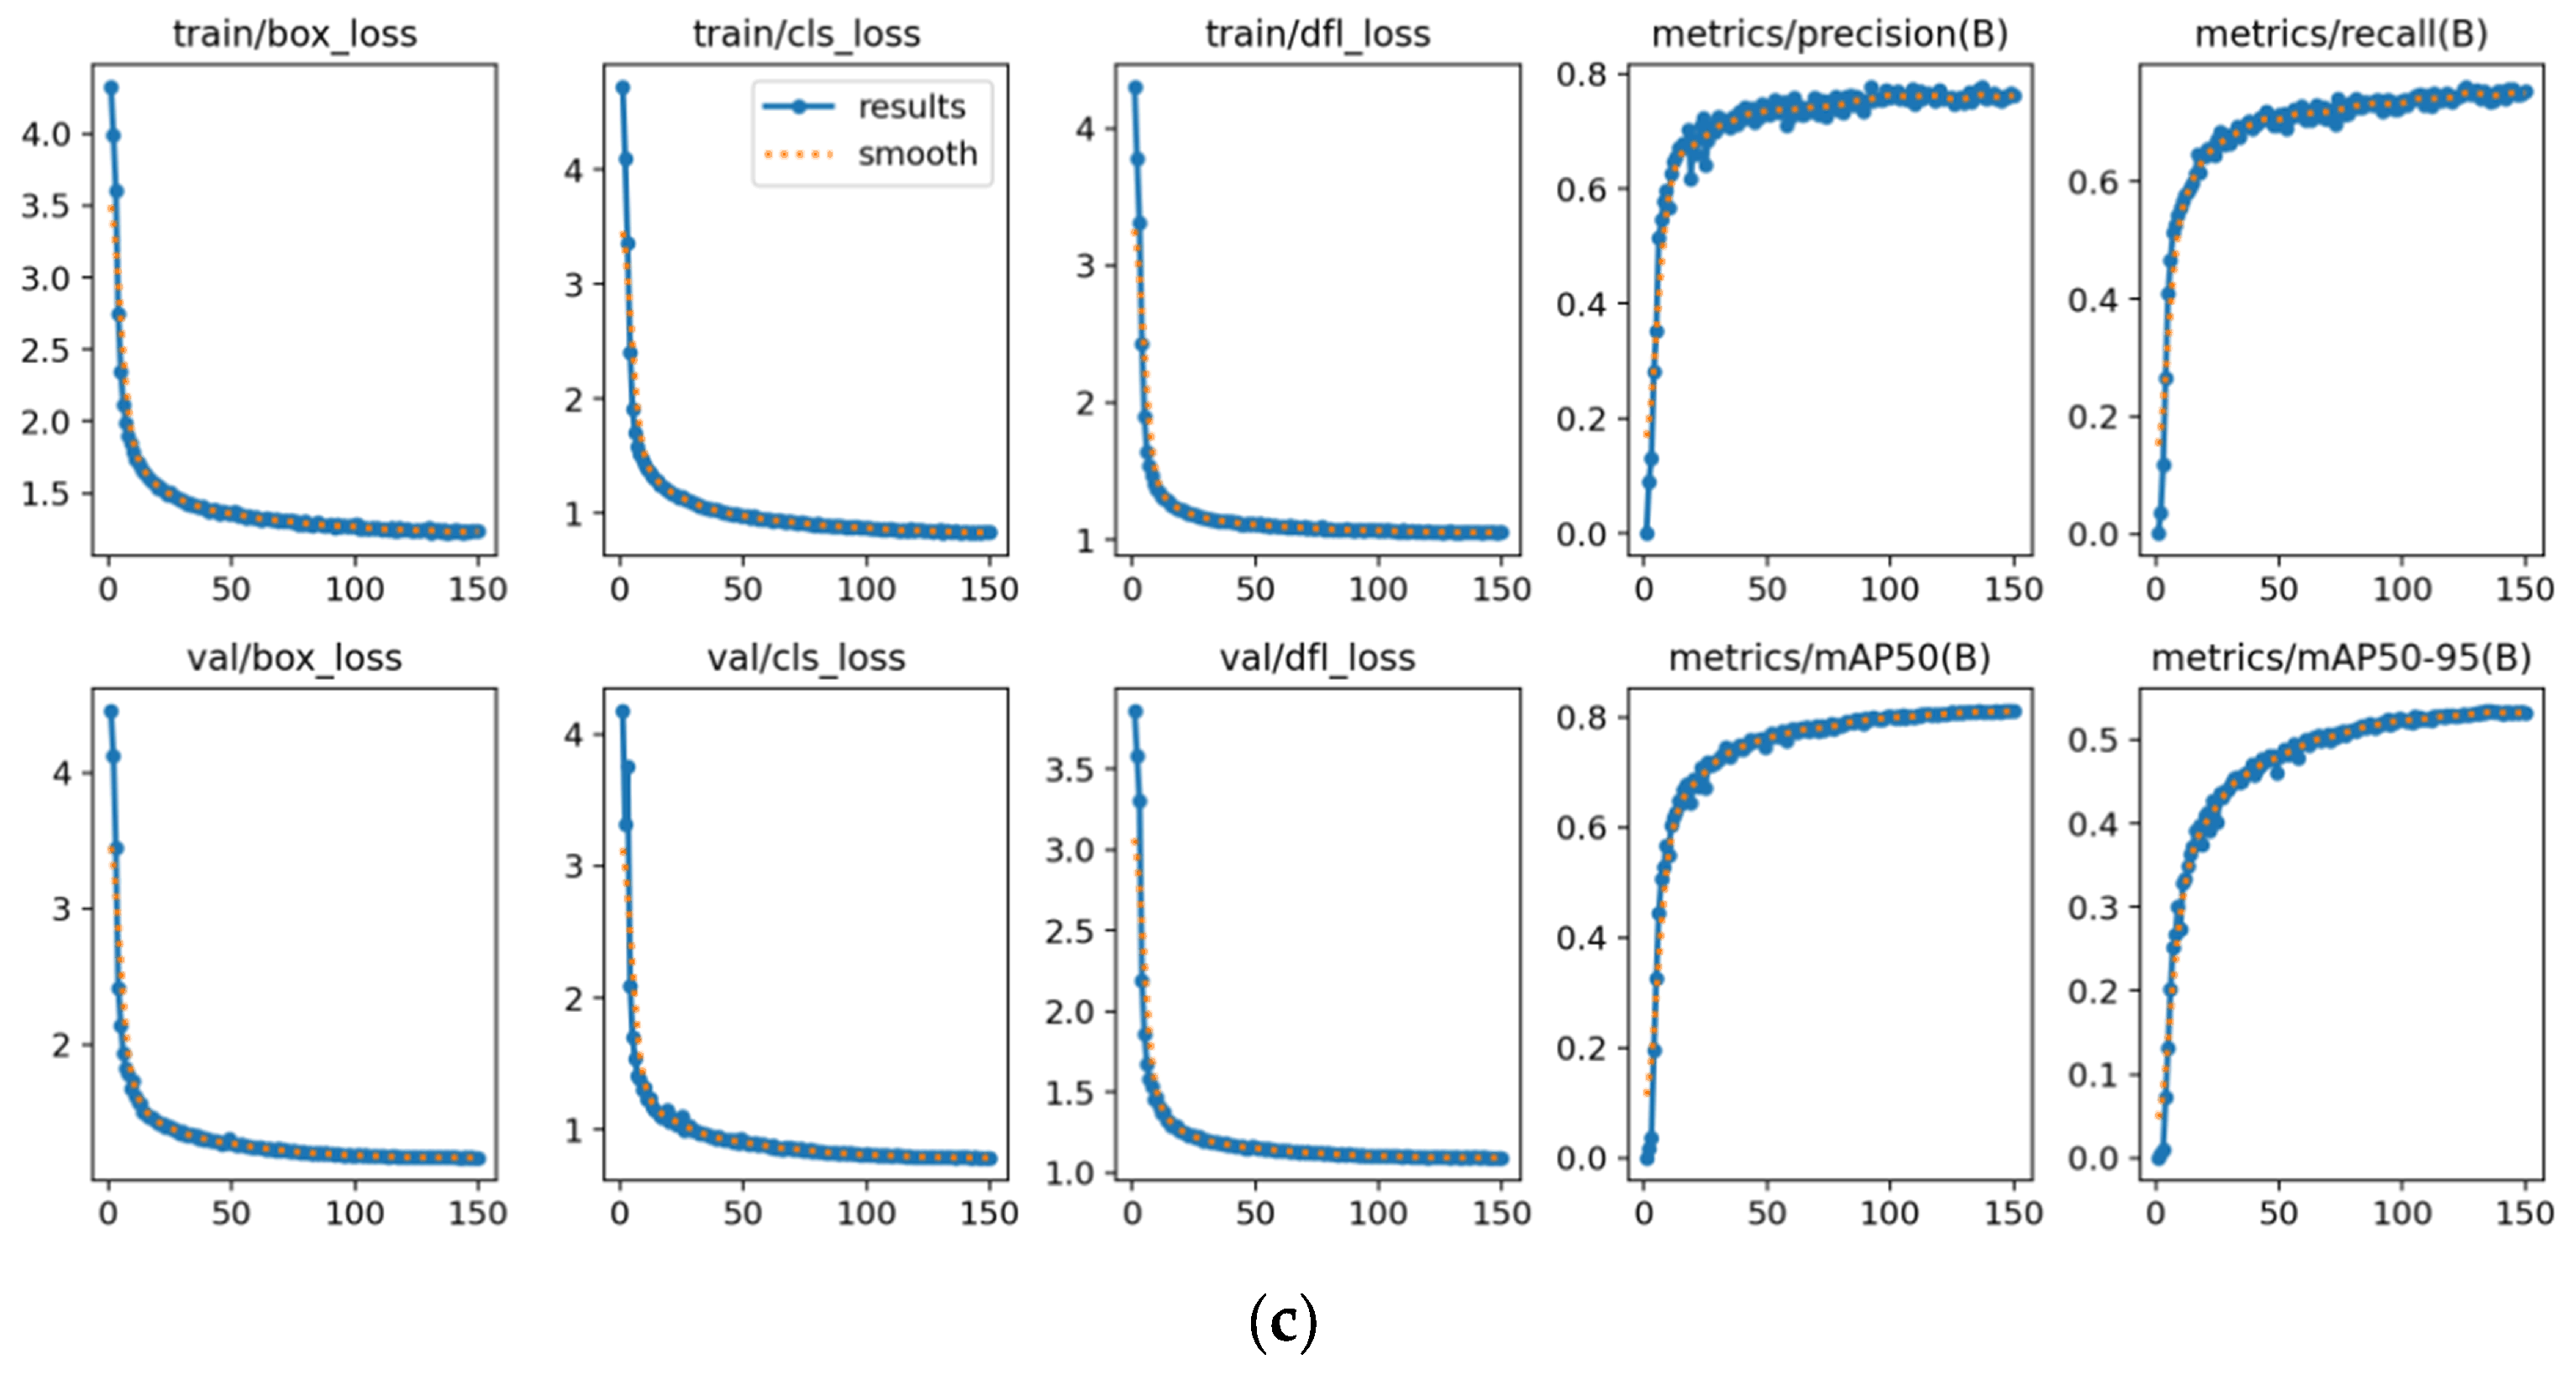
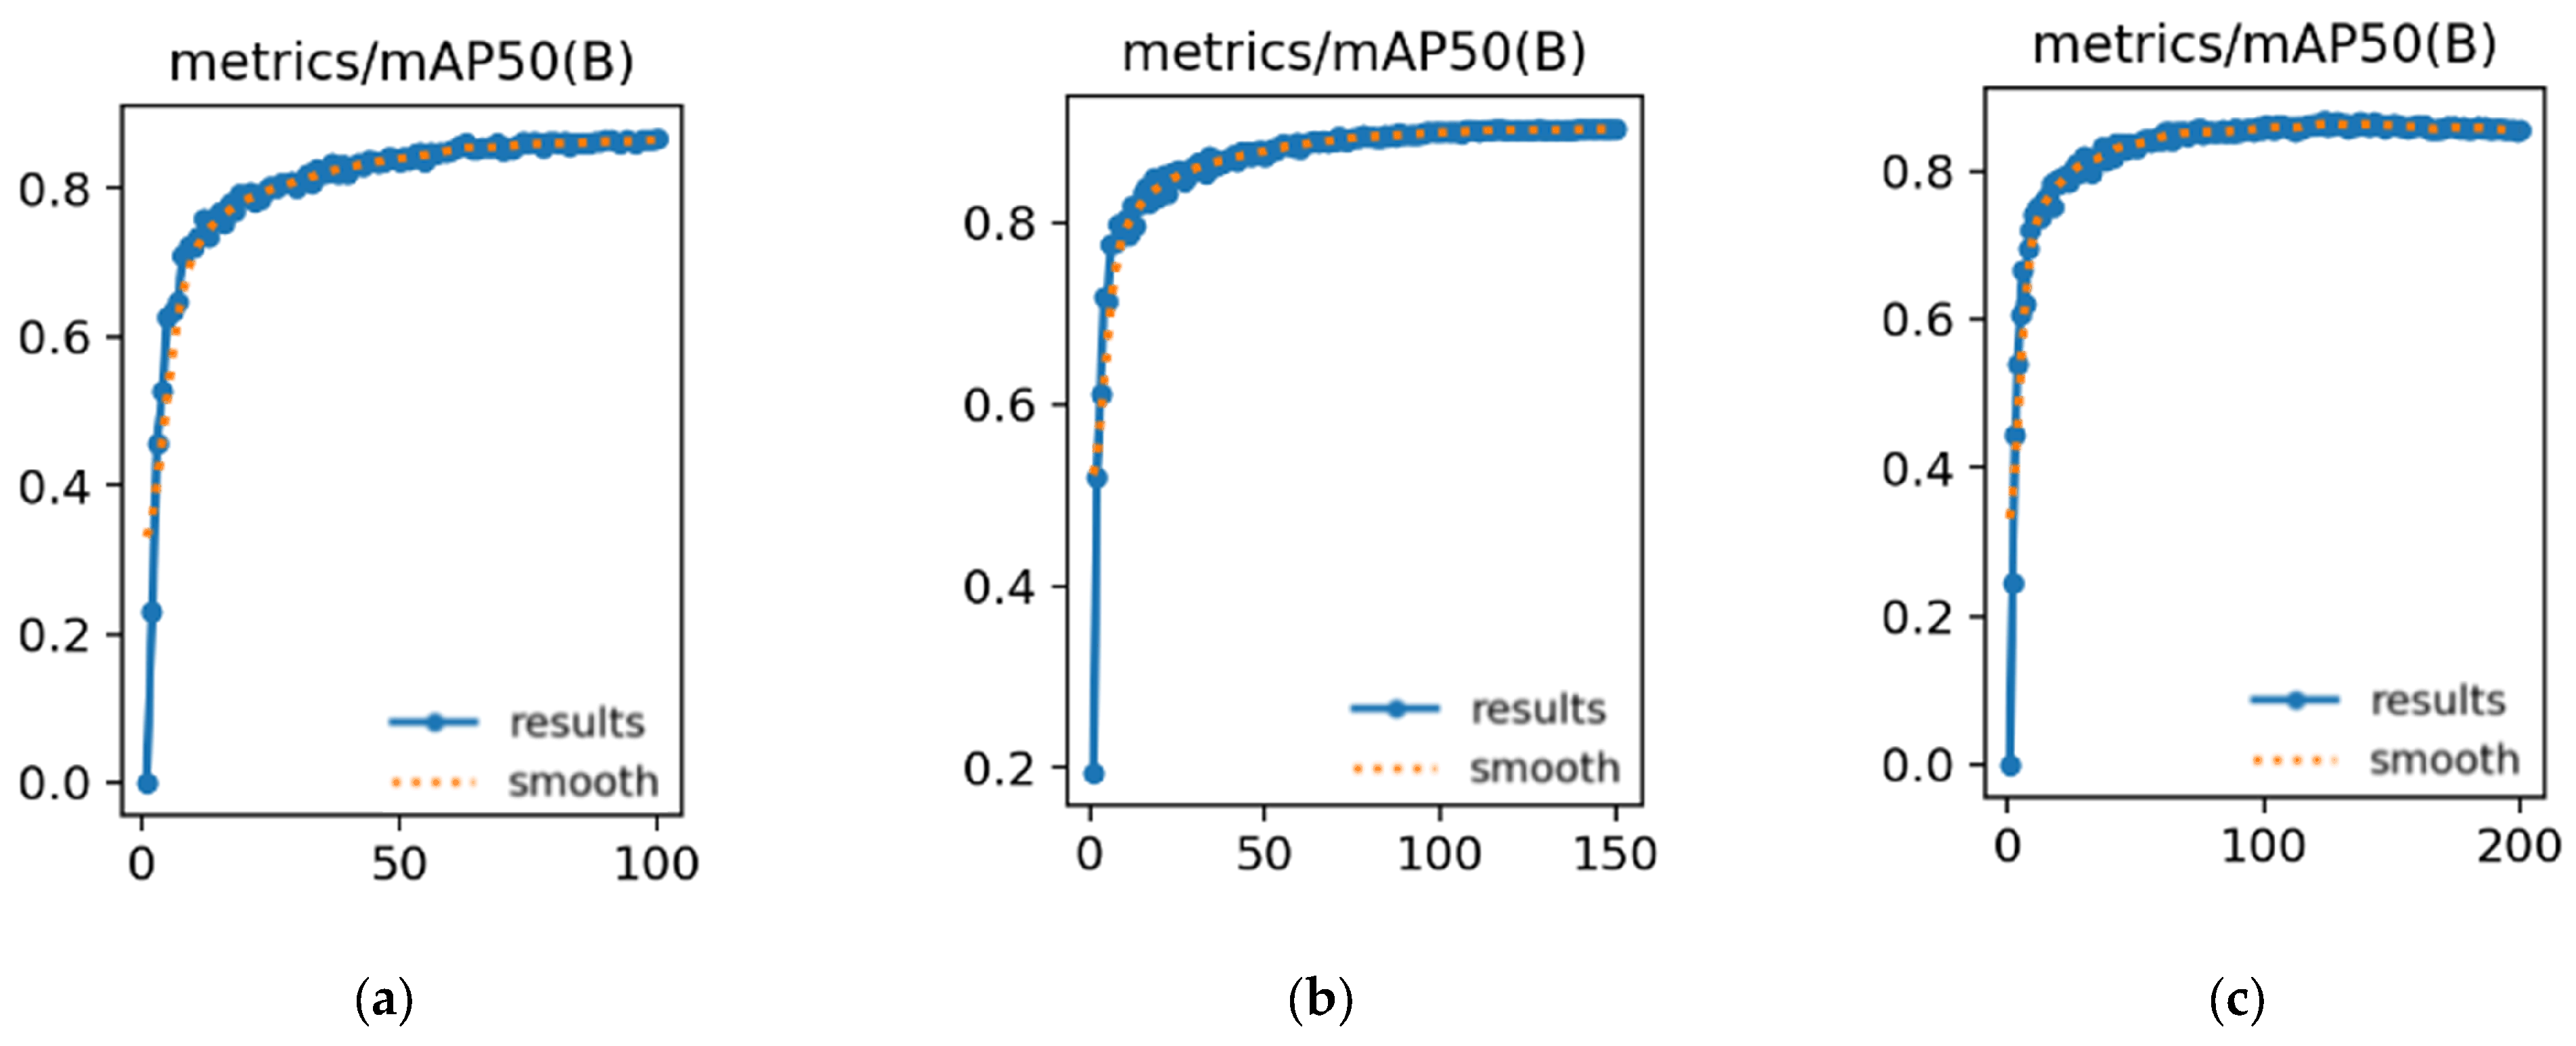
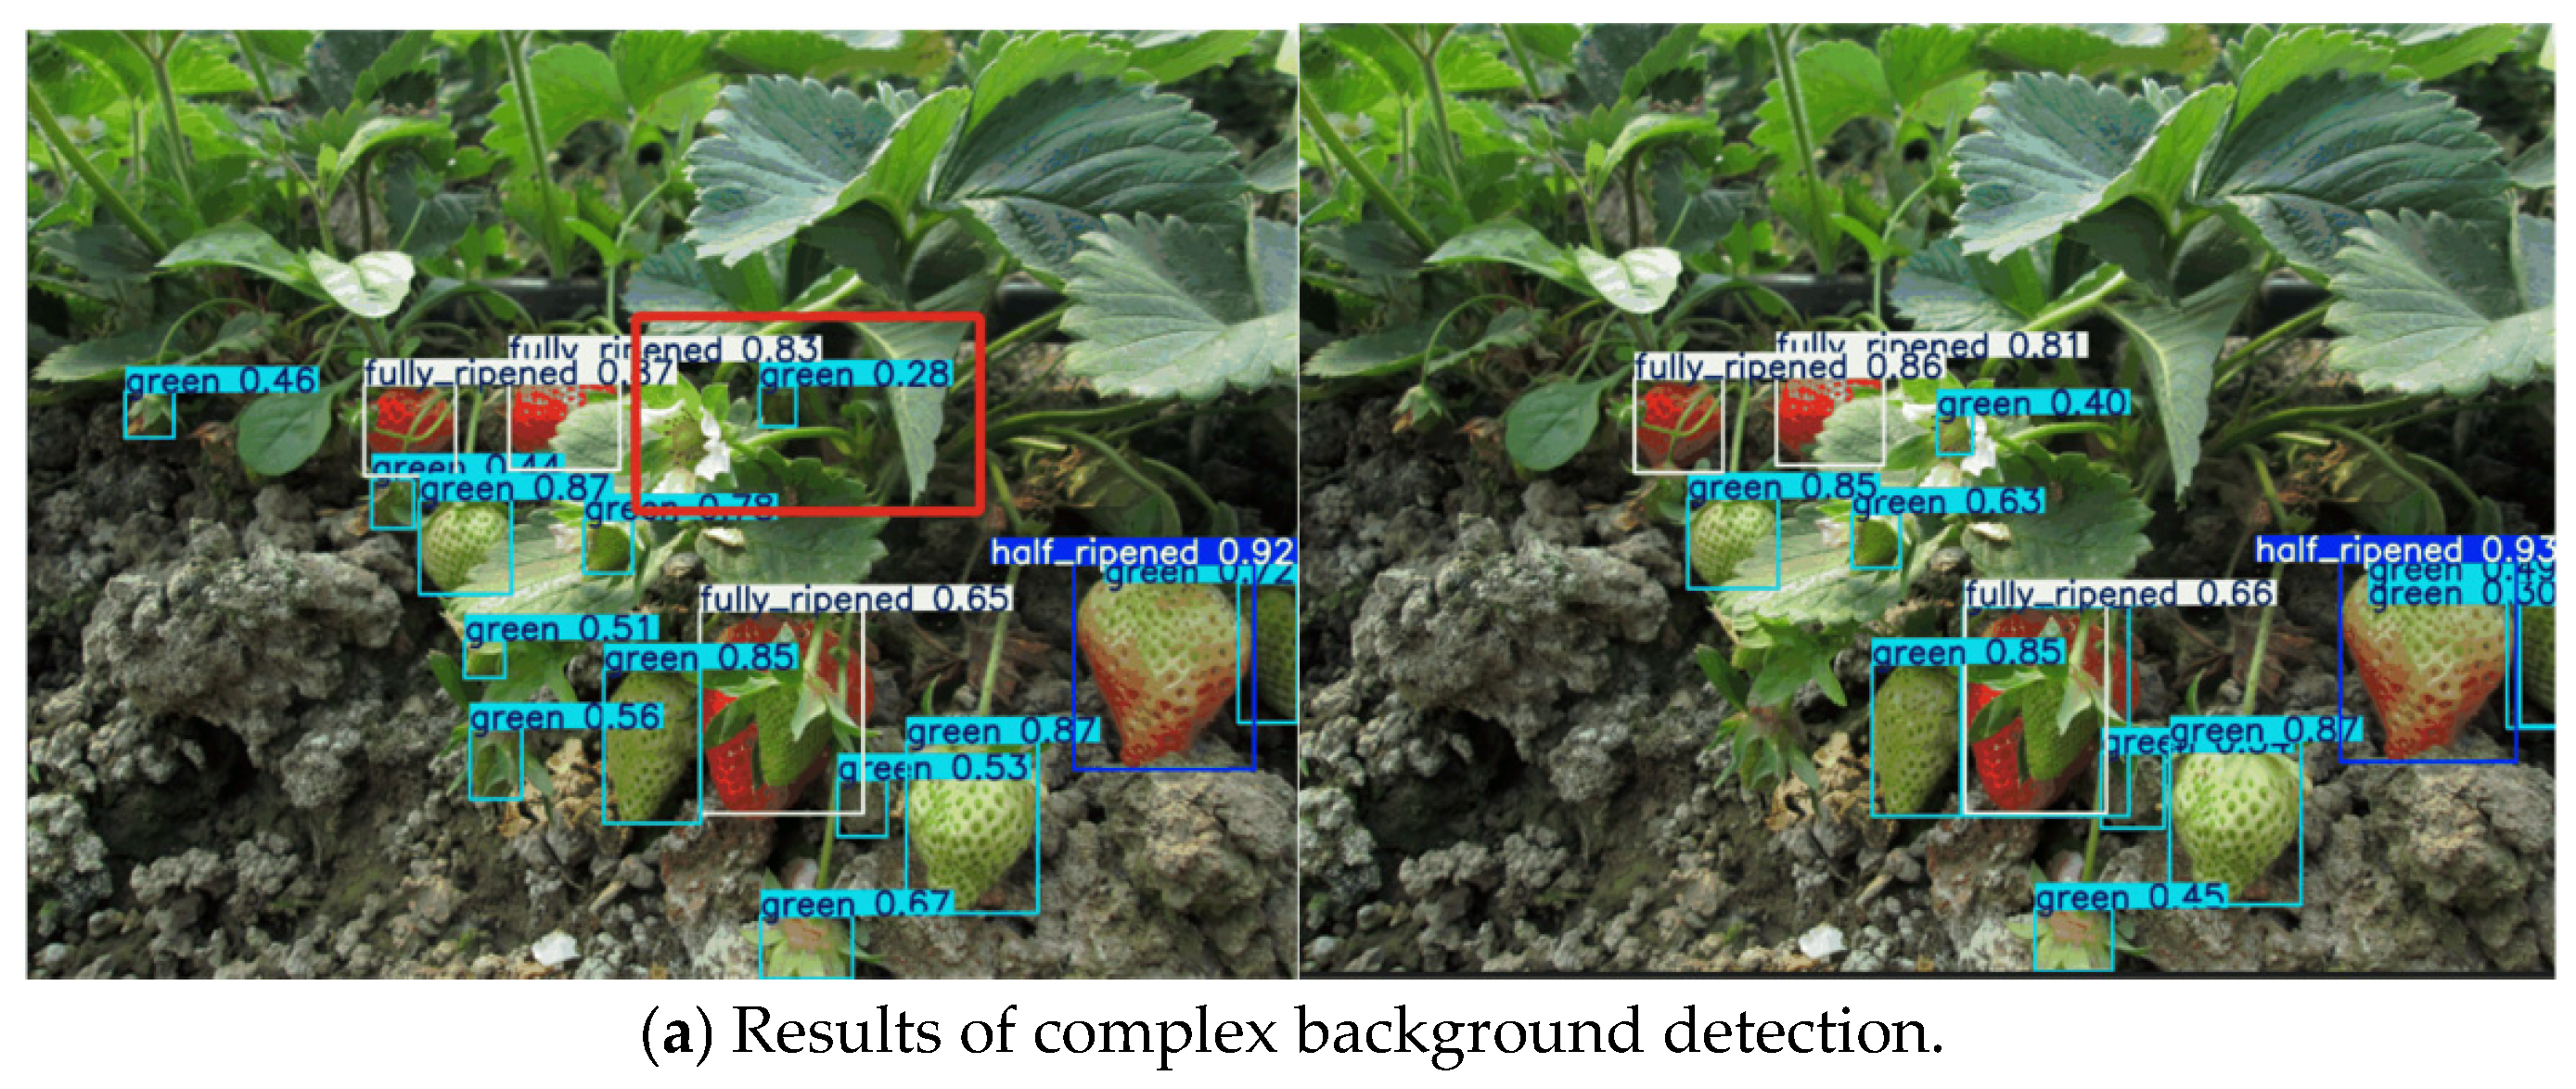
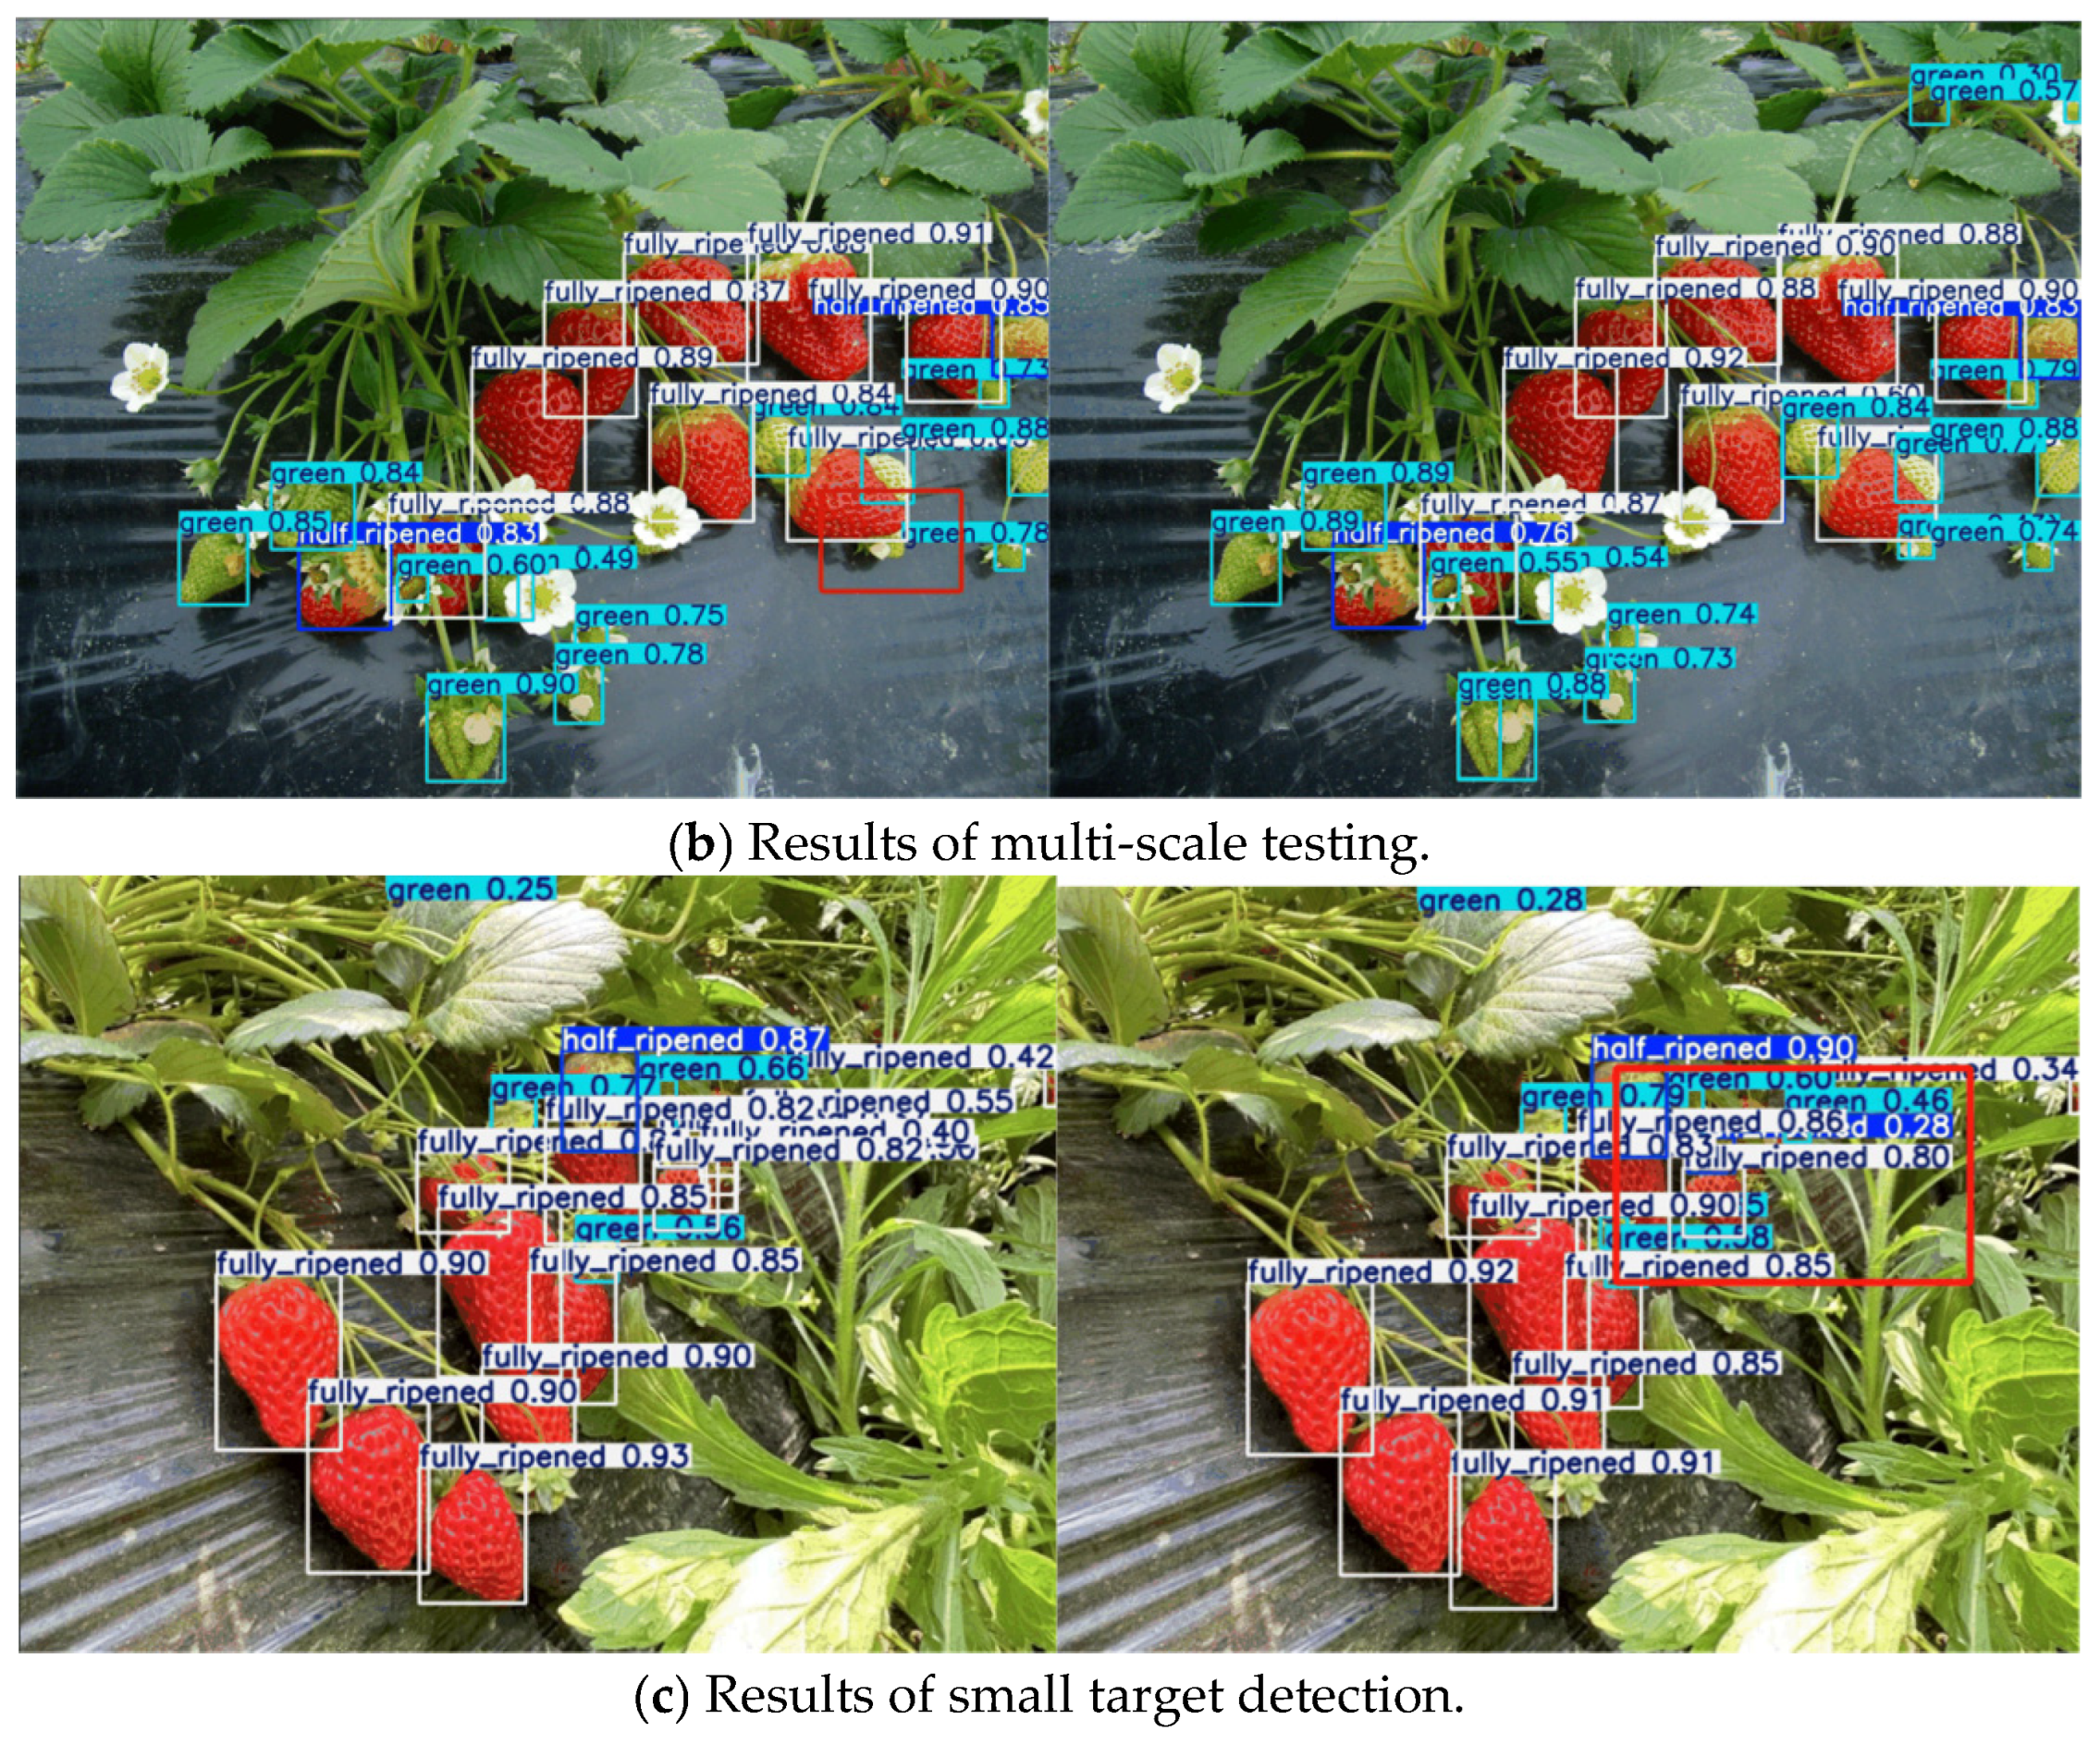
3.3. Visualization Results

The experimental results show that the YOLOv11-HRS model presented in this study is better than the YOLOv11 baseline model in strawberry maturity detection. Figure 11 presents a comparison of the detection performance between the YOLOv11 baseline model and the proposed YOLOv11-HRS model.
It is clearly illustrated in the comparison graph in Figure 11 that the YOLOv11-HRS model outperformed the baseline YOLOv11 in object detection. YOLOv11-HRS not only detects more targets but also improves the confidence level of the same target. As shown in Figure 11a, the YOLOv11 model misidentifies soil as immature strawberries under complex background conditions, leading to a false detection. In contrast, the YOLOv11-HRS model effectively avoids this issue. From Figure 11b, it can be seen that in the multi-scale case, the YOLOv11 model ignores the presence of small targets, which leads to a missed detection situation, whereas the YOLOv11-HRS model pays better attention to small targets to avoid this situation. From Figure 11c, it can be seen that the YOLOv11 model has a missed detection situation, while the YOLOv11-HRS model does not have a missed detection situation.

3.4. Experimental Results and Analyses

To ensure the reliability of the experimental data and minimize the influence of random factors on the results, each experiment was repeated three times. The observed mAP@0.5 values remained within a narrow range (±0.2%), indicating stable and repeatable performance. For clarity and conciseness, only representative average results are presented in this section.

3.4.1. Experiments on Attention Mechanisms

The enhancement of the backbone network is achieved by attaching the Convolutional Block Attention Mechanism [29] (CBAM) module, in addition to the Efficient Channel Attention Mechanism [30] (ECA) module, Global Attention Mechanism [31] (GAM) module, and Bi-Layered Routing Attention Mechanism [32] (Biformer) module, which are targeted at Layer 11 (starting from Layer 0) of the backbone framework in the YOLOv11 model. Under the same experimental setup, the incorporation of the attention module resulted in varying degrees of improvement in the detection accuracy of the model, especially in the mAP@0.5 metrics, where the ECA, GAM, Biformer, and CBAM attention mechanisms resulted in accuracy improvements of 1.8%, 1.7%, 2.2%, and 1.9%, respectively. On the mAP@0.5:0.95 metric, the ECA, GAM, Biformer, and CBAM attention mechanisms improved by 5.1%, 4.9%, 5.4%, and 4.8%, respectively. The performance comparison is shown in Table 4, where the Biformer attention module has the highest detection benefit, but at the same time, the computational complexity is increased by 36.9%. The CBAM attention module ensures that the computational complexity remains almost unchanged while providing an accurate feature representation.

3.4.2. Small-Target Detection Head Improvement Experiments

By adding a 160 × 160 scale small-target detection head in the bottom network of FPN and convergence of the features with C3k2 at the bottom of the backbone network (as shown in the red box in Figure 4), the detailed information in the image can be better extracted, which enhances the interpreted data and feature portrayal of the tiny entities in the strawberry. As shown in Table 5, precision and recall increased by 1.8% and 3%, while mAP@0.5 and mAP@0.5:0.95 improved by 2.8% and 5%, respectively.
Based on the backbone improvement experiments, detection performance is further optimized by integrating the ECA module, Biformer module, and CBAM attention module with the detection head. As shown in Table 5, the CBAM attention module combined with the detection head has the best detection performance, and mAP@0.5 and mAP@0.5:0.95 improved by 3.1% and 6.1%, respectively.

3.4.3. Comparative Experiments of the RepNCSPELAN4_L Module

To improve feature extraction, the RepNCSPELAN4_L module is designed to replace the C3k2 module in the YOLOv11 network. It introduces a multi-branch parallel structure and deeper feature fusion to enhance the model’s ability to target at multiple scales. In order to evaluate its effectiveness, the detection performances of C3k2 and RepNCSPELAN4_L are compared under identical training settings and datasets. The results are shown in Table 6; the model with RepNCSPELAN4_L achieves improvements of 2.7% and 5.7% in mAP @0.5 and mAP @0.5:0.95, respectively.

3.4.4. Comparative Experiments with the SPPELAN Module

To evaluate the effectiveness of the proposed SPPELAN module in the strawberry maturity detection task, it is used to replace the original SPPF module while keeping the rest of the network structure and hyperparameters unchanged. It can be observed from Table 7 that the model with SPPELAN outperforms the baseline in all evaluation metrics, with mAP @0.5 and mAP @0.5:0.95 improved by 2.3% and 5.4%, respectively.

3.4.5. Ablation Experiments

To evaluate the effectiveness of the proposed module, YOLOv11n is used as the baseline model, and a series of ablation experiments are conducted using mAP@0.5, mAP@0.5:0.95, number of parameters, and computational complexity as evaluation metrics (√ indicates that the corresponding module exists). The results are summarized in Table 8 and Table 9.
As shown in Table 8, the baseline YOLOv11 model achieves 86.4% mAP@0.5 and 60.3% mAP@0.5:0.95. The performance steadily improves by incrementally adding the small-target detection head and CBAM. Specifically, the inclusion of the detection head leads to a 2.8% increase in mAP@0.5 and a 5% gain in mAP@0.5:0.95. Further integration of the CBAM leads to an additional increase of 0.3% and 1.1% in mAP@0.5 and mAP@0.5:0.95, respectively.
As depicted in Table 9, the RepNCSPELAN4_L and SPPELAN modules are added to further enhance feature expression and improve multi-scale aggregation. The complete model, which incorporates CBAM, the small-target detection head, RepNCSPELAN4_L, and SPPELAN, achieves the best overall performance, with mAP@0.5 and mAP@0.5:0.95 reaching 89.8% and 66.6%, respectively. The parameter count is reduced from 2.77 MB to 2.13 MB, whereas the FPS remained stable at 252.5, meeting the real-time detection requirements.
To assess the real-time performance of the model in an implementation deployment environment, “real-time” processing is defined as a frame rate of ≥30 FPS, based on the criteria used by most edge computing platforms (e.g., Jetson Xavier) for industrial inspection [33]. After fusing the RepNCSPELAN4_L module in the neck, the FPS reaches 178.6, while the mAP@0.5 improves to 89.1%, an improvement of 1.7%. Although the FPS is lower than that of the baseline model, it is still above the real-time threshold. Furthermore, the improved YOLOv11-HRS model achieved the mAP@0.5 of 89.8% while maintaining a nearly constant FPS. In summary, the YOLOv11-HRS model maintains high detection accuracy and demonstrates good real-time processing capability, highlighting its potential for deployment on real-world devices.

3.4.6. Comparative Analysis of Detection Performance Among Different Models

In order to comprehensively evaluate the performance of the YOLOv11-HRS model, ten representative models, SSD [34], YOLOv5n, YOLOv7-tiny [35], DETR [36], Faster R-CNN [37], EfficientDet-D1 [38], YOLOv8n [39], YOLOv9-t [40], YOLOv10n [41], and YOLOv11 [42], are selected as the comparison objects in this paper. Table 10 shows that in terms of mAP@0.5 metrics, the YOLOv11-HRS model improves 10.2% over the SSD model, 4.2% over the YOLOv5n model, 3.2% over the YOLOv7-tiny model, 14.3% over the DETR model, 3.5% over the Faster R-CNN model, 3.3% over the EfficientDet-D1 model, 3% over the YOLOv8n model, 4.6% over the YOLOv9-t model, over the YOLOv10n model by 4.4%, and exceeds the YOLOv11n model by 3.4%. The YOLOv11-HRS model also performs well in the mAP@0.5:0.95 metrics, improving by 14% compared to the SSD model, 9% compared to the YOLOv5n, 8.6% compared to the YOLOv7-tiny model, 24.7% compared to the DETR model, 8,2% compared to the Faster R-CNN and EfficientDet-D1 model, 5.4% compared to the YOLOv8n model, 6.1% compared to the YOLOv9-t model, 7.7% compared to the YOLOv10n model, and 6.3% compared to the YOLOv11n model.
To show strawberry detection in the image more intuitively, the experimental results are shown in the following figures. Figure 12 shows the detection effect of the base model and YOLOv11-HRS model, and the detection accuracy of half_ripened, green, and fully_ripened is improved to 91.5%, 88.2%, and 89.5%, respectively. Figure 13 compares the precision, recall, mAP@0.5, and mAP@0.5:0.95 of the two models, showing that the YOLOv11-HRS model achieves better detection performance. Therefore, through multi-dimensional comparative analyses, the YOLOV11-HRS model demonstrates significant advantages.

3.4.7. Model Generalization Experiments

To comprehensively evaluate the generalization ability of the YOLOv11-HRS model, cross-dataset experiments are conducted using the publicly available dataset (Strawberry-DS) [43]. This dataset contains 4154 images and 40,712 labeled targets, covering various lighting conditions, occlusion situations, and multiple growth stages of strawberries, thereby reflecting the complexity of real field environments. Notably, this dataset is completely independent of the SRD used for training, with no overlapping samples. To further verify the advantages of the YOLOv11-HRS model, we conduct comparison experiments between the YOLOv11-HRS model and the original YOLOv11 baseline model under the same cross-dataset conditions. As shown in Table 11, the YOLOv11-HRS model achieves better performance on the Strawberry-DS dataset, demonstrating its strong generalization capability when applied to unseen data distributions.

4. Conclusions

To address the challenges of complex environmental interference, multi-scale target variation, and small-object recognition in strawberry ripeness detection, this study proposes an improved detection model, YOLOv11-HRS, based on YOLOv11. The model integrates both channel and spatial attention mechanisms to enhance its ability to focus on key feature regions. To improve adaptability to the diversity of target morphology, a novel RepNCSPELAN4_L module is designed, enabling more effective extraction and fusion of multi-scale contextual features. In addition, a 160 × 160 small-target detection head is embedded into the neck structure, aiming to compensate for the lack of semantic information in shallow features. Furthermore, the original SPPF module is replaced with a lightweight SPPELAN module, which enhances detection performance while maintaining low model complexity. On the self-built SRD, YOLOv11-HRS achieves an improvement of 3.4% in mAP@0.5 and 6.3% in mAP@0.5:0.95 compared to the baseline model. Meanwhile, the number of parameters is reduced by 19%, while FPS remains nearly unchanged. Cross-dataset testing on the publicly available Strawberry-DS dataset also demonstrates strong recognition performance, highlighting the generalization capability of the proposed model.
This study offers a practical solution for efficient strawberry ripeness recognition in natural environments and establishes a solid foundation for intelligent management and automatic picking in large-scale strawberry cultivation. In future work, we will further explore the model’s adaptability to various strawberry varieties (e.g., white strawberries) and develop an intelligent grading method that incorporates multi-dimensional appearance features, such as shape and size, to support the construction of an efficient and practical quality sorting system.

Author Contributions

Conceptualization, J.G.; methodology, J.G.; software, J.G.; validation, J.G.; formal analysis, J.G.; investigation, J.G.; data curation, J.G. and S.Z.; writing—original draft preparation, J.G.; writing—review and editing, J.G. and J.L.; visualization, J.G. All authors have read and agreed to the published version of the manuscript.

Funding

This research received no external funding.

Data Availability Statement

The data are available from the corresponding author.

Conflicts of Interest

The authors declare no conflicts of interest.

References

  1. Tian, H.; Wang, T.; Liu, Y.; Qiao, X.; Li, Y. Computer Vision Technology in Agricultural Automation—A Review. Inf. Process. Agric. 2020, 7, 1–19. [Google Scholar] [CrossRef]
  2. Han, X.; Chang, J.; Wang, K. You Only Look Once: Unified, Real-Time Object Detection. Procedia Comput. Sci. 2021, 183, 61–72. [Google Scholar] [CrossRef]
  3. Xiao, B.; Nguyen, M.; Yan, W.Q. Fruit Ripeness Identification Using YOLOv8 Model. Multimed. Tools Appl. 2024, 83, 28039–28056. [Google Scholar] [CrossRef]
  4. Ma, Y.; Zhang, S. YOLOv8-CBSE: An Enhanced Computer Vision Model for Detecting the Maturity of Chili Pepper in the Natural Environment. Agronomy 2025, 15, 537. [Google Scholar] [CrossRef]
  5. Xu, D.; Ren, R.; Zhao, H.; Zhang, S. Intelligent Detection of Muskmelon Ripeness in Greenhouse Environment Based on YOLO-RFEW. Agronomy 2024, 14, 1091. [Google Scholar] [CrossRef]
  6. Wang, C.; Han, Q.; Li, J.; Li, C.; Zou, X. YOLO-BLBE: A Novel Model for Identifying Blueberry Fruits with Different Maturities Using the I-MSRCR Method. Agronomy 2024, 14, 658. [Google Scholar] [CrossRef]
  7. Liu, Z.; Abeyrathna, R.R.D.; Sampurno, R.M.; Nakaguchi, V.M.; Ahamed, T. Faster-YOLO-AP: A Lightweight Apple Detection Algorithm Based on Improved YOLOv8 with a New Efficient PDWConv in Orchard. Comput. Electron. Agric. 2024, 223, 109118. [Google Scholar] [CrossRef]
  8. Ouhami, M.; Hafiane, A.; Es-Saady, Y.; El Hajji, M.; Canals, R. Computer Vision, IoT and Data Fusion for Crop Disease Detection Using Machine Learning: A Survey and Ongoing Research. Remote Sens. 2021, 13, 2486. [Google Scholar] [CrossRef]
  9. Wang, J.; Ma, S.; Wang, Z.; Ma, X.; Yang, C.; Chen, G.; Wang, Y. Improved Lightweight YOLOv8 Model for Rice Disease Detection in Multi-Scale Scenarios. Agronomy 2025, 15, 445. [Google Scholar] [CrossRef]
  10. Wang, Q.; Liu, Y.; Zheng, Q.; Tao, R.; Liu, Y. SMC-YOLO: A High-Precision Maize Insect Pest-Detection Method. Agronomy 2025, 15, 195. [Google Scholar] [CrossRef]
  11. Huang, Y.; Liu, Z.; Zhao, H.; Tang, C.; Liu, B.; Li, Z.; Wan, F.; Qian, W.; Qiao, X. YOLO-YSTs: An Improved YOLOv10n-Based Method for Real-Time Field Pest Detection. Agronomy 2025, 15, 575. [Google Scholar] [CrossRef]
  12. Qiao, Y.; Guo, Y.; He, D. Cattle Body Detection Based on YOLOv5-ASFF for Precision Livestock Farming. Comput. Electron. Agric. 2023, 204, 107579. [Google Scholar] [CrossRef]
  13. Xu, Z.; Li, J.; Meng, Y.; Zhang, X. CAP-YOLO: Channel Attention Based Pruning YOLO for Coal Mine Real-Time Intelligent Monitoring. Sensors 2022, 22, 4331. [Google Scholar] [CrossRef]
  14. Jia, Y.; Fu, K.; Lan, H.; Wang, X.; Su, Z. Maize Tassel Detection with CA-YOLO for UAV Images in Complex Field Environments. Comput. Electron. Agric. 2024, 217, 108562. [Google Scholar] [CrossRef]
  15. Soltani Firouz, M.; Sardari, H. Defect Detection in Fruit and Vegetables by Using Machine Vision Systems and Image Processing. Food Eng. Rev. 2022, 14, 353–379. [Google Scholar] [CrossRef]
  16. Liang, X.; Jia, X.; Huang, W.; He, X.; Li, L.; Fan, S.; Li, J.; Zhao, C.; Zhang, C. Real-Time Grading of Defect Apples Using Semantic Segmentation Combination with a Pruned YOLO V4 Network. Foods 2022, 11, 3150. [Google Scholar] [CrossRef]
  17. Moysiadis, V.; Siniosoglou, I.; Kokkonis, G.; Argyriou, V.; Lagkas, T.; Goudos, S.K.; Sarigiannidis, P. Cherry Tree Crown Extraction Using Machine Learning Based on Images from UAVs. Agriculture 2024, 14, 322. [Google Scholar] [CrossRef]
  18. Jiang, M.; Song, L.; Wang, Y.; Li, Z.; Song, H. Fusion of the YOLOv4 Network Model and Visual Attention Mechanism to Detect Low-Quality Young Apples in a Complex Environment. Precis. Agric. 2022, 23, 559–577. [Google Scholar] [CrossRef]
  19. Wang, C.; Wang, C.; Wang, L.; Wang, J.; Liao, J.; Li, Y.; Lan, Y. A Lightweight Cherry Tomato Maturity Real-Time Detection Algorithm Based on Improved YOLOV5n. Agronomy 2023, 13, 2106. [Google Scholar] [CrossRef]
  20. Fan, Y.; Zhang, S.; Feng, K.; Qian, K.; Wang, Y.; Qin, S. Strawberry Maturity Recognition Algorithm Combining Dark Channel Enhancement and YOLOv5. Sensors 2022, 22, 419. [Google Scholar] [CrossRef]
  21. Yang, S.; Wang, W.; Gao, S.; Deng, Z. Strawberry Ripeness Detection Based on YOLOv8 Algorithm Fused with LW-Swin Transformer. Comput. Electron. Agric. 2023, 215, 108360. [Google Scholar] [CrossRef]
  22. Wang, C.; Wang, H.; Han, Q.; Zhang, Z.; Kong, D.; Zou, X. Strawberry Detection and Ripeness Classification Using YOLOv8+ Model and Image Processing Method. Agriculture 2024, 14, 751. [Google Scholar] [CrossRef]
  23. Feng, W.; Liu, M.; Sun, Y.; Wang, S.; Wang, J. The Use of a Blueberry Ripeness Detection Model in Dense Occlusion Scenarios Based on the Improved YOLOv9. Agronomy 2024, 14, 1860. [Google Scholar] [CrossRef]
  24. Moysiadis, V.; Kokkonis, G.; Bibi, S.; Moscholios, I.; Maropoulos, N.; Sarigiannidis, P. Monitoring Mushroom Growth with Machine Learning. Agriculture 2023, 13, 223. [Google Scholar] [CrossRef]
  25. Chandra, N.; Vaidya, H.; Sawant, S.; Meena, S.R. A Novel Attention-Based Generalized Efficient Layer Aggregation Network for Landslide Detection from Satellite Data in the Higher Himalayas, Nepal. Remote Sens. 2024, 16, 2598. [Google Scholar] [CrossRef]
  26. Deng, T.; Liu, X.; Wang, L. Occluded Vehicle Detection via Multi-Scale Hybrid Attention Mechanism in the Road Scene. Electronics 2022, 11, 2709. [Google Scholar] [CrossRef]
  27. Samtani, J.B.; Rom, C.R.; Friedrich, H.; Fennimore, S.A.; Finn, C.E.; Petran, A.; Wallace, R.W.; Pritts, M.P.; Fernandez, G.; Chase, C.A.; et al. The Status and Future of the Strawberry Industry in the United States. HortTechnology 2019, 29, 11–24. [Google Scholar] [CrossRef]
  28. Mirhaji, H.; Soleymani, M.; Asakereh, A.; Mehdizadeh, S.A. Fruit Detection and Load Estimation of an Orange Orchard Using the YOLO Models through Simple Approaches in Different Imaging and Illumination Conditions. Comput. Electron. Agric. 2021, 191, 106533. [Google Scholar] [CrossRef]
  29. Woo, S.; Park, J.; Lee, J.-Y.; Kweon, I.S. Cbam: Convolutional Block Attention Module. In Proceedings of the European Conference on Computer Vision (ECCV), Munich, Germany, 8–14 September 2018; pp. 3–19. [Google Scholar]
  30. Wang, Q.; Wu, B.; Zhu, P.; Li, P.; Zuo, W.; Hu, Q. ECA-Net: Efficient Channel Attention for Deep Convolutional Neural Networks. In Proceedings of the IEEE/CVF Conference on Computer Vision and Pattern Recognition, Seattle, WA, USA, 14–19 June 2020; pp. 11534–11542. [Google Scholar]
  31. Liu, Y.; Shao, Z.; Hoffmann, N. Global Attention Mechanism: Retain Information to Enhance Channel-Spatial Interactions. arXiv 2021, arXiv:2112.05561. [Google Scholar]
  32. Zhu, L.; Wang, X.; Ke, Z.; Zhang, W.; Lau, R.W. Biformer: Vision Transformer with Bi-Level Routing Attention. In Proceedings of the IEEE/CVF Conference on Computer Vision and Pattern Recognition, Vancouver, BC, Canada, 18–22 June 2023; pp. 10323–10333. [Google Scholar]
  33. Liu, Y.; Zheng, H.; Zhang, Y.; Zhang, Q.; Chen, H.; Xu, X.; Wang, G. “Is This Blueberry Ripe?”: A Blueberry Ripeness Detection Algorithm for Use on Picking Robots. Front. Plant Sci. 2023, 14, 1198650. [Google Scholar] [CrossRef]
  34. Liu, W.; Anguelov, D.; Erhan, D.; Szegedy, C.; Reed, S.; Fu, C.-Y.; Berg, A.C. Ssd: Single Shot Multibox Detector. In Proceedings of the Computer Vision–ECCV 2016: 14th European Conference, Amsterdam, The Netherlands, 11–14 October 2016; Proceedings, Part I 14. Springer: Berlin/Heidelberg, Germany, 2016; pp. 21–37. [Google Scholar]
  35. Wang, C.-Y.; Bochkovskiy, A.; Liao, H.-Y.M. YOLOv7: Trainable Bag-of-Freebies Sets New State-of-the-Art for Real-Time Object Detectors. In Proceedings of the IEEE/CVF Conference on Computer Vision and Pattern Recognition, Vancouver, BC, Canada, 18–22 June 2023; pp. 7464–7475. [Google Scholar]
  36. Carion, N.; Massa, F.; Synnaeve, G.; Usunier, N.; Kirillov, A.; Zagoruyko, S. End-to-End Object Detection with Transformers. In Proceedings of the European Conference on Computer Vision, Glasgow, UK, 23–28 August 2020; Springer: Berlin/Heidelberg, Germany, 2020; pp. 213–229. [Google Scholar]
  37. Girshick, R. Fast R-Cnn. arXiv 2015, arXiv:1504.08083. [Google Scholar]
  38. Tan, M.; Pang, R.; Le, Q.V. Efficientdet: Scalable and Efficient Object Detection. In Proceedings of the IEEE/CVF Conference on Computer Vision and Pattern Recognition, Seattle, WA, USA, 14–19 June 2020; pp. 10781–10790. [Google Scholar]
  39. Varghese, R.; Sambath, M. Yolov8: A Novel Object Detection Algorithm with Enhanced Performance and Robustness. In Proceedings of the 2024 International Conference on Advances in Data Engineering and Intelligent Computing Systems (ADICS), Chennai, India, 18–19 April 2024; IEEE: Piscataway, NJ, USA, 2024; pp. 1–6. [Google Scholar]
  40. Wang, C.-Y.; Yeh, I.-H.; Mark Liao, H.-Y. Yolov9: Learning What You Want to Learn Using Programmable Gradient Information. In Proceedings of the European Conference on Computer Vision, Milan, Italy, 29 September–4 October 2024; Springer: Berlin/Heidelberg, Germany, 2024; pp. 1–21. [Google Scholar]
  41. Wang, A.; Chen, H.; Liu, L.; Chen, K.; Lin, Z.; Han, J.; Ding, G. Yolov10: Real-Time End-to-End Object Detection. Adv. Neural Inf. Process. Syst. 2025, 37, 107984–108011. [Google Scholar]
  42. Khanam, R.; Hussain, M. Yolov11: An Overview of the Key Architectural Enhancements. arXiv 2024, arXiv:2410.17725. [Google Scholar]
  43. Elhariri, E.; El-Bendary, N.; Saleh, S.M. Strawberry-DS: Dataset of Annotated Strawberry Fruits Images with Various Developmental Stages. Data Brief 2023, 48, 109165. [Google Scholar] [CrossRef]
Figure 1. Model structure of YOLOv11-HRS.
Agronomy 15 01026 g001
Figure 2. Hybrid attention mechanism.
Agronomy 15 01026 g002
Figure 3. Structure of RepNCSPELAN4_L.
Agronomy 15 01026 g003
Figure 4. Small-target detection head.
Agronomy 15 01026 g004
Figure 5. SPPELAN structure.
Agronomy 15 01026 g005
Figure 6. Classification standard of strawberry ripeness.
Agronomy 15 01026 g006
Figure 7. LabelImg labeling page.
Agronomy 15 01026 g007
Figure 8. Pictures of the dataset.
Agronomy 15 01026 g008
Figure 9. Experimental results with different learning rates. (a) 0.1; (b) 0.01; (c) 0.001.
Agronomy 15 01026 g009aAgronomy 15 01026 g009b
Figure 10. Experimental results with different training epochs. (a) 100; (b) 150; (c) 200.
Agronomy 15 01026 g010
Figure 11. Comparison of detection results between YOLOv11 (left) and YOLOv11-HRS (right).
Agronomy 15 01026 g011aAgronomy 15 01026 g011b
Figure 12. Comparison of Precision–Recall curves. (a) mAP detection effect of YOLOv11 model; (b) mAP detection effect of YOLOv11-HRS model.
Agronomy 15 01026 g012
Figure 13. Comparison of two models.
Agronomy 15 01026 g013
Table 1. Statistics for Strawberry Ripeness Dataset.
DatasetNumber of ImagesNumber of Bounding Box
GreenHalf_RipenedFully_Ripened
Training Set568737,73156569405
Validation Set71147727561212
Test Set71145996781092
Sum710947,102709011,709
Table 2. Experimental environment configuration.
SettingsParameters
CPU6 vCPU Intel(R) Xeon(R) Silver 4310 CPU @ 2.10 GHz
GPUNVIDIA GeForce RTX 3090
Operating SystemLinux
Deep learning frameworkPyTorch 2.4.1
LanguagePython 3.8.0
Table 3. Hyperparameter settings.
SettingsParameters
lr00.01
Momentum0.9
OptimizerSGD
Epochs150
Batch size32
Table 4. Contrasting the model’s efficiency with the attention mechanism integrated into the backbone.
ModelmAP@0.5/%mAP@0.5–0.9/%LayerGFLOPs
Baseline86.460.32386.5
YOLOv11 + ECA88.265.42426.4
YOLOv11 + GAM88.165.22477.6
YOLOv11 + Biformer88.665.72448.9
YOLOv11 + CBAM88.365.12466.6
Table 5. Comparison of model performance with the addition of head detection at the neck.
ModelmAP@0.5/%mAP@0.5–0.9/%Precision/%Recall/%Params/MBGFLOPs
YOLOv1186.460.381.579.72.636.5
+Head89.265.383.382.72.6510.4
+ECA + Head89.466.484.183.32.6910.5
+Biformer
+ Head
89.266.283.581.62.6712.8
+CBAM + Head89.566.484.482.62.7710.5
Table 6. Comparison of the RepNCSPELAN4_L and C3k2 modules.
ModelPrecision/%Recall/%mAP@0.5/%mAP@0.5–0.9/%
YOLOv11 + C3k281.579.786.460.3
YOLOv11 + RepNCSPELAN4_L83.181.989.166
Table 7. Comparison of the SPPELAN and SPPF modules.
ModelPrecision/%Recall/%mAP@0.5/%mAP@0.5–0.9/%
YOLOv11 + SPPF81.579.786.460.3
YOLOv11 + SPPELAN83.582.288.765.7
Table 8. Ablation experiments: performance impact of attention and detection head modules.
CBAMHeadRepNCSPELAN4_LSPPELANmAP@0.5/%mAP@0.5–0.9/%FPSParams/MBGFLOPs
86.460.3255.22.636.5
89.265.3323.52.6510.4
88.365.13602.686.6
89.566.4310.12.7710.5
Table 9. Ablation experiments: combined effect of neck and SPPELAN modules enhancements.
CBAMHeadRepNCSPELAN4_LSPPELANmAP@0.5/%mAP@0.5–0.9/%FPSParams/MBGFLOPs
89.566.4310.12.7710.5
89.466.3249.62.519.9
89.666.43052.6910.5
89.866.6252.52.139.7
Table 10. Detection results of different models on SRD.
NetworkAP/%mAP@0.5/%mAP@0.5–0.9/%GFLOPs
Half-RipenedGreenFully-Ripened
SSD75.683.479.879.652.663.5
YOLOv5n85.182.988.785.657.64.5
YOLOv7-tiny8585.289.386.65813.2
DETR72.971.781.975.541.9100
Faster R-CNN86.384.787.986.358.4118.8
EfficientDet-D186.78587.886.558.46.1
YOLOv8n86.884.289.486.861.28.7
YOLOv9-t8485.386.385.260.510.7
YOLOv10n84.18389.185.458.98.4
YOLOv11n85.883.989.586.460.36.5
YOLOv11-HRS91.588.289.589.866.69.7
Table 11. Experimental results on the Strawberry-DS.
NetworkPrecision/%Recall/%mAP@0.5/%mAP@0.5–0.9/%
YOLOv1168.768.270.752.5
YOLOv11-HRS7268.374.255.1
Disclaimer/Publisher’s Note: The statements, opinions and data contained in all publications are solely those of the individual author(s) and contributor(s) and not of MDPI and/or the editor(s). MDPI and/or the editor(s) disclaim responsibility for any injury to people or property resulting from any ideas, methods, instructions or products referred to in the content.

