Article

Measuring the Sustainability of Nitrogen Fertilization in EU Agriculture: A New Index-Based Assessment in the Context of Sustainable Intensification

1
Division of Agricultural and Environmental Chemistry, Institute of Agriculture, Warsaw University of Life Sciences-SGGW, Nowoursynowska 159, 02-776 Warsaw, Poland
2
Institute of Economics and Finances, Warsaw University of Life Sciences-SGGW, 02-787 Warsaw, Poland
*
Author to whom correspondence should be addressed.
Agronomy 2025, 15(7), 1643; https://doi.org/10.3390/agronomy15071643
Submission received: 12 June 2025 / Revised: 3 July 2025 / Accepted: 4 July 2025 / Published: 6 July 2025
(This article belongs to the Special Issue Safe and Efficient Utilization of Water and Fertilizer in Crops)

Abstract

This study comprehensively evaluated nitrogen (N) management in 27 European countries from 1990 to 2021, utilizing the FAO and LUCAS databases. The EU countries were categorized into four groups based on their agricultural production intensities: low (L), medium–low (ML), medium–high (MH), and high (H). Additionally, a new Sustainable Nitrogen Management Indicator (SNMI) has been introduced to measure the sustainability of agricultural production. The analyses reveal significant variation in nitrogen fertilization intensity among EU countries, which correlates with differences in yield levels. Generally, higher fertilization leads to higher nutrient loss; however, the nitrogen losses per unit of yield show only minor differences between high- and low-intensity countries. From 1990 to 2021, a general improvement was observed in nitrogen management across all groups, as evidenced by a significant decline in the SNMI, indicating that agricultural production has become more sustainable. Notably, low-intensity countries showed the most significant improvement, with increased nitrogen input per hectare since the 1990s, demonstrating that moderate fertilization can enhance N use efficiency. In contrast, high-intensity countries saw decreased nitrogen inputs but still improved SNMI. These trends support the idea of sustainable intensification. The multidimensional SNMI comprehensively assesses eco-efficiency by highlighting environmental threats and production benefits. This paper demonstrates that SNMI is robust and easy to calculate using available datasets, and it can be implemented to assess nitrogen management efficiency at various scales.

1. Introduction

Nitrogen (N) is a crucial nutrient for crop production and is essential for feeding the rapidly growing global population. As a result, the demand for N inputs to cropland is bound to increase significantly due to the pressing need for more food production and higher crop yields [1]. The improper and excessive use of nitrogen in crop production can lead to pollution in adjacent water bodies. A reactive nitrogen molecule that has entered the environment can cause several effects during its lifetime, which is related to the complexity of the reactions occurring in the nitrogen cycle [2]. Nitrogen not taken up by plants may be lost from soil through the volatilization of ammonia or nitrogen oxides, and is also leached into groundwater, surface waters, and seas in the form of NH4+ and NO3 ions. All these compounds can harm nature and human health [3,4,5,6]. The application of organic and mineral fertilizers containing nitrogen can release gaseous forms of nitrogen (i.e., N2O, NH3) into the air, contributing to global warming and increasing photochemical smog, as well as leading to biodiversity loss [7,8]. Agriculture is responsible for 80–90% of ammonia emissions, a key precursor to the formation of PM2.5 aerosols in the atmosphere, which can harm the respiratory and cardiovascular systems [9]. The amount of atmospheric nitrogen deposition has increased significantly in this century [10], surpassing that of the preindustrial period by a factor of twenty. Moreover, ammonia causes acidification.
Nitrogen management is a significant environmental and policy concern across the European Union (EU), where agriculture is the most significant contributor to nitrogen losses. As highlighted by the European Environment Agency (EEA) [11], excessive nitrogen inputs from fertilizers and manure continue to pose a threat to ecosystems and biodiversity, particularly in regions with intensive livestock and crop production. Recognizing these challenges, the EU has introduced several initiatives aimed at promoting sustainable nutrient use, including the Nitrates Directive (91/676/EEC) [12], the Common Agricultural Policy (CAP) [13] conditionalities, and more recently, the Farm to Fork Strategy [14], which sets targets to reduce nutrient losses by at least 50% by 2030. In this context, the improvement in nitrogen use efficiency (NUE) and development of low-emission farming systems have become central to the EU’s environmental and food security agendas.
Managing nutrients, such as nitrogen, is essential for sustainable development but can be challenging [15]. With the constant growth of the global population, there is a pressing need for increased efforts to ensure sustainable agricultural production. All United Nations member states adopted the 2030 Agenda for Sustainable Development in 2015 [16]. Among the 17 goals of the agenda, one (SDG2) focuses on ending hunger, achieving food security, improving nutrition, and promoting sustainable agriculture. This means that agricultural systems worldwide must become more productive while minimizing the negative environmental impact of production inputs. In practice, achieving this goal will be challenging. Some countries and institutions within the European Union are promoting agricultural production solutions involving extensive organic farming methods. While these methods may reduce environmental pressures, they may not be sufficient to meet the current challenges of maintaining global food security. An alternative approach could be the sustainable intensification of agriculture [17]. This concept is manifested by increasing the volume of industrial input per unit of production while enhancing their efficiency and mitigating adverse environmental effects [18]. The assessment and quantification of the sustainable intensification of agriculture pose significant challenges due to its multifaceted nature and the potential trade-offs associated with it [19]. Despite these challenges, developing effective strategies to measure and evaluate sustainable intensification is imperative, as this is critical to achieving long-term sustainability and resilience in agricultural systems. Nitrogen plays a crucial role in food production and has significant environmental implications for its biogeochemical cycle, making it the most extensively studied nutrient [20]. To assess the agro-environmental sustainability of agricultural systems, three key performance indicators are commonly used: N output, which refers to nitrogen yield and represents the system’s productivity; N surplus, calculated as the difference between nitrogen input and nitrogen output, which indicates potential environmental risks; and nitrogen use efficiency (NUE), defined as the ratio of nitrogen output to nitrogen input [21]. These indicators collectively provide an integrated perspective on the sustainability of agricultural practices. However, measuring sustainable intensification in agriculture should involve an approach that considers both agronomic practices and their environmental impact, as well as the productivity of agriculture. It is a dynamic process that strives for balance across these interconnected dimensions. It might be measured by comparing the crop production or economic value added to the sum of environmental pressures caused, such as greenhouse gas emissions, nutrient depletion or surplus, soil erosion, and biodiversity loss [17]. The practical implementation of the proposed approach presents several challenges, particularly in estimating environmental effects. This requires access to quantitative data that can be used for accurate and reliable assessments. The research aimed to compare the sustainability of nitrogen management across EU countries, utilizing a new indicator, i.e., the Sustainable Nitrogen Management Indicator (SNMI), to provide an integrated approach to nitrogen use efficiency (NUE) and agricultural productivity, in line with the concept of sustainable intensification.

2. Materials and Methods

2.1. The Nitrogen Management Database

Nitrogen management in European crop production systems from 1990 to 2021 was assessed using data from the Food and Agriculture Organization’s Corporate Statistical Database (FAOSTAT), which is included in the section “Cropland Nutrient Balance” [22]. Key N management terms included N synthetic fertilizer input, N manure input, N atmospheric deposition, N biological fixation, N output (N in harvested crops), and N loss (N loss to the environment through leaching and volatilization) [22].

2.2. The Conventional Nitrogen Management Indicators

The efficiency of nitrogen use (NUE) is defined as follows (Equation (1)):
NUE = N   O u t p u t N   I n p u t × 100 %
where
  • NOutput—N removed from soil with crop yield (kg ha−1) [22];
  • NInput—the sum of N inputs in kg ha−1: N in synthetic fertilizers, N in manure applied to soils, N atmospheric deposition, and biological fixation [22].
The nitrogen balance (SBN) in kg N ha−1 y−1 was calculated according to Equation (2):
SBN = NInput − NOutput

2.3. Measurement of Land Productivity

Data on the harvest of all crops collected in the FAOSTAT database under the “Cropland” category were utilized to determine yield levels. Yield levels, defined as production per hectare, were calculated by dividing the total yields for each country in a given year by the total area of “Cropland”. This method ensured that the results were comparable, as the yields and nitrogen balances referred to the same area. However, comparing production and productivity across different crop categories posed a challenge, as the FAOSTAT database contained information on the harvests of 122 plants with varying physicochemical characteristics. To standardize the harvest volumes of various crops, we used the concept of cereal units (CU) [23]. CU primarily considers the nutritional value of these products. The benchmark for this system is the energy value of 100 kg of barley, with 1 CU equivalent to 100 kg of this grain. Each kilogram of barley provides 12.56 megajoules of metabolizable energy [24]. By knowing the energy values of individual plant species, we can express their yields in grain units. To make the harvests of different species comparable, we converted their mass from kilograms into grain units, using the established conversion factor based on the energy value of 100 kg of harvested crop (plant product) as the starting point for calculations. Information on the energy values of individual crops was obtained from the Food Composition Tables [25]. While this approach has certain limitations, given that many factors can influence the nutritional usefulness of individual agricultural products, it is reasonable to assume that food’s energy value plays a critical role in the context of food security.
The cereal unit (CU) was calculated according to Equation (3):
CU = Y c   ×   f c   ×   10
where
  • Yc—crop yield [18];
  • fc—conversion factor [25].

2.4. The Sustainable Nitrogen Management Indicators (SNMI)

The Sustainable Nitrogen Management Indicator (SNMI) was calculated using Equation (4), which the authors proposed.
SNMI = ( 1 C U n ) 2 + ( 1 N U E n ) 2
where
  • CUn—normalized cereal unit;
  • NUEn—normalized nitrogen use efficiency.
When   NUE Then   NUE n NUE   <   0.49 NUE n = 0 NUE   0.50 0.89 NUE n = 1 NUE   >   0.90 NUE n = N U E 0.9
When   CU : Then   CU n : CU   <   30.00 CU n = 0 CU   30.01 45.00 CU n = C U 45 CU   >   45.01 CU n = 1
Equation (4) is based on the concept of Euclidean distance, which helps assess how far a country’s current position is from the ideal point for nitrogen use efficiency (NUE) and crop yield [15]. During the normalization of NUE, it was assumed that the optimal NUE values fall within the range of 0.5 to 0.89 [26]. According to the EU Nitrogen Expert Panel, values that are too high in NUE (>0.90) create a risk of excessive soil depletion, while values below 0.49 pose a high risk of nutrients being released into the environment [26]. Similarly, in the case of yield, normalization consisted in changing the range of variability, assuming that average yields below 30 CU are too low from the point of view of sustainability, as they increase the risk of food shortages and move humanity away from achieving the UN Sustainable Goal “zero hunger”. According to Silva et al. [27], the average actual yield is approximately 70–75% of the potential yield. Therefore, it can be assumed that European agriculture has the potential to obtain a yield of 45 CU per ha, and this value was used as a reference level. SNMI values close to zero indicate that NUE and CU are reaching their optimal level.

2.5. Delimitation of the EU Countries

The 27 European countries were categorized into four groups based on fertilization intensity, using the quartile principle as the classification criterion. The key variable for classification was the total nitrogen fertilization level per hectare of utilized agricultural area (UAA). High-Intensity (H-High) Group: This group, representing the upper quartile, includes 25% of the countries with the highest fertilization levels. The countries in this group are Belgium, the Netherlands, Ireland, Malta, Germany, Denmark, and Slovenia. Medium–High-Intensity (MH-MediumHigh) Group: This group includes countries with an average fertilization level that falls between the upper quartile and the median. The countries in this category are France, Croatia, Austria, Luxembourg, Czechia, Italy, and Cyprus. Medium–Low-Intensity (ML-MediumLow) Group: This group consists of countries with an average fertilization level that lies between the median and the lower quartile. The countries included here are Slovakia, Poland, Sweden, Hungary, Spain, Portugal, and Greece. Low-Intensity (L-Low) Group: The final group, representing those below the lower quartile, includes countries with the lowest average fertilization intensity. This group comprises Bulgaria, Lithuania, Romania, Finland, Estonia, and Latvia.

2.6. The Topsoil Nitrogen (N) Content of European Countries

The topsoil nitrogen (N) content is based on the Land Use and Cover Area frame Survey (LUCAS) dataset. The LUCAS topsoil dataset used in this work was made available by the European Commission through the European Soil Data Centre managed by the Joint Research Centre (JRC): http://esdac.jrc.ec.europa.eu/ (accessed on 20 May 2025) [28,29,30,31].

2.7. Statistical Analysis

Linear regression analysis was performed to evaluate the relationship between soil nitrogen content and fertilization intensity (a) and nitrogen balance surplus (b). The correlation coefficients were calculated at a significance level of p < 0.05. All calculations were conducted using Statistica PL 13.3 software (Tulsa, OK, USA). The figures were generated using the R Project for Statistical Computing (version 4.5.1) and RStudio 2025.05.1 Build 513.

3. Results and Discussion

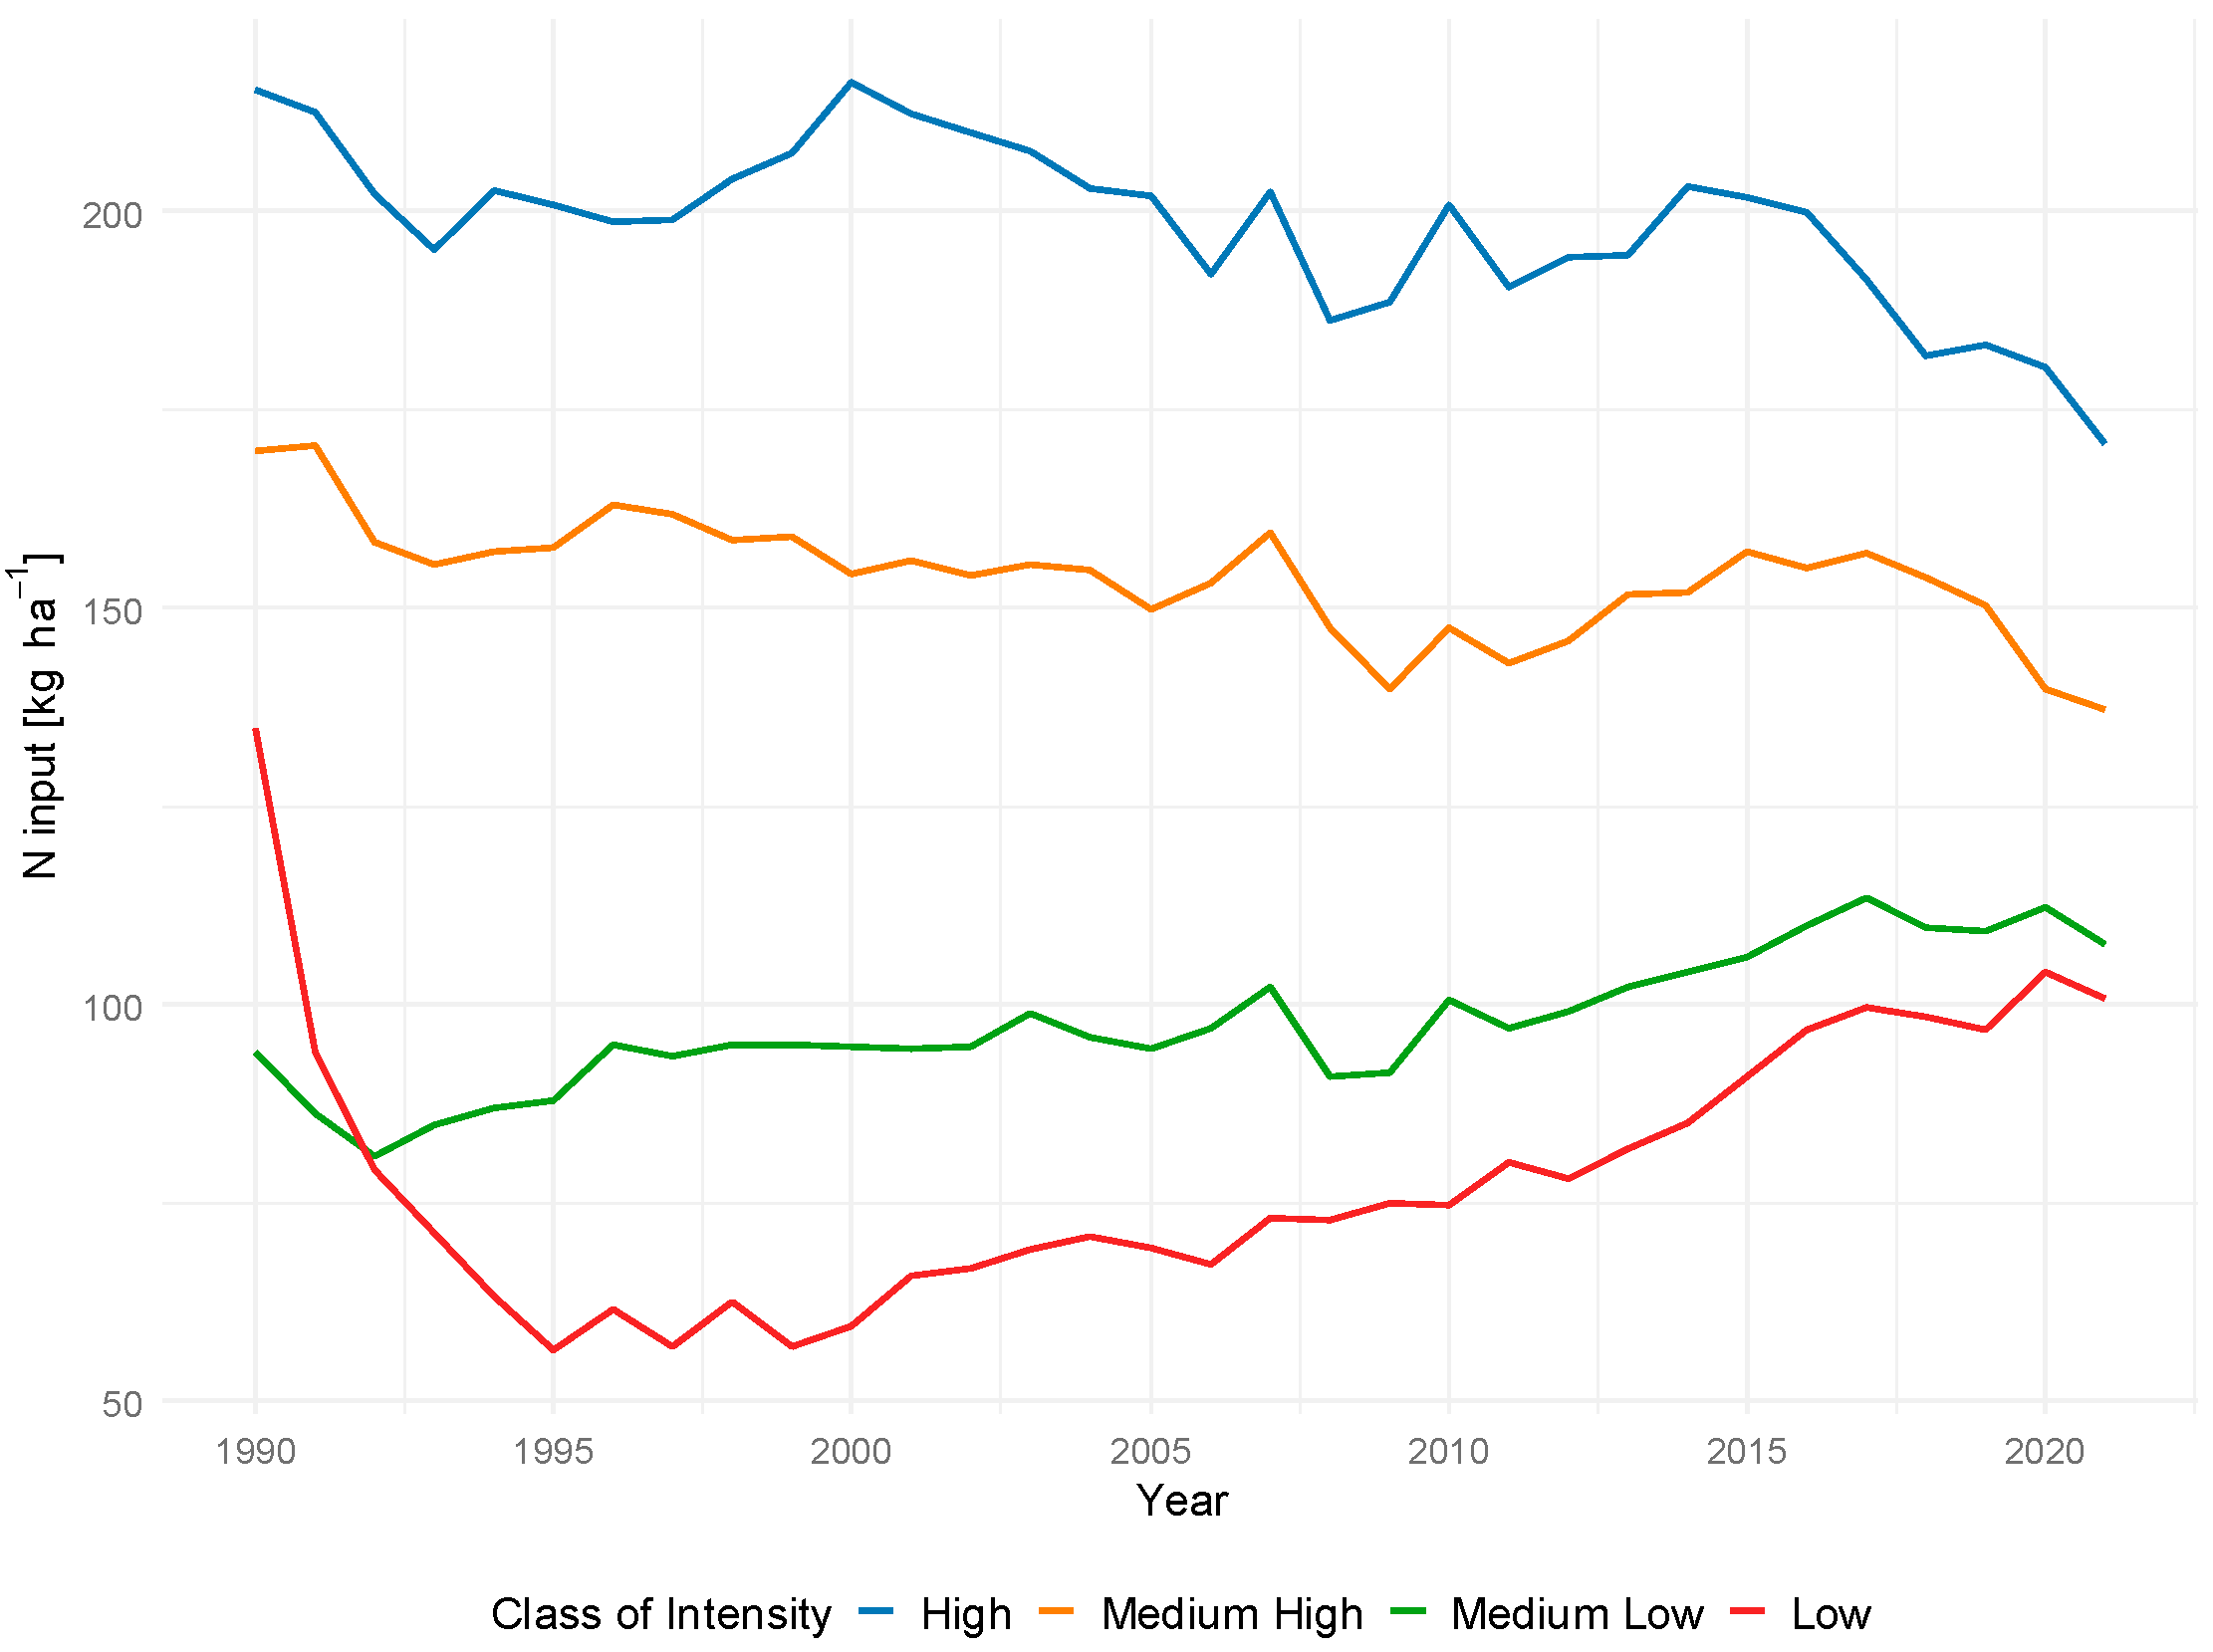
3.1. Trends in European Scale in Nitrogen Use and Productivity

The average total N input between 1990 and 2021 in countries with high (H)-, medium–high (MH)-, medium–low (ML)-, and low (L)-intensity levels was 201.9, 154.1, 83.5, and 78.4 kg N ha−1 year−1, respectively (Table 1). The highest N fertilization was found in Belgium (380 kg N ha−1 year−1), Ireland (320 kg N ha−1 year−1), and the Netherlands (298 kg N ha−1 year−1). The lowest nitrogen doses were used in Latvia, Finland, and Estonia. In light of the changes in agricultural conditions observed in the farming sector during the period under review, it is essential to consider not only the average multi-year values but also the trends in these changes. It is evident that, particularly in recent years, a convergence process has been occurring. This process is characterized by an increase in fertilization intensity among countries with the lowest levels of intensity, while simultaneously, a reduction in fertilization doses is observed in countries with higher levels of intensity (Figure 1).
Nitrogen is a vital macronutrient that plays a crucial role in maximizing crop yield. However, according to Umar et al. [32], the agronomic efficiency of nitrogen (N) introduced into soil through fertilizer is only 30–35%. The remaining nitrogen released into the environment can have negative effects. In light of the numerous challenges associated with agricultural production, a critical question emerges: which agricultural production model is the most sustainable? This model should ensure the provision of adequate food quantities with necessary quality attributes while generating minimal environmental impact. One potential approach to addressing this inquiry is to analyze countries that successfully produce substantial quantities of food with comparatively low environmental burdens. Since the primary function of agriculture is food production, it is essential to evaluate production efficiency based on the yield of crops obtained under specific conditions. In this context, the productivity of crop production might be expressed in cereal units (CUs) and CU per kg of N inputs [23,24].
When comparing the average yields expressed in CUs between countries from different intensity groups (Table 1), it is evident that the most intensive group had average yields more than twice as high as those in the least intensive group (60 CU vs. 28 CU ha 1). It should be noted that nitrogen productivity, measured as yield increase expressed in CU per kg of nitrogen applied in fertilizers, was the highest in countries classified in group L (on average 0.36 CU per kg N) and was about 16% higher compared to countries with the highest intensity (Table 2). The correlation coefficient between N input in kg per 1 ha and productivity measured by the number of CUs per 1 kg of N input was −0.54. This observation may relate to the concept of diminishing marginal productivity, which suggests that after a certain optimal level of fertilization is exceeded, the increase in production from each additional input unit becomes progressively smaller. Beyond a certain yield level, the production process becomes increasingly input-intensive. In specific agricultural conditions, these relationships may be influenced by various factors. Nevertheless, based on aggregated statistical data, we can only identify general trends while being aware of outliers. The high correlation coefficient of 0.74 between yield levels and nitrogen inputs is worth noting. Generally, countries with higher fertilization levels tend to achieve higher average yields, which is crucial for ensuring food security. Findings that crop yields’ dependence on N inputs indicate that intensive agriculture might better fulfill the supply function. However, intensive agriculture is often perceived negatively due to its contribution to environmental pollution [33]. Although total nitrogen losses vary considerably between countries and management systems, the differences in N loss intensity per cereal unit appear relatively small (Figure 2). This can be attributed to the compensatory relationship between input levels and productivity. In high-input systems, such as those in Northwestern Europe, elevated N losses are often accompanied by high crop yields, which dilute the loss per yield unit. In contrast, low-input systems tend to have reduced N inputs and losses, but also produce lower yields, resulting in a comparable N loss intensity per unit of output. The analysis reveals that countries classified in the low-intensity (L) group had the lowest nutrient losses per cultivation unit (CU) (Figure 2). From 1990 to 2021, these countries had an average nitrogen loss of 1.09 kg N per CU. In contrast, high-intensity (H) countries reported an average nitrogen loss of 1.39 kg N per CU during the same period. Notably, nutrient losses per CU declined across all groups. While the differences in this trend among the various groups are relatively minor, the most significant reduction—40%—was observed in the low-intensity countries. This group had the highest losses at the start of the analysis period (2.17 kg N per CU) (Figure 2).

3.2. Nitrogen Balance and Soil Nutrient Status

The nitrogen balance (SBN) helps to identify potential nutrient losses into the environment, increasing its pollution or building soil nutrient status [34,35]. The soil nutrient status can affect plant growth. Their levels can change over time due to soil type, pH level, and fertilizer use [36]. Understanding and managing soil nutrient status is important for sustainable agriculture and maximizing crop yield. Excessive crop uptake of N can lead to soil depletion. However, N overfertilization may lead to environmental contamination [37]. Between 1990 and 2021, crop production in various European countries resulted in substantial nitrogen (N) surpluses (Table 2). Between 2011 and 2021, on average, SBN was 97.8 kg N ha−1 in the group with the highest fertilization intensity and 37.5 kg N ha−1 in the group with the lowest fertilization intensity (Table 2). The data indicate that, on average, from 1990 to 2021, countries with high levels of fertilization recorded a 29% decrease in surpluses of SBN. Countries with medium-high fertilization intensity saw a 19% reduction, while those with low fertilization intensity had a decrease of 5.9%. In contrast, countries within the medium–low-fertilization category recorded an increase of approximately 7% in SBN (Table 2).
Due to the dynamic nature of nitrogen transformation in the soil, there is a lack of quantitative documentation regarding the accumulation of total nitrogen (N) stocks in soil [38,39]. It is assumed that the N surplus from fertilizers can be a proxy for environmental emissions, such as NO3-N leaching and NH3 and N2O volatilization. However, if N storage is not considered, it may lead to biased conclusions [40]. Intensive nitrogen fertilization enhances crop biomass and yield, and increases soil nitrogen content by increasing the amount of residue deposited in the soil. Nitrogen can accumulate in the soil when the processes of N mineralization and immobilization are balanced. This occurs when the carbon-to-nitrogen ratio is approximately 10:1. However, soil carbon sequestration, which occurs at a wider C:N ratio, promotes the stabilization of soil nitrogen [41]. According to van Groenigen et al. [42], soil C sequestration would consume a significant fraction of the N surplus. Assuming an average C:N ratio of 12:1 in soil organic matter [43], each kilogram of fixed carbon will retain approximately 1/12 kg of N in the soil [42]. To reduce the increasing levels of atmospheric CO2, an initiative was launched to achieve a yearly 0.4% increase in global agricultural soil organic carbon (SOC) stocks. To implement this initiative on all agricultural soils, a SOC sequestration rate of 1200 Tg C yr−1 would be required, which in turn would necessitate 100 Tg N yr−1 [43]. Therefore, it can be concluded that the surplus of nitrogen remaining in the soil (expressed by SBN) may play a significant role in mitigating global warming. However, nitrogen retention efficiency may be limited by the low potential for soil organic carbon (SOC) accumulation in Central European soils [44].
According to the LUCAS database, the lowest average nitrogen content in soil was in Finland (1.56 g N kg−1), while the highest was in Ireland, i.e., 3.61 g N kg−1 [28,29,30,31]. Soil nutrient content is a quantitative and qualitative feature of the soil. Nutrients accumulated in the soil (also as a result of fertilization) are made available to plants due to biotic and abiotic processes. Their intensity, as mentioned, depends on various factors. A significant relationship was found between the average input of N in mineral and organic fertilizers into the soil from 1990 to 2021 and the total soil abundance of N in 27 European countries (Figure 3). This build-up of soil N can serve as a future source of nutrients for crops or C sequestration. Although very high, NInput and SBN found in Belgium and the Netherlands did not build up significantly greater soil N stocks. In these countries, the soil nutrient content in N was 2.35 and 2.24 g N kg−1, respectively [28,29,30,31]. Several interconnected factors can explain this phenomenon. Agricultural soils in these countries often have historically high nitrogen levels due to decades of intensive management. Consequently, many of these soils are nearing nitrogen saturation, a state in which additional nitrogen accumulation becomes limited. In such conditions, surplus nitrogen is more likely to be lost through leaching, volatilization, or denitrification rather than being retained in the soil [45]. Additionally, in parts of the Netherlands and northern Belgium, the most common soil types—specifically sandy and loamy soils—have low organic matter content and a limited cation exchange capacity [28,29,30,31]. This reduces their ability to retain nitrogen over time.

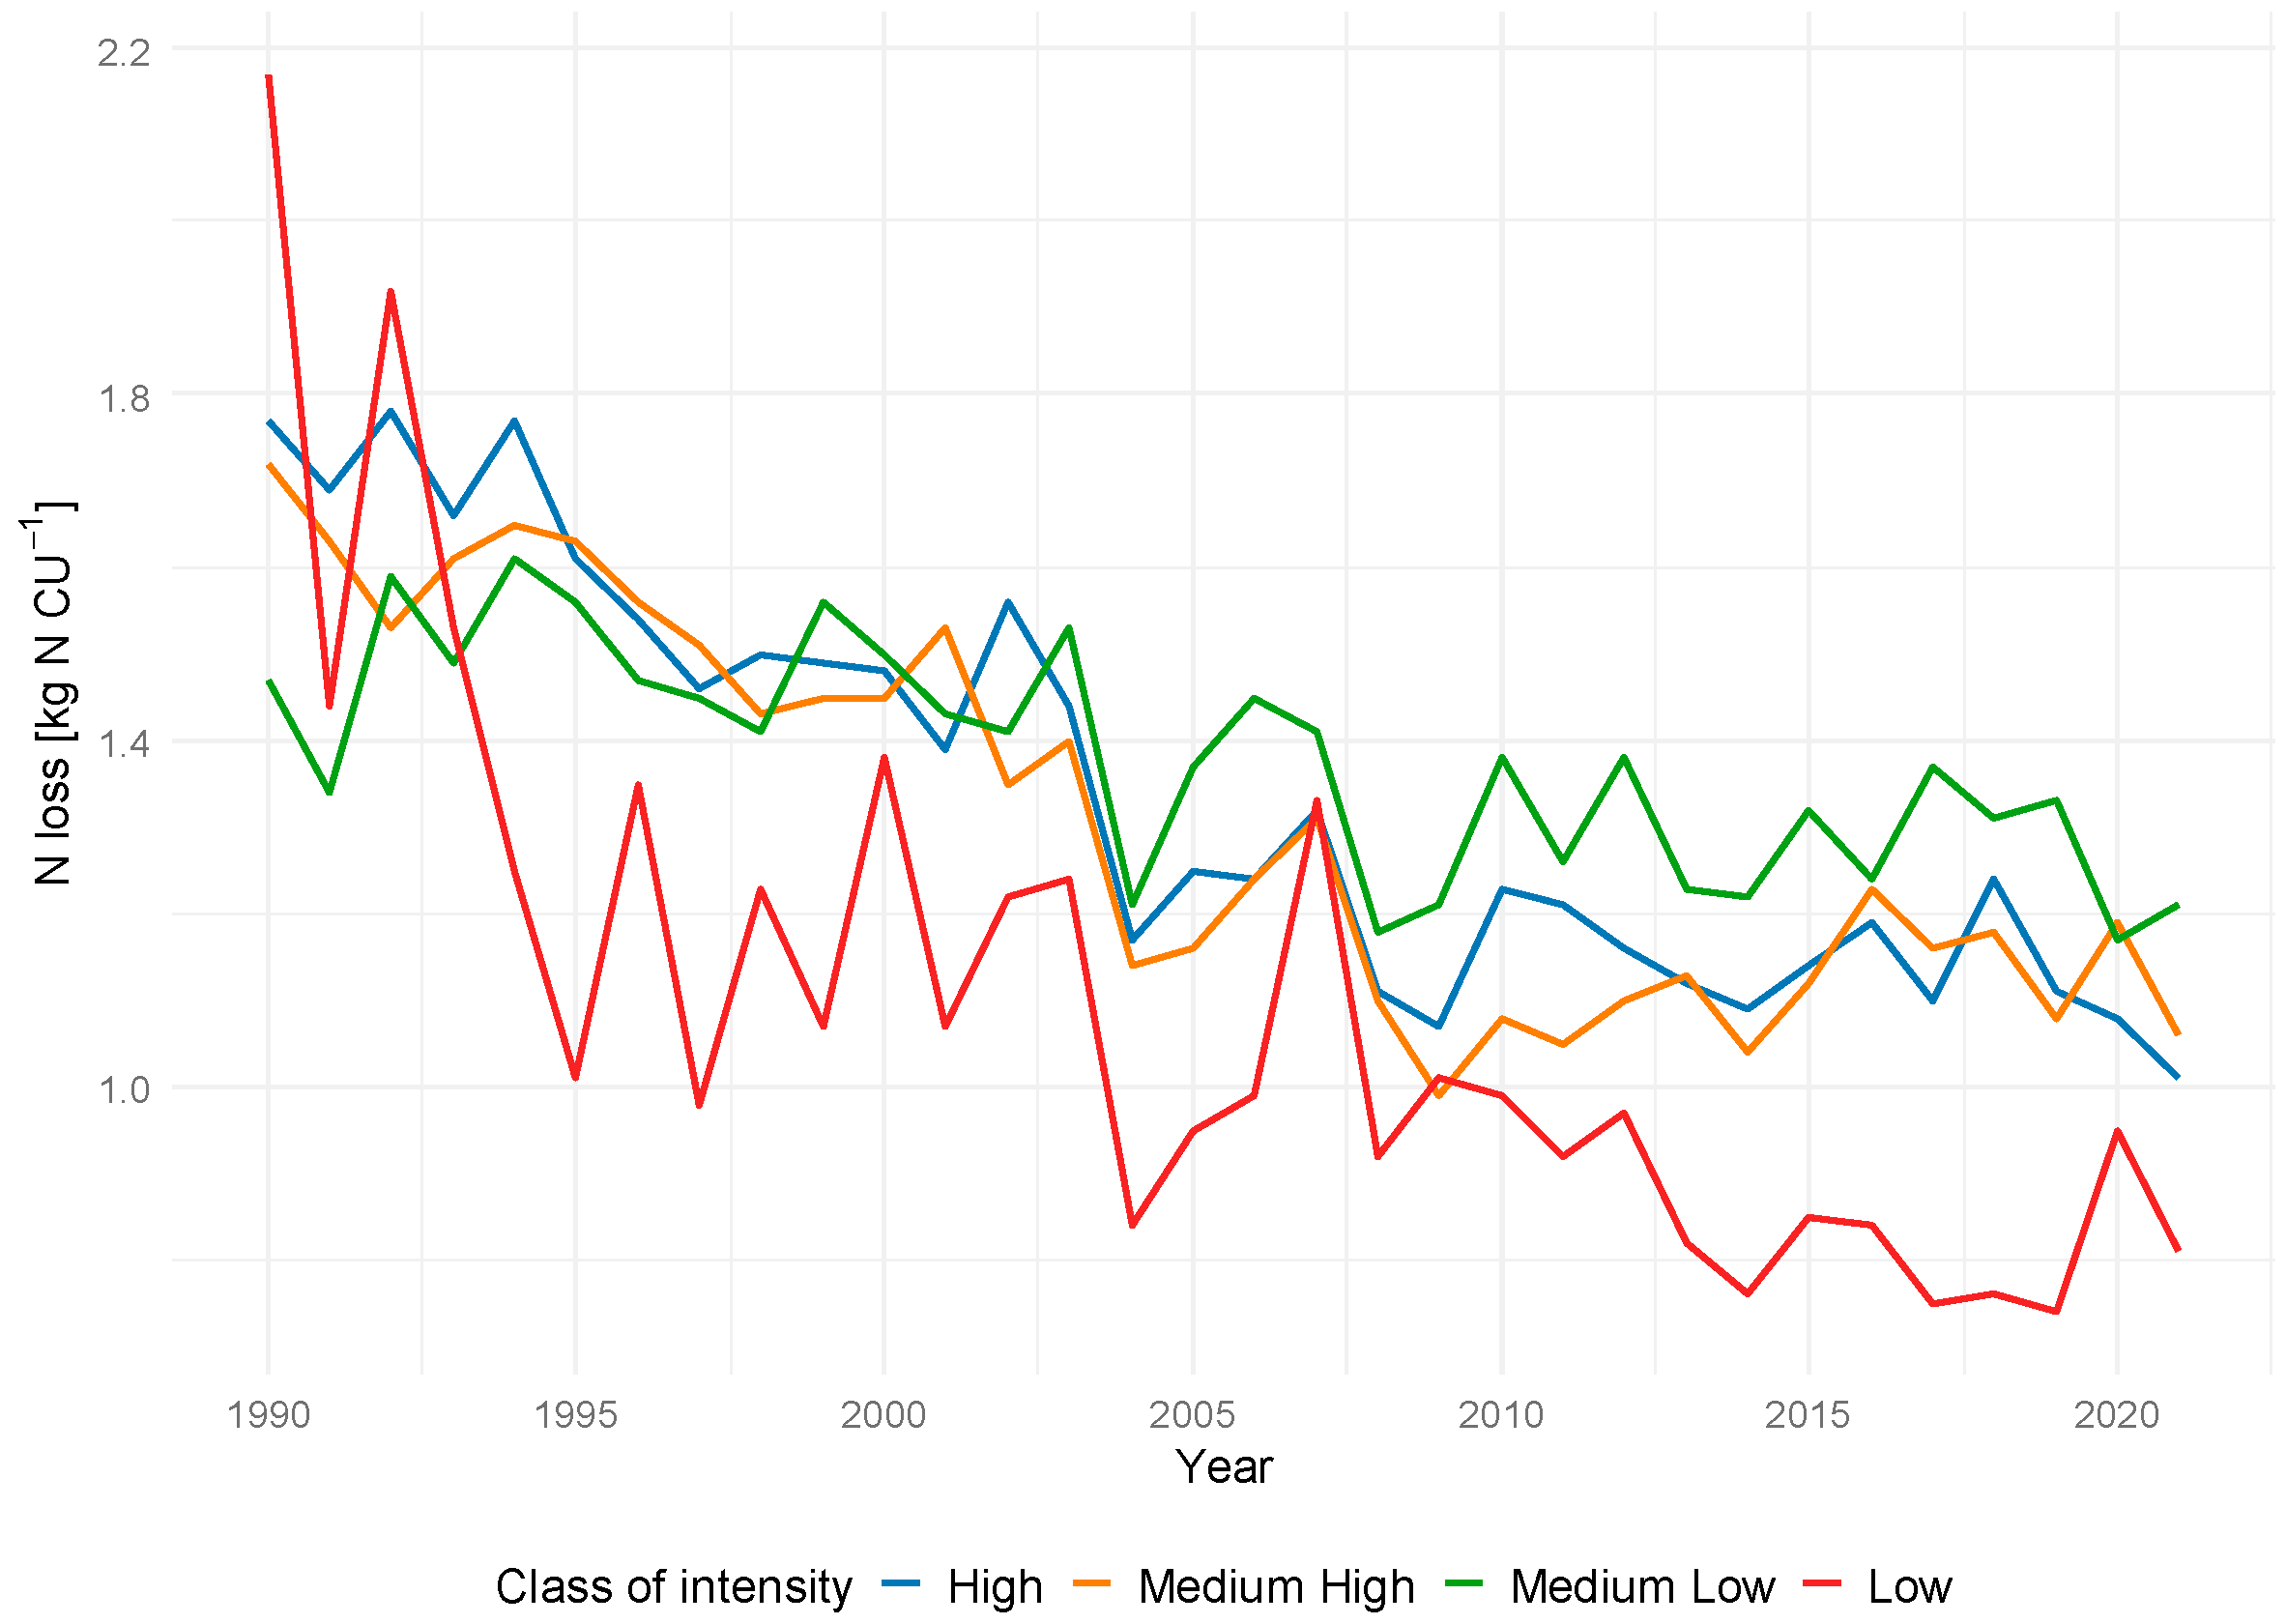
3.3. Long-Term Trends in Changes in Nitrogen Use Efficiency

The assessment of plant nutrient management in agriculture should consider not only the nutrient balance but also the output-to-input ratio, which measures fertilization efficiency. It was observed that, despite significant differences in the level of N balance (SBN) between groups differentiated by intensity level, the differences in the average level of NUE indicators are relatively small (Table 2). This means that, on average, countries with high production intensity and the highest balance surpluses (kg N) are characterized by only slightly worse efficiency of nitrogen use. During the last analyzed period, i.e., 2011–2021, the average NUE for countries with the highest fertilization intensity is 51%, and for countries with the lowest fertilization intensity, it is 59.3% (Table 2). A much greater differentiation can be observed in the case of individual countries, as NUE ranges from 15.8% (Cyprus) to 63.6% (Romania) (Table 2). Generally, it can be observed that there is a negative relationship between the level of nitrogen inputs and NUE, with a correlation coefficient of −0.52. This means that, on average, higher inputs are associated with lower efficiency (NUE), although this does not apply to all cases. Many factors can modify this general observation. Among others, NUE is influenced by the spatial and temporal scope of fertilizer application. Greater NUE with lower nitrogen input from fertilizers can be explained at the genetic level. The roots of the plants absorb the nitrogen from fertilizer in two forms: NH4+-N and NO3-N. These results from different transport systems: the ammonium transporter (AMT) and the nitrate transporter (NRT) [46,47]. In low nitrogen conditions, an increase in the expression of a gene responsible for nitrate transport (e.g., TaNRT2.1, OsNRT1.1b [48,49] and ammonium transport (e.g., OsAMT1.1 [50]) is observed. The overexpression of these genes enhances nitrogen uptake, shoot biomass, and grain yield, resulting in improved NUE.
NUE calculations for a single season can provide valuable information for specific crops and sites, but they offer limited insight into crop rotation, the cropping system, or the N cycle over time [51]. The research conducted covers a 31-year period from 1990 to 2021, allowing us to observe long-term trends in N management in agriculture (Figure 4). The analysis of changes in nitrogen use efficiency (NUE) indicates that, in general, across all distinguished groups during the analyzed period, there was an improvement in the efficiency of using nutrients supplied to the soil. On average, NUE in all groups’ last year of observation exceeded 50%. It was higher in the group of the least intensive farms. According to the EU Nitrogen Expert Panel [26], nitrogen use efficiency (NUE) should range between 50% and 90%. The relatively high NUE in countries from group L may falsely indicate proper fertilizer management. In this case, the doses of nutrients in the fertilizers may be insufficient to meet the plants’ nutritional requirements, causing them to draw nutrients from the soil, which leads to systematic depletion. The issue of nutrient mining and loss of soil fertility in countries characterized by low agricultural intensification has been frequently discussed [52]. These countries have some of the lowest crop yields globally and require improvement by adopting better fertilization practices, including increasing fertilizer doses [53]. This means that NUE is an insufficient measure for evaluating the sustainability of fertilization.

3.4. The Sustainable Nitrogen Management Indicator (SNMI)

The NUE indicator is often criticized in the literature for its effectiveness in assessing nitrogen management efficiency [54]. As noted by Cassman and Grassini [55] and Kanter et al. [56], new indicators that can quantitatively express the ability to meet food production and sustainability goals simultaneously need to be developed. In light of this, this paper presents a new Sustainable Nitrogen Management Indicator (SNMI) (Equation (4)). Using the SNMI enhances the nitrogen management assessment process, making it more suitable for achieving complex sustainability goals. This indicator effectively merges key aspects of two critical dimensions: the environmental perspective, as highlighted by the NUE components, and the socio-economic perspective, which emphasizes the importance of crop yields in addressing the increasing global food demands. The indicator geometrically assesses how far a country’s current position is in terms of normalized NUE and normalized crop yield from an ideal point on a two-dimensional graph. Specifically, the indicator is defined as the Euclidean distance from this ideal target for NUE and crop yield. Consequently, a lower value of the Sustainable Nutrient Management Indicator (SNMI) indicates that fertilization is more sustainable [15].
Figure 5 shows the average SNMI value for 27 EU countries across three analyzed periods: 1990–2000, 2001–2010, and 2011–2021. The SNMI has improved noticeably, reflected by a decrease from the first decade to the last (i.e., from 1.16 in 1990–2000 to 0.54 in 2011–2021). The improvement in SNMI has primarily resulted from a 1.4-fold increase in crop yields and a 1.2-fold increase in NUE. However, this overall advancement in nitrogen management has shown significant variability among the European Union countries and groups analyzed.
Over the 31 years analyzed, the most significant decrease in the SNMI value occurred in the H and L country groups, with declines of approximately 83.2% and 71.9%, respectively. In the MH and ML groups, the SNMI values decreased by 59.2% and 29.3%, respectively. SNMI has remained constant in Belgium, Ireland, the Netherlands (countries in the H group), Cyprus (a country in the MH group), and Portugal and Spain (countries in the ML group) over the past 31 years (Figure 5). In the listed countries with the highest intensity (H), the SNMI has maintained a value of 1.0 for 31 years. This is attributed to high yields exceeding 50 CU ha−1 and a consistently low NUE. Meanwhile, in Cyprus, Portugal, and Spain, despite having a low NUE, crop yields have remained consistently low over the years. Germany has made the most significant progress in nitrogen management sustainability, as indicated by its SNMI of 0.0. The country successfully reduced nitrogen application from 205.4 kg N per hectare in 1990 to 145.5 kg N per hectare in 2021, which increased nitrogen use efficiency (NUE) from 37% to 62%, resulting in crop yields increasing from 45 to 63 CU per hectare. Significant improvements in sustainable nitrogen management were also observed in Denmark (group H), Austria, France, Croatia (group MH), Hungary, Slovakia, and Poland (group ML). All countries in the L group showed significant improvements in nitrogen management sustainability. This trend was mainly due to the 2-fold higher crop yields observed in these countries from 2011 to 2021 compared to the previous analyzed periods. Specifically, crop yields in Lithuania and Latvia were more than three times higher from 2011 to 2021 compared to those between 1990 and 2000 (Table 1). In countries from the lower intensity groups, increasing nitrogen fertilizer doses can result in a clear improvement in SNMI (i.e., a decrease) (Figure 1 and Figure 5). During the analysed period, an increase in the SNMI value was observed only in Malta (Figure 5).

4. Conclusions

The analyses have revealed significant variation in the intensity of nitrogen fertilization among European countries, resulting in differences in yield levels. Generally, higher levels of fertilization are linked to higher yields. A comparison of data on nitrogen losses per unit of yield shows that the differences between countries with high and low fertilization intensity are relatively minor. Furthermore, from 1990 to 2021, a clear reduction in losses of fertilizer components was observed across all intensity groups within Europe. As a result, there has been an improvement in nitrogen use efficiency (NUE) in all groups of countries. The most significant improvement, compared to the beginning of the observed period, was noted on average in countries classified in the low fertilization intensity group (L). It is also worth mentioning that this group has recorded an increase in nitrogen input per hectare since the 1990s, indicating that moderate intensification of fertilization can enhance efficiency. Conversely, countries with high fertilization intensity (H) also saw an increase in NUE, despite a decrease in nitrogen inputs over the same period. These trends—rising nitrogen input in low-intensity countries and decreasing input in high-intensity countries—support the concept of sustainable intensification. The observed changes in nitrogen inputs and NUE suggest that a process of sustainable intensification has taken place in EU agriculture during the analyzed period. This conclusion is further supported by the significant decrease in the Sustainable Nitrogen Management Indicator (SNMI) between the first decade (1991–2000) and the last decade (2010–2021) of the analysis. This decline indicates that agricultural production has become more sustainable in both high- and low-intensity countries. In the low-fertilization group, increased fertilizer levels have led to better utilization of soil potential, resulting in improved efficiency and sustainability. In contrast, for countries in the high-fertilization group, the reduction in SNMI can be attributed to a decrease in fertilizer use. Germany has made the most significant progress in nitrogen management sustainability, as indicated by its SNMI of 0.0. The country successfully reduced nitrogen application from 205.4 kg N per hectare in 1990 to 145.5 kg N per hectare in 2021, which increased nitrogen use efficiency (NUE) from 37% to 62%, resulting in crop yields increasing from 45 to 63 CU per hectare. Significant improvements in sustainable nitrogen management were also observed in Denmark, Austria, France, Hungary, Slovakia, Bulgaria, and Latvia. It is important to note that the SNMI indices are multidimensional. Unlike simple sustainability indices, they can express potential environmental threats and production benefits with a single number, making them particularly valuable for eco-efficiency assessments.

Author Contributions

Conceptualization, M.S., A.W., and T.S.; methodology, M.S., A.W., P.S., and T.S.; validation, M.S., P.S., and T.S.; formal analysis, A.W.; investigation, M.S., P.S., and T.S.; resources, M.S., P.S., and A.W.; data curation, T.S.; writing—original draft preparation, M.S. and P.S.; writing—review and editing, A.W. and T.S.; visualization, M.S. and P.S.; supervision, T.S.; project administration, A.W.; funding acquisition, A.W. All authors have read and agreed to the published version of the manuscript.

Funding

This research was funded by the National Science Centre, Poland, Grant number UMO-2021/43/B/HS4/02367, “Sustainable intensification in agriculture as a way to the eco-efficient farming sector in the context of upcoming social and environmental challenges”.

Data Availability Statement

The data described in this study are available on request from the corresponding author.

Conflicts of Interest

The authors declare no conflicts of interest.

Abbreviations

The following abbreviations are used in this manuscript:
NUENitrogen Use Efficiency
SBNThe nitrogen balance
SNMISustainable Nitrogen Management Indicator
CUCereal unit
HHigh-intensity group
MHMedium–high-intensity group
MLMedium–low-intensity group
LLow-intensity group

References

  1. Lu, C.; Tian, H. Global nitrogen and phosphorus fertilizer use for agriculture production in the past half century: Shifted hot spots and nutrient imbalance. Earth Syst. Sci. Data 2017, 9, 181–192. [Google Scholar] [CrossRef]
  2. Erisman, J.W.; Sutton, M.A.; Galloway, J.; Klimont, Z.; Winiwarter, W. How a Century of Ammonia Synthesis Changed the World. Nat. Geosci. 2008, 1, 636–639. [Google Scholar] [CrossRef]
  3. Bouwman, A.F.; Beusen, A.H.W.; Lassaletta, L.; van Apeldoorn, D.F.; van Grinsven, H.J.M.; Zhang, J.; van Ittersum, M.K. Lessons from Temporal and Spatial Patterns in Global Use of N and P Fertilizer on Cropland. Sci. Rep. 2017, 7, 40366. [Google Scholar] [CrossRef] [PubMed]
  4. Erisman, J.W.; Van, G.H.; Grizzetti, B.; Bouraoui, F.; Powlson, D.; Sutton, M.A.; Bleeker, A.; Reis, S. The European Nitrogen Problem in a Global Perspective. In The European Nitrogen Assessment; Cambridge University Press: Cambridge, UK, 2011; pp. 9–31. Available online: https://publications.jrc.ec.europa.eu/repository/handle/JRC57902 (accessed on 10 May 2025).
  5. McKague, K.; Reid, K.; Simpson, H. Environmental Impacts of Nitrogen Use in Agriculture. In Factsheet; Ministry of Agriculture, Food and Rural Affairs: Guelph, ON, Canada, 2005; pp. 05–073. Available online: https://www.researchgate.net/publication/265236853 (accessed on 10 May 2025).
  6. UNEP; WHRC. Reactive Nitrogen in the Environment: Too Much or Too Little of a Good Thing; United Nations Environment Programme: Paris, France, 2007. [Google Scholar]
  7. Hamzeh, R.; Xu, X. Technology selection methods and applications in manufacturing: A review from 1990 to 2017. Comput. Ind. Eng. 2019, 138, 106123. [Google Scholar] [CrossRef]
  8. Rockström, J.; Steffen, W.; Noone, K.; Persson, Å.; Chapin, F.S.; Lambin, E.F.; Lenton, T.M.; Scheffer, M.; Folke, C.; Schellnhuber, H.J.; et al. A safe operating space for humanity. Nature 2009, 461, 472–475. [Google Scholar] [CrossRef] [PubMed]
  9. Pinder, R.W.; Adams, P.J.; Pandis, S.N. Ammonia Emission Controls as a Cost-Effective Strategy for Reducing Atmospheric Particulate Matter in the Eastern United States. Environ. Sci. Tech. 2007, 41, 380–386. [Google Scholar] [CrossRef]
  10. Xu, P.; Li, G.; Zheng, Y.; Fung, J.C.H.; Chen, A.; Zeng, Z.; Shen, H.; Hu, M.; Mao, J.; Zheng, Y.; et al. Fertilizer management for global ammonia emission reduction. Nature 2024, 626, 792–798. [Google Scholar] [CrossRef]
  11. European Environment Agency (EEA). Water and Agriculture: Towards Sustainable Solutions; EEA Report No. 17/2020; European Environment Agency: Copenhagen, Denmark, 2021; Available online: https://www.eea.europa.eu/publications/water-and-agriculture-towards-sustainable-solutions (accessed on 1 July 2025).
  12. European Commission. Council Directive 91/676/EEC of 12 December 1991 Concerning the Protection of Waters against Pollution Caused by Nitrates from Agricultural Sources. Off. J. Eur. Communities 1991, L375, 1–8. [Google Scholar]
  13. European Commission. The Common Agricultural Policy at a Glance; European Commission: Brussels, Belgium, 2021; Available online: https://agriculture.ec.europa.eu/cap-overview_en (accessed on 1 July 2025).
  14. European Commission. Farm to Fork Strategy: For a Fair, Healthy and Environmentally-Friendly Food System; European Commission: Brussels, Belgium, 2020; Available online: https://food.ec.europa.eu/horizontal-topics/farm-fork-strategy_en (accessed on 1 July 2025).
  15. Zhang, X.; Wang, Y.; Schulte-Uebbing, L.; De Vries, W.; Zou, T.; Davidson, E.A. Sustainable Nitrogen Management Index: Definition, Global Assessment and Potential Improvements. Front. Agr. Sci. Eng. 2024, 9, 356–368. [Google Scholar] [CrossRef]
  16. United Nations General Assembly. Resolution 70/1, Transforming Our World: The 2030 Agenda for Sustainable Development; United Nations: New York, NY, USA, 2015; Available online: https://www.un.org/en/development/desa/population/migration/generalassembly/docs/globalcompact/A_RES_70_1_E.pdf (accessed on 12 February 2025).
  17. Heidenreich, A.; Grovermann, C.; Kadzere, I.; Egyir, I.S.; Muriuki, A.; Bandanaa, J.; Clottey, J.; Ndungu, J.; Blockeel, J.; Muller, A.; et al. Sustainable intensification pathways in Sub-Saharan Africa: Assessing eco-efficiency of smallholder perennial cash crop production. Agric. Syst. 2022, 195, 103304. [Google Scholar] [CrossRef]
  18. Mouratiadou, I.; Latka, C.; van der Hilst, F.; Müller, C.; Berges, R.; Bodirsky, B.L.; Ewert, F.; Faye, B.; Heckelei, T.; Hoffmann, M.; et al. Quantifying sustainable intensification of agriculture: The contribution of metrics and modelling. Eco. Indic. 2021, 129, 107870. [Google Scholar] [CrossRef]
  19. Weltin, M.; Zasada, I.; Piorr, A.; Debolini, M.; Geniaux, G.; Moreno Perez, O.; Scherer, L.; Tudela Marco, L.; Schulp, C.J.E. Conceptualising fields of action for sustainable intensification—A systematic literature review and application to regional case studies. Agric. Ecosyst. Environ. 2018, 257, 68–80. [Google Scholar] [CrossRef]
  20. Sutton, M.A.; Howard, C.M.; Kanter, D.R.; Lassaletta, L.; Móring, A.; Raghuram, N.; Read, N. The Nitrogen Decade: Mobilizing Global Action on Nitrogen to 2030 and Beyond. One Earth 2021, 4, 10–14. [Google Scholar] [CrossRef]
  21. Quemada, M.; Lassaletta, L. Fertilizer dependency: A new indicator for assessing the sustainability of agrosystems beyond nitrogen use efficiency. Agron. Sustain. Dev. 2024, 44, 44. [Google Scholar] [CrossRef]
  22. FAO. Cropland Nutrient Balance. FAOSTAT. 2024. Available online: https://www.fao.org/faostat/en/#data/ESB (accessed on 10 February 2025).
  23. Brankatschk, G.; Finkbeiner, M. Application of the Cereal Unit in a new allocation procedure for agricultural life cycle assessments. J. Clean. Prod. 2014, 73, 72–79. [Google Scholar] [CrossRef]
  24. Volanti, M.; Savarino, F.O.; Passarini, F.; Vassura, I.; Grosso, S.A. Environmental analysis of crop rotations through the application of the Cereal Unit approach. Ecol. Indic. 2021, 121, 107199. [Google Scholar] [CrossRef]
  25. FAO. Food Composition Tables. FAOSTAT. 2024. Available online: https://www.fao.org/4/X9892E/X9892e05.htm (accessed on 10 February 2025).
  26. EU Nitrogen Expert Panel. Nitrogen Use Efficiency (NUE)—An Indicator for the Utilization of Nitrogen in Agriculture and Food Systems; EU Nitrogen Expert Panel: Wageningen, The Netherlands, 2015. [Google Scholar]
  27. Silva, J.V.; Tenreiro, T.R.; Spätjens, L.; Anten, N.P.R.; van Ittersum, M.K.; Reidsma, P. Can big data explain yield variability and water productivity in intensive cropping systems? Field Crops Res. 2020, 255, 107828. [Google Scholar] [CrossRef]
  28. Joint Research Centre, Institute for Environment and Sustainability. LUCAS Topsoil Survey: Methodology, Data and Results; Jones, A., Montanarella, L., Tóth, G., Eds.; Publications Office of the European Union: Luxembourg, 2013. [Google Scholar]
  29. Ballabio, C.; Lugato, E.; Fernández-Ugalde, O.; Orgiazzi, A.; Jones, A.; Borrelli, P.; Montanarella, L.; Panagos, P. Mapping LUCAS topsoil chemical properties at European scale using Gaussian process regression. Geoderma 2019, 355, 113912. [Google Scholar] [CrossRef]
  30. Panagos, P.; Montanarella, L.; Barbero, M.; Schneegans, A.; Aguglia, L.; Jones, A. Soil priorities in the European Union. Geoderma Reg. 2022, 29, e00510. [Google Scholar] [CrossRef]
  31. Panagos, P.; Van Liedekerke, M.; Jones, A.; Montanarella, L. European Soil Data Centre: Response to European policy support and public data requirements. Land Use Policy 2012, 29, 329–338. [Google Scholar] [CrossRef]
  32. Umar, W.; Ayub, M.A.; Rehman, M.Z.U.; Ahmad, H.R.; Farooqi, Z.U.R.; Shahzad, A.; Rehman, U.; Mustafa, A.; Nadeem, M. Nitrogen and Phosphorus Use Efficiency in Agroecosystems. In Resources Use Efficiency in Agriculture; Ahmad, H.R., Hasanuzzaman, M., Eds.; Springer: Singapore, 2020; pp. 213–257. [Google Scholar]
  33. Riddick, S.; Ward, D.; Hess, P.; Mahowald, N.; Massad, R.; Holland, E. Estimate of changes in agricultural terrestrial nitrogen pathways and ammonia emissions from 1850 to present in the Community Earth System Model. Biogeosciences 2016, 13, 3397–3426. [Google Scholar] [CrossRef]
  34. Lassaletta, L.; Billen, G.; Grizzetti, B.; Anglade, J.; Garnier, J. 50 year trends in nitrogen use efficiency of world cropping systems: The relationship between yield and nitrogen input to cropland. Environ. Res. Lett. 2014, 9, 105011. [Google Scholar] [CrossRef]
  35. Sosulski, T.; Szara, E.; Stępień, W.; Rutkowska, B. The influence of mineral fertilization and legumes cultivation on the N2O soil emissions. Plant Soil Environ. 2015, 61, 529–536. [Google Scholar] [CrossRef]
  36. Szymańska, M.; Gubiec, W.; Smreczak, B.; Ukalska-Jaruga, A.; Sosulski, T. How Does Specialization in Agricultural Production Affect Soil Health? Agriculture 2024, 14, 424. [Google Scholar] [CrossRef]
  37. Sosulski, T.; Szara, E.; Stępień, W.; Szymańska, M.; Borowska-Komenda, M. Carbon and nitrogen leaching in long-term experiments and DOC/N-NO3- ratio in drainage water as an indicator of denitrification potential in different fertilization and crop rotation systems. Fresenius Environ. Bull. 2016, 25, 2813–2824. [Google Scholar]
  38. Rashid, M.A.; Bruun, S.; Styczen, M.E.; Borgen, S.K.; Hvid, S.K.; Jensen, L.S. Adequacy of nitrogen-based indicators for assessment of cropping system performance: A modelling study of Danish scenarios. Sci. Total Environ. 2022, 842, 156927. [Google Scholar] [CrossRef]
  39. Sosulski, T.; Szara, E.; Szymańska, M.; Stępień, W.; Rutkowska, B.; Szulc, W. Soil N2O emissions under conventional tillage conditions and from forest soil. Soil Till. Res. 2019, 190, 86–91. [Google Scholar] [CrossRef]
  40. Jensen, J.L.; Beucher, A.M.; Eriksen, J. Soil organic C and N stock changes in grass-clover leys: Effect of grassland proportion and organic fertilizer. Geoderma 2022, 424, 116022. [Google Scholar] [CrossRef]
  41. Lin, H.-C.; Huber, J.A.; Gerl, G.; Hülsbergen, K.-J. Nitrogen balances and nitrogen-use efficiency of different organic and conventional farming systems. Nutr. Cycling Agroecosyst. 2016, 105, 1–23. [Google Scholar] [CrossRef]
  42. van Groenigen, J.W.; van Kessel, C.; Hungate, B.A.; Oenema, O.; Powlson, D.S.; van Groenigen, K.J. Sequestering Soil Organic Carbon: A Nitrogen Dilemma. Environ Sci. Technol. 2017, 51, 4738–4739. [Google Scholar] [CrossRef]
  43. Batjes, N.H. Total carbon and nitrogen in the soils of the world. Eur. J. Soil Sci. 1996, 47, 151–163. [Google Scholar] [CrossRef]
  44. Sosulski, T.; Srivastava, A.K.; Ahrends, H.E.; Smreczak, B.; Szymańska, M. Carbon Storage Potential and Carbon Dioxide Emissions from Mineral-Fertilized and Manured Soil. Appl. Sci. 2023, 13, 4620. [Google Scholar] [CrossRef]
  45. Oenema, O.; Boers, P.C.M.; van Eerdt, M.M.; Fraters, B.; van der Meer, H.G.; Roest, C.W.J.; Schröder, J.J.; Willems, W.J. Leaching of nitrate from agriculture to groundwater: The effect of policies and measures in the Netherlands. Environ. Pollut. 1998, 102 (Suppl. S1), 471–478. [Google Scholar] [CrossRef]
  46. Aluko, O.O.; Kant, S.; Adedire, O.M.; Li, C.; Yuan, G.; Liu, H.; Wang, Q. Unlocking the potentials of nitrate transporters at improving plant nitrogen use efficiency. Front. Plant Sci. 2023, 14, 1074839. [Google Scholar] [CrossRef]
  47. Hao, D.-L.; Zhou, J.-Y.; Yang, S.-Y.; Qi, W.; Yang, K.-J.; Su, Y.-H. Function and Regulation of Ammonium Transporters in Plants. Int. J. Mol. Sci. 2020, 21, 3557. [Google Scholar] [CrossRef]
  48. Fan, X.; Feng, H.; Tan, Y.; Xu, Y.; Miao, Q.; Xu, G. A putative 6-transmembrane nitrate transporter OsNRT1.1b plays a key role in rice under low nitrogen. J. Integr. Plant Biol. 2016, 58, 590–599. [Google Scholar] [CrossRef]
  49. Xiong, H.; Guo, H.; Zhou, C.; Guo, X.; Xie, Y.; Zhao, L.; Gu, J.; Zhao, S.; Ding, Y.; Liu, L. A combined association mapping and t-test analysis of SNP loci and candidate genes involving in resistance to low nitrogen traits by a wheat mutant population. PLoS ONE 2019, 14, e0211492. [Google Scholar] [CrossRef] [PubMed]
  50. Ranathunge, K.; El-kereamy, A.; Gidda, S.; Bi, Y.-M.; Rothstein, S.J. AMT1;1 transgenic rice plants with enhanced NH4+ permeability show superior growth and higher yield under optimal and suboptimal NH4+ conditions. J. Exp. Bot. 2014, 65, 965–979. [Google Scholar] [CrossRef]
  51. Congreves, K.A.; Otchere, O.; Ferland, D.; Farzadfar, S.; Williams, S.; Arcand, M.M. Nitrogen Use Efficiency Definitions of Today and Tomorrow. Front. Plant Sci. 2021, 12, 637108. [Google Scholar] [CrossRef]
  52. Liu, J.; You, L.; Amini, M.; Obersteiner, M.; Herrero, M.; Zehnder, A.J.; Yang, H. A High-Resolution Assessment on Global Nitrogen Flows in Cropland. Proc. Natl. Acad. Sci. USA 2010, 107, 8035–8040. [Google Scholar] [CrossRef]
  53. Vanlauwe, B.; Wendt, J.; Giller, K.E.; Corbeels, M.; Gerard, B.; Nolte, C. A Fourth Principle Is Required to Define Conservation Agriculture in Sub-Saharan Africa: The Appropriate Use of Fertilizer to Enhance Crop Productivity. Field Crops Res. 2014, 155, 10–13. [Google Scholar] [CrossRef]
  54. Tamagno, S.; Maaz, T.M.; van Kessel, C.; Linquist, B.A.; Ladha, J.K.; Lundy, M.E.; Maureira, F.; Pittelkow, C.M. Critical assessment of nitrogen use efficiency indicators: Bridging new and old paradigms to improve sustainable nitrogen management. Eur. J. Agron. 2024, 159, 127231. [Google Scholar] [CrossRef]
  55. Cassman, K.G.; Grassini, P. A global perspective on sustainable intensification research. Nat. Sustain. 2020, 3, 262–268. [Google Scholar] [CrossRef]
  56. Kanter, D.R.; Chodos, O.; Nordland, O.; Rutigliano, M.; Winiwarter, W. Gaps and opportunities in nitrogen pollution policies around the world. Nat. Sustain. 2020, 3, 956–963. [Google Scholar] [CrossRef]
Figure 1. Nitrogen fertilization level [kg N ha−1] by year and groups of countries with different intensity levels. Source: own elaboration.
Agronomy 15 01643 g001
Figure 2. Nitrogen loss (leaching and volatilization) in relation to the production [kg N CU−1] by groups of countries with different intensities of production. Source: own elaboration.
Agronomy 15 01643 g002
Figure 3. Relationship between soil content of N and fertilization intensity (a) and nitrogen balance surplus (b) (source: own elaboration).
Agronomy 15 01643 g003
Figure 4. Nitrogen use efficiency (NUE) by groups of European countries with different intensities of production (source: own elaboration).
Agronomy 15 01643 g004
Figure 5. Sustainable Nitrogen Management Indicators in groups of European countries in 1990–2021 (source: own elaboration).
Agronomy 15 01643 g005
Table 1. Crop yields (in CU ha−1) and nitrogen input and outputs (in kg N ha−1) in European countries.
CountriesClass of
Intensity *
Yield [CU ha−1]N Input [kg ha−1]N Output [kg ha−1]
1990–20002001–20102011–20211990–20002001–20102011–20211990–20002001–20102011–2021
BelgiumH54.765.567.7385.9374.9383.892.298.599.8
DenmarkH50.271.480.2213.7168.7167.287.787.488.2
GermanyH49.661.464.8196.6185.2171.883.896.094.6
IrelandH63.662.371.8355.4286.2316.8104.994.1105.6
MaltaH26.132.722.0254.2270.5208.053.575.452.1
NetherlandsH55.455.558.8375.3266.0252.283.174.675.5
SloveniaH32.537.536.5185.7183.1125.746.950.448.8
Average **H50.462.366.6223.0200.6190.184.893.092.4
AustriaMH44.751.155.4170.4148.1155.272.375.182.5
CroatiaMH31.843.949.2138.9193.1170.047.570.282.7
CyprusMH17.814.211.2128.0108.7110.627.721.917.4
CzechiaMH30.240.348.3120.7141.7179.652.067.982.4
FranceMH45.953.656.5182.3166.8156.478.680.882.7
ItalyMH28.838.239.6132.4123.4123.949.650.150.5
LuxembourgMH32.443.841.6139.6142.6137.754.161.855.9
Average **MH38.847.550.8160.3151.8149.466.370.073.5
GreeceML26.426.925.7111.883.983.152.051.750.4
HungaryML32.639.948.590.495.3116.149.558.772.3
PolandML27.031.339.486.5104.6120.545.251.564.2
PortugalML10.311.313.583.188.1101.316.417.619.2
SlovakiaML29.134.343.696.1101.6128.848.254.570.5
SpainML17.020.823.686.692.897.826.931.635.7
SwedenML26.133.639.5112.199.9105.744.744.950.0
Average **ML22.727.031.990.496.1106.437.542.649.8
BulgariaL20.927.541.980.680.5117.433.242.864.1
EstoniaL9.124.232.948.065.091.114.828.647.3
FinlandL20.828.528.459.468.263.634.337.434.2
LatviaL11.729.341.451.557.381.819.329.751.7
LithuaniaL12.128.241.056.6100.4107.920.638.060.0
RomaniaL22.724.837.775.863.586.633.135.955.4
Average **L19.526.337.969.870.592.029.937.054.5
* H—high intensity, MH—medium–high intensity, ML—medium–low intensity, L—low intensity. ** The averages in this table are calculated from the sum of products of the individual variables for the country divided by the sum of the country’s area (source: own elaboration).
Table 2. The nitrogen balance, use efficiency, and productivity in European countries.
CountriesClass of
Intensity *
SBN [kg ha−1 y−1]NUE [%]N productivity [CU kg N−1]
1990–20002001–20102011–20211990–20002001–20102011–20211990–20002001–20102011–2021
BelgiumH293.7276.4283.923.926.326.00.140.170.18
DenmarkH126.081.379.041.252.052.90.230.420.48
GermanyH112.989.277.242.652.055.20.250.330.38
IrelandH250.5192.1211.129.733.033.60.180.220.23
MaltaH200.8195.1156.020.728.025.00.100.120.11
NetherlandsH292.2191.4176.722.328.130.00.150.210.23
SloveniaH138.8132.776.825.628.638.90.180.200.29
Average **H138.1107.697.839.848.351.00.240.320.37
AustriaMH98.173.072.842.550.853.10.260.350.36
CroatiaMH91.3122.987.234.837.348.80.230.230.29
CyprusMH100.386.893.321.420.215.80.140.130.10
CzechiaMH68.773.897.343.348.046.10.250.280.27
FranceMH103.786.073.743.148.652.90.250.320.36
ItalyMH82.873.373.437.540.740.80.220.310.32
LuxembourgMH85.580.881.838.743.440.70.230.310.30
Average **MH94.181.775.841.045.948.80.240.310.34
GreeceML59.832.232.847.361.860.90.240.320.31
HungaryML40.936.643.955.461.962.50.360.420.42
PolandML41.353.156.352.349.553.40.310.300.33
PortugalML66.770.582.219.820.118.90.120.130.13
SlovakiaML47.947.158.350.153.854.60.300.340.34
SpainML59.661.362.231.134.236.50.200.220.24
SwedenML67.355.055.640.045.047.30.230.340.37
Average **ML52.953.656.741.444.346.30.250.280.30
BulgariaL47.437.753.344.753.454.80.260.340.36
EstoniaL33.236.443.831.544.051.60.190.370.36
FinlandL25.030.929.459.754.953.70.350.420.45
LatviaL32.227.630.138.951.863.00.230.510.51
LithuaniaL36.062.447.836.937.955.30.210.280.38
RomaniaL42.727.531.246.856.863.60.300.390.44
Average **L39.833.537.545.353.459.30.280.380.42
* H—high intensity, MH—medium–high intensity, ML—medium–low intensity, L—low intensity. ** The averages in this table are calculated from the sum of products of the individual variables for the country divided by the sum of the country’s area. Source: own elaboration.
Disclaimer/Publisher’s Note: The statements, opinions and data contained in all publications are solely those of the individual author(s) and contributor(s) and not of MDPI and/or the editor(s). MDPI and/or the editor(s) disclaim responsibility for any injury to people or property resulting from any ideas, methods, instructions or products referred to in the content.

