Article

Barley Leaf Area and Leaf Growth Rates Are Maximized during the Pre-Anthesis Phase

by
Ahmad M. Alqudah
and
Thorsten Schnurbusch
*
HEISENBERG-Research Group Plant Architecture, Leibniz Institute of Plant Genetics and Crop Plant Research (IPK), Corrensstraße. 3, OT Gatersleben D-06466 Stadt Seeland, Germany
*
Author to whom correspondence should be addressed.
Agronomy 2015, 5(2), 107-129; https://doi.org/10.3390/agronomy5020107
Submission received: 15 November 2014 / Revised: 5 April 2015 / Accepted: 14 April 2015 / Published: 17 April 2015

Abstract

:
Leaf developmental traits are an important component of crop breeding in small-grain cereals. Surprisingly, little is known about the genetic basis for the differences in barley (Hordeum vulgare L.) leaf development. The two barley row-type classes, i.e., two- and six-rowed, show clear-cut differences in leaf development. To quantify these differences and to measure the genetic component of the phenotypic variance for the leaf developmental differences in both row-type classes we investigated 32 representative spring barley accessions (14 two- and 18 six-rowed accessions) under three independent growth conditions. Leaf mass area is lower in plants grown under greenhouse (GH) conditions due to fewer, smaller, and lighter leaf blades per main culm compared to pot- and soil-grown field plants. Larger and heavier leaf blades of six-rowed barley correlate with higher main culm spike grain yield, spike dry weight, and harvest index; however, smaller leaf area (LA) in two-rowed barley can be attributed to more spikes, tillers, and biological yield (aboveground parts). In general, leaf growth rate was significantly higher between awn primordium and tipping stages. Moderate to very high broad-sense heritabilities (0.67–0.90) were found under all growth conditions, indicating that these traits are predominantly genetically controlled. In addition, our data suggests that GH conditions are suitable for studying leaf developmental traits. Our results also demonstrated that LA impacts single plant yield and can be reconsidered in future breeding programs. Six-rowed spike 1 (Vrs1) is the major determinate of barley row-types, the differences in leaf development between two- and six-rowed barleys may be attributed to the regulation of Vrs1 in these two classes, which needs further testing.

1. Introduction

Leaf traits and leaf architecture are important for crop adaptation to environmental conditions. Leaf area (LA) is considered to be an indicator of crop growth, development, and plant health, and has a strong relationship with leaf dry weight (LDW) in wheat and barley [1]. LA and LDW are major factors that affect the growth rate through leaf thickness and/or density [2]. Leaf mass area (LMA) reflects the relationship between them, and varies greatly between species due to nutrient and moisture availability, light intensity, and temperature [2,3]. LMA is considered to be a key trait in plant growth [4], plant breeding [5], ecology, agronomy [3], and influences crops’ responses to different growth conditions through changes in LA or/and LDW. For example, Witkowski and Lamont [2] reported that leaves are smaller and heavier (higher LMA) under nutrient/moisture stress conditions. The variation in LA and related traits of eight two-rowed barleys was previously attributed to growth habits, which are dependent on vernalization requirements and photoperiod [6]. Thus, studying the variation of LA and related traits in both barley row-type classes at specific developmental stages independent of growth habit could help to understand the genetic constitution of these traits. Leaf growth rate traits reflect the responses of winter barley to the environment and their relationship with phyllochron [7]. Moreover, leaf traits are important for competing against pests, for example, rapid early growth, droopy leaves, high LMA, leaf size, and leaf number can markedly reduce weed growth in rice and wheat [8,9].
During the 1960s and 1970s, several studies proposed to enhance grain yield potential by changing individual traits in cereal breeding programs following an ‘ideotype’ concept where LA was one of the targeted traits [10,11]. Leaf attributes for ideotype breeding were based on successful rice breeding programs that produced smaller, narrower, shorter, and more erect leaves to adapt with wide-range of environments [10,12]. However, during twenty years of cereal breeding, many difficulties and challenges were encountered in selecting for leaf traits. In barley breeding programs, progress in demonstrating that leaf traits improve yield was slow [13]. Rasmusson [13] reported that the major challenge for obtaining smaller leaves with larger spikes in wheat and barley was due to insufficient heritability of LA.
Many studies have highlighted that large LA is a valuable trait in breeding programs for improving yield [6,13,14,15,16]. For example, genetic material from Indonesian tropical japonica rice landraces was used to create broader leaves in a breeding program for New Plant Type (NPT) to improve grain yields [17,18]. Moreover, another study reported that large LA (flag leaf) in two contrasting barley populations resulted in higher grain yield because of higher photosynthetic rates under field conditions [19]. LA and its position in the canopy have an effect on the relationship between cereal growth, yield, and photosynthesis [20] and maximizing photosynthetic rate could be achieved by expanding LA in rice and wheat [21,22]. Manipulating LA to increase grain yield would be beneficial for future breeding programs [13,23]; however, LA manipulation in barley did not succeed because of low heritability which did not permit effective genetic manipulation.
Evaluation of crop growth rates across a wide-range of environments has been studied and related to LA index and radiation use efficiency (RUE), such as in evaluating barley under drought stress conditions [24]. This relationship is considered to be a key factor for determining crop yield and biomass due to a favorable canopy architecture associated with increase in leaf photosynthetic capacity (photosynthetic rate per unit LA) particularly in wheat and barley dwarfing genotypes [25,26]. However, RUE is crop-dependent, highly influenced by environments and simulated models, therefore the genetic progress for this trait is difficult to attain [27,28] because it seems more complex to be improved than other leaf traits.
The barley spike is composed of rachis nodes and each node possesses three spikelets (one central and two lateral spikelets) [29]. In six-rowed barley, the three spikelets are fertile (one central and two lateral), whereas only the central spikelet is fertile in two-rowed barley [30]. Two-rowed wild barley (H. vulgare ssp. spontaneum) is the progenitor of cultivated barley (H. vulgare L. ssp. vulgare) [31] and six-rowed barley was domesticated thereafter [32]. Thus, the barley spike can appear in two major forms: two-rowed and six-rowed. Differences between two- and six-rowed barley have been extensively investigated in the context of spike-related traits [30]. The barley row-type is predominantly regulated by the SIX-ROWED SPIKE 1 (Vrs1) gene [33], and it was found that loss of function Vrs1 leads to fully developed, fertile lateral spikelets in the six-rowed barleys; whereas wild-type, functional Vrs1 results in infertile lateral spikelets and a two-rowed phenotype.
To better understand the barley leaf developmental traits, also to quantify and characterize the leaf developmental differences (LA and related traits) between two- and six-rowed barleys, we examined a representative set of 32 spring barley accessions (14 two- and 18 six-rowed) under greenhouse (GH) and field conditions (pot and soil) during pre-anthesis developmental stages. In addition, we also intended to identify the extent to which leaf traits are genetically controlled under these conditions; and compare leaf performance traits and their correlation with single plant grain yield. Understanding leaf growth rates during pre-anthesis developmental stages could give important cues for the biological mechanism underlying leaf development. Studying leaf developmental traits under GH and field conditions also provides a broad overview on the genetic components of leaf phenotypic variation between barley row-type classes.

2. Results

2.1. Correlation Analysis between Thermal Time and Leaf Trait

Thermal time was used to identify the correlation between the required temperatures to reach developmental stages with leaf traits in both row-type classes. Moreover, the correlation analysis for these traits with data obtained from both GH- and field-grown plants were used to verify the impact of growth conditions on studied leaf traits. Correlations between leaf traits and thermal time at developmental stages were generally higher under field conditions (pots and soil; Table 1). For leaf number per main culm, the correlation was stronger in the GH at the awn primordium (AP) stage (r = 0.34 and 0.69 for two- and six-rowed, respectively). Thereafter, the field-grown plants (pots and field) showed the strongest correlation with heading (HD) stage (r ≥ 0.45) for both row-type classes, while it had a negative correlation for GH-grown plants. The strong correlation for GH-grown plants at the AP could be attributed to the vernalization period for GH seedlings (4 weeks), which leads to the production of more leaf primordia and consequently more leaves and a delayed AP stage. There was no clear trend between other leaf traits (i.e., leaf fresh weight (LFW), LDW, LA, and LMA) and growing degree-days (°C × D, GDD) under different growth conditions. However, in most cases, plants grown under field conditions (pots and soil) showed higher correlations than GH-grown plants. For example, the correlation for LA at the tipping (TIP) stage in six-rowed types was approximately r = 0.79 and 0.70 for pots and soil, respectively, whereas the correlation was negative in GH-grown plants (Table 1) for both row-type classes at the same stage. In general, larger LA in six-rowed barley had stronger correlation with thermal time at later developmental stages (TIP and HD), suggesting that larger LA in six-rowed types requires longer growth duration to become observable. In some cases, GH plants had stronger correlations for LDW than field-grown plants. In two-rowed barley at the anther extrusion (AE) stage, the correlation with LDW for GH-grown plants was r = 0.65 and r = 0.30 and 0.39 for pot- and soil-grown field plants, respectively. These findings could be due to phenotypic variation of thermal time (early or late development) between accessions to reach the stages.

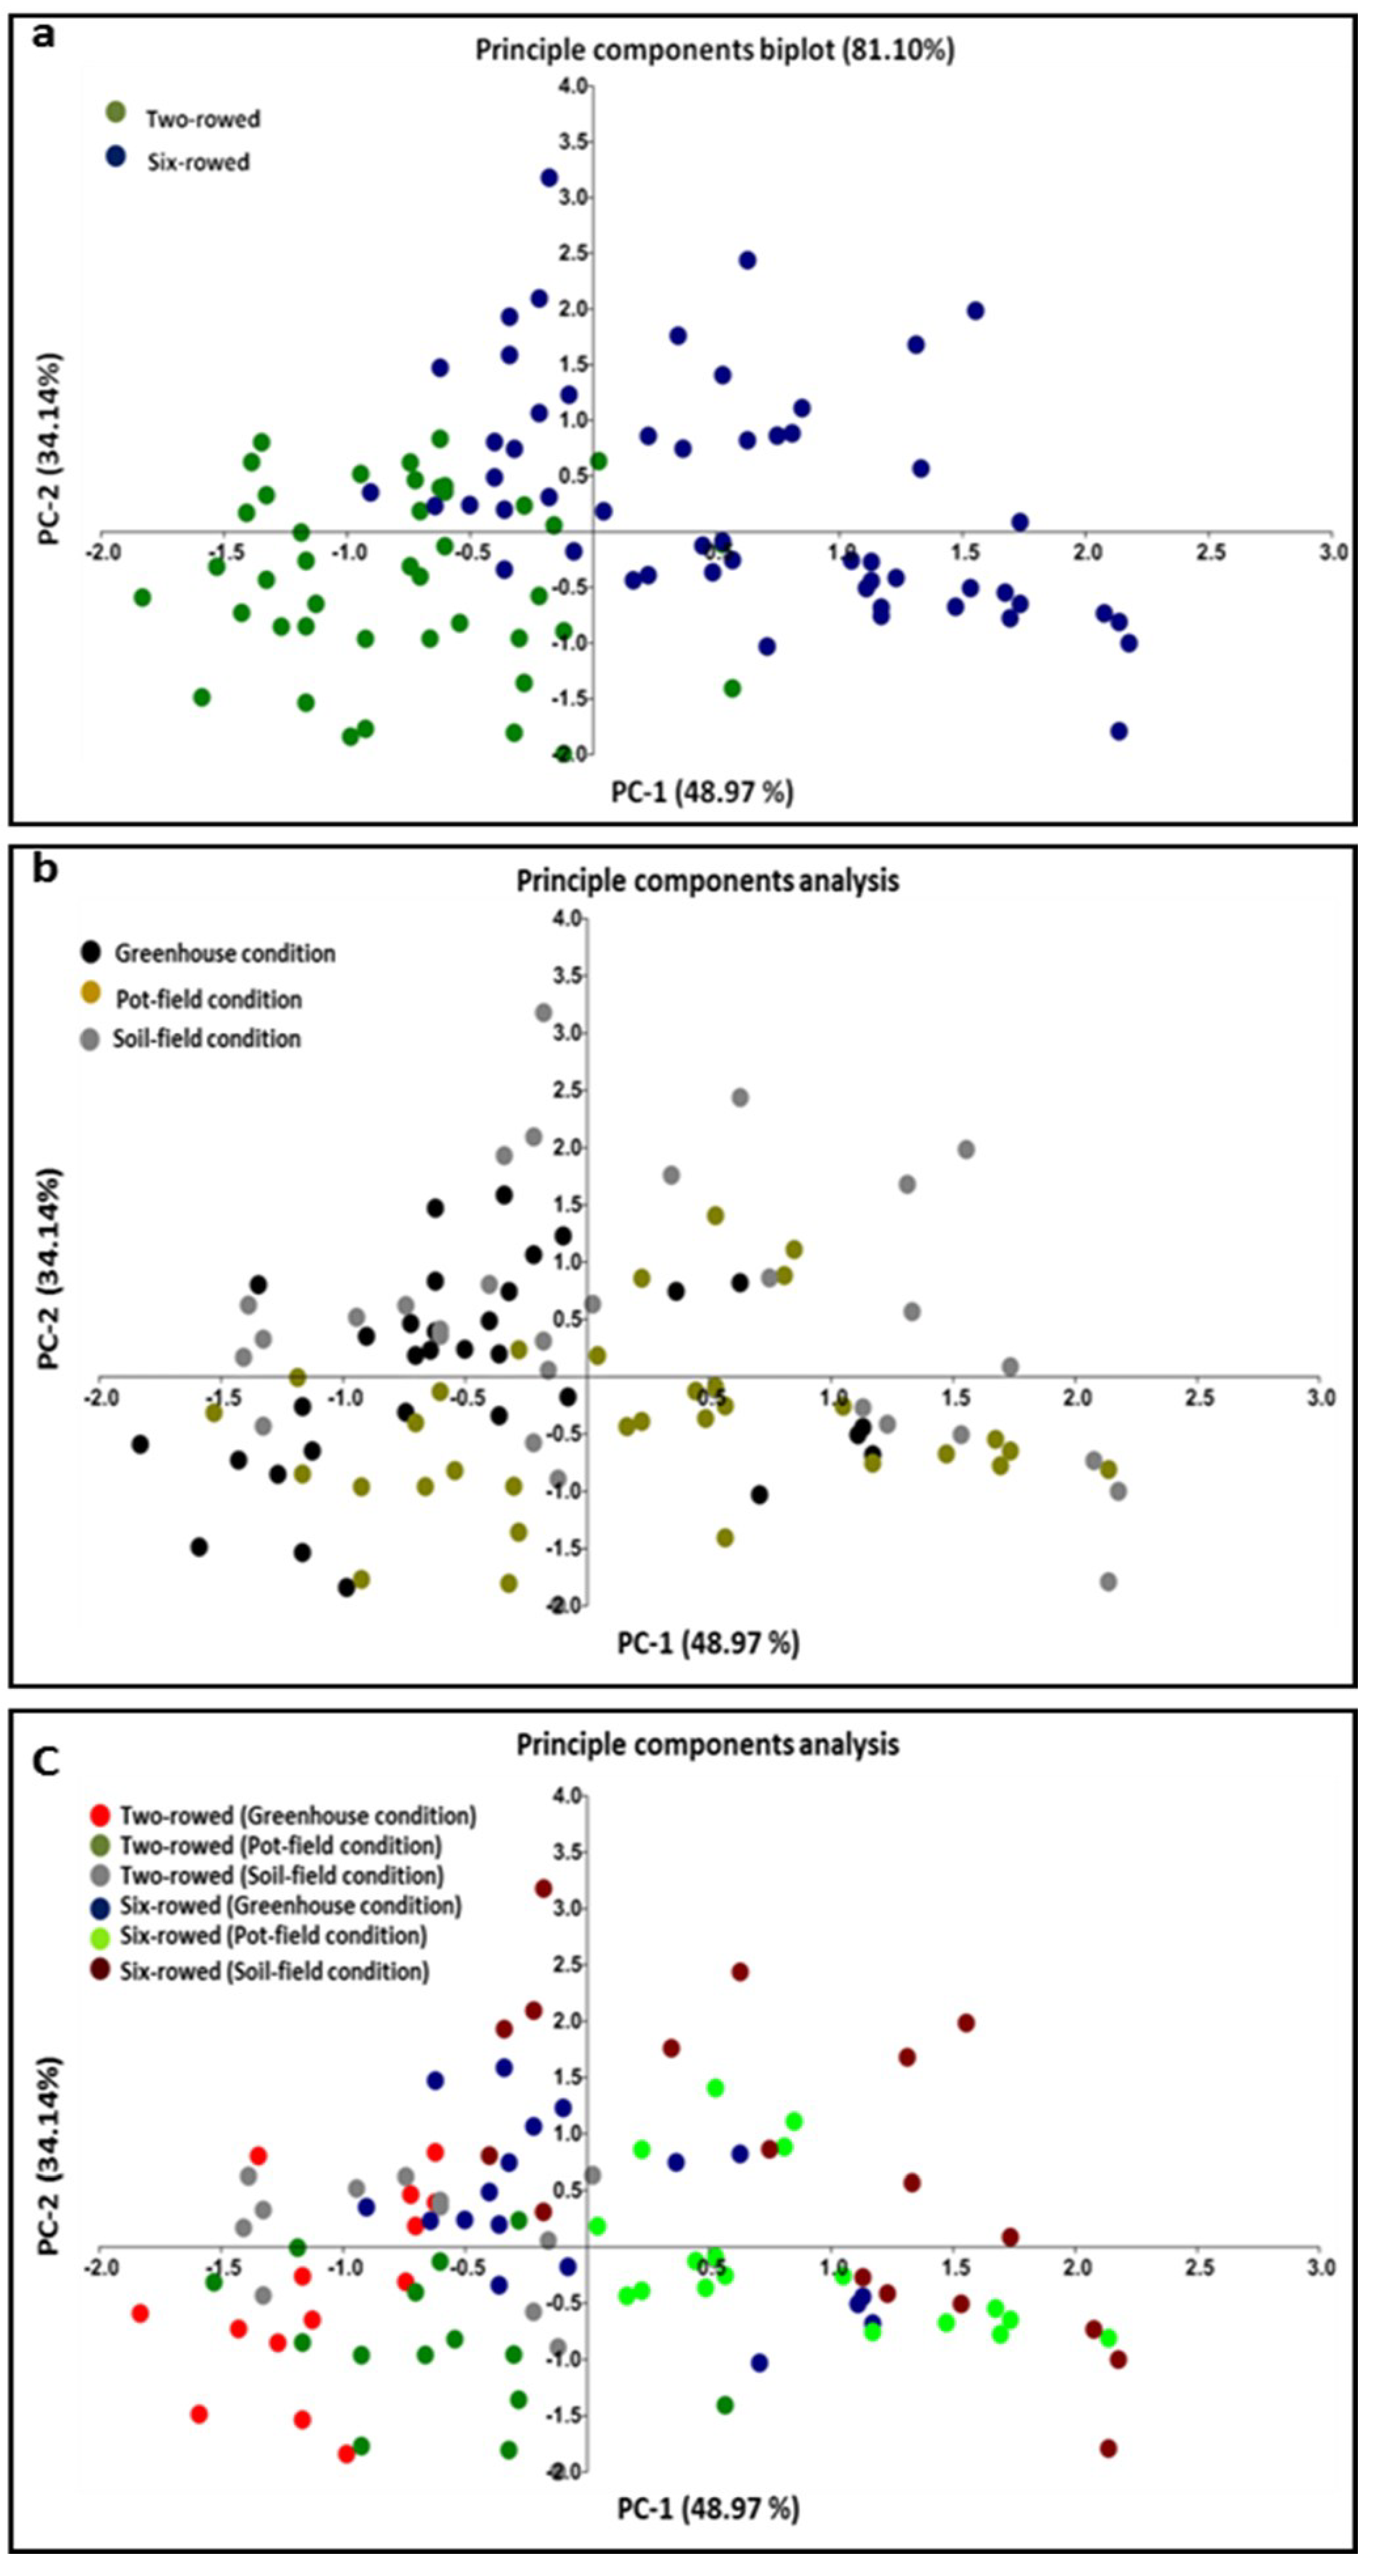
2.2. Analysis of Phenotypic Leaf Variation

Principle component analysis (PCA) identified phenotypic groups within two- and six-rowed barley and/or growth conditions using LA, LDW, and LMA data at the HD stage. A two-dimensional scatter plot is presented to show the row-type clusters based on leaf traits (Figure 1a), the clusters of row-type based on growth conditions (Figure 1b), and the clusters of row-type within growth conditions (Figure 1c). The first PCA-1 (LA, LDW, or LMA) based on row-type accounted for 48.97% of phenotypic variation and clearly separated two- and six-rowed accessions with a few exceptions (Figure 1a). The results showing greater genetic variation among accessions from the six-rowed group compared to two-rowed accessions (Figure 1). LA had the major contribution for this separation followed by LDW and very low effect from LMA; the mixed dots (accessions) between row-types were from GH-grown six-rowed barley. The data revealed that differences among accessions were highly significant for LA and related-traits. The second PCA-2 (growth conditions) accounted for 34.14% of the observed phenotypic variation (Figure 1a). Accessions from different growth conditions were mixed within each row-type and could not be clustered based on leaf traits alone, indicating intra-class variation, while growth conditions explained leaf trait variation within each row-type (Figure 1b and c). However, we cannot rule out the effect of germplasm diversity (geographical origins) and/or germplasm status (cultivar, landrace, and line) on phenotypic diversity. LA and related-traits showed greater extent of genetic diversity contributed by morphological traits. In general, based upon PCA analysis, two groups of LA and related-traits could be clearly identified due to their differences in row type (two- and six-rowed barleys).
Table 1. Correlation coefficients between thermal times (GDD) at different stages with leaf traits.
Leaf TraitsThermal Time/Growing Degree-Day (GDD)
Growing ConditionAwn PrimordiumTippingHeadingAnther Extrusion
Two-RowedSix-RowedTwo-RowedSix-RowedTwo-RowedSix-RowedTwo-RowedSix-Rowed
Leaf number per main culmGH *0.340.69−0.21−0.27−0.27−0.200.06−0.17
Pots0.10−0.230.450.460.560.45−0.190.56
Soil0.070.200.650.480.630.480.350.42
Leaf fresh weight per main culm (g, LFW)GH0.670.680.700.640.360.320.360.18
Pots0.700.590.690.750.520.770.220.71
Soil0.400.470.490.740.430.240.320.23
Leaf dry weight per main culm (mg, LDW)GH0.520.650.680.550.680.480.650.46
Pots0.760.810.750.620.550.770.300.76
Soil0.520.490.460.700.710.480.390.29
Leaf area per main culm (mm, LA)GH0.400.370.23−0.220.300.200.42−0.09
Pots0.590.600.670.790.400.840.430.75
Soil0.400.270.520.700.530.480.720.42
Leaf mass area per main culm (mg·mm−2, LMA)GH0.300.250.28−0.32−0.32−0.24−0.24−0.42
Pots0.490.720.280.110.31−0.010.820.40
Soil0.460.500.05−0.22−0.110.20−0.470.02
Two-rowed (n = 14 accession × 3 replicates) and six-rowed (n = 18 accession × 3 replicates) barley were grown under greenhouse and field (pots and soil) growth conditions. * GH: greenhouse.
Figure 1. Principal component analysis (PCA) based upon phenotypic data using leaf area (LA), leaf dry weight (LDW), and leaf mass area (LMA) per main culm at the heading stage. PCA for row-types, green and blue color denotes two- and six-rowed barley, respectively (a), and for growth conditions, black, greenish-brown and gray color denotes for greenhouse (GH), pot- and soil-field, respectively (b), and row-types within growth conditions (c), the light-red and dark-blue circles indicate two- and six-rowed plants, respectively, under GH conditions; the green and light green circles indicate two- and six-rowed plants, respectively, under pot-field conditions; and the gray and dark-red circles indicate two- and six-rowed plants, respectively, under soil-field conditions. The number of dots (n = 54, 18 accessions × 3 growth conditions) for six-rowed and (n = 42 accessions, 14 × 3 growth conditions) for two-rowed barley.
Agronomy 05 00107 g001
To compare individual leaf trait variations within growth conditions, between accessions and between row-types, we examined coefficients of variation (CV; see Table S1). For all measured traits, CV values under GH conditions were always higher than those of field-grown plants (pots and soil). In general, CV values increased for all measured traits after AP under all growth conditions. For instance, LA under GH conditions resulted in intermediate to very high CV values over developmental stages, with the CV ranging from 27% to 80% and 28% to 41% in two- and six-rowed barley, respectively (see Table S1). Low to intermediate CV values for LA over developmental stages in field-grown plants (pot and soil) ranged from 14% to 35% and 16% to 31% in two- and six-rowed barley, respectively. These findings indicate that the variation in LA within two-rowed barley is higher than six-rowed barley, which can be explained by germplasm diversity (geographical origins) and/or germplasm status (cultivar and landrace). Other leaf traits followed the same trend, clearly suggesting that GH conditions (i.e., controlled temperature, light, and others) maximized phenotypic leaf trait expression between accessions compared to field conditions (especially in two-rowed barley). Although GH pots were randomized three times a week to reduce the effect of environmental factors (such as temperature and light intensity) on leaf trait variation, we cafnnot completely rule out the possibility that the GH environment provides a bias. Nevertheless, the obtained high CV values for our GH conditions support the notion that they are appropriate for studying phenotypic/genetic variation of leaf traits in barley.
The analysis of variance component among row-type classes and growth conditions at developmental stages showed that genetic variance was the largest (Figure 2A). Importantly, we found broad-sense heritability (H2) values across growth conditions ranging from high to very high (H2 = 0.66–0.90) at all developmental stages (Figure 2B). These findings suggest that leaf traits in both row-type classes are mainly heritable under all growth conditions at all developmental stages. Moreover, this appears as a promising novel opportunity to understand the genetic of LA and related traits in barley, thereby opening up a new field of research.
Figure 2. Variance components of leaf traits at different developmental stages in two- and six-rowed barley across all growth conditions (A) Broad-sense heritability of leaf traits at different developmental stages across all growth conditions in two- and six-rowed barley separately; (B) Leaf #: leaf number; LFW: leaf fresh weight; LDW: leaf dry weight; LA: leaf area; and LMA: leaf mass area.
Agronomy 05 00107 g002

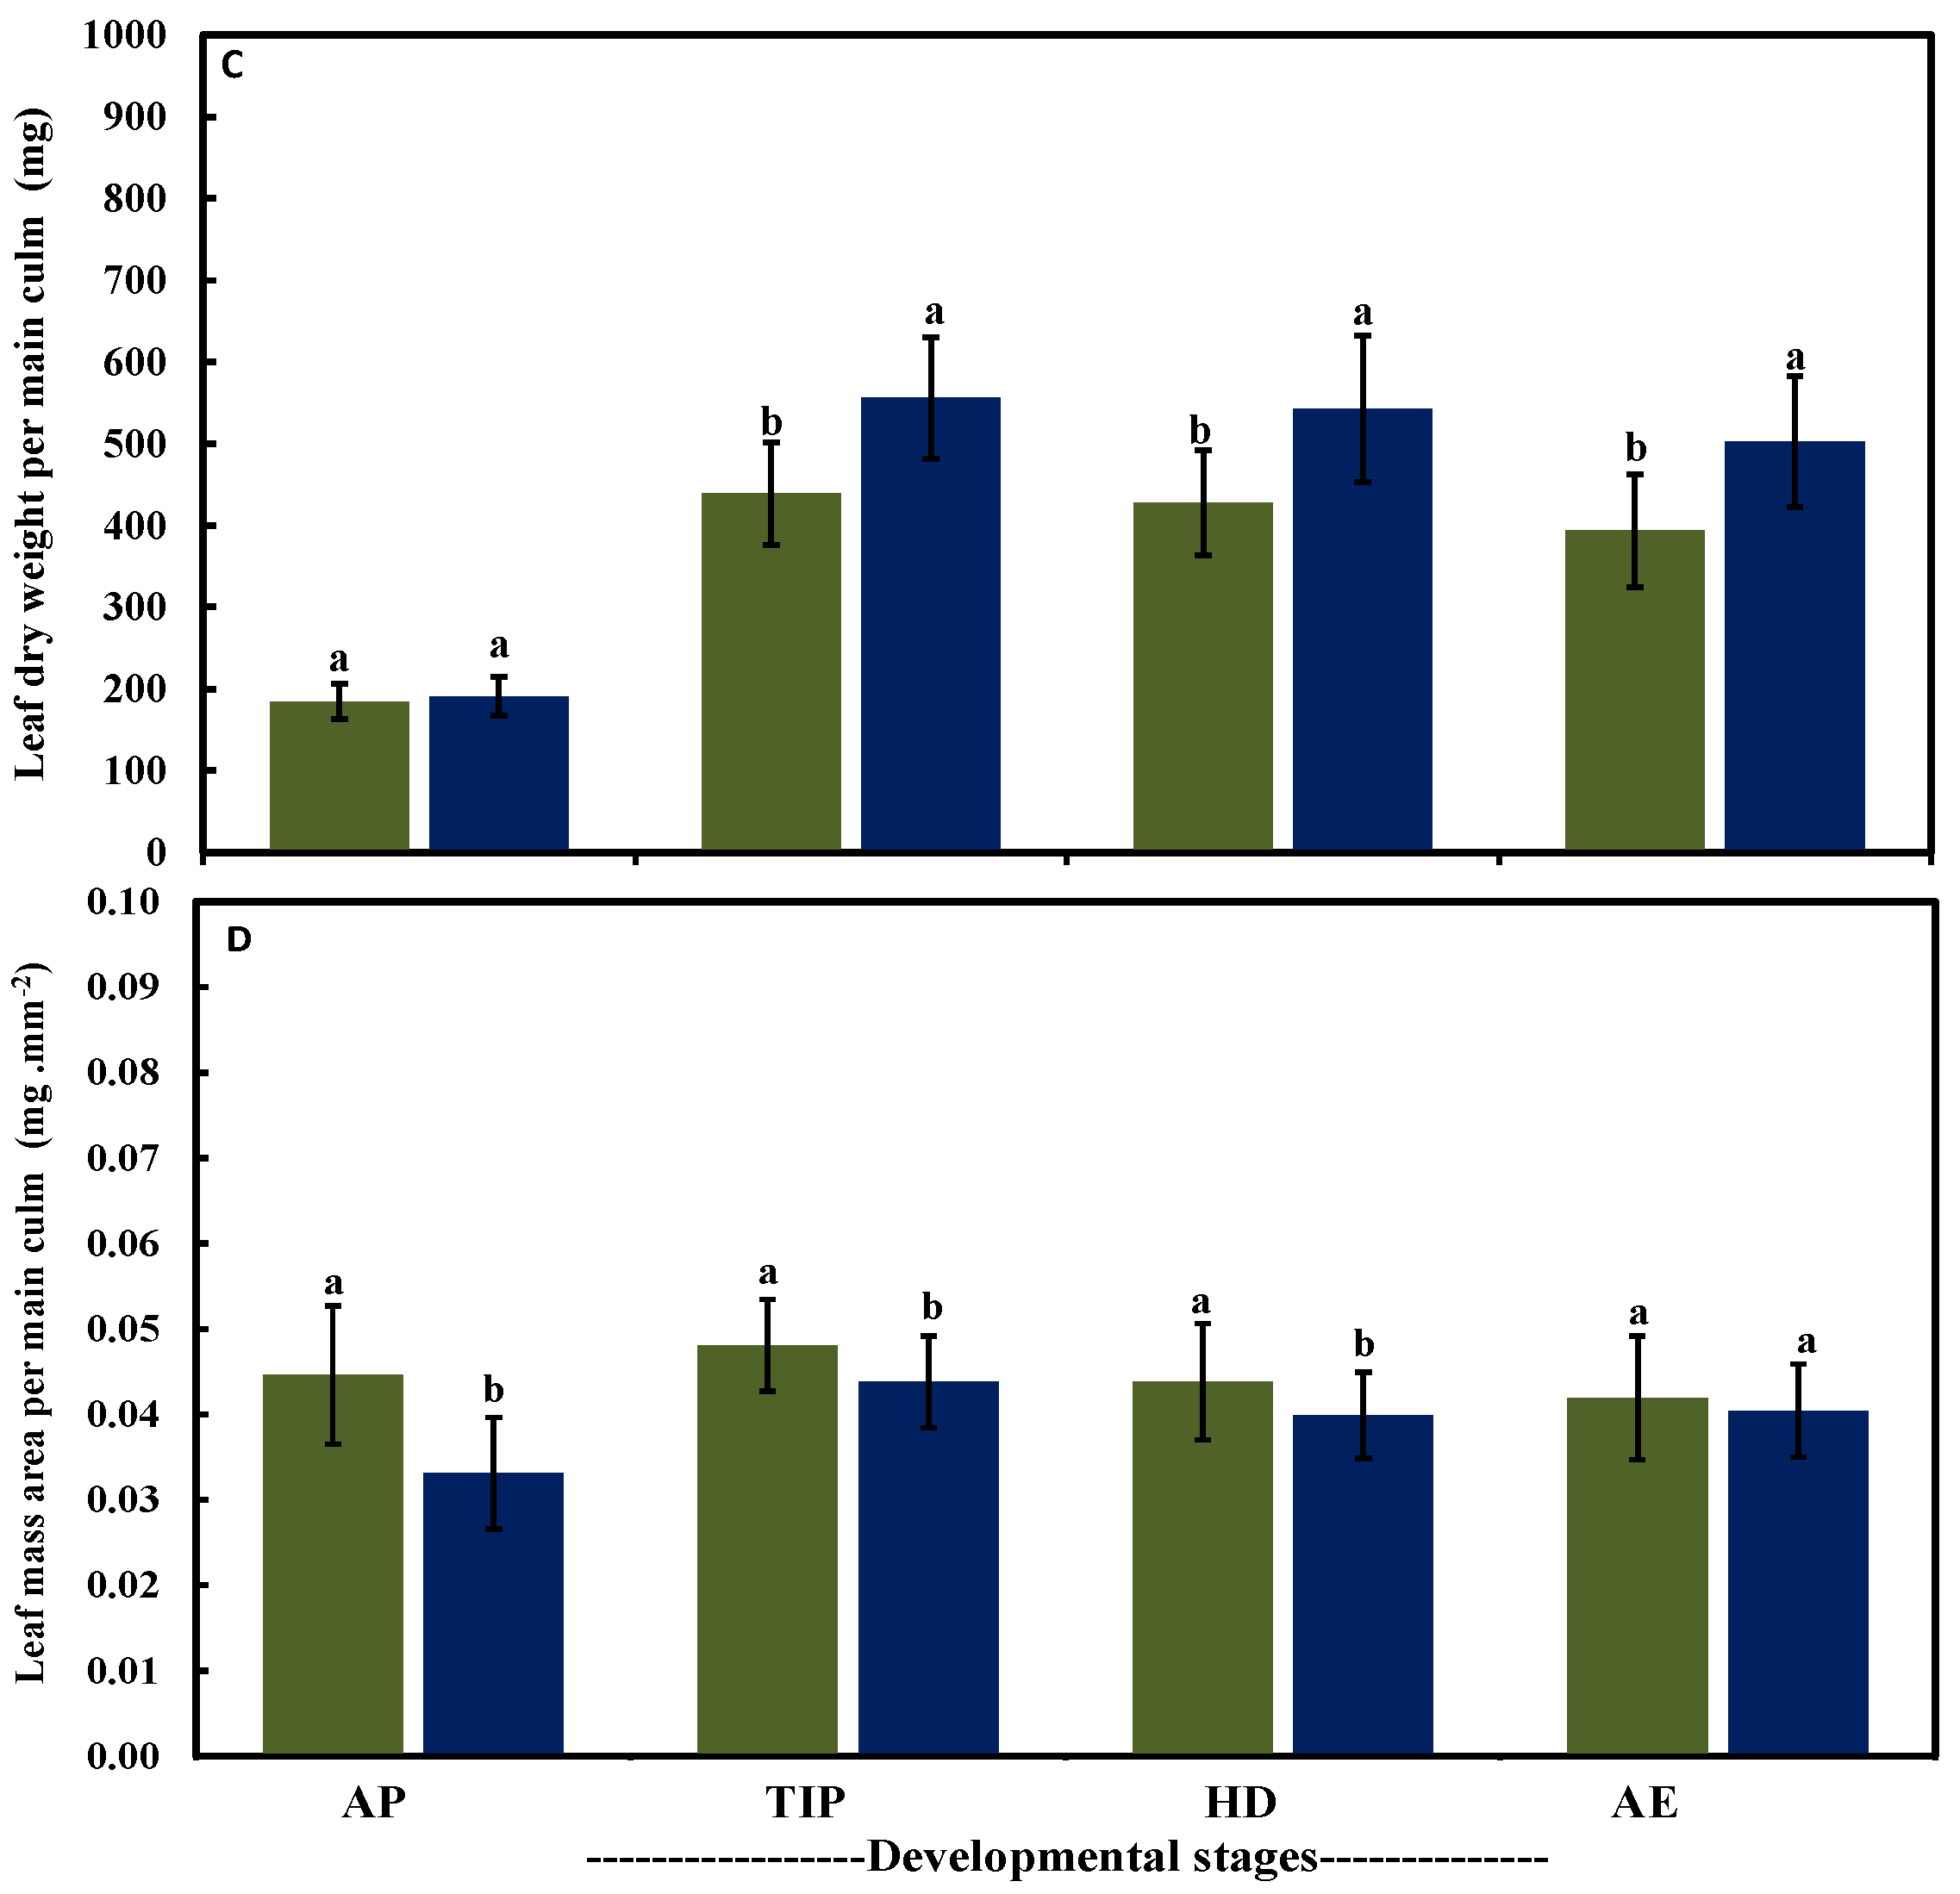
2.3. Leaf Traits in Both Row-Type Classes under Different Growth Conditions at Four Developmental Stages

Comparisons of leaf blade number per main culm at all developmental stages in two- and six-rowed barley yielded no significant difference was observed across all growth conditions (Figure 3A). However, significant differences (p ≤ 0.05) between growth conditions were found in leaf blade number per main culm for both row-type classes at all developmental stages (see Figure S1A). GH-grown plants had significantly more leaves per main culm in both barley classes at all developmental stages compared to field-grown plants (pots and soil) due to a longer time required to reach AP (vegetative period) (see Figure S1A). For LA per main culm, we consistently found significantly higher LA in six-rowed barley at all stages (Figure 3B). With the exception of AP, field-grown plants exhibited the largest LA, followed by pot-grown field plants and GH-grown plants (independent of row-type) (see Figure S1B). LDW followed the LA trend for all development stages, growth conditions, and row-type classes (Figure 3C and Figure S1C). The LMA was significantly different between two- and six-rowed barley (p ≤ 0.05) at AP, TIP, and HD stages independent of growth conditions, but not at AE (Figure 3D). Field-grown plants consistently showed significantly higher LA and LDW than GH-grown plants. However, GH conditions produced the broadest phenotypic variation for leaf traits between accessions, which is important for revealing the genetic variation of these traits. Interestingly, we found that six-rowed barley plants had greater LA and LDW, but lower LMA compared to two-rowed barley plants under all growth conditions. The found natural variation for LA and related traits between row-type classes suggests that the effect of major genes controlling row-type in barley may have pleiotropic effects on these traits. However, additional genetic evidence is required to elucidate this effect.
Figure 3. Leaf traits per main culm at four developmental stages for two- and six-rowed barley averaged across all growth conditions. (A) Leaf number; (B) leaf area; (C) leaf dry weight; and (D) leaf mass area. The same letters at each developmental stage are not significantly different at p ≤ 0.05 according to the Least Significant Difference. Bars indicate standard deviation (n = 42 (14 accessions × 3 replicates) and 54 (18 accessions × 3 replicates) for two- and six-rowed barley, respectively). AP: awn primordium, Alqudah and Schnurbusch [30]; TIP: tipping, Z49; HD: heading, Z55; AE: anther extrusion, Z65, Zadoks et al. [34].
Agronomy 05 00107 g003aAgronomy 05 00107 g003b
Figure 4. Leaf growth rate per main culm at different stages and phases for two- and six-rowed barley averaged across all growth conditions. (A) Leaf fresh weight growth rate (LFWGR); (B) leaf dry weight growth rate (LDWGR); (C) leaf area growth rate (LAGR); and (D) leaf dry matter content (LDMC). The same letters at each developmental stage are not significantly different at p ≤ 0.05 according to the Least Significant Difference. Bars indicate standard deviation (n = 42 (14 accessions × 3 replicates) and 54 (18 accessions × 3 replicates) for two- and six-rowed barley, respectively). AP: awn primordium, Alqudah and Schnurbusch [30]; TIP: tipping, Z49; HD: heading, Z55; AE: anther extrusion, Z65, Zadoks et al. [34]. 2R is two-rowed and 6R is six-rowed.
Agronomy 05 00107 g004aAgronomy 05 00107 g004b

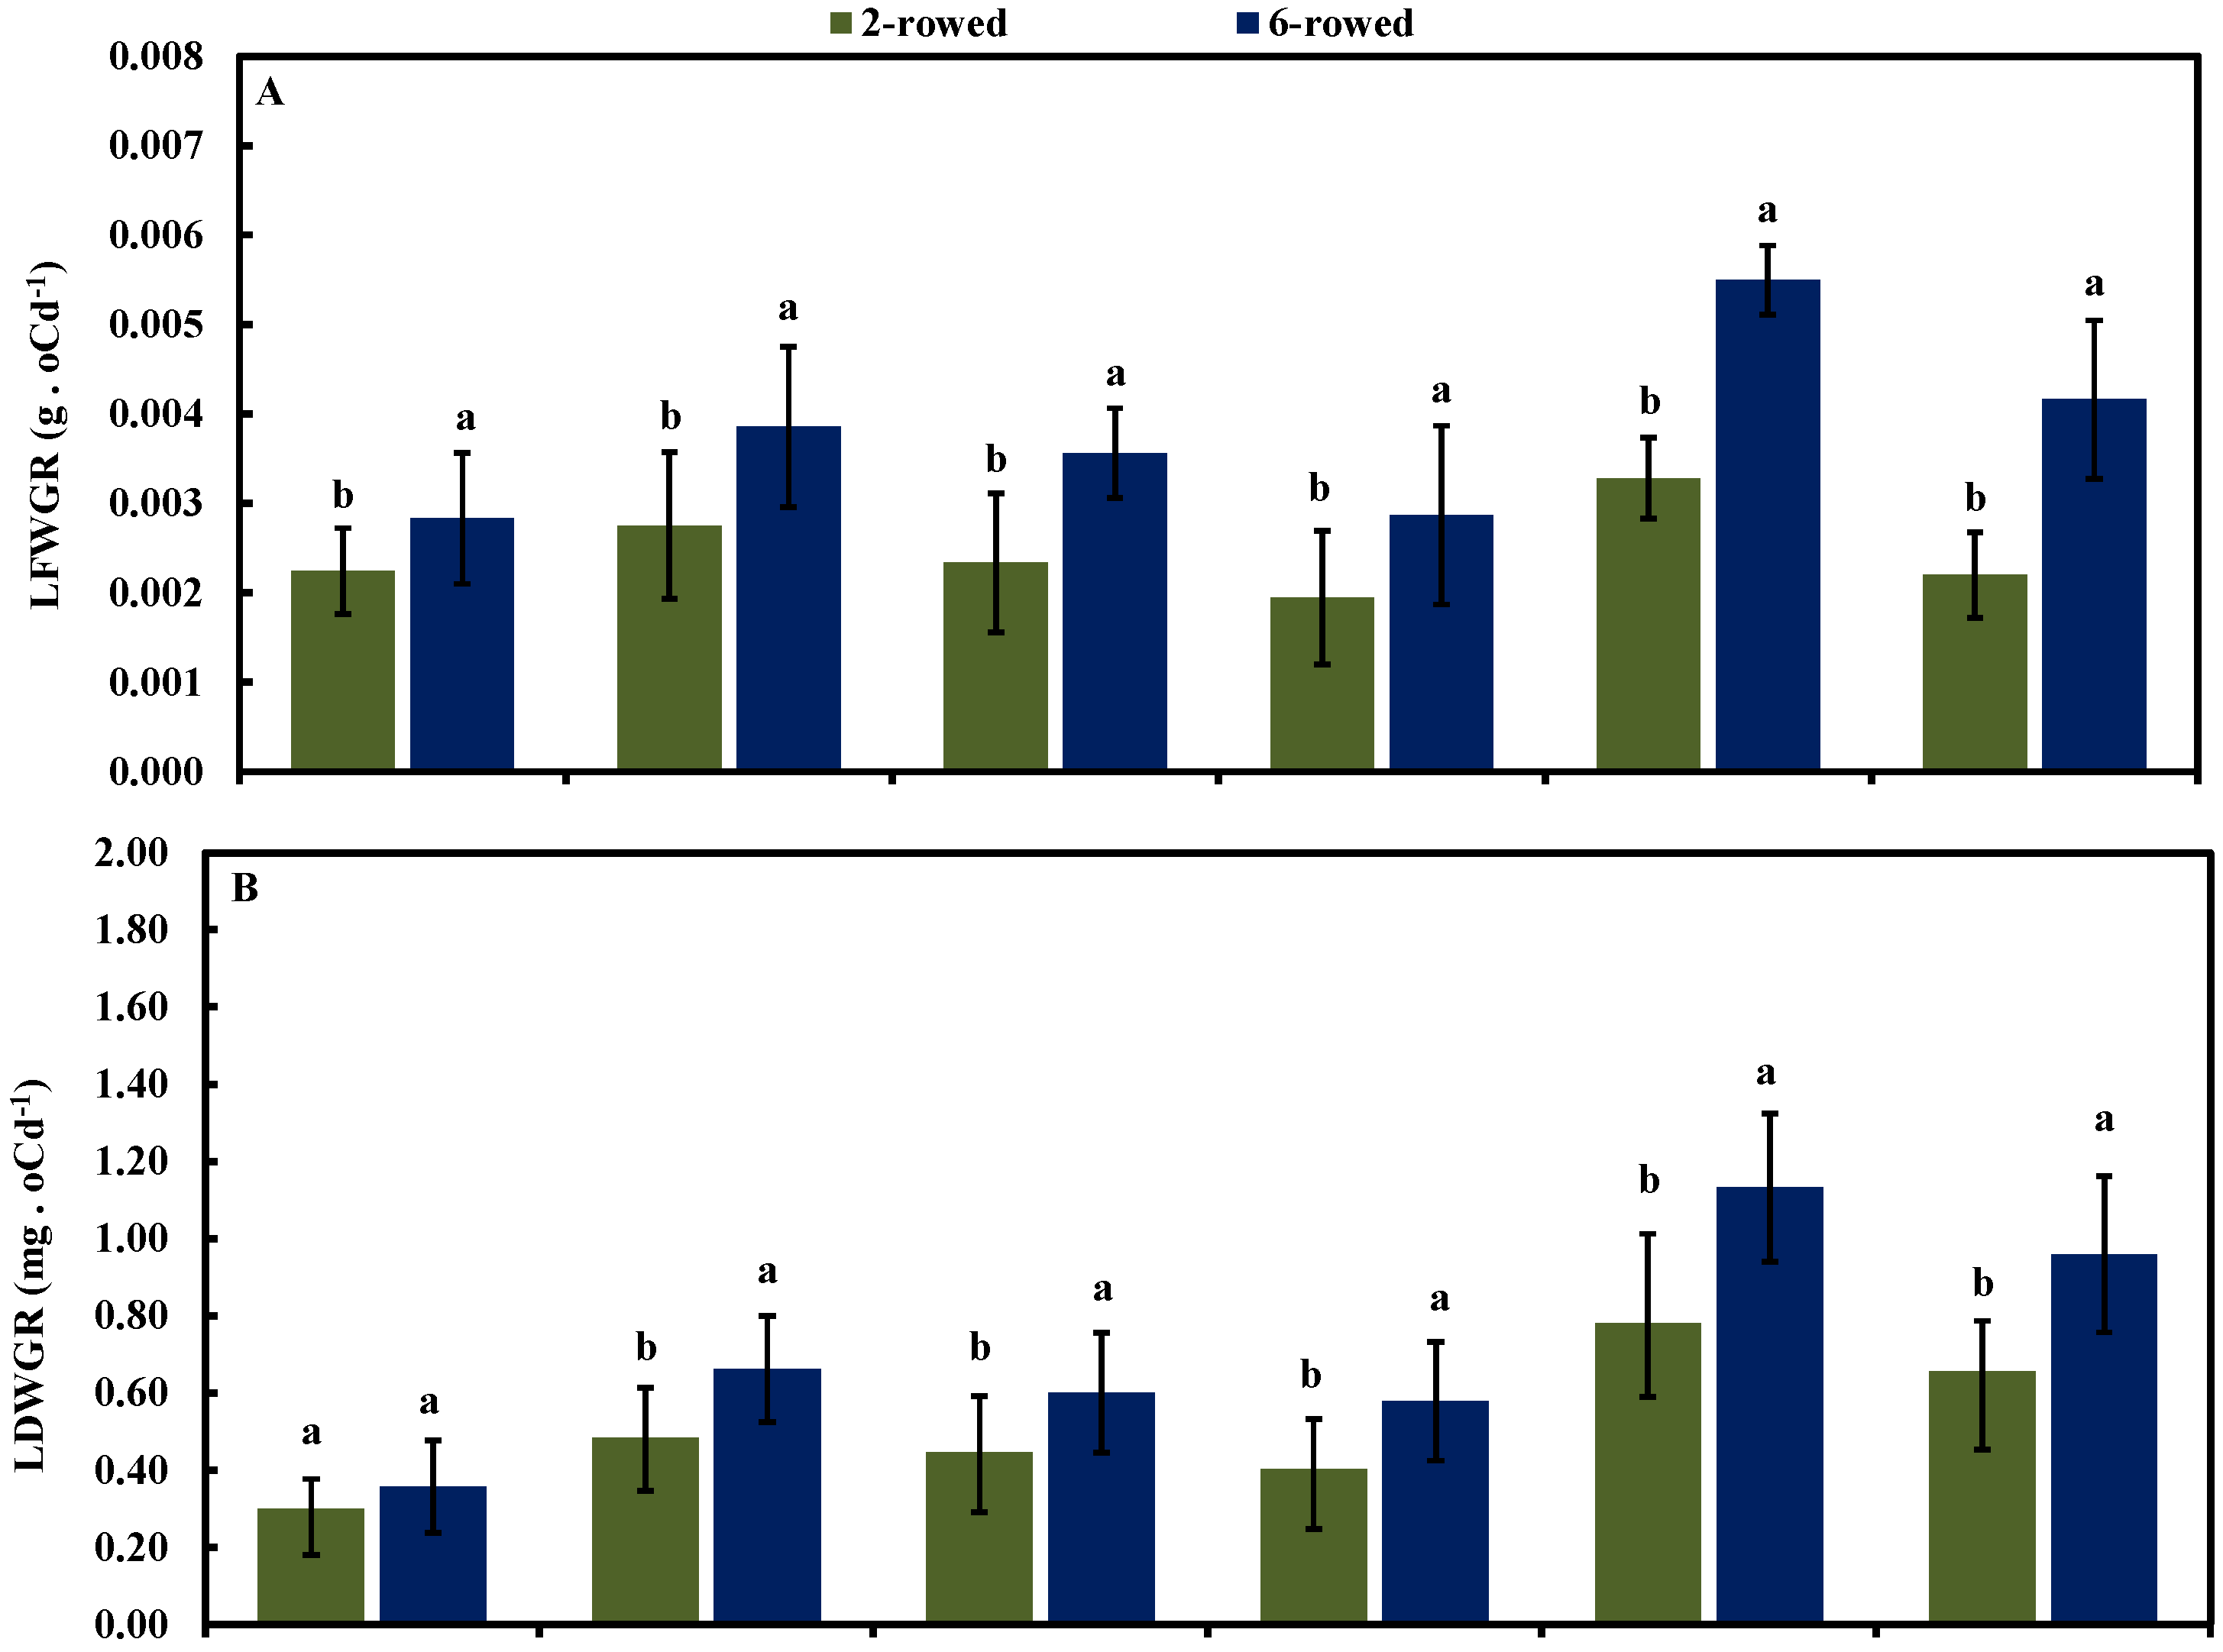
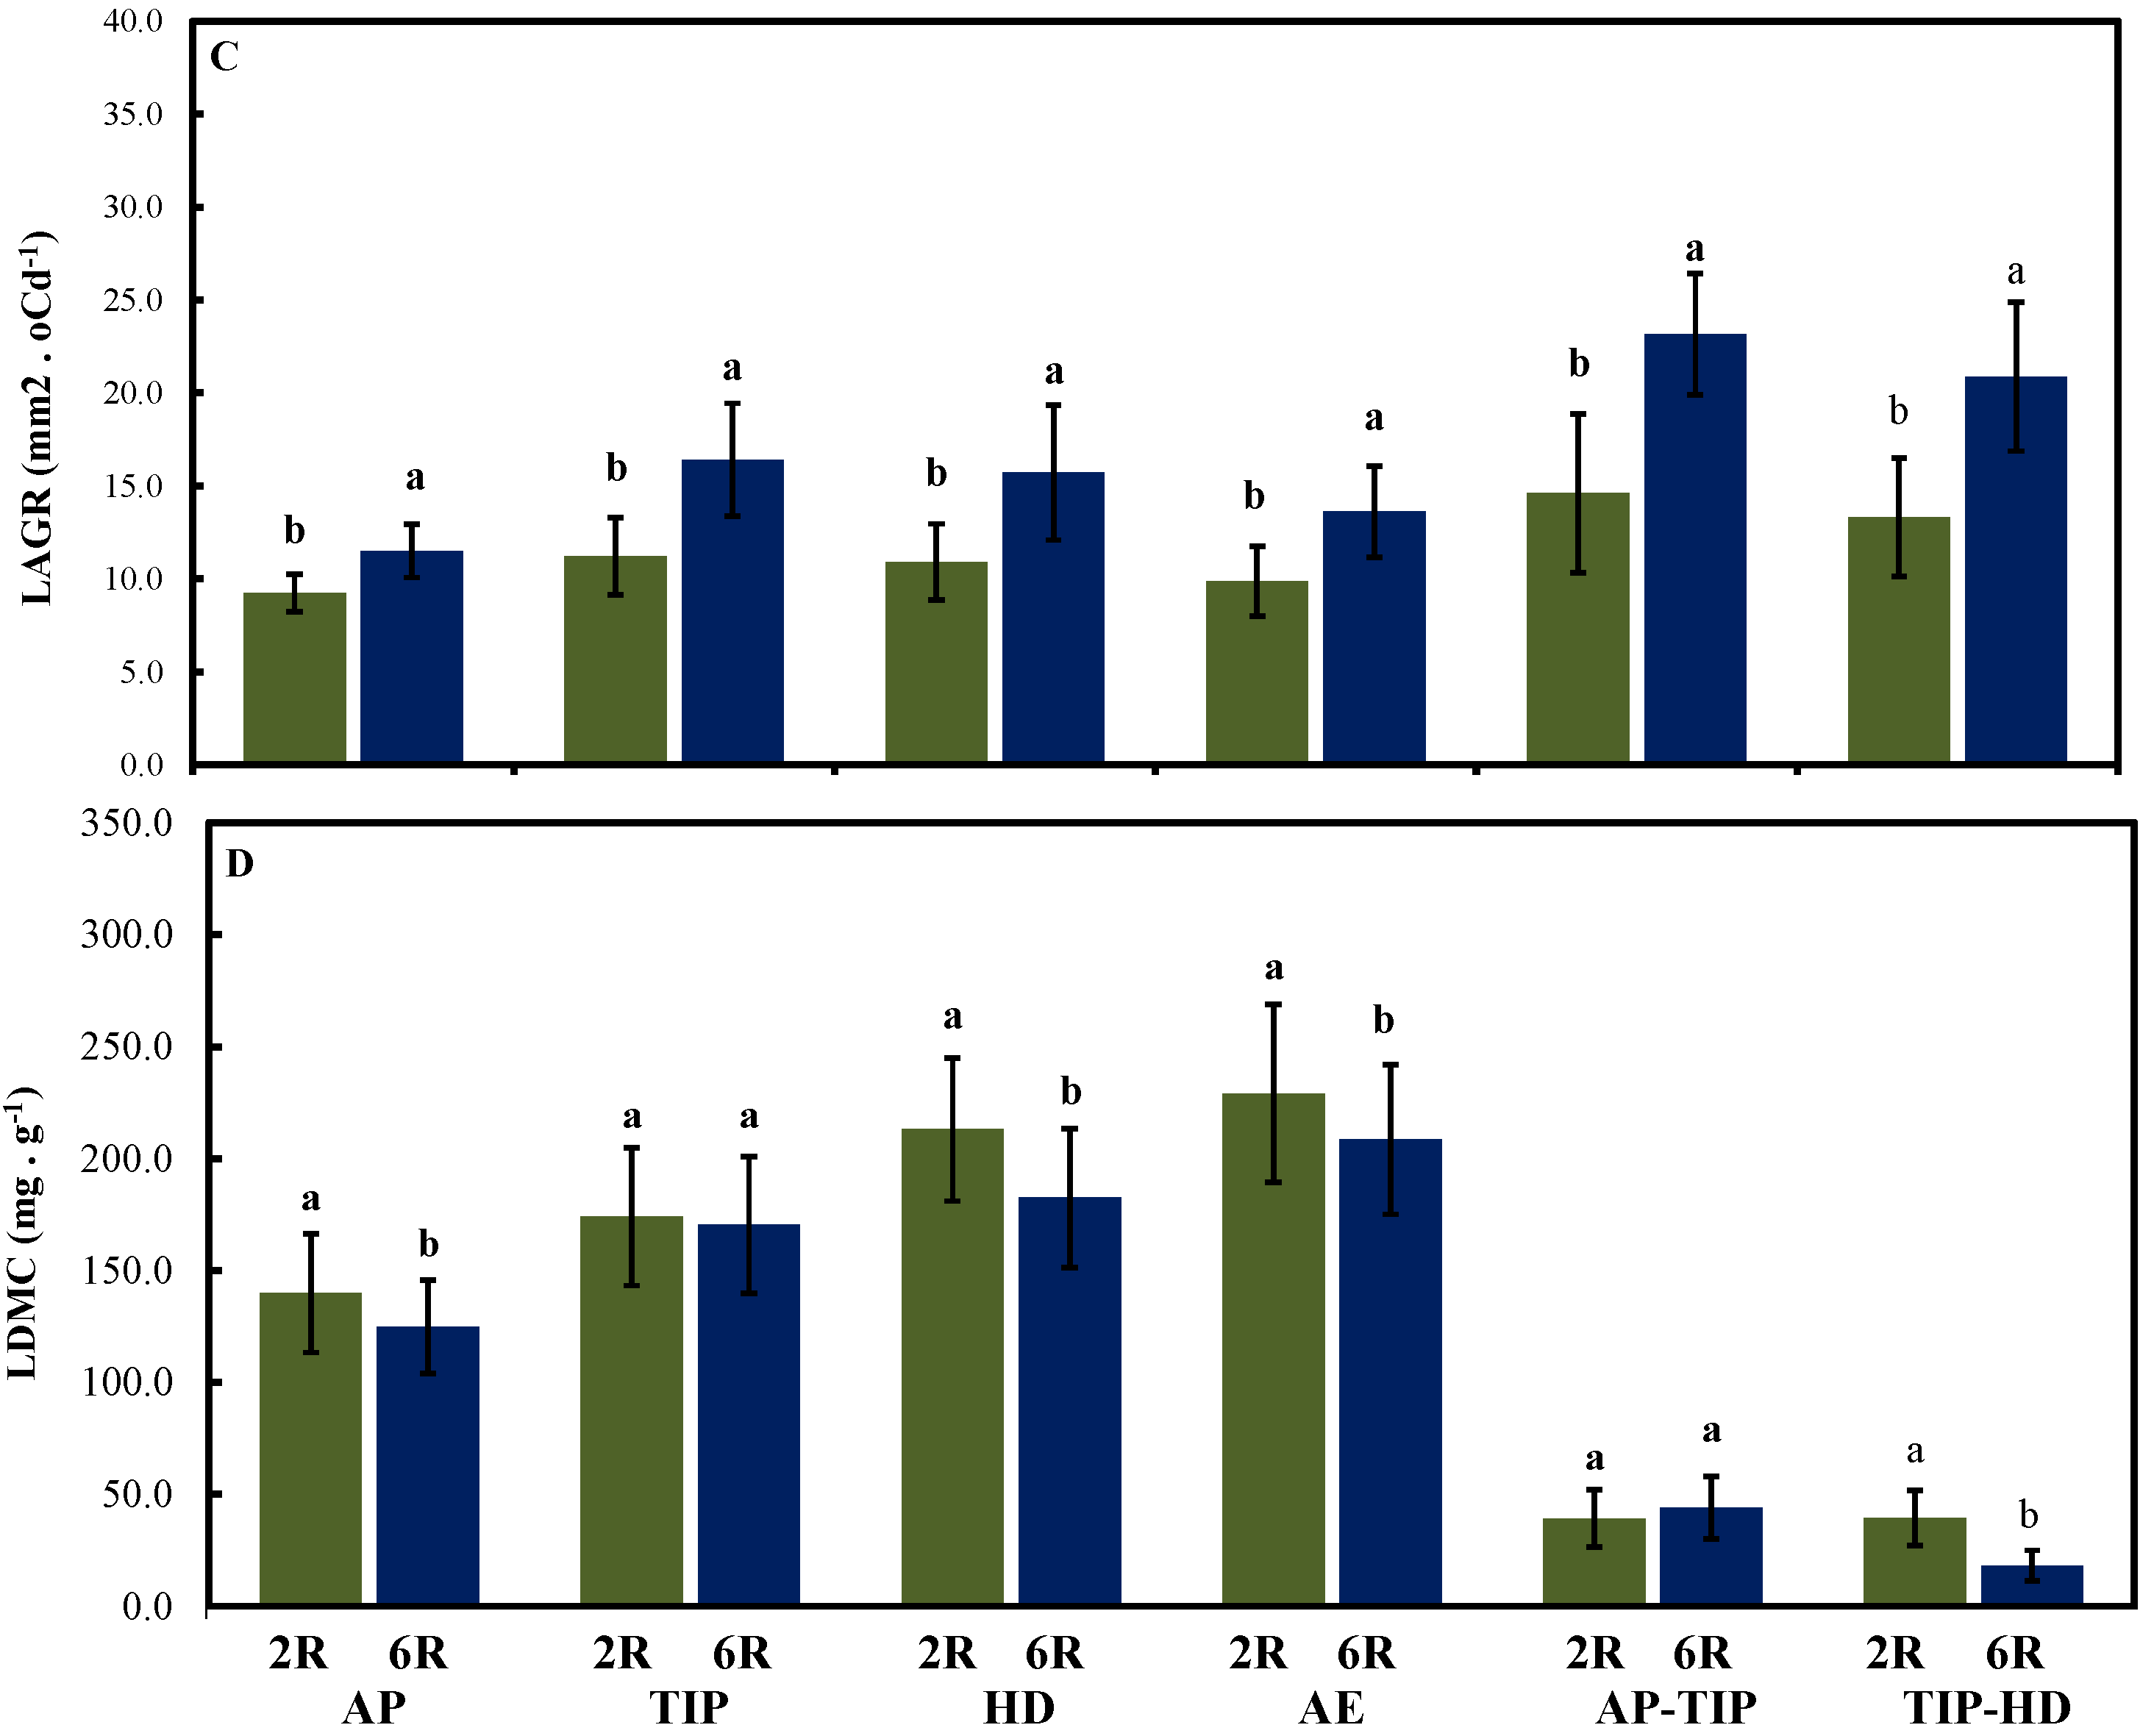
2.4. Leaf Growth Rate in Both Row-Type Classes under Different Growth conditions at Four Developmental Stages

For leaf growth rates per main culm, significant differences among row-type classes and growth conditions were found (p ≤ 0.05; Figure 4, and see Figure S2). Regardless of growth conditions, six-rowed barley always exhibited a higher leaf fresh weight growth rate (LFWGR) than two-rowed plants at all developmental stages and sub-phases (Figure 4A). A significant difference existed between growth conditions; field-grown plants (pots and soil) showed significantly higher LFWGR than GH-grown plants at all developmental stages and sub-phases (see Figure S2A). Six-rowed barley had significantly higher leaf dry weight growth rate (LDWGR) and LA growth rate (LAGR) at most developmental stages and sub-phases compared to two-rowed barley (p ≤ 0.05; Figure 4B &C). For leaf dry matter content (LDMC), two-rowed plants generally exhibited significantly higher LDMC (p ≤ 0.05) than six-rowed barley plants, except at the TIP stage and between the AP-to-TIP phase (Figure 4D). Field-grown plants (pots and soil) showed significantly higher LDMC than GH-grown plants at all developmental stages and sub-phases, except at the AE stage and TIP-to-HD phase (see Figure S2D). Growth rates for all measured traits were significantly higher in field-grown plants than GH-grown plants, indicating that the field conditions promoted these traits. Notably, GH-conditions resulted in the highest phenotypic variation for leaf growth rates between accessions. We consistently found that six-rowed barley had significantly higher leaf growth rates than two-rowed barley. Moreover, independent of row-type and growth conditions, growth rates were greatest between the AP to TIP phase, illustrating that this developmental phase has the most rapid leaf biomass increase during the barley life cycle.

2.5. Correlation Analysis between Leaf Area (LA), Single Plant Yield, and Yield Components

Correlation coefficients at developmental stages between LA (i.e., LA of the main culm) and main culm spike grain yield, main spike dry weight (MSDW), tillers and spikes per plant, biological yield (BY), and harvest index (HI) were generally higher under field conditions (pots and soil; Table 2). The correlations at the HD and AE stages were higher than for the AP and TIP stages (Table 2). In both row-type classes under all growth conditions, we found positive correlations between LA per main culm with main culm spike grain yield (grain number and weight) and MSDW at all developmental stages (Table 2). The strongest correlations were found in field-grown six-rowed barleys at the AE stage. For HI, we always found a negative correlation with LA in two-rowed barley in all growth conditions (Table 2). For tiller number, spike number per plant, and BY, correlation analysis showed two-rowed barley at the AE stage under GH conditions exhibited the strongest correlation between LA with tiller and spike number per plant (r = 0.61 and 0.51, respectively; Table 2), while LA from two-rowed barley in field-grown plants (pot and soil) was highly correlated with BY at the AE stage (r = 0.65). Unlike in two-rowed barley, six-rowed barley showed a consistent positive association between LA of the main culm and HI, whereas the LA in six-rowed barley correlated negatively with BY and tiller and spike number per plant under all growth conditions. The correlation results indicate that two-rowed barley produced more BY, tillers and spikes per plant, whereas six-rowed barley produced more grain (per spike). In general, larger LA in six-rowed barley correlated with main spike grain yield, MSDW, and HI, while smaller LA in two-rowed barley influenced tiller and spike number per plant and BY. The LA for field-grown plants (pots and soil) correlated better with yield and yield components compared to those grown under GH conditions.

3. Discussion

This study focused on the importance of variation between two- and six-rowed barley in LA and its relationship on single plant grain yield and yield components. The study also demonstrates that six-rowed barley had larger and heavier leaf blades compared to two-rowed barley. Moreover, we identified AP to TIP as being the most critical sub-phase for leaf growth and development. We also investigated the heritability of leaf traits (i.e., genetic basis) in barley row-type classes under various growth conditions and throughout developmental stages.

3.1. The Importance of Leaf Area in Improving Single-Plant Yield

In this study, we found significant variation in LA and related traits during growth and development stages between barley row-types. Using LA of single leaf (flag or penultimate) for improving the yield of barley has been previously suggested [13,19]; however, no study has explored the specific contribution of main culm LA during pre-anthesis stages to yield based upon row-type classes. Our analysis showed that larger LA (six-rowed) correlate to higher main culm spike grain yield, spike dry weight and harvest index; while smaller LA (two-rowed) correlated to more spikes, tillers, and biological yield. We attempt to clarify the importance of large and small LA in improving yield, which may help breeders in future breeding programs.

3.1.1. Large Leaf Area

In this study we showed that larger LA per main culm in six-rowed barley positively associates with a higher grain yield per main spike (Table 2), thereby increasing HI. LA is known to improve grain yield in breeding programs [12,13,23]. Broader leaves were important components in New Plant Type (NPT) breeding program to improve rice grain yields [17,18]. Rasmusson [13] suggested that larger LA produces larger spikes and kernels, and in two bi-parental barley populations (small vs. large LA), higher grain weights and higher yield was achieved by higher photosynthetic rates per unit LA [19]. A similar explanation for higher single plant grain yield in six-rowed barley is likely to be the cause in this study. Here, a high correlation between larger LA per main culm in six-rowed barley with MSDW at the AE (flowering) stage was apparent. Yoshida [14] found a close relationship between LA at flowering time and grain number and grain yield at harvest. We similarly propose that larger LA leads to more dry matter accumulation before the AE stage from higher photosynthetic rates, which in turn increases spike dry matter. This could be one reason for producing heavier single spike grain weight in six-rowed barley and higher HI. As presented in Figure 3, larger LA at the HD stage resulted in the highest amount of LDW in six-rowed barley, which is a result that may be attributed to the previous reasoning (high photosynthetic rate in large LA) and confirmed in past literature [1]. Our observation highlights the importance of large LA in six-rowed barley, but differs from the ideotype concept of Donald [11]. Therefore, based on our observed correlations, improving single-plant grain yield through larger LA in six-rowed barley might be important for future barley breeding programs in the context of increasing spike grain yield, spike dry weight, and harvest index.
Table 2. Correlation coefficients between leaf blade area per main culm (mm2) at different developmental stages with single-plant yield and yield components.
Yield ComponentsLeaf Blade Area per Main Culm (mm2)
Growing ConditionAwn PrimordiumTippingHeadingAnther Extrusion
Two-RowedSix-RowedTwo-RowedSix-RowedTwo-RowedSix-RowedTwo-RowedSix-Rowed
Grain number per main culm spike at harvestGH 0.130.200.140.280.37 *0.52 *0.43 *0.62 *
Pots0.57 *0.55 *0.45 *0.56 *0.53 *0.64 *0.60 *0.74 *
Soil0.210.38 *0.51 *0.61 *0.53 *0.62 *0.58 *0.65 *
Grain weight main culm spike at harvest (g)GH0.120.130.260.300.230.40 *0.330.46 *
Pots0.53 *0.40 *0.40 *0.49 *0.35 *0.50 *0.50 *0.55 *
Soil0.280.340.42 *0.62 *0.47 *0.53 *0.55 *0.68 *
Main culm spike dry weight at heading (g)GH0.160.100.35 *0.340.310.240.330.36 *
Pots0.100.36 *0.37 *0.79 *0.43 *0.57 *0.65 *0.83 *
Soil0.310.100.56 *0.69 *0.43 *0.54 *0.74 *0.74 *
Tillers per plantGH0.31−0.070.01−0.170.47 *−0.330.61 *−0.36 *
Pots0.23−0.260.20−0.100.150.000.45 *−0.09
Soil0.03−0.170.28−0.240.39 *−0.38 *0.45 *−0.31
Spikes per plantGH0.25−0.060.30−0.54 *0.43 *−0.340.51 *−0.27
Pots0.22−0.300.20−0.230.38 *−0.220.47 *0.00
Soil0.16−0.220.29−0.220.33−0.40 *0.40 *−0.31
Biological yield (g)GH0.00−0.38 *0.27−0.320.29−0.210.39 *−0.11
Pots0.46 *−0.080.47 *−0.070.36 *−0.130.47 *−0.31
Soil0.20−0.290.42 *−0.290.52 *−0.270.65 *−0.52 *
Harvest Index (%)GH−0.260.38 *−0.140.37 *−0.290.12−0.170.20
Pots−0.35 *0.29−0.220.16−0.39 *0.21−0.170.28
Soil−0.22−0.06−0.120.22−0.310.54 *−0.300.41 *
Two-rowed (n = 14 accession × 3 replicates) and six-rowed (n = 18 accession × 3 replicates) barley were grown under greenhouse and field (pots and soil) growth conditions; * Correlation values exceeding ±0.35; GH: greenhouse.

3.1.2. Small Leaf Area

We found that smaller LA in two-rowed barley was associated with more tillers and spikes per plant, which are findings that are in agreement with those of Berdahl, Rasmusson, and Moss [19]. Producing smaller and narrower LA in dense stands can theoretically improve crops grain yield in cereals [11]. As shown in Figure 3 and Figure 4, smaller LA in two-rowed barley results in higher LMA and LDMC, suggesting that the leaves are thicker than those of six-rowed barley. LMA is a trait that responds to stress, as it reflects the amount of dry matter a plant accumulates through reduced LA [2]. Smaller LA, which results from a longer vegetative duration, could be one important trait for improving drought and cold tolerance depending on growth habits [6]. Curtis et al. [35] reported that leaves with higher LMA were thicker, narrower, and protected well against rapid fluctuations in temperature, while leaves with low LMA senesced earlier. Thus, two-rowed barley may adapt better to stress conditions than six-rowed barley based on leaf performance traits, such as LMA. Although LMA strongly varied under different conditions, such as water stress [3], it may still be a useful trait to select for in a breeding program in order to produces lines with improved stress tolerance. Moreover, in a canopy situation, narrower leaves utilize sunlight more efficiently due to decreased shading between tillers and neighboring plants, thereby increasing light perception. Taken together, the opposing relationship between LA and yield-related traits, such as BY and HI, in two- and six-rowed barley, respectively, is undoubtedly an interesting plant architectural feature and deserves further attention.

3.2. Maximized Leaf Growth Rate in the Two Row-Type Classes

Our study provides a first set of leaf growth rate parameters at four developmental stages and in three growth conditions for two major barley row-type classes. Leaf growth rate has been studied with regard to barley growth habits in response to Mediterranean environmental conditions, such as drought and cold [6], which are important for local breeding programs. Understanding how these traits perform during developmental stages is also important for understanding the biological mechanisms of these traits. Based upon our phenotypic analysis, we propose a new leaf development model for barley during developmental stages under all growth conditions. An initial lag phase up to the AP stage exists under all parameters studied (Figure 5). Leaf weight and LA significantly increased with the onset of the late reproductive phase and reached a plateau during the HD stage (Figure 5). Increased leaf weight and area resulted from a higher number of developed leaves during more advanced developmental stages. LA is critical for biomass accumulation processes (LDW) and is indicative of increased photosynthetic rates [19]. This, in turn, may explain increased LFWGR and LDMGR. Moreover, we identified the period from AP to TIP as the most important phase for leaf growth rate in barley (Figure 4). This period is characterized by 50% LA and biomass accumulation, but decreases with advancing age (after HD) due to leaf senescence. This is in agreement with the findings of Alqudah and Schnurbusch [30], who found that the AP to TIP phase is the most critical period for spikelet survival with approximately ~70% of total spikelet/floret abortion. Moreover, this phase (AP-TIP) was found to be the longest and most important developmental phase for studying genetic variation of phase duration in barley [36]. Importantly, the AP to TIP period temporally coincides with stem elongation and maximal leaf growth rates, further corroborating that intra-plant competition (stem/leave vs. spike) may be a major trigger for the observed spkikelet/floret decline [30]. These findings illuminate opportunities to better understand internal networks of competing barley organs and might open up novel research in terms of source-sink relationships [37]. The results presented here provide a starting point for such studies.
Figure 5. General trend of leaf traits in barley at developmental stages. Data was collected from nine biological replicates of 32 barley accessions (n = 32 accession × 3 replicates × 3 growth conditions).
Agronomy 05 00107 g005

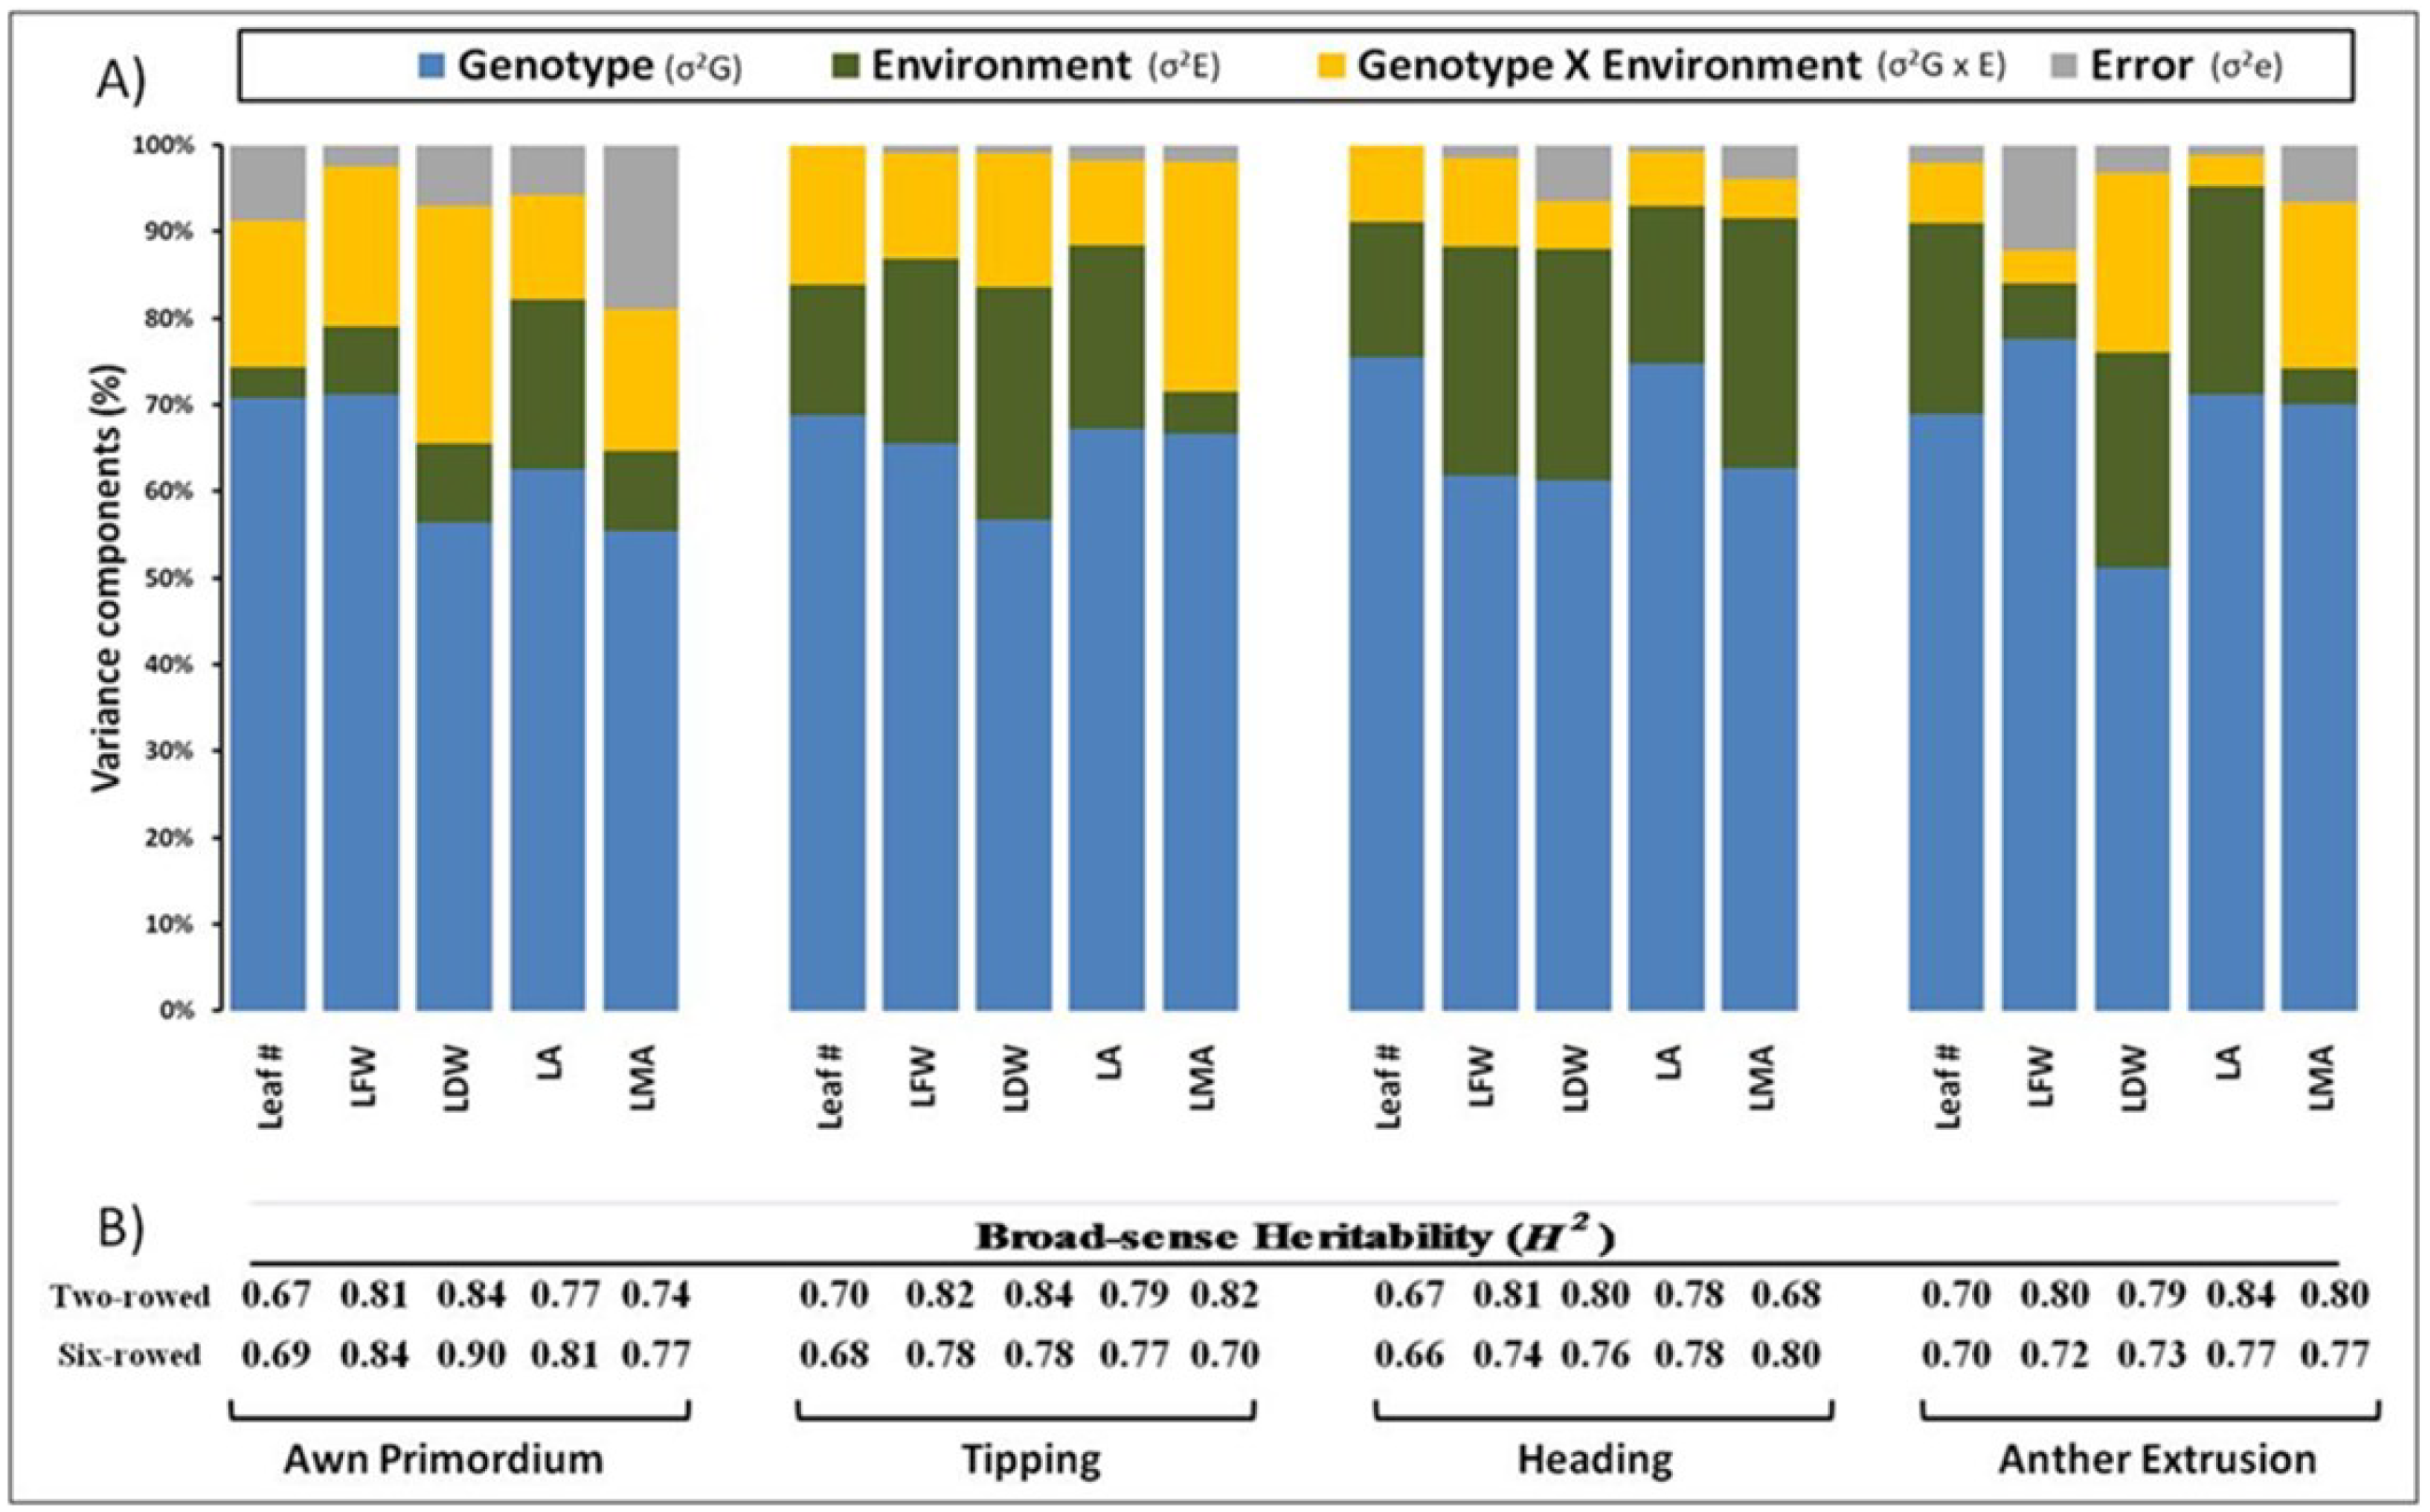
3.3. Genetic Background and Variance Analysis

One major objective was to estimate variance components and broad-sense heritability (H2) values for different leaf traits under variable growth conditions. Interestingly, all heritability values across growth conditions obtained for leaf traits were above 0.65 in small LA (two-rowed) and large LA (six-rowed), suggesting that these traits are predominantly genetically controlled (Figure 2). Rebetzke et al. [38] reported that heritability values for estimated LA per plant in wheat (30 genotypes) and barley (three genotypes) at an early stage (four leaves stage) of development under different conditions (GH and field) was approximately 0.90. In a study conducted by Rasmusson [13], LA heritability only ranged from 0.24 to 0.37 in three barley populations. One reason for the discrepancy between our findings and those of Rasmusson [13] may be that we evaluated leaf traits in a diverse collection (different regions and genetic background) under two environmental conditions (GH and field) and at different developmental stages. Evidently the genetic component is the largest component in our diverse collection, and since environmental effects are small, genetic regulation plays a major role in the observed variation. Moreover, it is possible that single plant leaf measurements are more reliable than leaf measurements conducted in dense stands (i.e., canopy or plot situation) [39]. For example, LA components in alfalfa plants significantly differ as a direct result from stand density and light competition [40]. Similar factors may be in play for barley plants grown under light competition in a field-plot situation, thus, creating variable environmental factors (light competition and shading) that cause shoot and leaf growth variation. Therefore, estimating the genetic components of leaf traits is more accessible under controlled conditions using single plants [39].
Our results show that measured leaf traits are mainly genetically determined and less affected by environment. For instance, LMA was affected by many factors (within species or/and environments) for which a large part of the variation was still unaccounted [3]. In the literature, the heritability value for LMA is low and is considered as a complex trait, and understanding the genetic factors underlying this trait has been unsuccessful to date. In the present study, we found that LMA was predominantly genetically controlled (H2 ≥ 0.68), which was likely due to our analysis of this trait under different environments in a diverse collection and at different developmental stages (i.e., experimental design). We also examined whether growth conditions and/or row-type classes affected leaf traits. Leaf traits were generally higher for field-grown plants than for GH-grown plants, which might be due to greater space for root growth and nutrient availability. Results from the present study showed that leaf traits are influenced by growth conditions to a greater extent than phase duration or spike-related traits [30]. In the GH, we tried to minimize environmental effects by randomizing pots several times a week; yet, we still postulate that field conditions at several locations/seasons are important for further leaf trait validation work. Certainly, leaf traits are similarly affected by pot size and/or substrate content in the GH, but CV values under GH conditions were always higher than those of field-grown plants clearly suggesting that single-plants in the GH maximized phenotypic leaf trait expression between accessions and, therefore, are more appropriate for studying phenotypic/genetic variation of leaf traits [39]. Based upon the PCA analysis, leaf traits (PC-1, 48.97%) were major distinguishing features of row-type classes. However, we cannot rule out the effect of germplasm diversity (geographical origins) on phenotypic variation.
In this study, we found significant differences in leaf traits between two- and six-rowed barley, especially LA. Phenotypic differences in LA between row-type classes showing a high heritability value provide an unexplored opportunity to better understand the genetic of LA in barley. Whether the phenotypic differences between row-type classes in LA and other traits may be related to the action of the predominant row-type gene SIX-ROWED SPIKE 1 (Vrs1) is not yet clear. Future research is required to elucidate these relationships in more detail.

4. Conclusions

We found substantial differences for leaf performance traits between two-and six-rowed barley in our study. This impacts future barley breeding programs related to improving both single-plant grain yield and environmental stress adaptation. Further work is needed to understand genetic factors related to optimum LA, which increases grain yield and environmental adaptation.

5. Materials and Methods

5.1. Plant Material

Thirty-two diverse barley accessions were grown under three independent growth conditions during the 2012 growing season at the Leibniz Institute of Plant Genetics and Crop Plant Research (IPK) in Gatersleben, Germany (51°49′23″ N, 11°17′13″ E, altitude 112 m). GH was used as a controlled condition for barley planted into pots, whereas the other two growth conditions were conducted under field conditions: (i) field planting in pots and (ii) field planting in soil. The weather information is provided in Table 3 for field and GH growth conditions. In this study, we used 32 diverse spring barley accessions (14 two-rowed and 18 six-rowed; Table 4) from different geographical origins. Most of the two-rowed barleys were from Europe, while most of the six-rowed barleys were from the Americas and East Asia. The 32 accessions were selected out of 150 world-wide spring barley collections based on their performance and variation in some interesting traits, such as LA under GH conditions. More information about the germplasm status and origins of accessions are presented in Table 4. Detailed information is available from the IPK genbank website http://gbis.ipk-gatersleben.de/GBIS_I/.

5.2. Growth Environment and Experimental Procedure

Thirty seeds for each of the 32 spring barley accessions were sown on 1 April, 2012, for all growth conditions. Under GH growth conditions, seeds germinated under controlled conditions (long-day (LD), 16/8 h day/night and ~20/~16 °C day/night) for 10 days. All seedlings were vernalized for 28 days at ~4 °C to be consistent with plants grown under field conditions and to promote plants for flowering and producing seeds. Seedlings were transferred to a hardening period (7 days) for gradual acclimatization (12/12 h and ~14/~12 °C, day/night, respectively). One plant per 0.5 L pot (9 cm × 9 cm diameter and height) was grown under GH conditions (LD, 16/8 h and ~20/~16 °C) with potting medium structure substrate (Substrat 2, Klasmann-Deilmann GmbH, 49744 Geeste, Germany) with 14:16:18/Nitrogen (N): Phosphorous (P): Potassium (K) and pH 6.5. Manual irrigation was performed daily as required, and 1.5 g (17:11:10/N:P:K) fertilizer was added to each pot. Supplemental light (~300 μmolm−2·s−1 PAR = 159 W/m2) extended natural light via low intensity incandescent lamps (Philips son-t agro 400 w). Pots were randomized three times per week to minimize border and temperature gradient effects on growth and development.
Table 3. Monthly average temperature (°C), precipitation (mm), relative humidity (%), and global solar radiation in the field and greenhouse during the 2012 growing season at IPK.
MonthFieldGreenhouse
Temperature °CRainfall (Mm)Relative Humidity (%)Global Solar Radiation (W/M2)Temperature °CRelative Humidity %
April8.817.475.81579.372.9
May15.048.773.016114.371.7
Jun15.672.480.317518.877.2
July18.193.478.719419.775.9
August18.738.175.319420.072.6
Greenhouse-grown plants were maintained for 10 days at 20 °C for germination, for 28 days at 4 °C for vernalization, for 7 days at 14 °C for hardening, and under normal greenhouse growth conditions at 20 ± 1 °C until harvest. The planting date for all growth conditions was April 1st 2012.
Two field (open field) growth conditions were used in this study: (i) pot-grown field plants and (ii) soil-grown field plants. In pot-grown field planting conditions, one plant per pot was grown in each 0.5 L pot, which had the same potting substrate and fertilizer as mentioned for the GH growth condition. For soil-grown planting conditions, 30 plants per accession (10 plants per row; 50 cm long with 20 cm between rows (100 plants/m2)) were directly grown in silty loam soil (14:78:85:1:7/P:K: Magnesium (Mg):Boron (B):Iron (Fe) and pH 7). We selected this planting density to be consistent with GH and pot-grown field conditions. Fertilizer was evenly distributed (15 grams of 17:11:10/N:P:K) to each row. In field-grown plants (pots and soil), each accession was randomly replicated in three rows. Rows were manually irrigated when required and to be in consistent with GH conditions. Under all growth conditions, the plants were grown as a single plant stand with a border to eliminate light and temperature-gradient effects on growth and development. Weeds were controlled manually in all growth conditions.
Table 4. Spring barley accessions according to row-type, name, germplasm status, and origin.
No.NameGermplasm StatusOriginNameGermplasm StatusOrigin
Six-RowedTwo-Rowed
1BCC1453CultivarFinlandBCC1497LandraceKyrgyzstan
2HOR2835LandraceIranBCC1541CultivarYugoslavia
3BCC1494LandraceKazakhstanBCC869CultivarMexico
4BCC579CultivarIndiaHOR8006LandraceTurkey
5BCC219LandraceTajikistanBarkeCultivarGermany
6BCC447CultivarChinaBCC1566LandraceGreece
7BCC719CultivarKoreaBCC1589LandraceItaly
8MorexCultivarUSATriumphCultivarGermany
9BCC814Breeder lineUSABCC801CultivarCanada
10BCC818CultivarUSAProctorCultivarUK
11BCC718CultivarKoreaBCC1370CultivarFrance
12BCC551CultivarIndiaBCC1371CultivarFrance
13BCC577CultivarIndiaBCC903LandraceAfghanistan
14BCC888CultivarCanadaWeeahCultivarAustralia
15BCC942CultivarUSA
16BCC875CultivarUSA
17BCC921CultivarColombia
18BCC868Breeder lineMexico

5.3. Data Recording and Experimental Design

Only completely unfolded and fully developed leaf blades from the main culm were counted and harvested by hand (all leaves together) to measure leaf fresh weight immediately (g) (Sartorius AC 1215, Sartorius weighting technology GmbH, Gottingen, Germany). We identified the main culm as the strongest and most developmentally advanced culm. Main culm leaf blade area, LA (mm2), was measured immediately by an LA-meter (portable Li-COR area meter, Li-3000) [41]. Leaf blades were oven dried at 40 °C for 10 days (Heraeus, Kelvitron@, Helmut singer elektronik GmbH, Germany) to measure main culm leaf blade dry weight LDW (mg). LMA per main culm was calculated as:
L M A =   LDW x LA x
where LMA is leaf blade mass area (mg/mm2), LDW is leaf blade dry weight (mg), and LA is leaf blade area (mm2) at stage x [41]. Growth rate for LFW per thermal time unit (LFWGR) was calculated at stage x as follows:
L F W G R = LFW x ° C × D x
where LFWGR is leaf blade fresh weight growth rate (g/°C × D), LFW is leaf blade fresh weight (g), and °C × D is the required thermal time at stage x. The same method was used to calculate LDW growth rate (LDWGR) and leaf blade area growth rate (LAGR, mm2/°C × D). Leaf blade dry matter content (LDMC, mg/g) is the oven-dry weight (mg) of the leaf blade divided by its fresh weight (g) [41]. Thermal time or growing degree-days (°C × D, GDD) was calculated as the mean of the daily maximum and minimum air temperature using 0 °C as a base temperature.
Data were recorded at five major developmental stages: awn primordium (AP, maximum yield potential) Alqudah and Schnurbusch [30], tipping (TIP, Z49, top awns apparent), heading (HD, Z55, half spike emerged), anther extrusion (AE, Z65, anthers apparent), and harvest [34]; Details about these stages were previously reported by Alqudah and Schnurbusch [30]. Data were recorded when at least 50% of the main culm spikes in each accession reached each stage. Three biological replicates per accession were randomly selected from the center of the row to avoid border effect for data collection at the first four developmental stages, and six plants were used to collect data at harvest. Manual plant dissections were required to determine AP via microscopy (Stereo Microscope Stemi 2000-C with KL 1500 LCD; Axio Vision, 4.8.2, ZEISS Germany).
Six biological replicates per accession were randomly hand harvested to collect biological yield (BY; determined by weighing the total air-dried aboveground parts). Single-plant grain yield and yield components were measured by counting the number of grains per main spike as well as the tiller and spike number per plant. Main spike dry weight (MSDW) and total grain weight per main spike after hand threshing were measured. Harvest index (HI) per plant was measured as the ratio of grain weight per plant to BY per plant multiplied by one hundred. Growth conditions were arranged in a completely randomized design with three replicates and each growth condition included border plants that were not sampled.

5.4. Data Analyses

Analysis of variance (ANOVA) was conducted to compare spike row-type classes between growth conditions and to compare row-type across growth conditions using SAS for Windows ver. 9.3 (SAS Institute Inc., Cary, NC, USA) (p ≤ 0.05). Means were separated according to the Fisher’s Least Significant Difference (LSD) at 0.05 levels of probability. Pearson’s correlation coefficient was calculated for phenotyped traits using PROC CORR [42] at p ≤ 0.05. Variance components were estimated by considering the genotype × growth condition. Broad-sense heritability (H2) was estimated for overall growth conditions according to Snedecor and Cochran [43] using PROC VARCOMP [42]:
H 2 = σ 2 g ( σ 2 g + σ 2 g × gw / e + σ 2 e / re )
where σ 2 g is variance of genotypes; σ 2 g ·gw is the variance component of the interaction genotype × growth condition, r indicates replicates, and e the error.
Principal Component Analysis (PCA) based on phenotypic correlations of accession means values for each selected trait under each growth condition was calculated using GENSTAT for Windows version 16 (VSN International, Hemel Hempstead, UK). A two-dimensional PCA was calculated as multivariate analysis to interpret and summaries phenotypic clusters/variations among growth conditions and/or row-type classes of barley by accessions by LA, LDW, and LMA at different growth stages [44]. PCA is an indicator ordination tool for obtaining multivariate data that can be explored visually in a two-dimensional PCA correlation. Coefficients of variation (CV) for individual trait were calculated as a percentage of standard deviation to the trait mean by GenStat [44]. CV was calculated to compare individual leaf trait variations within growth conditions between accessions.

Acknowledgments

The authors thank Benjamin Kilian and Leibniz Institute of Plant Genetics and Crop Plant Research (IPK) Genebank for providing barley germplasm. We acknowledge Annett Beyer for excellent technical assistance and IPK gardeners for their help during the work. We also thank Ravi Koppolu for critically reading of the manuscript. This study was funded by the DFG (Deutsche Forschungs Gemeinschaft) grant number SCHN 768/4-1 and BMBF (German Federal Ministry of Education and Research) GABI-FUTURE Start Program grant number 0315071 to TS.

Author Contributions

Ahmad M. Alqudah carried out all experimental work and analyzed the data. Thorsten Schnurbusch conceived the project, designed experiments, and supervised the experimental work. Both authors contributed to writing the article.

Abbreviations

AP
Awn Primordium
AE
Anther Extrusion
BY
Biological Yield
CV
Coefficients of Variation
GDD or °C * D
Growing Degree Days or Thermal Time
GH
Greenhouse
HI
Harvest Index
HD
Heading
H2
Broad-sense Heritability
LA
Leaf Area
LAGR
Leaf Area Growth Rate
LDMC
Leaf Dry Matter Content
LDW
Leaf Dry Weight
LDWGR
Leaf Dry Weight Growth Rate
LFWGR
Leaf Fresh Weight Growth Rate
LMA
Leaf Mass Area
MSDW
Main Spike Dry Weight
PCA
Principle component analysis
TIP
Tipping

Conflicts of Interest

The authors declare no conflict of interest.

References

  1. Aase, J.K. Relationship between leaf area and dry-matter in winter-wheat. Agron. J. 1978, 70, 563–565. [Google Scholar] [CrossRef]
  2. Witkowski, E.T.F.; Lamont, B.B. Leaf specific mass confounds leaf density and thickness. Oecologia 1991, 88, 486–493. [Google Scholar] [CrossRef]
  3. Poorter, H.; Niinemets, U.; Poorter, L.; Wright, I.J.; Villar, R. Causes and consequences of variation in leaf mass per area (LMA): A meta-analysis. New Phytol. 2009, 182, 565–588. [Google Scholar] [CrossRef] [PubMed]
  4. Lambers, H.; Poorter, H. Inherent variation in growth-rate between higher-plants—A search for physiological causes and ecological consequences. Adv. Ecol. Res. 1992, 23, 187–261. [Google Scholar]
  5. Westoby, M.; Falster, D.S.; Moles, A.T.; Vesk, P.A.; Wright, I.J. Plant ecological strategies: Some leading dimensions of variation between species. Annu. Rev. Ecol. Syst. 2002, 33, 125–159. [Google Scholar] [CrossRef]
  6. Van Oosterom, E.J.; Acevedo, E. Leaf area and crop growth in relation to phenology of barley in mediterranean environments. Plant Soil 1993, 148, 223–237. [Google Scholar] [CrossRef]
  7. Tesarová, J.; Nátr, L. Phyllochron and winter barley leaf growth rate. Biol. Plant 1990, 32, 450–459. [Google Scholar] [CrossRef]
  8. Zhao, D.L.; Atlin, G.N.; Bastiaans, L.; Spiertz, J.H.J. Cultivar weed-competitiveness in aerobic rice: Heritability, correlated traits, and the potential for indirect selection in weed-free environments. Crop Sci. 2006, 46, 372–380. [Google Scholar] [CrossRef]
  9. Coleman, R.K.; Gill, G.S.; Rebetzke, G.J. Identification of quantitative trait loci for traits conferring weed competitiveness in wheat (Triticum aestivum L.). Aust. J. Agric. Res. 2001, 52, 1235–1246. [Google Scholar] [CrossRef]
  10. Jennings, P.R. Plant type as a rice breeding objective. Crop Sci. 1964, 4, 13–15. [Google Scholar] [CrossRef]
  11. Donald, C.M. The breeding of crop ideotypes. Euphytica 1968, 17, 385–403. [Google Scholar] [CrossRef]
  12. Peng, S.B.; Khush, G.S.; Virk, P.; Tang, Q.Y.; Zou, Y.B. Progress in ideotype breeding to increase rice yield potential. Field Crops Res. 2008, 108, 32–38. [Google Scholar] [CrossRef]
  13. Rasmusson, D.C. An evaluation of ideotype breeding. Crop Sci. 1987, 27, 1140–1146. [Google Scholar] [CrossRef]
  14. Yoshida, S. Physiological aspects of grain yield. Annu. Rev. Plant Physiol. 1972, 23, 437–464. [Google Scholar] [CrossRef]
  15. Fenta, B.A.; Beebe, S.E.; Kunert, K.J.; Burridge, J.D.; Barlow, K.M.; Lynch, J.P.; Foyer, C.H. Field phenotyping of soybean roots for drought stress tolerance. Agronomy 2014, 4, 418–435. [Google Scholar] [CrossRef]
  16. Bertholdsson, N.-O. Screening for barley waterlogging tolerance in nordic barley cultivars (Hordeum vulgare L.) using chlorophyll fluorescence on hydroponically-grown plants. Agronomy 2013, 3, 376–390. [Google Scholar] [CrossRef]
  17. Fujita, D.; Trijatmiko, K.R.; Tagle, A.G.; Sapasap, M.V.; Koide, Y.; Sasaki, K.; Tsakirpaloglou, N.; Gannaban, R.B.; Nishimura, T.; Yanagihara, S.; et al. Nal1 allele from a rice landrace greatly increases yield in modern indica cultivars. Proc. Natl. Acad. Sci. USA 2013, 110, 20431–20436. [Google Scholar]
  18. Khush, G. Breaking the yield frontier of rice. GeoJournal 1995, 35, 329–332. [Google Scholar] [CrossRef]
  19. Berdahl, J.D.; Rasmusson, D.C.; Moss, D.N. Effects of leaf area on photosynthetic rate, light penetration, and grain yield in barley. Crop Sci. 1972, 12, 177–180. [Google Scholar] [CrossRef]
  20. Gallagher, J.N.; Biscoe, P.V. Radiation absorption, growth and yield of cereals. J. Agric. Sci. 1978, 91, 47–60. [Google Scholar] [CrossRef]
  21. Jiang, D.; Fang, J.; Lou, L.; Zhao, J.; Yuan, S.; Yin, L.; Sun, W.; Peng, L.; Guo, B.; Li, X. Characterization of a null allelic mutant of the rice nal1 gene reveals its role in regulating cell division. PLoS ONE 2015, 10, e0118169. [Google Scholar] [CrossRef] [PubMed]
  22. Driever, S.M.; Lawson, T.; Andralojc, P.J.; Raines, C.A.; Parry, M.A.J. Natural variation in photosynthetic capacity, growth, and yield in 64 field-grown wheat genotypes. J. Exp. Bot. 2014, 65, 4959–4973. [Google Scholar] [CrossRef] [PubMed]
  23. Richards, R.A. Manipulation of leaf-area and its effect on grain-yield in droughted wheat. Aust. J. Agric. Res. 1983, 34, 23–31. [Google Scholar] [CrossRef]
  24. Jamieson, P.D.; Martin, R.J.; Francis, G.S.; Wilson, D.R. Drought effects on biomass production and radiation-use efficiency in barley. Field Crops Res. 1995, 43, 77–86. [Google Scholar] [CrossRef]
  25. Miralles, D.; Slafer, G. Radiation interception and radiation use efficiency of near-isogenic wheat lines with different height. Euphytica 1997, 97, 201–208. [Google Scholar] [CrossRef]
  26. Morgan, J.A.; LeCain, D.R.; Wells, R. Semidwarfing genes concentrate photosynthetic machinery and affect leaf gas exchange of wheat. Crop Sci. 1990, 30, 602–608. [Google Scholar]
  27. Reynolds, M.P.; van Ginkel, M.; Ribaut, J.M. Avenues for genetic modification of radiation use efficiency in wheat. J. Exp. Bot. 2000, 51, 459–473. [Google Scholar] [CrossRef] [PubMed]
  28. Kemanian, A.R.; Stöckle, C.O.; Huggins, D.R. Variability of barley radiation-use efficiency. Crop Sci. 2004, 44, 1662–1672. [Google Scholar] [CrossRef]
  29. Forster, B.P.; Franckowiak, J.D.; Lundqvist, U.; Lyon, J.; Pitkethly, I.; Thomas, W.T.B. The barley phytomer. Ann. Bot. 2007, 100, 725–733. [Google Scholar] [CrossRef] [PubMed]
  30. Alqudah, A.M.; Schnurbusch, T. Awn primordium to tipping is the most decisive developmental phase for spikelet survival in barley. Funct. Plant Biol. 2014, 41, 424–436. [Google Scholar] [CrossRef]
  31. Badr, A.; Muller, K.; Schafer-Pregl, R.; El Rabey, H.; Effgen, S.; Ibrahim, H.H.; Pozzi, C.; Rohde, W.; Salamini, F. On the origin and domestication history of barley (Hordeum vulgare L.). Mol. Biol. Evol. 2000, 17, 499–510. [Google Scholar] [CrossRef] [PubMed]
  32. Zohary, D.; Hopf, M. Domestication of Plants in the Old World; Oxford University Press: Oxford, UK, 2000. [Google Scholar]
  33. Komatsuda, T.; Pourkheirandish, M.; He, C.; Azhaguvel, P.; Kanamori, H.; Perovic, D.; Stein, N.; Graner, A.; Wicker, T.; Tagiri, A.; et al. Six-rowed barley originated from a mutation in a homeodomain-leucine zipper I-class homeobox gene. Proc. Natl. Acad. Sci. USA 2007, 104, 1424–1429. [Google Scholar] [CrossRef] [PubMed]
  34. Zadoks, J.C.; Chang, T.T.; Konzak, C.F. A decimal code for the growth stages of cereals. Weed Res. 1974, 14, 415–421. [Google Scholar] [CrossRef]
  35. Curtis, E.M.; Leigh, A.; Rayburg, S. Relationships among leaf traits of Australian arid zone plants: Alternative modes of thermal protection. Aust. J. Bot. 2012, 60, 471–483. [Google Scholar] [CrossRef]
  36. Alqudah, A.M.; Sharma, R.; Pasam, R.K.; Graner, A.; Kilian, B.; Schnurbusch, T. Genetic dissection of photoperiod response based on gwas of pre-anthesis phase duration in spring barley. PLoS ONE 2014, 9, e113120. [Google Scholar] [CrossRef] [PubMed] [Green Version]
  37. Sadras, V.O.; Denison, R.F. Do plant parts compete for resources? An evolutionary viewpoint. New Phytol. 2009, 183, 565–574. [Google Scholar] [CrossRef] [PubMed]
  38. Rebetzke, G.J.; Botwright, T.L.; Moore, C.S.; Richards, R.A.; Condon, A.G. Genotypic variation in specific leaf area for genetic improvement of early vigour in wheat. Field Crops Res. 2004, 88, 179–189. [Google Scholar] [CrossRef]
  39. Fasoula, D.A.; Fasoula, V.A. Competitive ability and plant breeding. In Plant Breeding Reviews; Janick, J., Ed.; John Wiley & Sons, Inc.: Oxford, UK, 1996; pp. 90–138. [Google Scholar]
  40. Baldissera, T.C.; Frak, E.; Carvalho, P.C.; Louarn, G. Plant development controls leaf area expansion in alfalfa plants competing for light. Ann. Bot. 2014, 113, 145–157. [Google Scholar] [CrossRef] [PubMed]
  41. Perez-Harguindeguy, N.; Diaz, S.; Garnier, E.; Lavorel, S.; Poorter, H.; Jaureguiberry, P.; Bret-Harte, M.S.; Cornwell, W.K.; Craine, J.M.; Gurvich, D.E.; et al. New handbook for standardised measurement of plant functional traits worldwide. Aust. J. Bot. 2013, 61, 167–234. [Google Scholar] [CrossRef]
  42. SAS. The Statistical Analysis Software (SAS) for Windows; Version 9.3; SAS Institute Inc: Cary, NC, USA, 2013. [Google Scholar]
  43. Snedecor, G.W.; Cochran, W.G. Statistical Methods, 7th ed.; Iowa State University Press: Ames, IA, USA, 1980. [Google Scholar]
  44. GenStat. Genstat for Windows; Version 16; VSN International: Hemel Hempstead, UK, 2013. [Google Scholar]

