1. Introduction
Hexaploid bread wheat (
Triticum aestivum L. ssp.
aestivum) grain is mostly processed into flour for baking and confectionery goods, and, to a smaller extent, into flour for the production of pasta and dumplings. The grain of tetraploid durum wheat (
T. turgidum ssp.
durum (Desf.) Husn.) is used mainly in the production of pasta and couscous [
1]. The growing interest in healthy foods has contributed to the revival of ancient wheats. One of them is einkorn (
T. monococcum L. ssp.
monococcum), a diploid species that is abundant in protein, unsaturated fatty acids, lutein, and essential minerals, mainly zinc and iron [
2]. The popularity of other tetraploid wheats: emmer (
T. turgidum L. ssp.
dicoccum (Schrank ex Schübl.) Thell.) and Polish wheat (
T. turgidum L. ssp.
polonicum (L.) Thell.) and hexaploid spelt (
T. aestivum L. ssp.
spelta (L.) Thell.), is also on the rise. The renewed interest in relict wheat species can be attributed to the fact that their grain is considered to be a functional food.
Long-term selection of bread and durum wheat, combined with genetic drift (random fluctuations in the number of gene alleles in a population) and the bottleneck effect (reduced population size due to sudden environmental events) have contributed to a considerable loss of genetic variation in these species [
3,
4]. On the other hand, relict wheats are characterized by a rich gene pool [
5,
6] which improves pathogen resistance. Fungal pathogens that synthesize mycotoxins that contaminate food products pose the greatest threat for human and animal health.
Alternaria alternata (Fr.) Keiss. and selected
Fusarium species are the most ubiquitous toxin-producing pathogens of wheat grain. These fungi produce various pigments that can affect the color of the grain pericarp and the embryo [
7,
8]. The presence of these pathogens could be easily detected on the surface of wheat grain by digital image analysis.
The grain of
Triticum species other than bread wheat requires complex processing technologies, and it is used in the production of various foods [
9,
10,
11], which is why it should not come into contact with bread wheat grain during market operations. A reliable analysis of the morphometric parameters of grain can facilitate the development of effective tools for rapid and non-invasive quality control of consumer grain and seed material. The laws of the European Union [
12], introduce increasingly stringent microbiological quality standards for foods, which has spurred the search for rapid, accurate and low-cost systems for monitoring plant materials during processing [
13,
14]. The EyeFoss
TM (FOSS Analytical, Höganäs, Sweden) image analyzer is one of such systems. The device has been implemented in the food processing sector to eliminate subjectivity from quality assessments of sprouted wheat grain, weed seeds, unmillable material, and grain defects (insect damage, mold or germ damage) [
15]. Traditional grain sorting and evaluation methods rely on sensory analyses, they are laborious and time-consuming, and the results are always burdened with a certain degree of error [
16]. Digital image analysis can considerably facilitate these processes, and it has presently been used for plant phenotyping [
17]. The first studies examining this analytical technique were conducted to verify the varietal identity of wheat kernels based on their shape and color descriptors [
18,
19] and to identify non-wheat components separated from wheat grain samples [
20]. In the following years, digital image analysis was successfully used to evaluate the damage caused by insects on the surface of wheat grain [
21] and to assess the health of maize grain [
22]. Image analysis is also applied to assess the severity of fungal infections of leaves [
23,
24]. However, wheat grain infections have been rarely studied by digital image analysis [
25,
26]. Ahmad et al. [
27] relied on image processing to discriminate healthy, diseased, and immature fruit seeds and cereal grain. The color of soybean seeds was described with 88% accuracy. Recently, Leplat et al. [
28] successfully used computer-assisted image analysis to evaluate FHB (Fusarium Head Blight) symptoms on the surface of wheat grain. This approach could decrease the demand for expensive chromatographic analyses of the most prevalent mycotoxin, deoxynivalenol (DON), because it supports analyses of wheat grain already at the soft dough stage [
28]. Research has also demonstrated that digital image analysis is a useful technique for discriminating the grain of different bread wheat varieties [
29], bread wheat, and spelt hybrids and their parental forms [
30], and the seeds of red clover varieties [
31]. Ropelewska et al. [
32] relied on digital image analysis to discriminate rapeseed varieties, and Chaugule and Mali [
33]—to confirm the identity of rice varieties. Seed shape can be estimated on the basis of shape descriptors, diverse indexes, or by comparison with geometric figures (
J index) where the description of the seed shape is based on percentage of similarity to a certain object. To get a more detailed review, see Cervantes et al. [
34].
Digital image analysis software allows users to analyze hundreds of digital images per hour with a high degree of automation. Digital images are processed to eliminate defects such as: (1) geometric distortion, (2) poor contrast, (3) image noise, (4) uneven illumination. The analysis is preceded by image segmentation, during which regions of interest (ROI) are separated from the background [
35]. The segmentation involves filtering and thresholding procedures [
36,
37]. Large datasets relating to the shape and color of the analyzed objects should be minimized [
36].
In the images captured with a digital camera, color is represented by three primary colors: red, green, and blue, which are combined on the screen. Each sensor records a specific single color. The real color of an individual pixel is acquired with the use of an interpolation algorithm, which compares a pixel with the color information that is extracted from the neighboring pixels to estimate its actual color. The interpolation algorithm relies on the red, green and blue (
RGB) model to depict the original color. The color of a pixel is described by hue, saturation, and intensity (
HSI), where hue denotes the “pure” pixel color, saturation indicates the amount of color, and intensity describes a pixel’s brightness [
38]. Variations in light and color have to be avoided during image analysis, especially in experiments where measurements have to be automated. Moreover, low saturation and intensity can disrupt the segmentation process [
39]. Resolution and image compression also influence image quality [
40]. Image resolution affects data storage space, and the acquired images are large files. File size and resolution can be reduced, but this could affect the quality of the image [
38].
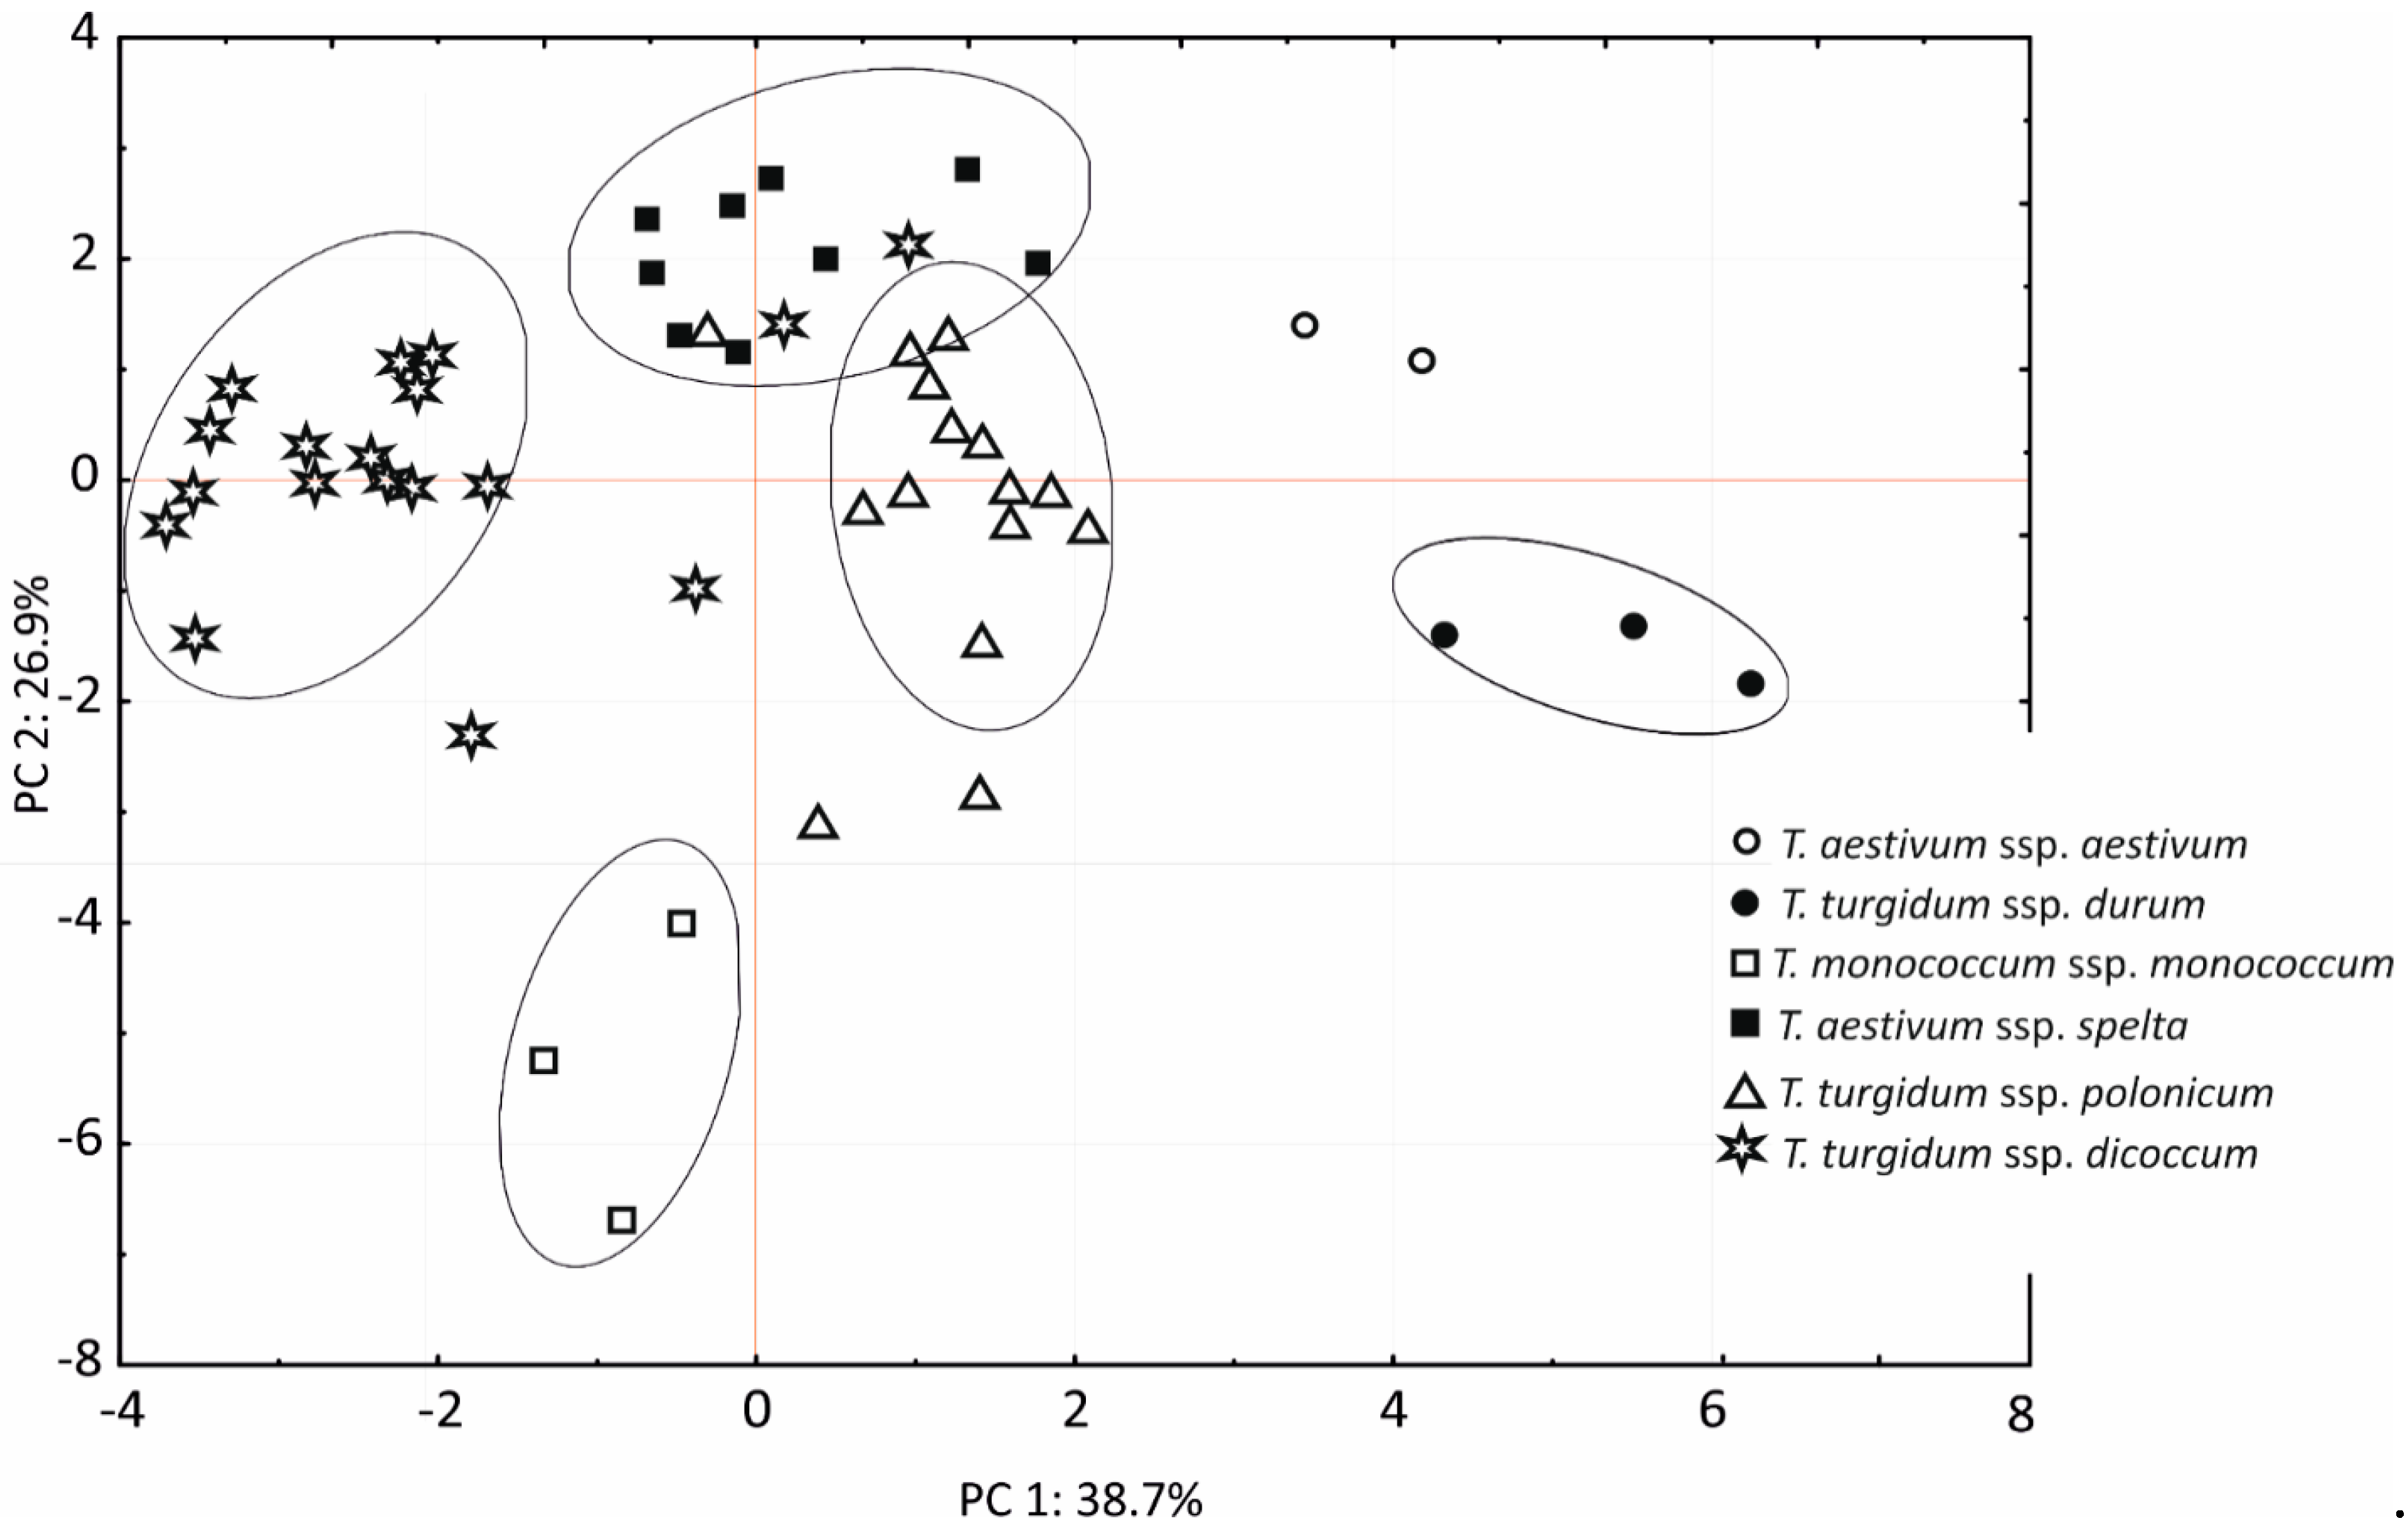
The aim of this study was to discriminate six Triticum taxa based on the shape and color descriptors of kernel images. The grain was also analyzed to determine whether the presence of pathogenic fungi can influence the color of kernels. The results were processed by principal component analysis (PCA) and hierarchical clustering. The presence of fungal pathogens on wheat grain can be evaluated by image processing based on grain color, which supports a quick assessment of grain quality. Image analysis is a highly promising tool for evaluating the health status of wheat grain and forecasting the results of decision support tools. To the best of the authors’ knowledge, there are no comprehensive studies which rely on the above approach to detect multiple biotic stressors in wheat grain. The growing demand for healthy wheat-based foods of high quality should encourage food producers to use effective and inexpensive methods in the process of screening for the best raw materials.
2. Materials and Methods
The experimental material comprised the grain of six spring wheat taxa: bread wheat (T. aestivum ssp. aestivum, Taa, two lines), spelt (T. aestivum L. ssp. spelta, Tas, nine lines), durum wheat (T. turgidum ssp. durum, Ttdu, three lines), Polish wheat (T. turgidum L. ssp. polonicum, Ttp, 17 lines), emmer (T. turgidum ssp. dicoccum, Ttdi, 23 lines) and einkorn (T. monococcum ssp. monococcum, Tmm, three lines). All lines were reproduced at the Department of Plant Breeding and Seed Production of the University of Warmia and Mazury in Olsztyn, Poland. The lines were obtained by the reproduction of accessions obtained from National Centre for Plant Genetic Resources (NCPGR), Radzików, Poland, National Plant Germplasm System (NPGS), USA, Leibniz Institute of Plant Genetics and Crop Plant Research (IPK) in Gatersleben, Germany. A field experiment was conducted in 2014/2015 in the Agricultural Experiment Station in Bałcyny (53°36′ N, 19°51′ E), Poland. Plots with an area of 9 m2 each were established on soil typically used for wheat cultivation. The preceding crop was a mixture of cereals and legumes. Before sowing, plots were fertilized with 20/70/95 kg N/P2O5/K2O ha−1. The second rate of the N fertilizer was applied in May at 20 kg ha−1. All wheats were sown at a rate of 400 germinating kernels per m2. The grains of wheat species were subjected to shape and color analysis, and then analyzed for fungal presence.
2.1. Image Analysis
Digital images were acquired with a flatbed CCD scanner (Epson Perfection V370 Photo, Epson, Shinjuku, Tokyo, Japan) with a true optical resolution of 4800 dpi, connected to a PC with Windows 10. The image analysis was performed with the ImageJ program (v. 1.51h, Laboratory for Optical and Computational Instrumentation, Madison, WI, USA) [
41]. All measurements were carried out in three replications. Each replication consisted of 50 selected randomly kernels, placed on the scanner screen with the crease down. A dark paper background (located above the flatbed scanner) with the predominance of the blue component (
R = 100,
G = 140,
B = 200) was used to increase contrast between the kernel images and the background. Color images at 24-bit with 200 dpi resolution were recorded in BMP (Bitmap Image File) format. At the beginning of image segmentation, a median filter was applied to reduce noise (radius of four pixels, one replication). The color thresholding procedure was performed in an identical manner for all analyzed images, and a lower threshold value was set for the color component
R at 120. This procedure thresholds 24-bit
RGB images based on hue, saturation, and intensity (
HSI), red, green and blue (
RGB),
CIE L*a*b* (expresses color as three numerical values,
L* for the lightness and
a* and
b* for the green–red and blue–yellow color components), or
YUV (
Y is a luminance component while
U and
V are chrominance components). Filter ranges can be set manually, or based on the pixel value components of a user-defined region of interest (experimental). A thresholded image is an
RGB image, not an 8-bit grayscale image. Color images were copied to a new window with uniform black background. The above procedure was performed to generate images for shape and color analyses.
2.2. Shape Analysis
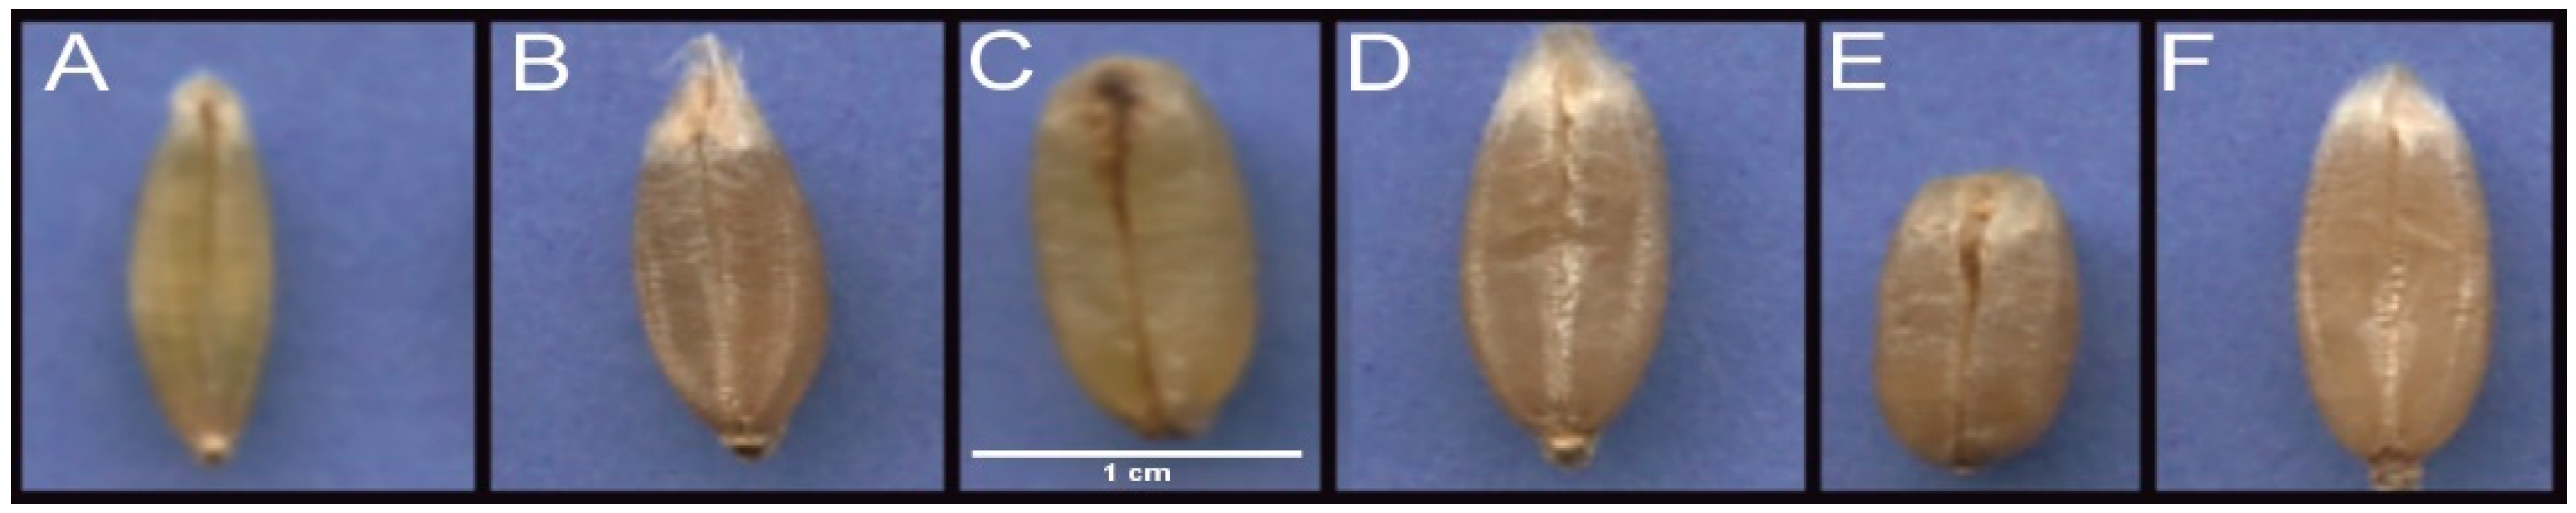
Shape analyses were performed on R-filtered images with the highest contrast between the kernel and the background (
Figure 1). The following descriptors represented by blobs (ROI) were determined in images of individual kernels images: (1) area (mm
2), (2) perimeter (PE) (mm), (3) circularity (CI), (4) Feret diameter (FD), (5) minimal Feret diameter (MFD), (6) aspect ratio (AR), (7) roundness (RO), and (8) solidity (SO) (
Table 1).
2.3. Color Analysis
The 24-bit color images were converted to three 8-bit images in channels
R,
G,
B. The color analysis was conducted based on the average values of variables
R,
G,
B for every ROI, which were later used to calculate the values of
H,
S,
I and
L*a*b*. Parameter
H denotes hue,
S denotes saturation,
I denotes intensity,
L* denotes luminance (100 = white and 0 = black),
a* denotes redness–greenness, and
b* denotes yellowness–blueness. The variables
R,
G,
B were converted to
H,
S,
I and to
L*a*b* according to the formulas proposed by Wiwart et al. [
42]. Color measurements were expressed with parameters
H,
S,
I and
L*a*b*.
2.4. Fungal Colonization of Grain
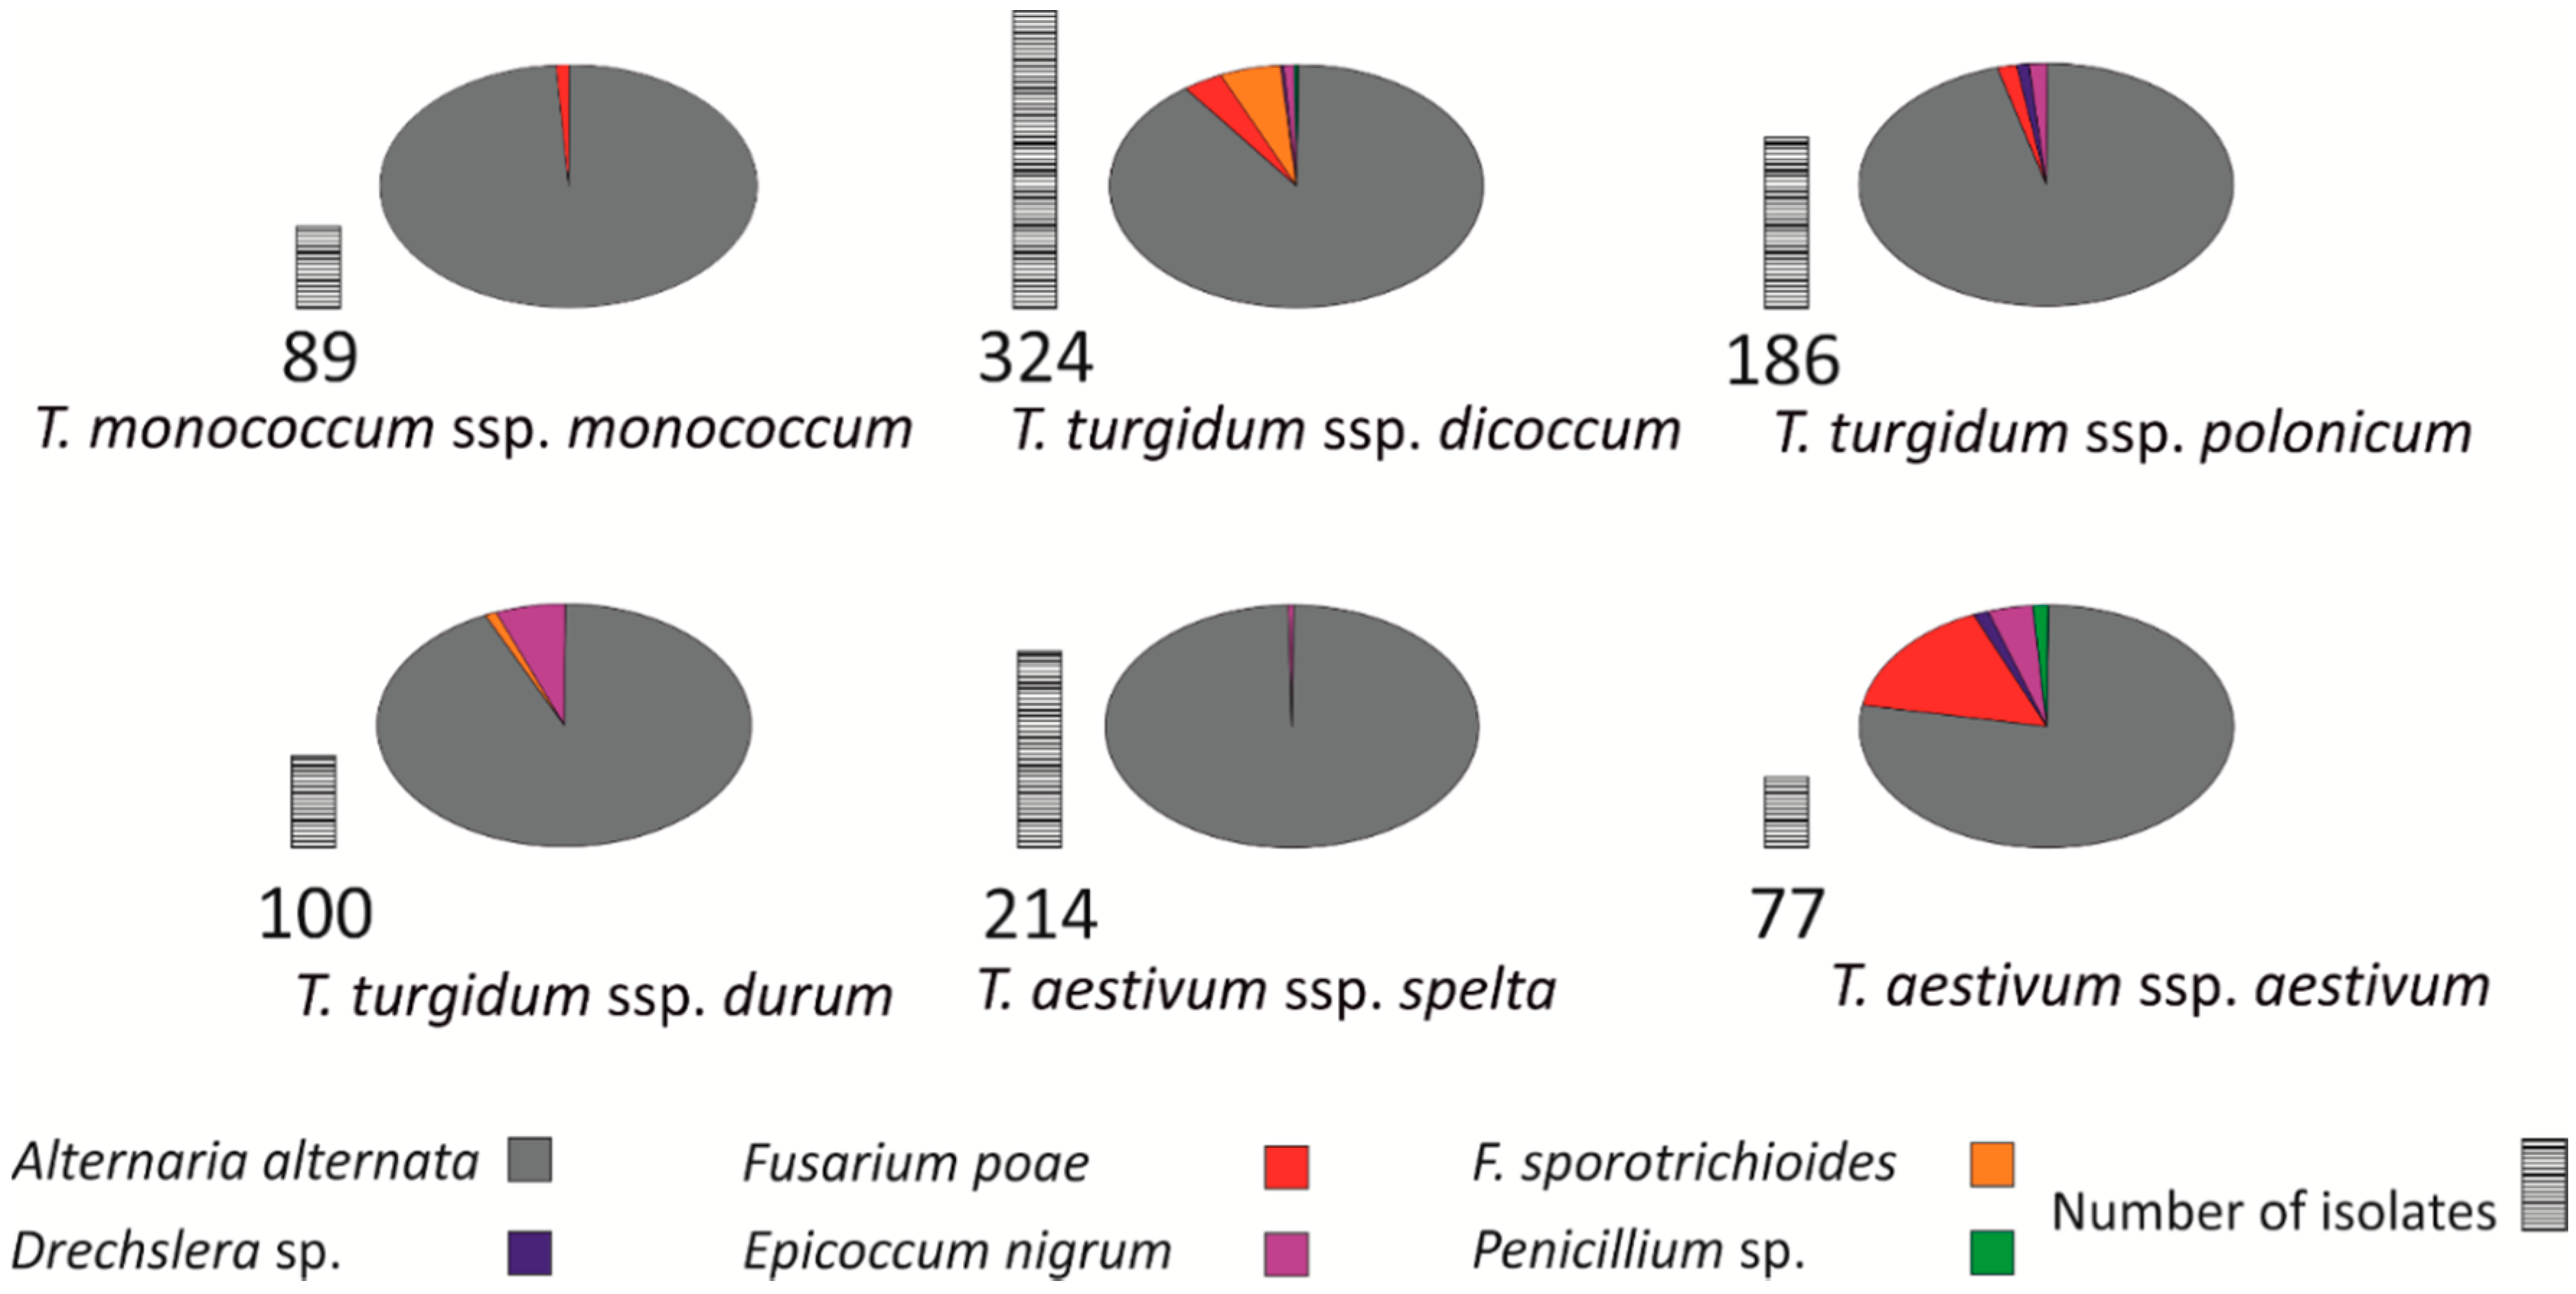
Wheat heads from the field experiment were harvested manually at maturity and threshed. Randomly selected kernels were subjected to image analysis, and 25 kernels from each wheat line were used to determine the prevalence of fungal pathogens in spring wheat grain. Kernels were surface-disinfected in 1% NaOCl (for endophyte counts) for 1 min and placed on potato dextrose agar (PDA, Merck, Warsaw, Poland), pH = 5.5 [
43]. Five kernels from every wheat line were placed on a Petri plate in five replications. The above procedure was performed under sterile conditions. Fungi were transferred to PDA slants and identified based on mycological keys [
44,
45]. Fungi were identified based on a morphological description of spores and mycelia, colony appearance, color, and shape. The number of endophytic fungal colonies was counted after seven days of incubation at 24 °C. Fungal filaments characteristic of the genus
Fusarium were isolated and transferred to individual Petri plates to determine their identity under a light microscope (Nikon Eclipse, Tokyo, Japan). Specimens of fungal filaments were viewed under 400× magnification. Fungal pathogens colonizing the grain of the evaluated wheats were identified to species level to verify the hypothesis that fungal infections can influence grain color.
2.5. Statistical Analysis
The results of image analysis were processed statistically using STATISTICA 12 software StatSoft Polska, Cracow, Poland) [
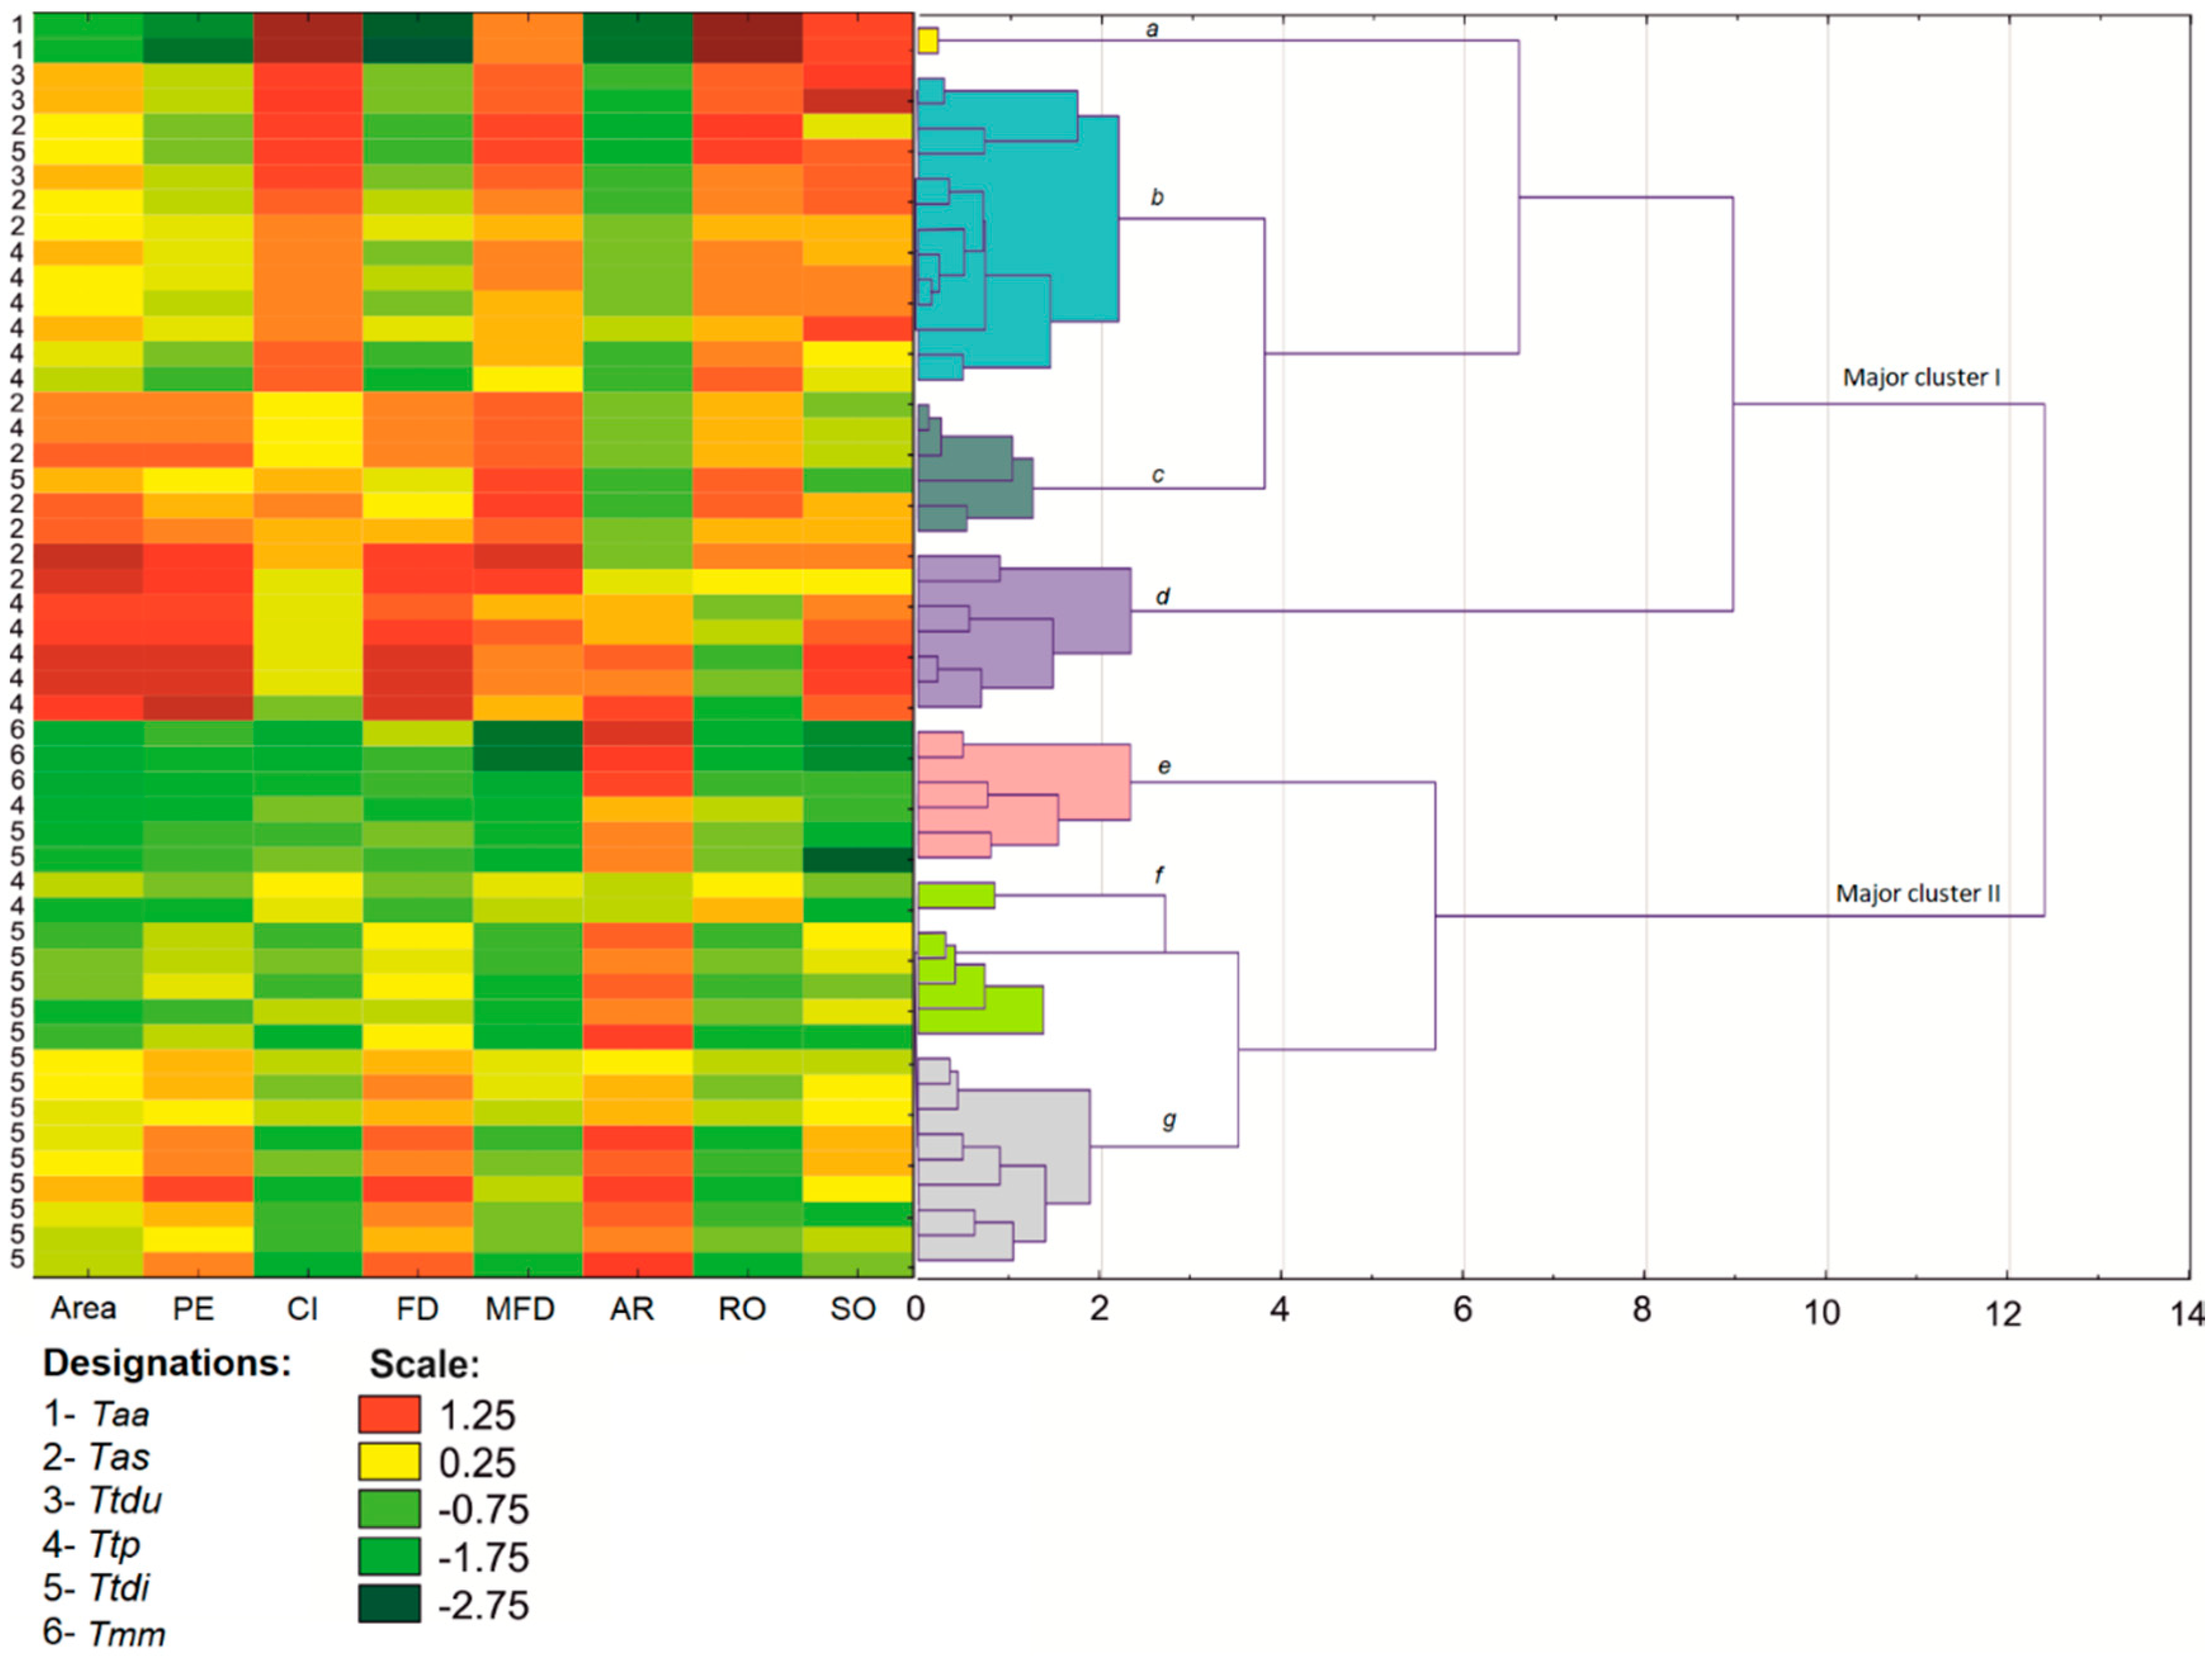
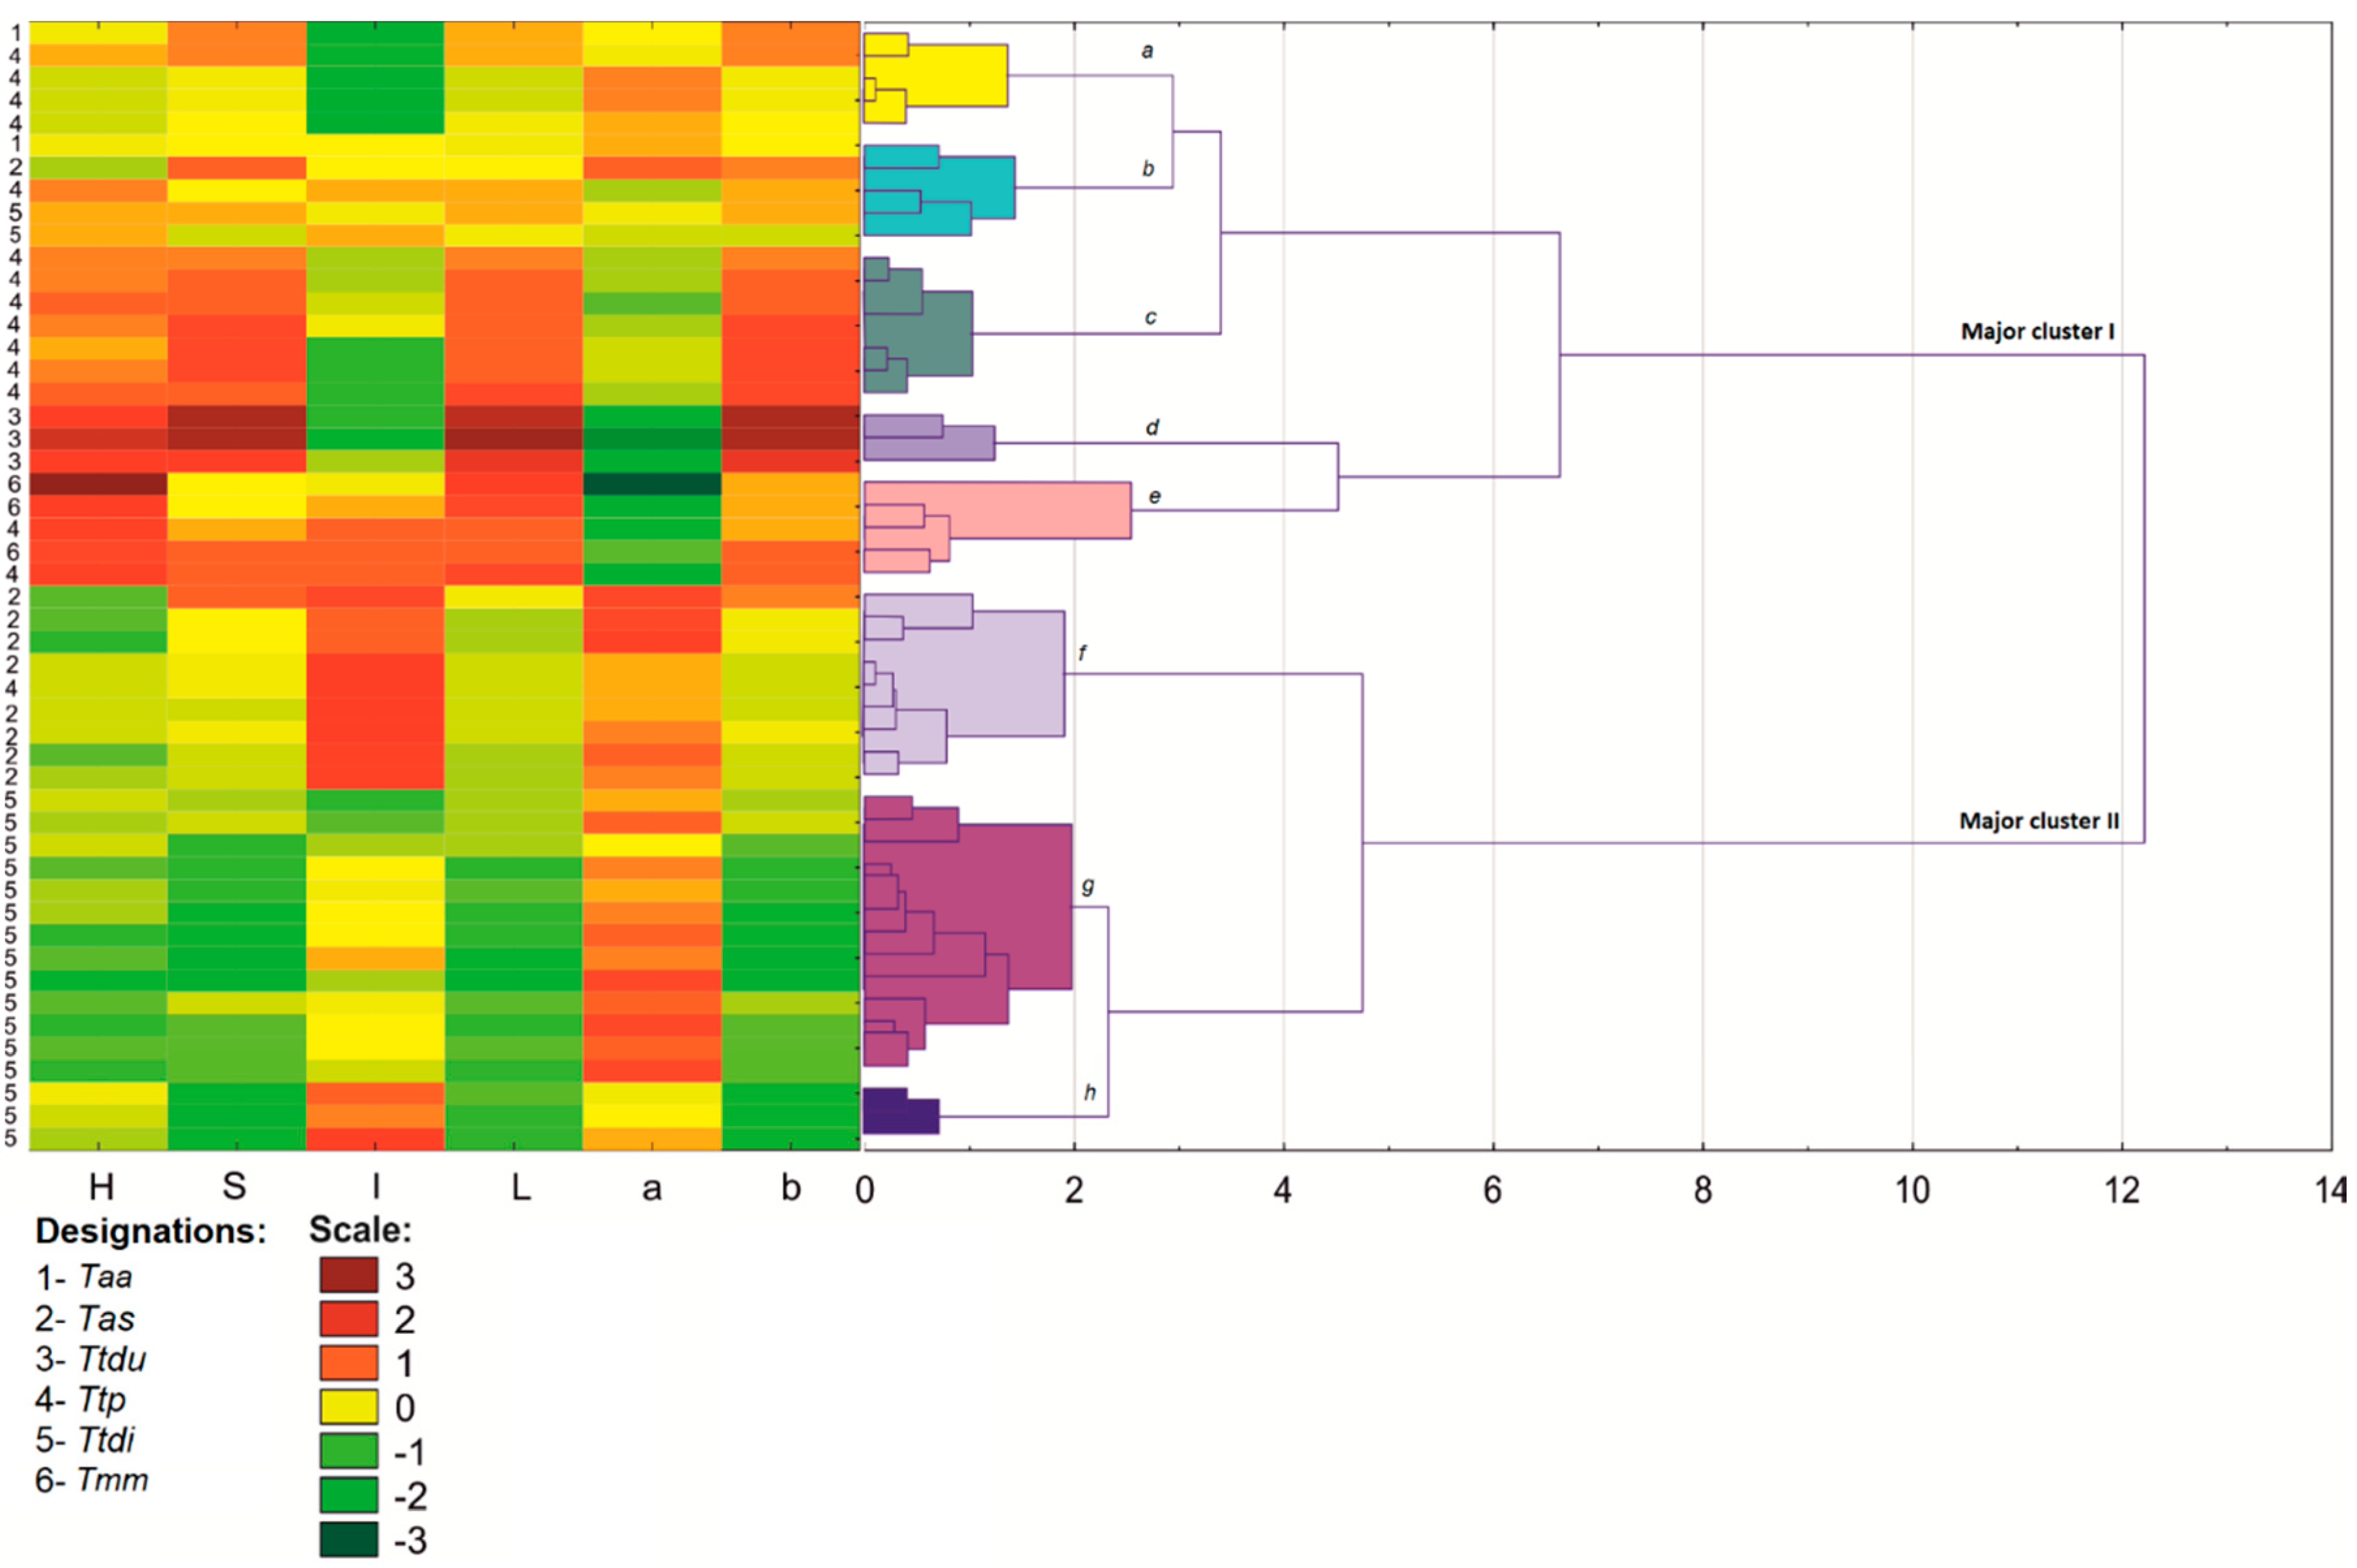
46]. The significance of differences between mean values was estimated by analysis of variance, and the mean values were compared by Tukey’s test. The morphological traits of kernels (shape and color) were analyzed by agglomerative hierarchical clustering (Ward method with the application of Euclidean distances) using STATISTICA 12 software [
46]. The cluster analysis was performed on eight and six shape and color parameters of 50 wheat lines classified into six wheat species. Shape and color descriptors were also processed by PCA. The results of PCA were presented in graphic form. A correlation analysis was carried out for all compared shape and color descriptors and for single kernel weight.
4. Discussion
The main objective of this study was to discriminate wheat subspecies characterized by high genetic diversity. Wheat grain was evaluated by digital image analysis.
A cluster analyses revealed close links independently between the shape and color of bread wheat, durum wheat, and Polish wheat grain in the major clusters. Most importantly, bread wheat and durum wheat lines were very closely grouped in the morphological analysis, probably due to the low variation in their gene pools and the resulting morphological similarities. Based on the analyzed shape and color descriptors, Polish wheat lines were grouped with the above species in the major cluster; however, Polish wheat diverged from the remaining taxa to a certain extent. The above could be attributed to considerable intraspecific variations in Polish wheat, where the values of shape and color descriptors differed considerably. Despite the morphological similarities between emmer and spelt, the divergence between spelt and emmer increased in terms of grain shape. Spelt and emmer generally did not form groups, and they also formed highly divergent groups. The neighboring internal nodes containing spelt and emmer lines were grouped. It cannot be ruled out that the shape of spelt grain has been altered by multiple mutations and domestication, whereas its color remained similar to emmer. This regularity was observed even when differences in fungal colonization were taken into account. Fungal mycelia differ in color, and they can influence the color of the seed coat.
Diploid wheat species have smaller grain that tetraploid wheat [
47]. This observation was confirmed in our study where diploid einkorn was characterized by the smallest kernel image area (12.90 mm
2). Kernel image area was significantly larger in the tetraploid species of emmer, Polish wheat, and durum wheat (17.26, 19.68 and 19.55 mm
2, respectively). A similar trend was noted in kernel image PE, which was smaller in the diploid einkorn (17.52 mm) than in tetraploid species (18.81–19.93 mm). According to Matsuoka [
48], during the domestication of diploid wheats, the initially strongly elongated grain was improved to produce larger and wider grain. Many authors have noted that tetraploid wheats have elongated and large kernels [
49,
50,
51]. Gegas et al. [
52] emphasized that in the process of breeding high-yielding wheat cultivars, efforts are also made to obtain wheat with the plumpest grain. The large kernel image area and PE of the evaluated durum wheat lines point to selection for larger grain. Bread wheat was characterized by small grain, probably because long-term selection for grain with improved chemical composition and processing suitability has led to a reduction in grain size. Some genes encoding grain size could have also been lost during selection. In breeding practice, the morphological traits of grain are evaluated for milling performance (flour quality). Bread wheat grain is processed into flour for baking and confectionery goods, whereas durum wheat is used in the production of semolina, groats, and couscous.
The evaluated lines of Polish wheat were characterized by high RSD values of most shape and color descriptors. High intraspecies variation can be attributed to the low commercial interest in this species; therefore, conscious efforts to narrow down the gene pool of Polish wheat were not made throughout the centuries [
53]. A comparison of the variations in the lines of the analyzed wheat species suggests that rarely farmed ancient species are characterized by a larger gene pool and consequently, greater variations in phenotypic traits [
54]. The results of our study indicate that the grain of bread wheat, and durum wheat had a regular structure, bread wheat grain was round, whereas durum wheat grain was elongated. The grain of ancient species had irregular shape, which can probably be attributed to the absence of prior selection for processing suitability. As mentioned earlier, einkorn was the only species that was not related to the remaining taxa. A comparison of shape descriptors indicates that einkorn grain differed noticeably from the remaining wheats—it was smaller, more elongated, and the least regular in shape. The closely related tetraploid species were most similar in PE, whereas the values of the remaining shape descriptors supported discrimination. The grain of the tetraploid durum wheat and the relatively closely related spelt were somewhat similar, mostly in terms of area, PE, MFD, AR, and RO. Phenotypic similarities could be attributed to gene flow from the parent species (durum wheat) to the progeny (spelt). A comparison of spelt and bread wheat, which evolved by the way of numerous mutations in
T. aestivum ssp.
spelta, reveals clear differences in grain shape. According to some mathematical models, milling yield could be increased by optimizing the shape and size of grain. Large and spherical grains are optimal [
55], and these morphological traits are characteristic of bread wheat. Shape descriptors provide breeders information about kernels size (Area, PE), shape (i.e., high values of AR and FD or low values of RO point to elongated shape) and other features (SO describes shape regularity). The low values of correlation coefficients between grain image descriptors indicate that these components can be manipulated independently. In some cases, phenotyping could be less expensive than genetic analysis, especially when a single stable trait is analyzed. However, the phenotyping of large populations is still expensive in field trials where several traits are evaluated. The dynamic nature of many plants traits requires multiple measurements during plant development. Variation in plants can be accurately determined based on genotypic information that is associated only with phenotypic data. Digital image analysis is considered a high-throughput method, due to the low cost of the sensor (i.e., scanner or digital camera), access to free software for image processing, and advanced solutions that support simultaneous analyses of large datasets [
56]. Digital image analysis is also well suited for pre-selection [
57]. Its usefulness has been demonstrated by numerous studies [
28,
57,
58,
59,
60,
61].
Another objective of this study was to determine whether grain colonization by endophytic fungal pathogens influences the values of color descriptors of kernel images. The images of bread wheat kernels were characterized by average values of lightness and saturation, whereas spelt and emmer grain was more red, which could be partially attributed to colonization by
F. poae. In studies by Suchowilska et al. [
62] and Oliver et al. [
63], selected emmer lines exhibited partial or moderate resistance to FHB. For this reason, fungal grain colonization and the prevalence of fungal infections should be closely monitored to identify supportive conditions for the growth of
Fusarium spp. and other mycotoxin-producing fungi. Kernel color is also determined by reddish phenolic compounds, such as anthocyanins and flavonoids [
64], and pericarp structure [
65]. Durum wheat grain is characterized by light color and a yellow-reddish hue, which points to a different composition of phenolic compounds and different pericarp structure than spelt and emmer. However, the absence of significant correlations between fungal colonization and the color of the seed coat suggests that fungi had a minor influence on the discrimination of the evaluated genotypes. This implies that discrimination is conditioned mainly by the plant’s genotype.
Principal component analysis strongly discriminated three species: bread wheat, durum wheat, and einkorn. In the remaining wheat species, individual lines were grouped with other taxa, which could be due to similarities in the degree of ploidy (Polish wheat and emmer), as well as significant intraspecific variations in Polish wheat, which could explain the grouping of one Polish wheat line with spelt. However, it should be noted that most Polish wheat lines were positioned in the middle range of the values noted in the remaining species.
The grains of wheats other than
T. aestivum ssp.
aestivum and
T. turgidum ssp.
durum is expensive. The addition of durum wheat or bread wheat flour to whole grain flour can effectively lower the price of the final product. Durum wheat and bread wheat are abundant in gluten, a potent allergen; therefore, the quantity and source of grain in the end product should be identified and presented on the label. According to Lombardo et al. [
2], einkorn gluten is less immunoreactive, and it could be a potential candidate in the production of hypoallergenic bakery goods. Only certified grain and seeds should be traded on the cereal market. Methods that support quick identification of grain batches and admixtures of other cereal species not only protect agricultural producers, but also prevent consumers from purchasing products that do not meet their expectations.
In this study, attempts were made to validate the existing image processing methods by evaluating specific plant material, namely the grain of ancient wheats characterized by high genetic and phenotypic variation. The results of this experiment indicate that digital image analysis is an effective method of discriminating wheat species with high genetic variation. Shape and color descriptors were strongly discriminating components in studied wheat species. Their discriminatory power was determined mainly by genotype. Ancient diploid, tetraploid, and hexaploid wheats were subjected to image processing for the first time. Digital image analysis supported the extraction of multiple features, and it is a valuable tool for examining grain quality [
56].


