1. Introduction
One of the most limiting inputs in crop production and quality is nitrogen (N) [
1]. Ironically, N fertilizer that is not used to support crop production has the potential to cause a series of environmental issues such as eutrophication on water bodies, acid rain, N saturation in natural environments, and global warming [
2,
3]. Losses of N from agricultural systems negatively impact the environment as a result of poor N fertilizer management practices. This, in turn, results in low profitability to farmers [
4,
5]. Sustainable crop production systems, i.e., systems that take into account people´s wellbeing, farmer´s economy, and that are environmentally safe, can be attained by using inputs efficiently. Nitrogen use efficiency (NUE) and NUE components are indirect measurements of the sustainability of production systems [
6,
7,
8], therefore, a strong emphasis is being placed on NUE in wheat production systems [
9,
10,
11]. In this paper NUE is defined as grain yield per unit of available N in the soil [
12,
13,
14]. NUE components, N uptake efficiency (NUpE), and N utilization efficiency (NUtE) have been typically used for characterizing newly developed cereal genotypes [
14,
15,
16]. However, for testing the N efficiency of agronomic practices other NUE and associated components have been proposed. Dobermann (2005) [
17] and Ladha et al. (2005) [
18] recommend measuring the agronomic efficiency of applied N (AE
N), crop recovery efficiency of applied N (RE
N), and physiological efficiency of applied N (PE
N). AE
N is the product of the recovered N by the plant, multiplied by the efficiency with which this N is converted into the crop´s part of economic interest (grain, for cereals). According with Dobermann (2005) [
17] and Hawkesford (2017) [
13], the AE
N can be improved by crop management practices such as amount, timing, placement, and N source that can influence RE
N, PE
N, or both. RE
N relays on the efficacy with which applied N is released for crop uptake, and can vary depending on amount, timing, placement and N sources. On the other hand, PE
N measures the ability of a plant to convert the absorbed N into the product of interest; PE
N, as well as RE
N, is also dependent on crop management factors but particularly on reproductive stages. According to Malhi et al. (2001) [
19], an effective N management program must take into account four variables: Rate, source, timing, and placement of fertilizers. Yadav et al. (2017) [
8] proposed site specific N management; integrated N management, i.e., taking into account indigenous N sources like crop residues, manure, biological N fixation, in addition to synthetic fertilizers; enhanced use of efficient sources; improved methods of application; adoption of conservation agriculture (CA); the use of N-efficient genetically improved varieties; and precision farming. Because of the need to increase the sustainability of modern crop production systems, it’s important to better understand the relationship between NUE and fertilizer management practices for wheat produced under CA systems. Published literature about NUE for irrigated wheat under CA is very scarce. The objective of the present study was to investigate the effect of selected treatments that included N (urea) sources, timing, and methods of application, on wheat yield, grain and straw N concentration, and NUE, under a CA system.
4. Discussion
In the present study mean AE
N was 18.6 kg grain kg
−1 N, with associated mean yields of 5925 kg ha
−1 (cycles 2009–2010 to 2012–2013). Ayadi et al. (2016) [
21] reported a mean yield of 5000 kg ha
−1 for the 150 kg N ha
−1 treatment and an associated AE
N of 13.97 kg grain kg
−1 N; slightly lower yields but substantially lower N use efficiency, as compared with the results reported in this study. Gupta et al. (2009) [
22] found a mean AE
N for the 150 kg N ha
−1 of 16.4 kg grain kg
−1 N with a mean yield associated with that treatment of 4545 kg ha
−1, across three growing cycles and two soil types, with comparable N use efficiency, but lower yields than those recorded in this study. In a study conducted in Arizona, U. S. A., Mon et al. (2016) [
23] reported mean AE
N and associated grain wheat yields during two years (2013 and 2014), for the treatment of 168 kg N ha
−1 (their highest yielding treatment), across five irrigation levels, of 17 kg grain kg
−1 N and approximately, 4300 kg ha
−1, respectively (in 2013) and 9 kg N ha
−1 and approximately 3400 kg ha
−1, respectively (in 2014). In this same study [
23], much lower AE
N and yield levels were reported as N rates increased. Duan et al. (2014) [
24] reported a robust paper about NUE across four wheat production regions in China over a 15 year period and across several fertilizer treatments. They reported a mean AE
N of 15 kg grain kg
−1 N, associated with a mean yield of 3300 kg ha
−1.
The point of this discussion is to suggest that, while the NUE parameters recorded in this study were average, the productivity associated to these levels of N use efficiency is high. Thus, representing a net advance for the overall balance between the need of producing food and the environmental footprint of its production. The N use efficiency and yield levels in the present study may be associated with; (1) the adoption of long known strategies to increase N use efficiency, (2) a non-critically limiting N supply for the crop, provided in part by soil mineralization under a mature conservation agriculture system, and a possible synergy among these two factors. Grahmann et al. (2013) [
12] suggested an initial short-term N immobilization period under conservation agriculture, but steady N mineralization rates afterward. In support of the hypothesis that wheat in this study grew on a relatively N rich environment, not only through applied fertilizers, the following evidence is presented.
A soil analysis made before the beginning of the third cycle (2011–2012) showed organic matter concentrations of 0.87%, 0.62%, 0.40%, and 0.25% in the 0–15, 15–30, 30–60, and 60–90 cm, soil profiles, respectively, with a pH of 8.8. Furthermore, in the same experiment station also under conservation agriculture Grahmann et al. (2016) [
25] reported organic matter concentrations of 1.2%, 0.9%, 0.7%, and 0.3% for soil profiles 0–15, 15–40, 40–70, and 70–120 cm, respectively, with a pH of 8.0. From the organic matter concentrations recorded for this study, it is estimated that around 80 kg ha
−1 of mineral N could be made available for wheat each cycle in the 0–0.9 m soil profile. This estimation based on the assumptions of 50% organic carbon from total organic matter, a 10% of organic N from total organic carbon, and 2% mineralization rate year
−1 (personal communication from Dr. William Raun, from the Plant and Soil Department, Oklahoma State University). In an early study, comparing conventional tillage versus conservation tillage, Franzluebbers et al. (1995) [
26] estimated that, under adequate temperature and moisture conditions, NO
3− accumulated at a rate of ≈0.03 g N m
−2 d
−1, which equals to 110 kg N ha
−1 year
−1. If 30 kg N (PFPN = 30 kg grain kg
−1 N) are required to produce 1000 kg of wheat grain [
27], 80 kg N would support yields of around 2600 kg ha
−1, which is close to the mean yields recorded in the control plots in this study during the last three cycles (2870 kg ha
−1). For the fertilized plots, because mineralization rates would be expected to be higher in fertilized than in the control plots [
28], it is estimated that they received a rate of about 230 kg N ha
−1 cycle
−1 (150 from applied fertilizer + 80 from soil mineralization). Thus, if the response of yields to N fertilization was linear, yields would be around 7600 kg ha
−1, but in reality, this response is well known to increase less as N availability is increased [
23,
29]. In addition to mineral N resulting from OM mineralization in the present study, another contributing factor could have been related with reduced ammonia losses under CA. Yang et al. (2015) [
30] and Sanz-Cobena et al. (2017) [
31] reported that when N was applied as a deep band, the ammonia volatilization was lower under CA than under conventional tillage systems and concluded that reduced tillage and crop residues management show a large potential for reducing net greenhouse gas emissions.
Grain N concentration in the control plots in this study recorded a mean of 1.6% across the four cycles where this variable was determined. This grain N concentration, although was the lowest in every cycle (except in the last cycle), compared with the rest of the treatments, was not low, as compared with literature reports. Grahmann et al. (2016) [
25] reported mean crude protein concentrations for the control treatment of 2% to 4% across four cycles, equivalent to about 0.4% to 0.7% N concentration (N × 5.70), and for the 120 kg ha
−1 treatments, 6% to 9% crude protein, equivalent to about 1.1% to 1.7% N concentrations, comparable to the control treatment (0 N) in the present study. As an additional argument to support the hypothesis of recording relatively high yields and NUE in this study due to a sufficient (but not excessive) N supply, RE
N consistently explained more of the variability of AE
N than PE
N, and these findings coincide with literature reports. Moll et al. (1982) [
14] suggested that under relatively high N availability, N uptake efficiency accounted more than N utilization efficiency for explaining the variability of N use efficiency. Similarly, Tian et al. (2016) [
32] indicated that PE
N increased during cultivar genetic improvement in China, and that genetic improvement of NUE was mainly related to the increase in AE
N, under relatively high N supply.
There is a common assumption that wheat (as well as for other crops) yields and quality are irreconcilable objectives [
28,
33,
34], i.e., that one of them has to decrease for the other to increase. This negative relationship was not present in this study, as the highest yielding treatments were also the highest in grain N concentrations, and vice versa. According with Fischer et al. (1993) [
35], Grant et al. (1985) [
36], and Brown et al. (2005) [
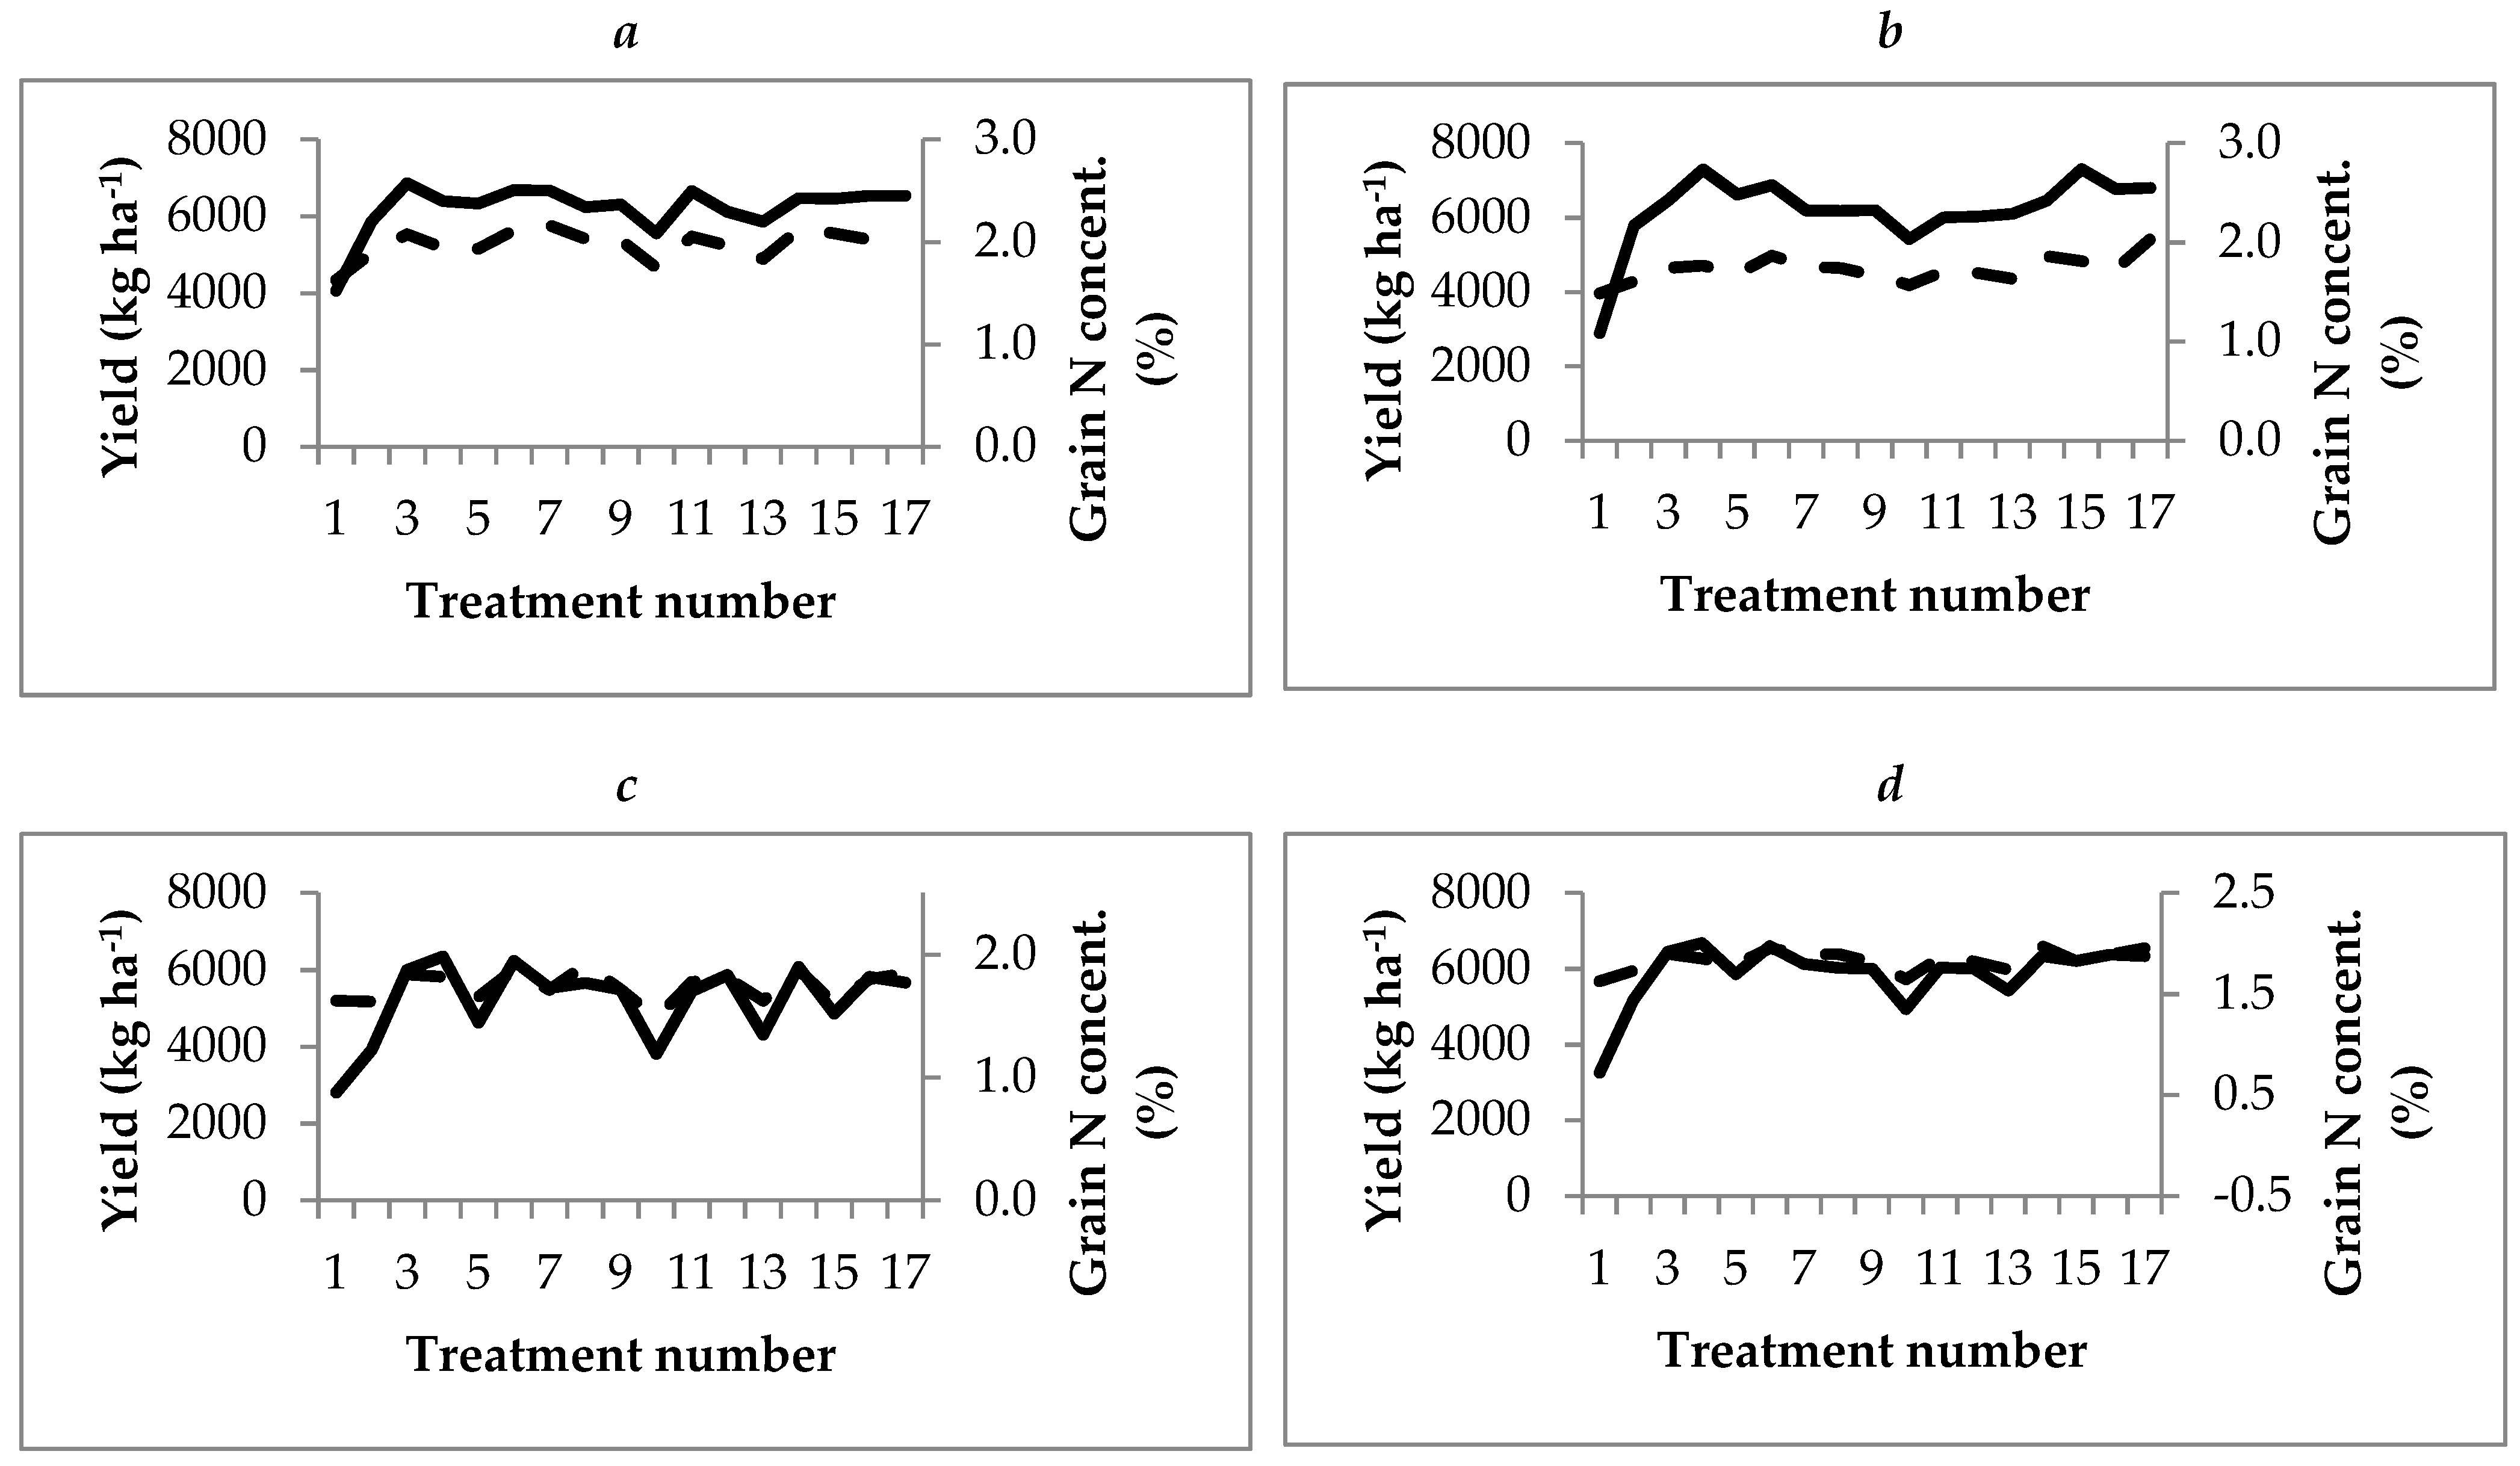
37], grain N decreases when N fertilizers are applied to a highly yielding responsive environment (low soil N supply) because yields increase and an increased accumulation of carbohydrates dilutes the N concentration in grain. On the other hand, the same authors indicate that N applications to environments with low yielding response probability due to high soil N supply, would not increase yields but only N concentration. In the present study, in general, both yields and grain N concentrations increased or decreased together across all treatments (
Figure 2). Averaging the cycles 2010–2011 to 2012–2013, the seven lowest yielding treatments were also the lowest in grain N concentration, being, from the lowest to the highest, 1 (the control), 10, 2, 13, 5, 9, and 12. On the other hand, treatment number 6 was the second highest yielding of all treatments with a mean of 6597 kg ha
−1 and also the second with the highest grain N concentration, with 1.95%. Treatment number 3 was the third highest yielding, with 6442 kg ha
−1 and the fifth highest in grain N concentration, with 1.90%. One exception to this pattern was observed for treatment number 4, which was the highest yielding treatment of all, with 6678 kg ha
−1 but the ninth in grain N concentration. This suggests that wheat under this treatment may have promoted conditions for high yields, experiencing a dilution of N concentration, as high yields imply large carbohydrate accumulation, as has been stated [
35,
36,
37].

 ,
, 


