Article

Closing Yield Gaps through Soil Improvement for Maize Production in Coastal Saline Soil

1
Center for Resources, Environment and Food Security, China Agricultural University, Beijing 100193, China
2
National Engineering Laboratory of Wheat and Maize, Maize Research Institute, Shandong Academy of Agricultural Sciences, Jinan 250100, China
3
Seed Multiplication Farm in Kenli County, Shandong 257500, China
4
Agricultural High-Tech Industry Demonstration Area of the Yellow River Delta, Shandong 257300, China
*
Author to whom correspondence should be addressed.
Agronomy 2019, 9(10), 573; https://doi.org/10.3390/agronomy9100573
Submission received: 1 September 2019 / Revised: 17 September 2019 / Accepted: 19 September 2019 / Published: 23 September 2019
(This article belongs to the Section Soil and Plant Nutrition)

Abstract

:
As efforts to close crop production yield gaps increase, the need has emerged to identify cost-effective strategies to reduce yield losses through soil improvement. Maize (Zea mays L.) production in coastal saline soil is limited by high salinity and high pH, and a limited number of soil amendment options are available. We performed a field experiment in 2015 and 2016 to evaluate the ability of combined flue gas desulfurization gypsum and furfural residue application (CA) to reduce the maize yield gap and improve soil properties. We carried out the same amendment treatments (CA and no amendment as a control) under moderate (electrical conductivity (EC1:1) ≈ 4 dS m−1) and high (EC1:1 ≈ 6 dS m−1) salinity levels. Averaged over all salinity levels and years, maize yields increased from 32.6% of yield potential in the control to 44.2% with the CA treatments. Post-harvest CA treatment increased the calcium (Ca2+) and soil organic carbon (SOC) contents while decreasing the sodium (Na+) content and pH in the upper soil layer. Corresponding nitrogen, phosphorus, potassium, calcium, and magnesium accumulations in maize were significantly increased, and Na accumulation was decreased in the CA group compared with the control. The economic return associated with CA treatment increased by 215 $ ha−1 at the high salinity level compared with the control, but decreased at the moderate salinity level because of the minor increase in yield. The results of this study provide insight into the reduction of yield gaps by addressing soil constraints.

1. Introduction

Significant gaps exist between potential yields and farmers’ actual yields (i.e., yield gaps) [1,2]. Many studies have focused on the optimization of crop and fertilizer management to close yield gaps [1,3,4]. However, the effects of optimal management are limited by various environmental and soil constraints, and soil salinity is a major stressor adversely affecting plant growth and crop productivity. The Yellow River Delta (YRD) area has been affected by severe soil salinization issues, with high groundwater salinity (5–30 g L−1), shallow groundwater levels (1–2 m below the soil surface), and low organic carbon content (averaged 6.09 g kg−1) [5,6,7,8]. In this region, high soil pH and an excess of sodium (Na) ions result in poor soil structure and low water infiltration, inhibiting crop growth and nutrient absorption and, ultimately, reducing crop yields [9,10,11,12,13].
Soil salinity adversely affects crops through two processes: Osmotic stress and ionic toxicity [14]. Osmotic stress delays germination, reduces the seedling emergence rate, and inhibits early seedling growth [15,16]. High sodium levels in the rhizosphere result in ion toxicity and ionic imbalance in terms of uptake competition of Na with nitrogen (N), phosphorous (P), potassium (K), calcium (Ca), and magnesium (Mg), inhibiting leaf development and accelerating the senescence of transpiring leaves [17]. These processes affect photosynthesis and dry matter accumulation, reduce grain number and grain weight, and decrease grain yield in maize [18,19].
Salt leaching with flood irrigation from the Yellow River is a common practice used by local farmers to mitigate salt damage to maize and to close yield gaps [20]; the performance of this practice, however, is limited due to the adsorption of soil Na+ into the clay, coupled with poor soil permeability [21]. The application of flue gas desulfurization gypsum (FGDG) can replace Na+ with Ca2+ at the cation exchange site, thereby increasing the flocculation of clay particles near the soil surface [22,23]. However, the movement of ions through the soil is limited in areas with low soil organic carbon (SOC) content [24]. Furthermore, the application of large quantities of FGDG might result in weak aggregate stability [25,26], increase bulk density, and further limit salt leaching out of the root zone [27]. To address these technological limitations, furfural residue (FR), a byproduct of furfural production from corn cobs by acid catalysis at high temperatures, has been used. FR is rich in organic carbon and can increase the SOC content, reduce soil bulk density, and lower soil pH [24].
Here, we theorized that combined FGDG and FR application (CA treatment) would mitigate salt damage to maize, increasing early seedling growth and ear number, reducing ionic imbalance, and increasing late growth, grain number, and grain weight. Furthermore, we expected that CA treatment could improve soil properties by lowering Na+ and pH levels and increasing Ca2+ and SOC contents. We also investigated whether these effects differed depending on the salinity level and crop season. The results are expected to provide insight into the effective reclamation of coastal saline soil for food production and soil sustainability.

2. Materials and Methods

2.1. Experimental Sites

The field experiment was conducted in 2015 and 2016 at the Kenli County Seed Multiplication Farm (37°24′–38°10′ N, 118°15′–119°19′ E), situated in the YRD region, northeastern Shandong Province, China. This region has a warm temperate monsoon continental climate with low annual rainfall, concentrated in the summer. Figure 1 shows the precipitation, evaporation, and average daily temperature during the spring maize growing season. The precipitation levels during the growing seasons in 2015 and 2016 were 595 and 532 mm, respectively, and the evaporation levels in those years were 529 and 542 mm, respectively (data from the China Meteorological Data Network).
A basic soil analysis revealed differences in the salinity level and physicochemical properties. The electrical conductivity using 1:1 water extract (EC1:1) was about 4 and 6 dS m−1 for two experimental sites. The soil texture was silt loam [28]. The bulk density was 1.47 and 1.55 g cm–3 for two experimental sites at the 0–20 cm soil layer, respectively. We calculated the electric conductivity of saturated soil extract (ECe) of 13.4 and 22.8 dS m−1 in accordance with the dilution law [29]. According to the classification of the US Salinity Laboratory for soil salinity (the ECe of moderate and high salinity was 8–16 and 16–32 dS m−1) [30], the salinity levels of two experimental sites were moderate and high salinity. Table 1 presents the basic physicochemical properties in the upper 0–20 and 20–40 cm of the soil profiles at the two experimental sites.

2.2. FGDG and FR

FGDG is an industrial coal byproduct used to treat sulfur dioxide in flue gas in power generation (Thermal power plant in Dongying, China). It has the following chemical properties: pH, 8.00; EC1:1, 17.3 dS m−1; exchangeable Ca, 49.5 g kg−1; exchangeable Na, 444 mg kg−1; and exchangeable Mg, 572 mg kg−1. As the waste residue discharged from furfural production, FR is extracted by a series of chemical reactions between crushed corncob and sulfuric acid (Shandong Green Ant Bio-organic Fertilizer Co., Ltd., Jinan, China). It has the following chemical properties: pH, 3.30; EC1:1, 32.1 dS m−1; exchangeable Ca, 177 mg kg−1; exchangeable Na, 244 mg kg−1; exchangeable Mg, 73.0 mg kg−1; exchangeable K, 727 mg kg−1; SOC, 325 g kg−1; total N, 7.50 g kg−1; and Olsen-P, 0.2 mg kg−1. The testing methods of FGDG and FR were consistent with that of soil. According to previous studies and calculation of the gypsum requirement, the dosages of FGDG and FR in this study were determined to be 15 and 7.5 Mg ha−1, respectively [21,24].

2.3. Experimental Design and Field Management

The field experiment involved two treatments: Combined application of 15 Mg ha−1 FGDG and 7.5 Mg ha−1 FR (CA treatment) and no amendment as a control. Each treatment was carried out at different salinity levels (moderate and high). The area of each plot was 81 m2 (9 m × 9 m), and the plot treatments were allocated using a randomized block design with three replicates. The spring maize (Zea mays L.) cultivar Zhengdan 958 was used in both cropping seasons, and the sowing dates were 20 May 2015, and 15 May 2016.
The planting density was about 7.5 × 10⁴ plant ha−1 (row spacing, 0.6 m; plant spacing, 0.22 m). During the entire spring maize growth period, the total amount of fertilizer applied was 200 kg N ha−1: 135 kg P2O5 ha−1 as urea (46% N) and mono-ammonium phosphate (10% N and 50% P2O5), and 150 kg K2O ha−1 as potassium sulfate. N was applied three times per growth season: 45 kg N ha−1 before sowing, 90 kg N ha−1 at the six-leaf (V6) stage, and 65 kg N ha−1 at the tasseling (VT) stage. P and K were applied twice per growth season: 90 kg P2O5 ha−1 and 90 kg K2O ha−1 before sowing, and 45 kg P2O5 ha−1 and 60 kg K2O ha−1 at the V6 stage.
The plots were irrigated with 250 mm water from the Yellow River once at 20 days before sowing each year using the flood irrigation method. All fertilizers (45 kg N ha−1, 90 kg P2O5 ha−1, and 90 kg K2O ha−1) and amendment used before sowing were spread manually and evenly over the plots and mixed immediately into soil plowed (to 0.20 m depth) with a rotary cultivator. At the V6 and VT stages, all fertilizers were applied to the soil by ditching (to 0.1 m depth) between the corn rows with a furrowing machine. During the experiment, insects and weeds were controlled according to local agronomic practices. All maize residues excluding cob were crushed by a grinder and returned to the field, which was then plowed deeply (to 0.25 m) in 2014 and each year thereafter.

2.4. Sampling and Laboratory Procedures

Soil samples from the 0–20 and 20–40 cm soil layers were collected before sowing and at maturity. After air drying, the soil samples were crushed and passed through a 20-mesh sieve. These samples were used to test the soil particle size distribution, pH, EC1:1, and exchangeable cations (K, Ca, Na, and Mg). Then, the soil samples were ground and passed through a 100-mesh sieve to measure total N and organic carbon. The particle size distribution of soil samples was determined using a laser particle size analyzer (Winner 2006A, China) [31]. Soil pH was measured using a pH meter (SevenExcellence, Mettler-Toledo, China) by extraction (1:2.5 ratio of soil to 0.01 mol L−1 CaCl2), and EC1:1 was measured using an EC meter (Mettler-Toledo, China) by extraction (1:1 ratio of soil to water). Available P was measured according to Olsen et al. [32] using the ammonium molybdate–ascorbic acid method [33]. Exchangeable cations (K, Ca, Na, and Mg) were measured after extraction in 1 mol L−1 ammonium acetate (pH = 7.0) and analyzed by inductively coupled plasma optical emission spectroscopy (ICP-OES; OPTIMA 3300 DV; Perkin-Elmer, USA) [34]. Soil total N and SOC were determined using a vario MACRO elemental analyzer (Elementar, Langenselbold, Germany).
At each of the V6, VT, and mature (R6) stages, six plants near the middle of each plot were clipped for the determination of aboveground biomass; the samples were dried at 60–65 °C until they had reached a constant weight. At the R6 stage, an area of 12 m2 (5 m × 2.4 m) in the middle of each plot was harvested manually to determine the grain yield (15.5% water content) and yield components, by counting of the harvested ears. Straw and grain samples collected at the R6 stage were ground with a grinder for nutritional analysis. The N content was determined by the Kjeldahl method [35]. The P, K, Ca, Mg, and Na contents were determined by ICP-OES though digesting with HNO3-H2O2 in a microwave-accelerated reaction system (CEM Corporation, Matthews, NC, USA) [36].

2.5. Model Development and Preliminary Validation

The hybrid maize model was used to simulate maize development and growth using a daily time step and to estimate yield potential (YP) under defined growth conditions without biotic or abiotic stress [37,38]. The model has been used widely in the USA [39] and China [40,41]. The spring maize YPs in 2015 and 2016 were estimated based on meteorological data (e.g., solar radiation, precipitation, and maximum and minimum temperatures), sowing date, planting density, hybrid maturity, bulk density, and other factors [38]. The simulated YPs and biomasses were 14.6 and 24.8 Mg ha−1 in 2015, and 15.8 and 25.3 Mg ha−1 in 2016, respectively.

2.6. Economic Analysis

Economic analysis was carried out using the partial budgeting method [21] and had two main components: Variable input and yield gain. The variable input per hectare excluded common inputs (e.g., seeds, fertilizer, and irrigation water).
Economic return = yield gain − variable input.
Yield gain = grain yield × maize grain price (0.24 $ kg−1).
Variable input = material (141 $ ha−1) + traffic transport (120) + labor service (72.5).

2.7. Statistical Analysis

The effects of year, salinity level, and treatment on the yield, ear number, grains per ear, and grain weight were evaluated by three-way analysis of variance (ANOVA) using the statistical analysis system (SAS Institute, 1998; Cary, NC, USA). One-way ANOVA was used to analyze the effects of treatment on biomass and ion accumulation in maize, as well as soil properties (pH and SOC, Ca2+, and Na+ contents). Following an F test, multiple comparison of means (p < 0.05) was conducted with Fisher’s protected least significant difference.

3. Results

3.1. Simulated Yield Potential, Grain Yield, and Economic Return

The model-simulated YPs for maize were 14.6 Mg ha−1 in 2015 and 15.8 Mg ha−1 in 2016. These YPs were similar to those in other regions of China [41]. The control treatments in both years achieved 38.2%–49.9% of the YP at the moderate salinity level and 14.0%–28.0% of the YP at the high salinity level. The CA treatment increased yields to 51.6%–52.6% of the YP at the moderate salinity level and 29.0%–42.9% of the YP at the high salinity level (Table 2).
Grain yield and yield components were significantly affected by year, salinity levels, and treatment except for year on the grains per ear (Table 3). Over both years, maize yields with the CA treatment were 17.7% and 70.2% higher than the control at the moderate and high salinity levels, respectively (Table 2). The large increase in yield associated with CA treatment was attributed to increased ear number, grain number, and grain weight at the high salinity level. In contrast, CA treatment significantly increased only the grain number per ear at the moderate salinity level. Higher maize yields across all treatments and salinity levels were observed in 2016 compared with 2015 because of the higher ear number (Table 2).
Compared with the control, the CA treatment increased grain yield income by 17.7%, but decreased the economic return by 45.0 $ ha−1 at the moderate salinity level because of high variable input. In contrast, the CA treatment achieved a 70.2% increase in grain yield income and a 215 $ ha−1 gain in economic return at the high salinity level (Table 2).

3.2. Simulated and Experimental Biomass Accumulation

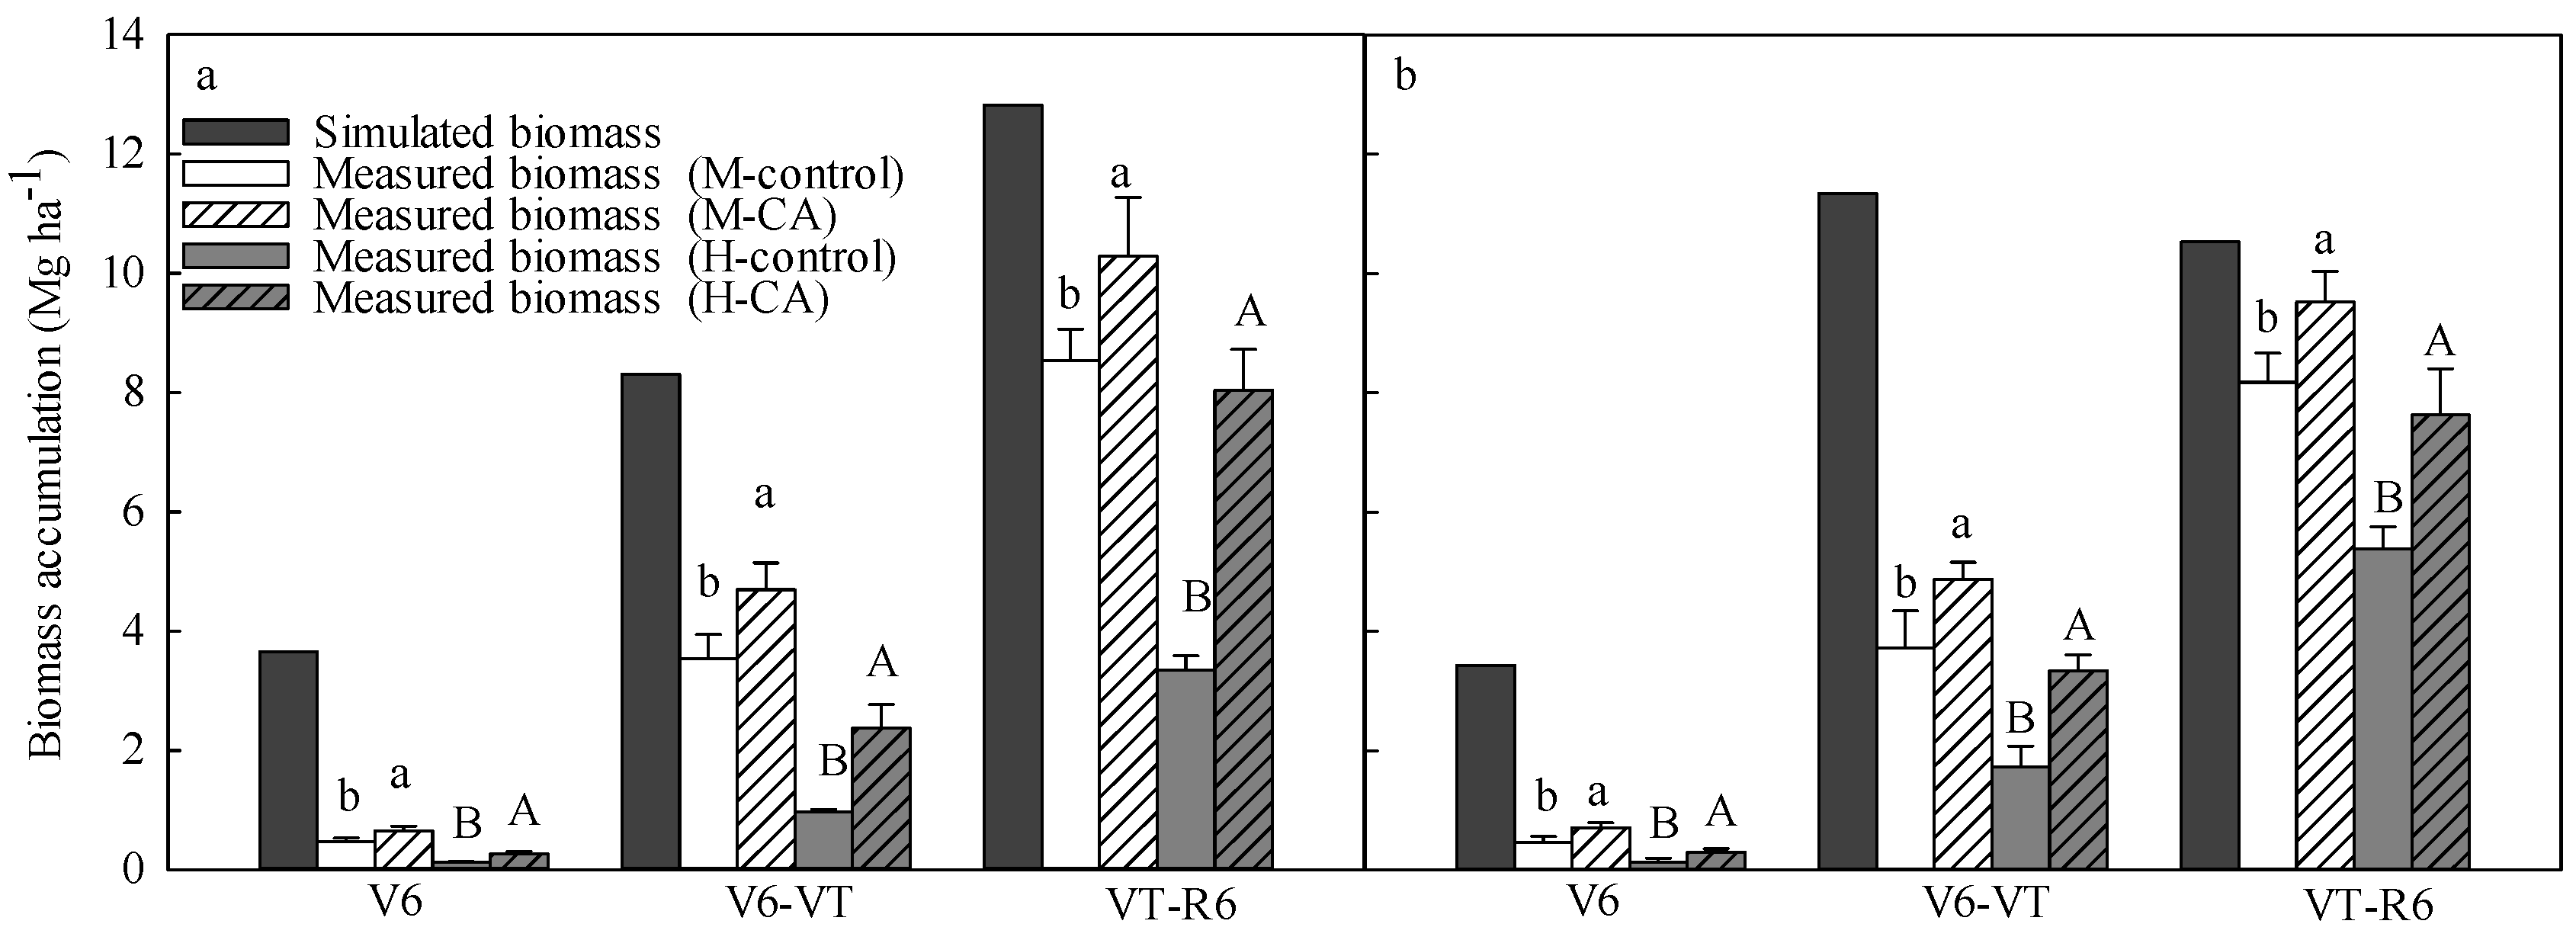
Averaged over both years, the simulated biomass at maturity was 25.0 Mg ha−1. Experimental biomasses were 36.7% of the simulated biomass under the control condition and 52.8% of the simulated biomass under CA treatment (Figure 2).
Biomass accumulation at maturity increased by averages of 2.91 and 5.12 Mg ha−1 under the CA treatment compared with the control at the moderate and high salinity levels, respectively. Of these total increases, 7.21% and 2.95% could be attributed to the V6 stage, 39.6% and 29.3% to the V6–VT stage, and 53.2% and 67.7% to the VT–R6 stage, respectively (Figure 2). These observations indicated that the increased biomass accumulated mainly during the late growth stages of maize, especially at the high salinity level.
At the V6 stage, the biomass accumulation for the CA treatment was 44.7% (V6: 0.68 Mg ha−1) greater than that of the control at the moderate salinity level, and 118% (V6: 0.28 Mg ha−1) greater than that of the control at the high salinity level. From the V6 to the VT stage, CA treatment increased biomass accumulation by 31.8% (V6-VT: 4.78 Mg ha−1) and 111% (V6-VT: 2.85 Mg ha−1) at the moderate and high salinity levels, respectively. The greatest biomass accumulation in the CA treatment groups occurred at the VT–R6 stage (VT–R6: 9.90 and 7.84 Mg ha−1, respectively), and were 18.5% and 79.4% higher, respectively, than those in the control.

3.3. Ion Contents of Maize

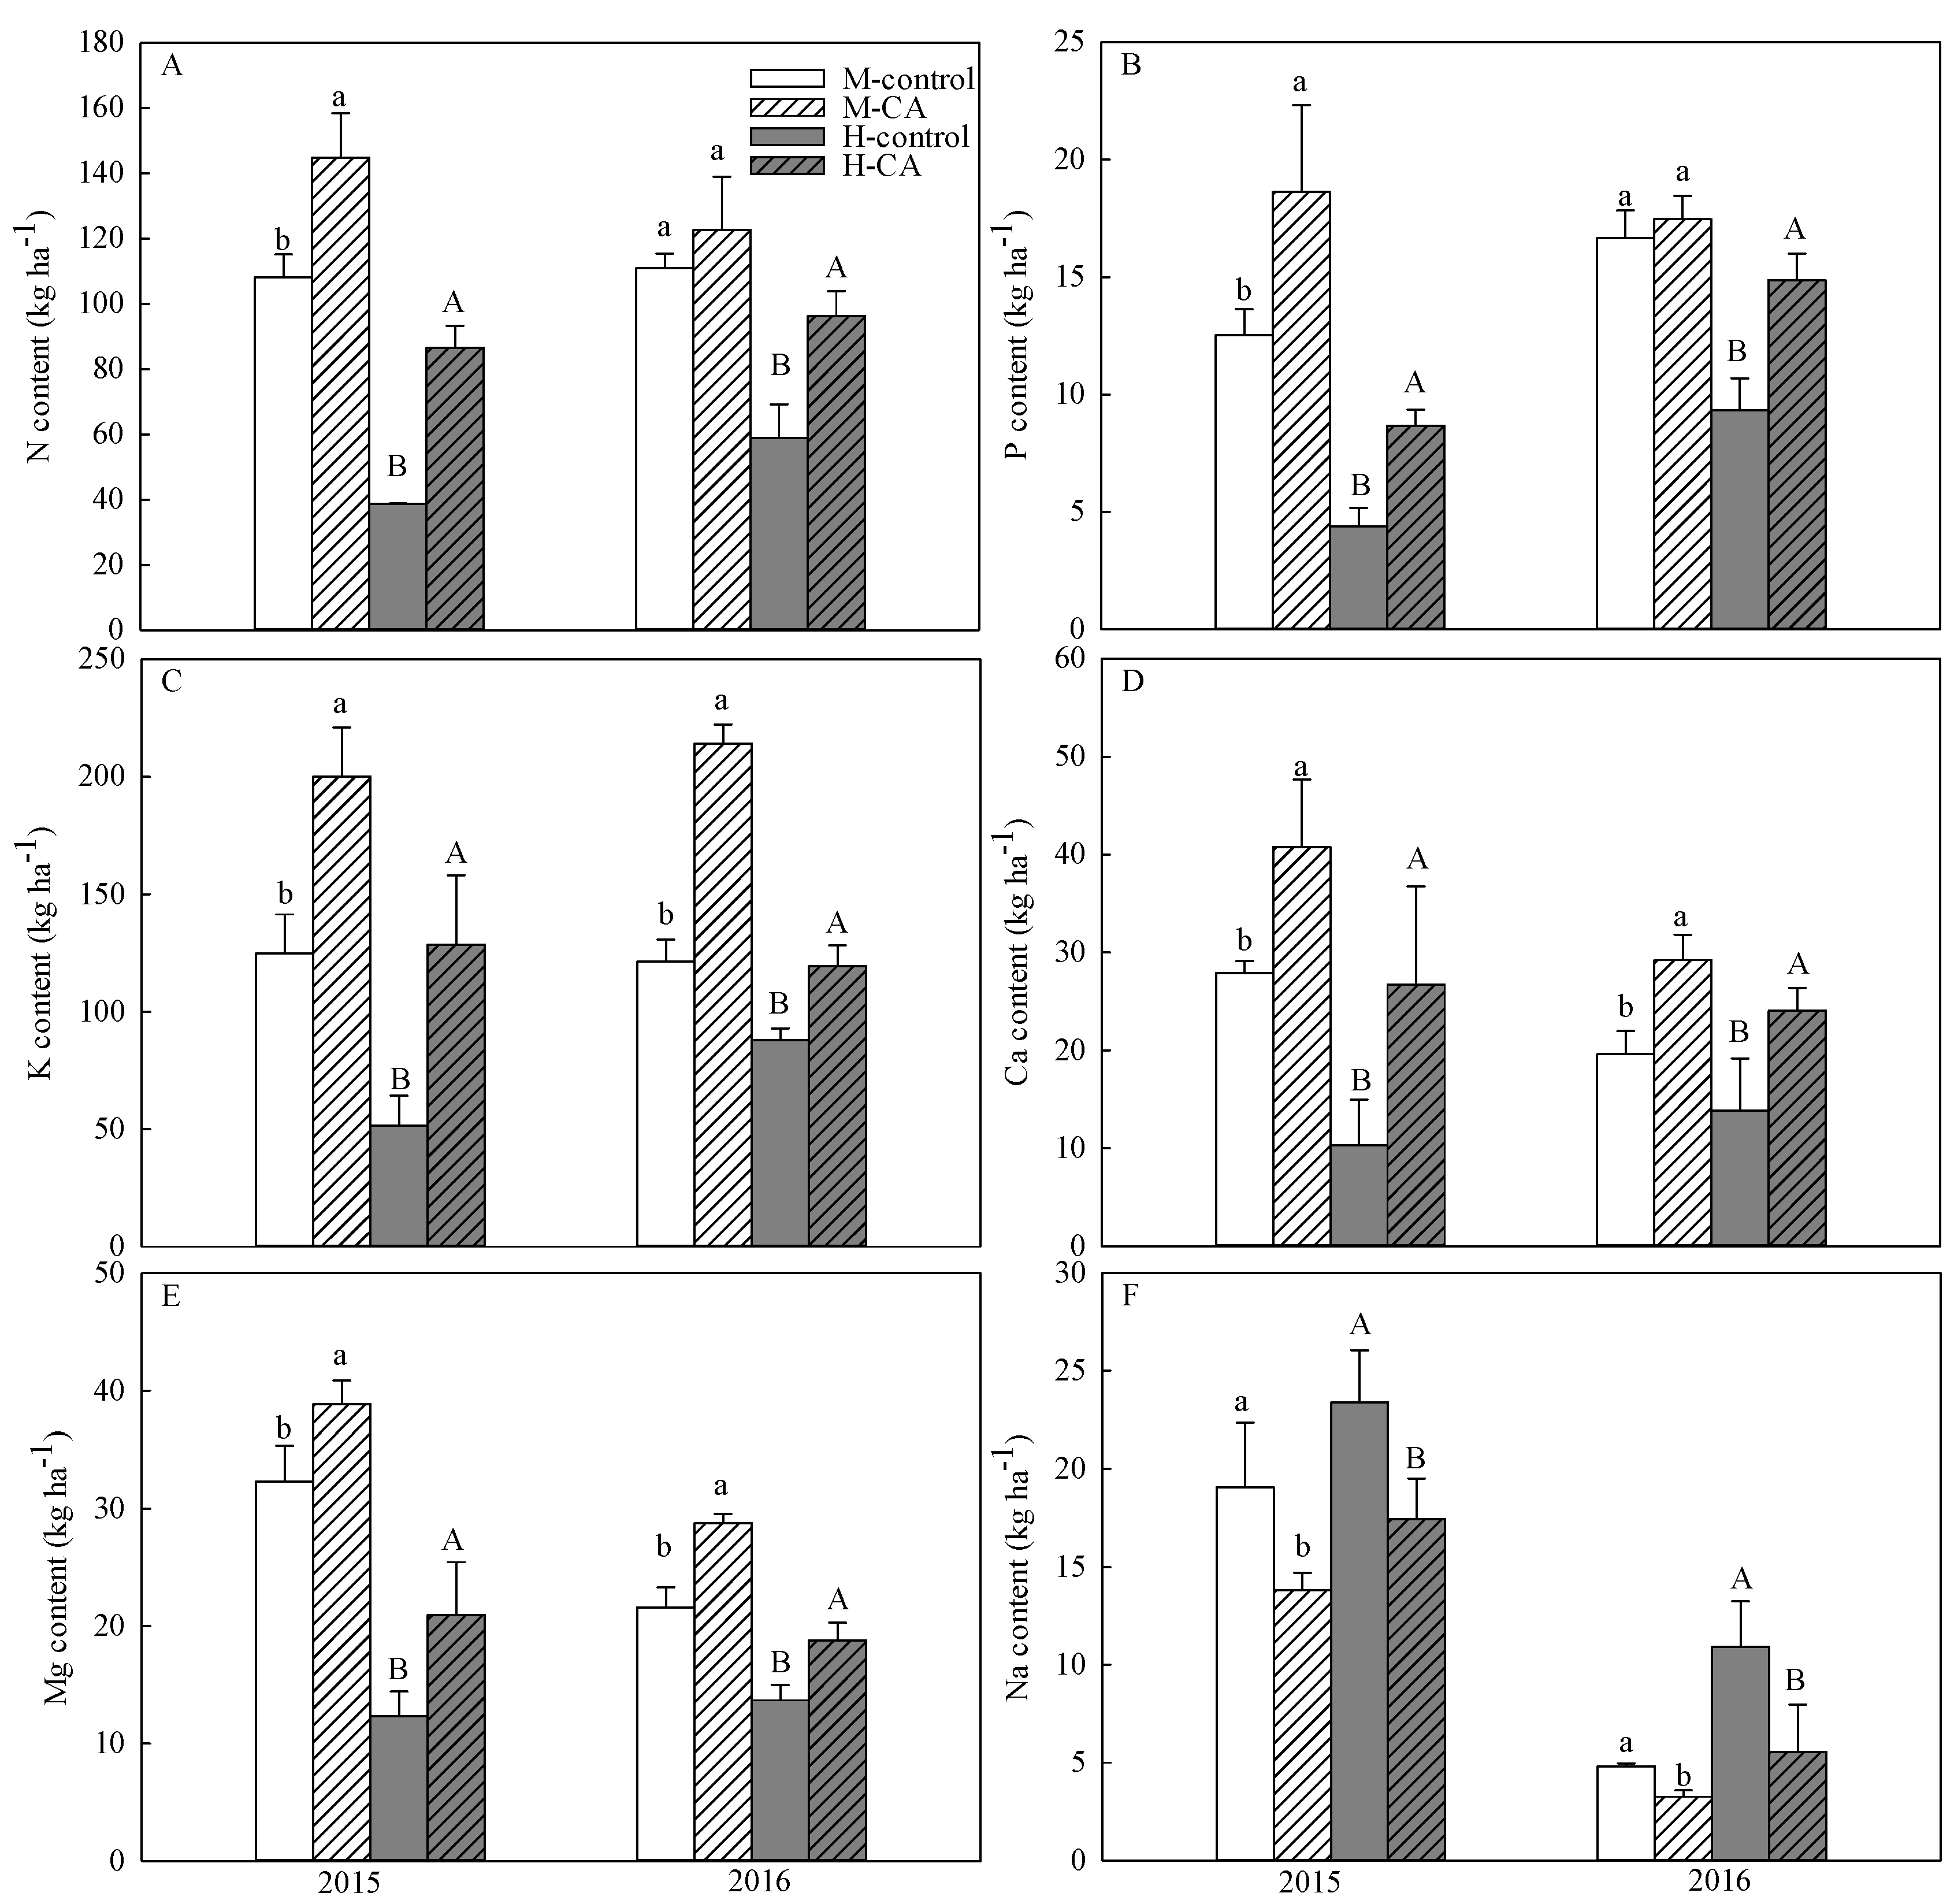
The contents of ions (N, P, K, Ca, Mg, and Na) in maize at maturity were affected significantly by the treatment, salinity level, and year (with the exception of N and K, which were not affected by year; Figure 3). At the high salinity level, the contents of N, P, K, Ca, and Mg under the CA treatment increased significantly, by 35.9%–160%, whereas Na content was reduced by 25.3%–49.3% compared with the control. This decrease in Na content may be attributed to significant reductions in the Na concentration (62.5%–71.4%) and increases in biomass accumulation (55.5%–140%). At the moderate salinity level, the CA treatment significantly increased N, P K, Ca, and Mg contents, by 20.3%–76.5%, and reduced Na content by 27.7%–32.2% compared with the control, except for N and P in 2016. The low Na content could be explained by significant reductions in the Na concentration (38.2%–53.5%) and increases in biomass accumulation (22.1%–24.6%).

3.4. Soil Properties

The soil pH in the 0–20 cm soil layer decreased significantly under the CA treatment, by 0.09 and 0.07 compared with the control at the moderate and high salinity levels, respectively. Soil pH in the 20–40 cm soil layer decreased by 0.11 at the moderate salinity level, but did not change significantly at the high salinity level (Table 4).
SOC contents in the 0–20 cm soil layer under the CA treatment were 14.1% and 23.4% higher than the control at the moderate and high salinity levels, respectively. The SOC content increased by 43.1% in the 20–40 cm soil layer at the high salinity level, but did not change significantly at the moderate salinity level (Table 4).
The CA treatment increased the soil Ca2+ content by 12.8% and 21.3% compared with the initial value and by 28.1% and 22.7% compared with the control in the 0–20 cm soil layer at the moderate and high salinity levels, respectively. No significant difference was observed the 20–40 cm soil layer, except at the high salinity level. The CA treatment reduced soil Na+ contents by 53.5% and 34.1% in the 0–20 and 20–40 cm soil layers, respectively, at the high salinity level. No significant difference was observed at the moderate salinity level (Table 1; Table 4).

4. Discussion

The control treatment, which reflected current farming practices, achieved only 44.1% and 21.0% of the YPs at the moderate and high salinity levels, respectively, indicating that significant yield improvement should be possible. Maize yields increased to 52.1% and 36.0% of the YP under the CA treatment at the moderate and high salinity levels, respectively, supporting the hypothesis that CA treatment could mitigate salt damage from osmotic stress and ionic toxicity, increasing maize yield.
During the early growth stages, the CA treatment improved the emergence rate and ear number and increased biomass accumulation compared with the control, and these effects was stronger at the high salinity level. As a mechanistic explanation for these improvements, the CA treatment may have decreased soil salts due to the application of FGDG, decreased osmotic stress, and improved maize growth [15,16,42]. Previous reports also indicated that FGDG could improve saline–sodic soil and increase the maize emergence rate and shoot dry weight, and that these effects were stronger at higher soil salinity level [13,43].
Maize was more susceptible to soil salinity during the vegetative stages, especially in the later growth stages [44,45]. The CA treatment increased biomass accumulation from the V6 to VT stage, resulting in 26.3% and 34.6% increases in grain number per ear at the moderate and high salinity levels, respectively. Increasing biomass accumulation during the growth phase is essential to achieve high grain numbers [46,47].
During the reproductive growth stages, the CA treatment increased the Ca content in maize; improved cell membrane selectivity to K and Na, leading to reduced Na accumulation; caused more N, P, K, and Mg accumulation [21]; mitigated the harmful effects of ionic imbalance on maize growth [16]; and thereby increased biomass accumulation from VT to R6. Reduced Na accumulation under the CA treatment also slowed the senescence of transpiring leaves [17] and promoted the transport and accumulation of essential nutrients from other organs to harvestable organs [48]. These processes resulted in high grain weights and grain yields, especially at the high salinity level, because these parameters are determined mainly by nutrient and biomass accumulation from silking to maturity [47,49,50].
Our results also support the hypothesis that the CA treatment would substantially improve soil properties. The CA treatment increased the SOC content and decreased the soil pH, which can be explained by FR’s rich organic matter content and acidity (pH 3.3). Previous studies showed that FR promotes the formation of flocculation and massive soil aggregates [24,51]. As FR is an acidic and organic material, its decomposition releases additional hydrogen (H+) to reduce soil pH when added to soil [24]. In addition, FGDG increases Ca2+ levels, resulting in calcite precipitation and H+ release [21]. The CA treatment reduced the Na+ content and increased the Ca2+ content in the top soil layer because FGDG supplies Ca2+ to replace Na+ in clay, which improved soil Na+ leaching out of the root zone [23,42]. These effects were more obvious at the high salinity level. The post-harvest bulk density in 2016 was similar between the CA treatment and the control in the present study (data not shown), although other studies have shown that FGDG application slightly increased bulk density and weakened soil aggregate stability [25,27]. This observation may be partly explained by the short-term addition of FR and straw return in this study.
The yield gains for maize grown in coastal saline soil after combined FGDG and FR application were striking; however, the CA treatment increased the yield only to 44.2% of the YP (compared with 32.6% of the YP for the control). We believe that soil improvement efforts over a longer time period and the integration of other management practices (e.g., the use of optimal hybrids and crop management techniques) will help to close the yield gap further. However, this approach has several limitations, such as the large amendment dose required and the lack of mechanized operation in the coastal region of northern China, resulting in a high cost. The economic return under the CA treatment was lower than that of the control at the moderate salinity level, but higher at the high salinity level because of increased yield. However, most farmers perceive little incentive to adopt this technology because of labor limitations and small typical land areas (<0.5 ha per farmer) [52,53]. In the future, other factors may encourage farmers to adopt this technology, including the implementation of regulatory policies (e.g., subsidies), the development of more economically viable and complete systems (e.g., mechanization), and further increases in grain yield and resource use efficiency in combination with other improvement measures (e.g., tillage and mulching). Although some studies showed that the massive of FGDG and FR did not result in soil contamination in short or long term measurement [24,51], we still need to carry out further research on soil contamination.

5. Conclusions

CA treatment significantly reduced gaps in maize yield and biomass, and these effects were stronger at the high salinity level. In the 0–20 cm soil layer, the CA treatment increased the Ca2+ and SOC contents and decreased the soil pH and Na+ content. Due to the growing population and increasing stresses on food production, the utilization of land with soil constraints as efficiently as possible is becoming more important. Soil improvement efforts will result in large gains in grain output, ensuring greater profits for farmers and better food security.

Author Contributions

Z.C. designed the research and supervised the project. J.Z., X.J., Y.X., Z.L. (Zongxin Li), X.L., Q.M. and Z.L. (Zitong Liu) collected and analysed the data. B.Y. and L.X. provided a platform and technical service for field experiments. J.Z. wrote the manuscript.

Funding

The research was funded National Natural Science Foundation of China (Key Program, U1706211); Taishan Scholarship Project of Shandong Province (No. TS201712082); the Shandong Provincial Key Research and Development Program of China (2017CXGC0304). And The APC was funded by National Natural Science Foundation of China (Key Program, U1706211).

Conflicts of Interest

The authors declare no conflict of interest.

References

  1. Liu, B.H.; Wu, L.; Chen, X.P.; Meng, Q.F. Quantifying the potential yield and yield gap of Chinese wheat production. Agron. J. 2016, 108, 1890. [Google Scholar] [CrossRef]
  2. Cao, H.Z.; Li, Y.N.; Chen, G.F.; Chen, D.D.; Qu, H.R.; Ma, W.Q. Identifying the limiting factors driving the winter wheat yield gap on smallholder farms by agronomic diagnosis in North China Plain. J. Integr. Agric. 2019, 18, 2–14. [Google Scholar] [CrossRef]
  3. Lobell, D.B.; Cassman, K.G.; Field, C.B. Crop yield gaps: Their importance, magnitudes, and causes. Annu. Rev. Environ. Resour. 2009, 34, 179–204. [Google Scholar] [CrossRef]
  4. Wang, M.; Wang, L.C.; Cui, Z.L.; Chen, X.P.; Xie, J.G.; Hou, Y.P. Closing the yield gap and achieving high N use efficiency and low apparent N losses. Field Crops Res. 2017, 209, 39–46. [Google Scholar] [CrossRef]
  5. Qin, Y.; Zhao, G.; Wang, J.; Cheng, J.; Meng, Y.; Dong, C.; Lei, T. Restoration and reutilization evaluation of coastal saline-alkaline degraded lands in Yellow River Delta. Transact. Chin. Soc. Agric. Eng. 2009, 25, 306–311, (in Chinese with English abstract). [Google Scholar]
  6. Fan, X.M.; Liu, G.H.; Tang, Z.P.; Shu, L.C. Analysis on main contributors influencing soil salinization of Yellow River Delta. J. Soil Water Conserv. 2010, 24, 139–144, (in Chinese with English abstract). [Google Scholar]
  7. Singh, K. Microbial and enzyme activities of saline and sodic soils. Land Degrad. Dev. 2016, 27, 706–718. [Google Scholar] [CrossRef]
  8. Wang, Z.; Zhao, G.; Gao, M.; Chang, C. Spatial variability of soil salinity in coastal saline soil at different scales in the Yellow River Delta, China. Environ. Monit. Assess. 2017, 189, 80. [Google Scholar] [CrossRef]
  9. Qadir, M.; Ghafoor, A.; Murtaza, G. Amelioration strategies for saline soils: A review. Land Degrad. Dev. 2000, 11, 501–521. [Google Scholar] [CrossRef]
  10. Kobayashi, O.; Higuchi, K.; Miwa, E.; Tadano, T. Growth injury induced by high pH in rice and tomato. Soil Sci. Plant Nutr. 2010, 56, 407–411. [Google Scholar] [CrossRef]
  11. George, E.; Horst, W.; Neumann, E. Calcareous and alkaline soils. In Marschner’s Mineral Nutrition of Higher Plants; Marschner, P., Ed.; Academic Press: San Diego, CA, USA, 2012; pp. 444–455. [Google Scholar]
  12. Higuchi, K.; Ono, K.; Araki, S.; Nakamura, S.; Uesugi, T.; Makishima, T.; Ikari, A.; Hanaoka, T.; Sue, M. Elongation of barley roots in high pH nutrient solution is supported by both cell proliferation and differentiation in the root apex. Plant Cell Environ. 2017, 40, 1609–1617. [Google Scholar] [CrossRef] [PubMed]
  13. Yang, Z.P.; Zhang, Q.; Liang, L.; Zhang, X.Z.; Wang, Y.L.; Guo, C.X.; Guo, J.L. Remediation of heavily saline-sodic soil with flue gas desulfurization gypsum in arid-inland China. Soil Sci. Plant Nutr. 2018, 64, 526–534. [Google Scholar] [CrossRef]
  14. Hanin, M.; Ebel, C.; Ngom, M.; Laplaze, L.; Masmoudi, K. New insights on plant salt tolerance mechanisms and their potential use for breeding. Front. Plant Sci. 2016, 7, 1787. [Google Scholar] [CrossRef] [PubMed]
  15. Farsiani, A.; Ghobadi, M.E. Effects of PEG and NaCl stress on two cultivars of corn (Zea mays L.) at germination and early seedling stages. World Acad. Sci. Eng. Technol. 2009, 57, 382–385. [Google Scholar]
  16. Farooq, M.; Hussain, M.; Wakeel, A.; Siddique, K.H. Salt stress in maize: Effects, resistance mechanisms, and management. A review. Agron. Sustain. Dev. 2015, 35, 461–481. [Google Scholar] [CrossRef]
  17. Zörb, C.; Geilfus, C.M.; Dietz, K.J. Salinity and crop yield. Plant Biol. 2019, 21, 31–38. [Google Scholar] [CrossRef] [PubMed]
  18. Hiyane, R.; Hiyane, S.; Tang, A.C.; Boyer, J.S. Sucrose feeding reverses shade-induced kernel losses in maize. Ann. Bot. 2010, 106, 395–403. [Google Scholar] [CrossRef] [PubMed] [Green Version]
  19. Schubert, S. Salt resistance of crop plants: Physiological characterization of a multigenic trait. Mol. Physiol. Basis Nutr. Effic. Crops 2011, 13, 443–455. [Google Scholar]
  20. Sun, X.L. Research on the Irrigation and Drainage Pattern of Modern Yellow River Delta Area Based on RS. Master’s Thesis, China University of Petroleum, Beijing, China, 2008. (in Chinese with English abstract). [Google Scholar]
  21. Rasouli, F.; Pouya, A.K.; Karimian, N. Wheat yield and physico-chemical properties of a sodic soil from semi-arid area of Iran as affected by applied gypsum. Geoderma 2013, 193, 246–255. [Google Scholar] [CrossRef]
  22. Chun, S.; Nishiyama, M.; Matsumoto, S. Sodic soils reclaimed with by-product from flue gas desulfurization: Corn production and soil quality. Environ. Pollut. 2001, 114, 453–459. [Google Scholar] [CrossRef]
  23. Mahmoodabadi, M.; Yazdanpanah, N.; Sinobas, L.R.; Pazira, E.; Neshat, A. Reclamation of calcareous saline sodic soil with different amendments (I): Redistribution of soluble cations within the soil profile. Agric. Water Manag. 2013, 120, 30–38. [Google Scholar] [CrossRef]
  24. Wang, L.; Sun, X.; Li, S.; Zhang, T.; Zhang, W.; Zhai, P. Application of organic amendments to a coastal saline soil in north China: Effects on soil physical and chemical properties and tree growth. PLoS ONE 2014, 9, e89185. [Google Scholar] [CrossRef] [PubMed]
  25. Buckley, M.E.; Wolkowski, R.P. In-season effect of flue gas desulfurization gypsum on soil physical properties. J. Environ. Qual. 2014, 43, 322–327. [Google Scholar] [CrossRef] [PubMed]
  26. Watts, D.B.; Dick, W.A. Sustainable uses of FGD gypsum in agricultural systems: Introduction. J. Environ. Qual. 2014, 43, 246–252. [Google Scholar] [CrossRef] [PubMed]
  27. Yu, H.L.; Yang, P.L.; Lin, H.; Ren, S.M.; He, X. Effects of sodic soil reclamation using flue gas desulphurization gypsum on soil pore characteristics, bulk density, and saturated hydraulic conductivity. Soil Sci. Soc. Am. J. 2014, 78, 1201–1213. [Google Scholar] [CrossRef]
  28. Soil Survey Staff. Soil Taxonomy: A Basic System of Soil Classification for Making and Interpreting Soil Surveys, 2nd ed.; US Department of Agriculture Soil Conservation Service: Washington, DC, USA, 1999.
  29. Smagin, A.V.; Sadovnikova, N.B.; Kirichenko, A.V.; Egorov, Y.V.; Vityazev, V.G.; Bashina, A.S. Dependence of the Osmotic Pressure and Electrical Conductivity of Soil Solutions on the Soil Water Content. Eurasian Soil Sci. 2018, 51, 1462–1473. [Google Scholar] [CrossRef]
  30. Shahid, S.A.; Rahman, K. Soil Salinity Development, Classification, Assessment and Management in Irrigated Agriculture. Handbook of Plant and Crop Stress, 3rd ed.; CRC Press: Boca Raton, FL, USA, 2011; pp. 23–39. [Google Scholar]
  31. Eshel, G.; Levy, G.J.; Mingelgrin, U.; Singer, M.J. Critical evaluation of the use of laser diffraction for particle-size distribution analysis. Soil Sci. Soc. Am. J. 2004, 68, 736–743. [Google Scholar] [CrossRef]
  32. Olsen, S.R.; Cole, C.V.; Watanabe, F.S.; Dean, L.A. Estimation of Available Phosphorus in Soils by Extraction with Sodium Bicarbonate. US Dep. Agric. Circ. 1954, 939, 1954. [Google Scholar]
  33. Murphy, J.; Riley, J.P. A modified single solution method for determination of phosphate uptake by rye. Soil Sci. Soc. Am. J. 1952, 48, 31–36. [Google Scholar]
  34. Kim, H.S.; Kim, K.R.; Yang, J.E.; Ok, Y.S.; Owens, G.; Nehls, T.; Wessolek, G.; Kim, K.H. Effect of biochar on reclaimed tidal land soil properties and maize (Zea mays L.) response. Chemosphere 2016, 142, 153–159. [Google Scholar] [CrossRef]
  35. Li, P.Y.; Zeng, Y.; Xie, Y.; Li, X.; Yan, K.; Wang, Y.B.; Xie, T.H.; Zhang, Y.K. Effect of pretreatment on the enzymatic hydrolysis of kitchen waste for xanthan production. Bioresour. Technol. 2017, 223, 84–90. [Google Scholar] [CrossRef]
  36. Zhang, W.; Liu, D.Y.; Liu, Y.M.; Cui, Z.L.; Chen, X.P.; Zou, C.Q. Zinc uptake and accumulation in winter wheat relative to changes in root morphology and mycorrhizal colonization following varying phosphorus application on calcareous soil. Field Crops Res. 2016, 197, 74–82. [Google Scholar] [CrossRef]
  37. Yang, H.S.; Dobermann, A.; Cassman, K.G.; Walters, D.T. Features, applications, and limitations of the Hybrid-Maize simulation model. Agron. J. 2006, 98, 737–748. [Google Scholar] [CrossRef]
  38. Liu, B.H.; Chen, X.P.; Meng, Q.F.; Yang, H.S.; Wart, J.V. Estimating maize yield potential and yield gap with agro-climatic zones in China—Distinguish irrigated and rainfed conditions. Agric. Forest Meteorol. 2017, 239, 108–117. [Google Scholar] [CrossRef]
  39. Van Wart, J.; Kersebaum, K.C.; Peng, S.; Milner, M.; Cassman, K.G. Estimating crop yield potential at regional to national scales. Field Crops Res. 2013, 143, 34–43. [Google Scholar] [CrossRef] [Green Version]
  40. Meng, Q.F.; Hou, P.; Wu, L.; Chen, X.P.; Cui, Z.L.; Zhang, F.S. Understanding production potentials and yield gaps in intensive maize production in China. Field Crops Res. 2013, 143, 91–97. [Google Scholar] [CrossRef] [Green Version]
  41. Hou, P.; Cui, Z.L.; Bu, L.D.; Yang, H.S.; Zhang, F.S.; Li, S.K. Evaluation of a modifed Hybrid-Maize model incorporating a newly developed module of plastic film mulching. Crop Sci. 2014, 54, 2796–2804. [Google Scholar] [CrossRef]
  42. Wang, J.; Yang, P. Potential flue gas desulfurization gypsum utilization in agriculture: A comprehensive review. Renew. Sustain. Energy Rev. 2018, 82, 1969–1978. [Google Scholar] [CrossRef]
  43. Wang, S.J.; Chen, C.H.; Xu, X.C.; Li, Y.J. Amelioration of alkali soil using flue gas desulfurization byproducts: Productivity and environmental quality. Environ. Pollut. 2008, 151, 200–204. [Google Scholar] [CrossRef]
  44. Maas, E.V.; Hoffman, G.J.; Chaba, G.D.; Poss, J.A.; Shannon, M.C. Salt sensitivity of corn at various growth stages. Irrig. Sci. 1983, 4, 45–57. [Google Scholar] [CrossRef]
  45. Butcher, K.; Wick, A.F.; DeSutter, T.; Chatterjee, A.; Harmon, J. Soil salinity: A threat to global food security. Agron. J. 2016, 108, 2189–2200. [Google Scholar] [CrossRef]
  46. Yan, P.; Yue, S.C.; Meng, Q.F.; Pan, J.X.; Ye, Y.L.; Chen, X.P.; Cui, Z.L. An understanding of the accumulation of biomass and nitrogen is benefit for Chinese maize production. Agron. J. 2016, 108, 895. [Google Scholar] [CrossRef]
  47. Lizaso, J.I.; Ruiz-Ramos, M.; Rodríguez, L.; Gabaldon-Leal, C.; Oliveira, J.A.; Lorite, I.J.; Sánchez, D.; García, E.; Rodríguez, A. Impact of high temperatures in maize: Phenology and yield components. Field Crops Res. 2018, 216, 129–140. [Google Scholar] [CrossRef] [Green Version]
  48. Li, R.; Liu, P.; Dong, S.; Zhang, J.; Zhao, B. Increased maize plant population induced leaf senescence, suppressed root growth, nitrogen uptake, and grain yield. Agron. J. 2019, 111, 1–11. [Google Scholar] [CrossRef]
  49. Mu, X.; Chen, Q.; Chen, F.; Yuan, L.; Mi, G. Dynamic remobilization of leaf nitrogen components in relation to photosynthetic rate during grain filling in maize. Plant Physiol. Biochem. 2018, 129, 27–34. [Google Scholar] [CrossRef]
  50. Srivastava, R.K.; Panda, R.K.; Chakraborty, A.; Halder, D. Enhancing grain yield, biomass and nitrogen use efficiency of maize by varying sowing dates and nitrogen rate under rainfed and irrigated conditions. Field Crops Res. 2018, 221, 339–349. [Google Scholar] [CrossRef]
  51. Zhao, Y.; Yan, Z.; Qin, J.; Ma, Z.; Zhang, Y.; Zhang, L. The potential of residues of furfural and biogas as calcareous soil amendments for corn seed production. Environ. Sci. Pollut. Res. 2016, 23, 6217–6226. [Google Scholar] [CrossRef]
  52. Cui, Z.L.; Chen, X.P.; Zhang, F.S. Development of regional nitrogen rate guidelines for intensive cropping systems in China. Agron. J. 2013, 105, 1411–1416. [Google Scholar] [CrossRef]
  53. Ju, X.T.; Gu, B.J.; Wu, Y.Y.; Galloway, J.N. Reducing China’s fertilizer use by increasing farm size. Glob. Environ. Chang. 2016, 41, 26–32. [Google Scholar] [CrossRef]
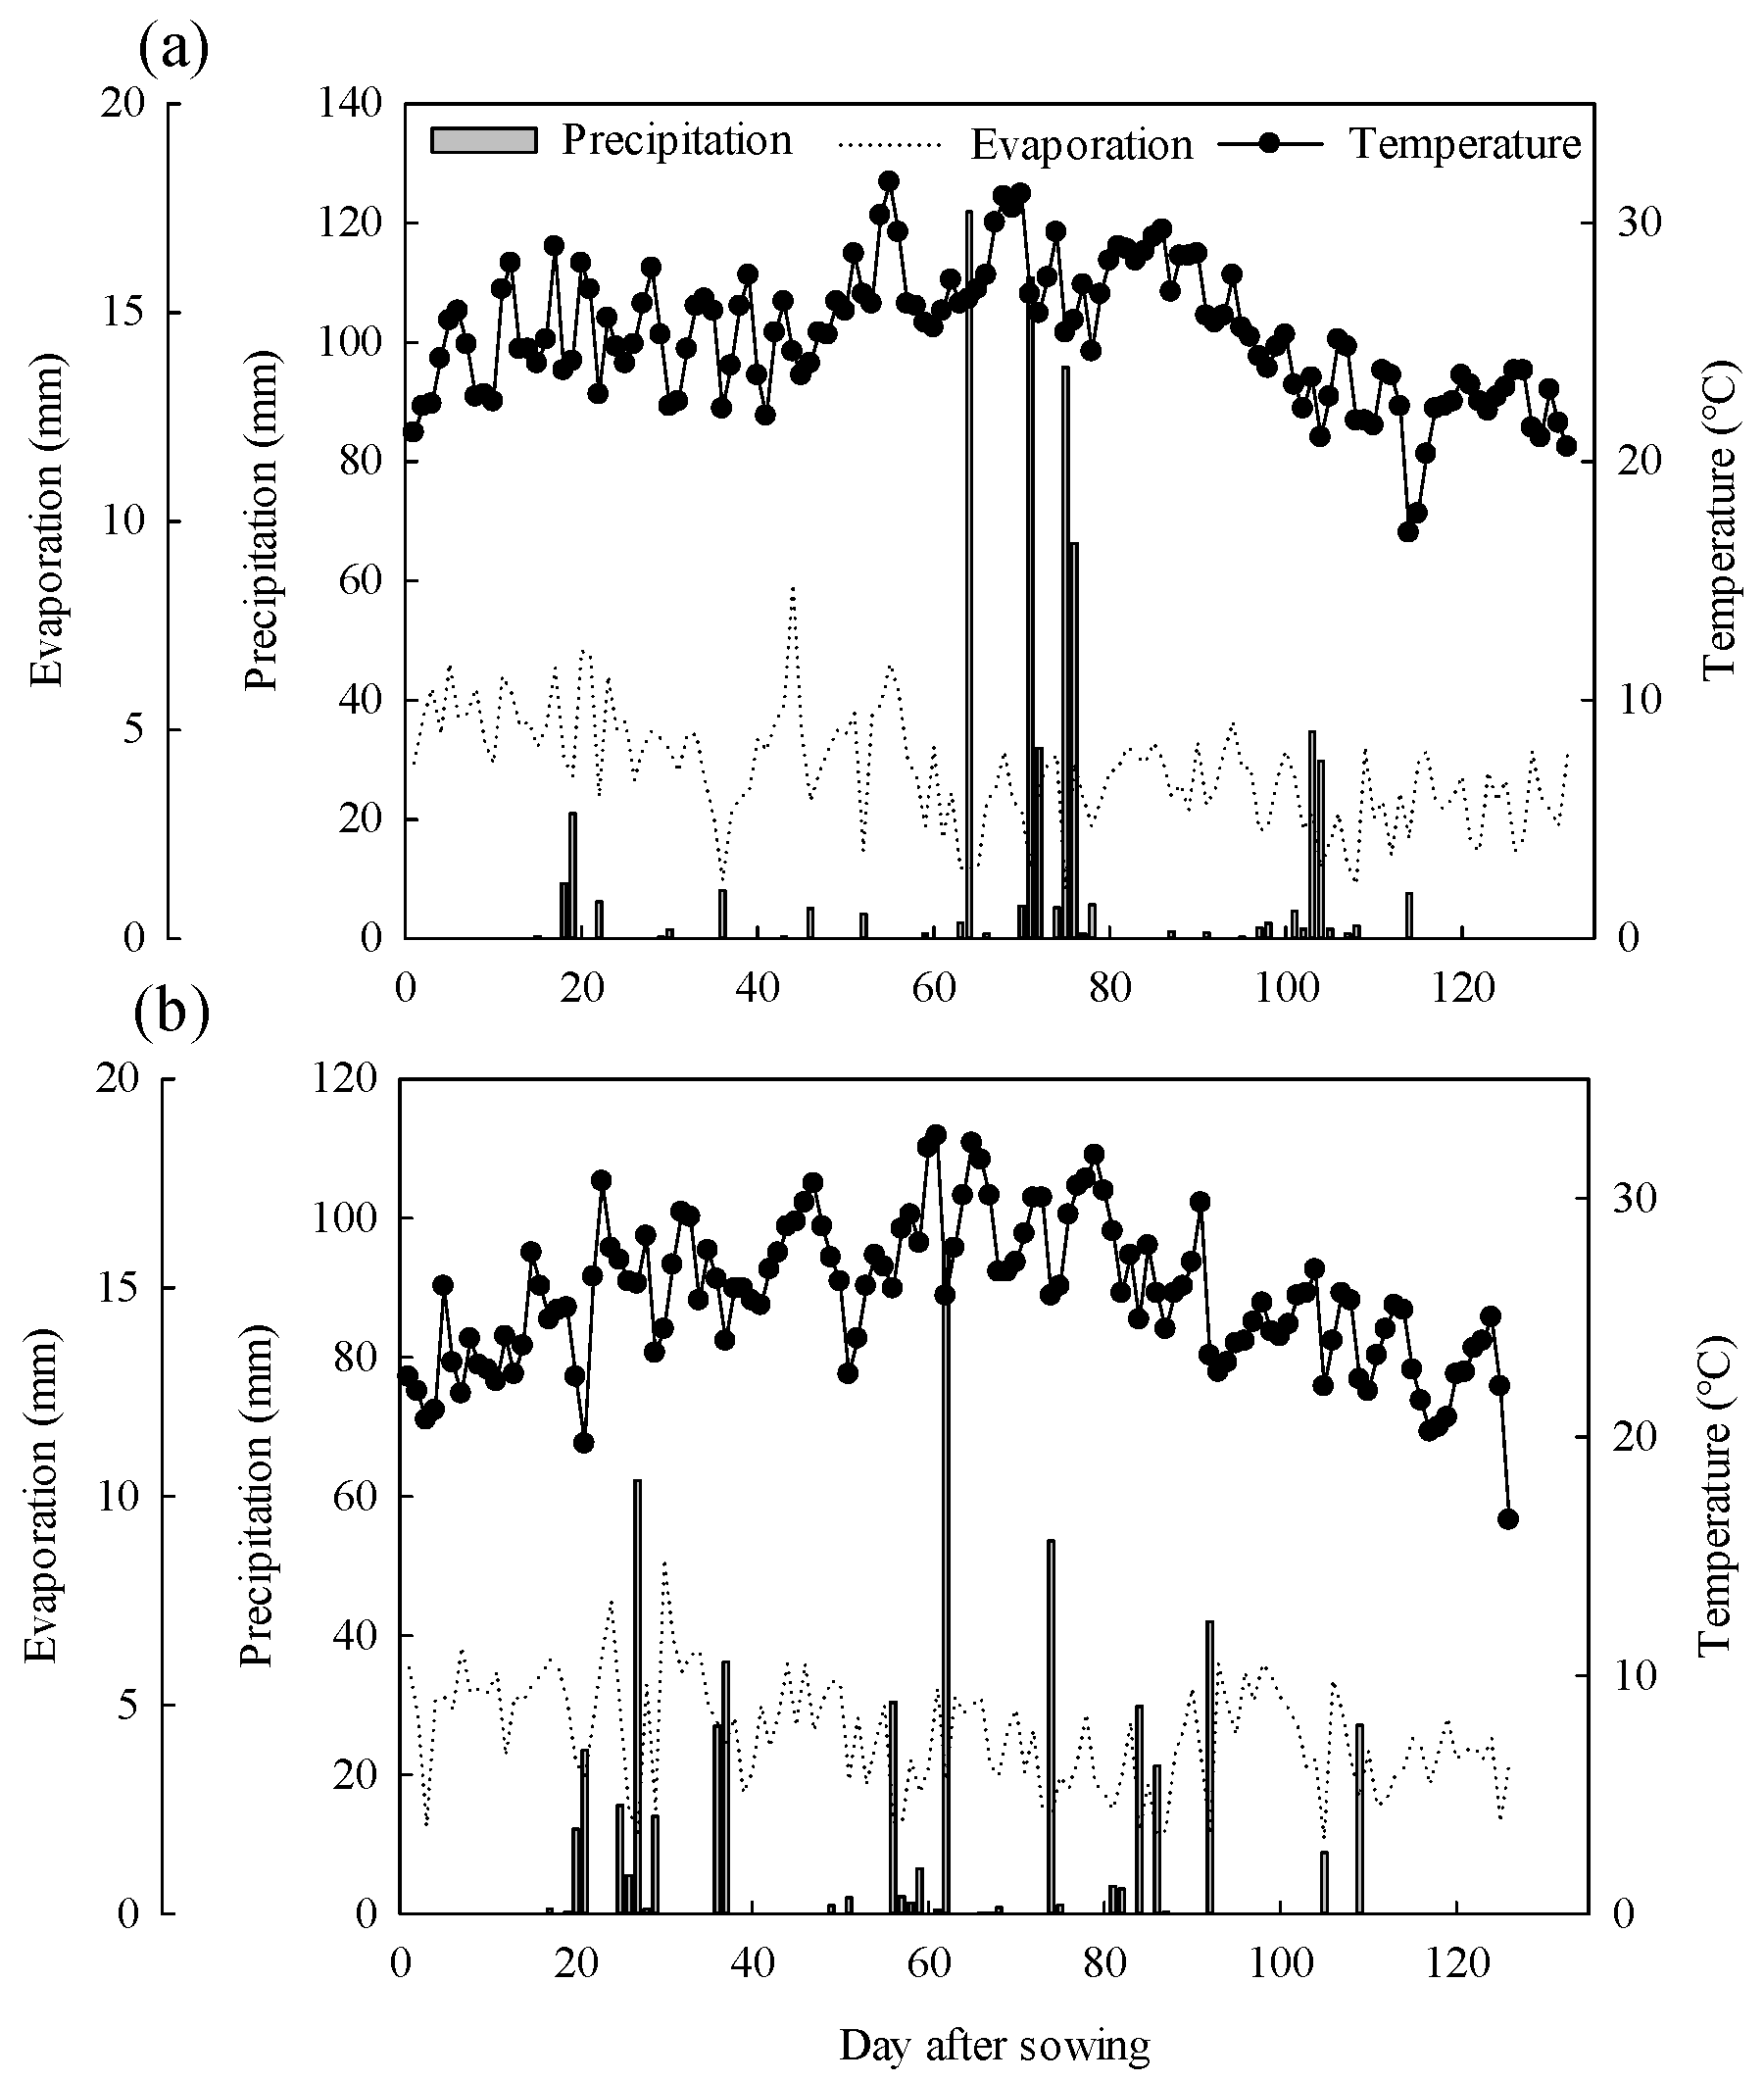
Figure 1. Precipitation, evaporation, and daily mean temperature during the spring maize growing seasons (May–October) in 2015 (a) and 2016 (b) in Kenli County.
Agronomy 09 00573 g001
Figure 2. Simulated and measured biomass accumulation with different treatment (control and CA) in 2015 (a) and 2016 (b) during different growth stages. M-control and M-CA was in moderate salinity level. H-control and H-CA was in high salinity level. V6, V6-VT, and VT-R6 were represented for six-leaf stage, from six-leaf stage to tassel stage, and tasseling to mature stage, respectively. Values with the same salinity level, year, and stage followed by the different letters (a and b, A and B) do differ significantly from each other (p < 0.05).
Agronomy 09 00573 g002
Figure 3. Contents of N, P, K Ca, Mg, and Na at maturity with different treatment (control and CA) and salinity levels in 2015 and 2016. (AF) represent the contents of N, P, K Ca, Mg, Na. M-control and M-CA was in moderate salinity level. H-control and H-CA was in high salinity level. Values with the same salinity level, year, and stage followed by the different letters (a and b, A and B) do differ significantly from each other (p < 0.05).
Agronomy 09 00573 g003
Table 1. Basic physical and chemical properties in the top 0–20 cm and 20–40 cm soil profile before sowing in 2015 with moderate and high salinity levels.
CharacteristicsModerate Salinity LevelHigh Salinity Level
0–20 cm20–40 cm0–20 cm20–40 cm
Sand (%)69.189.473.581.5
Silt (%)28.09.2124.016.8
Clay (%)2.861.432.451.72
pH8.198.338.108.35
EC (dS m−1)3.914.056.306.25
Organic carbon (g kg−1)4.330.622.990.75
Total N (g kg−1)0.670.360.530.22
Olsen-P (mg kg−1)4.981.956.721.85
Exchangeable K (mg kg−1)772511050
Exchangeable Ca (mg kg−1)3760270135673409
Exchangeable Na (mg kg−1)4262707771094
Exchangeable Mg (mg kg−1)467211527515
Table 2. Maize yield, yield components, and economic return with different treatments (control and CA), salinity levels (moderate and high salinity levels), and year (2015 and 2016).
Yield
(Mg ha−1)
The Ratio of YP (%)Ear Number (104 ha−1)Grain Number per EarGrain Weight
(g 1000−1)
Economic Return ($ ha−1)
2015 Moderate
control5.5838.26.424202691351
CA7.5351.66.565282831489
LSD0.051.51 ns48.2ns
2015 High
control2.0514.04.25329207496.2
CA4.2329.05.94451264690.3
LSD0.052.08 1.1112133.3
2016 Moderate
control7.8849.97.734002951907
CA8.3152.67.965082901678
LSD0.050.42 ns50.4ns
2016 High
control4.4228.05.863042301070
CA6.7842.98.064012811307
LSD0.051.61 1.6396.437.9
CA and control indicate the combination and control treatments, respectively; the ratio of YP (yield potential) = yield/YP.
Table 3. Maize yield and yield components as affected by treatments, salinity levels, and year. All data for the ANOVA come from Table 2.
ANOVASum of SquaresDegrees of FreedomMean of the SquaresF Valuep Value
Yield (Mg ha−1)
Year24.0181.00024.01852.70<0.0001
Salinity levels52.3301.00052.330114.82<0.0001
Treatment17.9431.00017.94339.37<0.0001
Ear number (104 ha−1)
Year15.5891.00015.58966.68<0.0001
Salinity levels7.7721.0007.77233.24<0.0001
Treatment6.7931.0006.79329.06<0.0001
Grains per ear
Year5097.71.0005097.73.640.0744
Salinity levels517291.0005172936.98<0.0001
Treatment707901.0007079050.60<0.0001
Grain weight (g 1000−1)
Year2070.21.0002070.26.320.0231
Salinity levels9067.61.0009067.627.66<0.0001
Treatment4987.21.0004987.215.220.0013
Table 4. Soil pH, soil organic carbon (SOC), soil Ca2+, and Na+ contents in different soil layers with different treatments (control and CA), and salinity levels (moderate and high) at post-harvest in 2016.
Soil pHSOC (g kg−1)Soil Ca2+ (g kg−1)Soil Na+ (g kg−1)
0–20 cm20–40 cm0–20 cm20–40 cm0–20 cm20–40 cm0–20 cm20–40 cm
Moderate
control8.178.235.052.523.313.040.460.29
CA8.088.125.762.464.243.080.380.25
LSD0.050.060.080.64ns0.15nsnsns
High
control8.338.333.931.973.532.971.420.82
CA8.268.294.852.824.333.290.660.54
LSD0.050.05ns0.860.590.260.270.230.23
ns, not significant.