Article

The Proportion of Superior Grains and the Sink Strength are the Main Yield Contributors in Modern Winter Wheat Varieties Grown in the Loess Plateau of China

1
Shaanxi Key Laboratory of Disaster Monitoring and Mechanism Simulating, College of Geography and Environment, Baoji University of Arts and Sciences, Baoji 721013, China
2
State Key Laboratory of Soil Erosion and Dryland Farming on the Loess Plateau, Institute of Soil and Water Conservation, Northwest A&F University and Chinese Academy of Sciences, Yangling 712100, China
3
Institute of Land Engineering and Technology, Shaanxi Land Construction Group, Xi’an 710000, China
4
The UWA Institute of Agriculture, The University of Western Australia, LB 5005 Perth, WA 6001, Australia
5
CSIRO Agriculture & Food, Private Bag No. 5, Wembley, WA 6913, Australia
*
Author to whom correspondence should be addressed.
Wei Chen and Yingying Sun contributed equally to this work.
Agronomy 2019, 9(10), 612; https://doi.org/10.3390/agronomy9100612
Submission received: 31 July 2019 / Revised: 30 September 2019 / Accepted: 1 October 2019 / Published: 5 October 2019

Abstract

:
Understanding the changes in phenotype resulting from the selection pressure and agronomic adaptation of grain yield provide an indication of the pathways for future increases in grain yield. Six dry land representative winter wheat cultivars (Triticum aestivum L.) released from 1942 to 2004 in the Loess Plateau of China were investigated to determine how the yield components of winter wheat were associated with grain yield at the Changwu Agricultural Research Station during the 2011–2012 and 2012–2013 seasons, using a completely randomized block design with three replicates. Plant height, aboveground biomass, grain yield, and yield components were measured, together with the traits of superior and inferior grains and the pre-anthesis stored dry matter remobilized to the grain was determined. In the relatively wet 2011–2012 season, there was a significant increase in grain yield and aboveground biomass with the year of release, but not in the dry 2012–2013 season. The harvest index (HI) and average grain weight (AGW) increased significantly with the year of release in both cropping seasons. HI and AGW are likely potential traits for improving grain yield of winter wheat in the Loess Plateau. The increase in HI mainly resulted from the decrease in plant height, and the increase in the use of pre-anthesis stored assimilates for grain filling. The increase in AGW mainly resulted from the increase in the proportion of superior grain (SG) and the decrease in the proportion of inferior grain (IG) in the whole spike in both cropping seasons. Depending on the climatic conditions, the different winter wheat cultivars showed different ability to use pre-anthesis stored assimilates. Modern wheat cultivars had higher yield under different rainfall conditions, and high ability to use pre-anthesis stored assimilates to fill the grain than earlier released cultivars. Both, the increase in sink capacity and source availability, should be considered as a strategy for increasing future grain yield in Loess Plateau of China.

1. Introduction

The yield of winter wheat has increased with the release of new winter wheat varieties in the UK from 1972 to 1995 [1], France from 1946 to 1992 [2], United States from 1959 to 2008 [3], Turkey from 1931 to 2006 [4], Australia from 1958 to 2007 [5], and Argentina from 1918 to 2011 [6]. Besides breeding progress, agronomic factors have also influenced the genetic gains, e.g., in Germany from 1983 to 2012 [7]. China has also made some progress in increasing the grain yield of winter wheat through the release of varieties in different time periods, at a national scale [8], and in different regions [9,10,11,12]. Further yield improvement is still the primary target in the Chinese wheat breeding programs, mainly because of the decrease in the size of wheat cropping areas [13]. The Loess Plateau is located in northwest China and covers an area of 0.65 million km2, is one of the most important winter wheat production regions, and accounts for 10% of the total national wheat production [14,15]. This region is listed as one of the areas that are most vulnerable to climate change [16]. The annual precipitation in this region has been found to decrease significantly from 1956 to 2008 [17]. The better understanding of how wheat yield traits respond to climate change may offer useful information on wheat breeding that the adaption to future climate conditions in this region.
The yield of winter wheat integrates two main components, grain number per square meter (GN) and average grain weight (AGW). GN is determined by the spike number per square meter (SN) and the number of grains per spike (GNS). The average grain weight (AGW) is determined by the weight of individual grains located in different spikelets and the positions within the spikelet. Grains are classified as superior and inferior grains depending on the size. The apical spikelet is mainly composed of inferior grains, while the middle and basal spikelets are usually composed of superior grains. In the basal and middle spikelets, the first and second basal grains of each spikelet are detached as superior grains, whereas the most distal grain on the same is an inferior grain [18,19,20]. The differences between these two types of grains in the enzyme activity in the conversion of photosynthetic assimilate into starch [18,21] and hormone levels [22,23] render the basal grains in the central spikelets (superior grains) heavier than those in the near apical and near basal spikelets (inferior grains). The low individual grain weight of the inferior grains is considered to cause stagnation to increase the grain yield of rice [24] and wheat [25], because of their influence on grain weight [18,26].
Increases in wheat grain yield have been achieved through the selection of winter wheat varieties, but the contribution that GNS, SN, and AGW have made to gains yield is unclear, particularly the contribution of SN and AGW. Studies conducted in the Southern Yellow and Huai valley region [12], and the Henan Province of China [27], have shown that the increase in GY (grain yield) is associated with both an increase in GW and SN. Other studies conducted in the Yangtze River Basin [9], the Henan Province of China [28], and in Turkey under dryland conditions [4] showed that the increase in GY results from an increase in GW and a decrease in SN. Studies conducted in Spain [29] and Argentina [6] have also shown that the increase in GY resulted, mainly from GN while GW remained unchanged. These differences are presumably associatedwith the different strategies that winter wheat varieties have for enhancing their yield when grown in different environments (Genotype × Environment × Management).
The proposal that SN and AGW compete for nitrogen (N) and carbon (C) assimilates implies that grain filling is source limited, when the rate of increasing grain size exceeds the rate of increasing sink under rainfed conditions [30] or under limited growth conditions [31]. The assumption that SN and AGW do not compete for assimilates [32] implies that a reduction in AGW is the result of increasing either the proportion of grains with low potential grain weight, such as apical grains in middle spikelets and apical spikelets in the spike [33], usually seem as inferior grains [18,19], or of increasing the number of secondary spike tillers [20,34]. The spikelet and grain positions have a great influence on grain weight [19]. A study conducted in Shaanxi Province in China showed that the increase in grain yield of modern winter wheat varieties mainly came from an increase in grain weight accompanied by increased grain weight in specific grain positions [35], i.e., superior grains.
Grain yield could be considered as the balance between the supply of carbohydrates (source) and the capacity of the grains to accumulate available carbohydrates (sink) [36]. The sink and source need to match each other to achieve high yield [37]. Optimizing source-sink interactions is critical to improving grain yield if more photosynthesis assimilates are to be transported to and fully used by the sink [38]. If the assimilate supply of the source exceeds the demand of the sink, it may contribute to the growth of organs that do not contribute to yield, resulting in redundancy of source [39]. Conversely, if the rate of supply from the “source” is less than the demand from “sink”, then a small sink with inferior characteristics results. Consequently, enhancing the source-sink interactions maintaining assimilate partitioning to reproductive structures for forming the yield without under-investing in roots, stems, and leaves is important in improving the GY of wheat [40].
Different climate conditions influence the yield formation process and the different wheat varieties have different strategies to adapt the climate conditions. Here, we report a study aimed to determine grain yield and yield components in six dryland representative winter wheat cultivars released from 1942 to 2004. The aim was (i) to elucidate the year’s effects (climate conditions) on sink strength, particularly the traits of superior and inferior grains and (ii) to determine if changes occurred with the year of release.

2. Material and Methods

2.1. Location and Site Description

A field study was conducted during the winter wheat successive seasons of 2011–2012 and 2012–2013 at the Chinese Academy of Sciences’ Changwu Agricultural Research Station. The site (107°40′30″ E, 35°14′30″ N, 1200 m above the sea level) located in a typical area of the semi-arid Loess Plateau of China’s Shaanxi Province. The soil at the site is a Cumuli–Ustic Isohumosols [41], with 4% sand, 59% silt, 37% clay, bulk density of 1.3 g cm−3, pH 8.4, organic matter content of 11.8 g kg−1, total N content of 0.87 g kg−1, 3.15 mg kg−1 mineralized N, Olsen–P of 14.4 mg kg−1, and NH4OAc-extractable K of 144.6 mg kg−1. The precipitation and temperature during two successive growth seasons are summarized in Figure 1.

2.2. Plant Material

Six winter wheat varieties: Bima1, Fengchan3, Hanxuan10, Xiaoyan6, Changwu134, and Changhan58, were selected because they were commonly grown during the last six decades (the 1950s and 2000s) in the Loess Plateau of China. The characteristics of the six winter wheat varieties and the year of release are presented in Table 1.

2.3. Experimental Design and Crop Management

In each growing season (2011–2012 and 2012–2013), six winter wheat cultivars were sown on the 18th of September in a randomized complete block design with three replicates of each cultivar. The six cultivars were sown in plots 5.0 m long × 3.0 m wide (20 rows, 0.20 m apart) at a rate of 250 seeds m−2, which is the rate adopted by the local winter wheat growers. The local main winter wheat cultivation patterns were used in each season, which included the application of fertilizer as basal fertilizers without covering the soil during the summer fallow period. Prior to sowing each plot received N as urea at a rate of 150 kg N ha−1 and 180 kg P ha−1 as amended superphosphate. No irrigation was supplied to the plots during the two growing seasons. Seeds of all genotypes were treated with Fludioxonil before seeding. Weeds were controlled by spraying with a Bridal (diflufenican), 200 mL/ha and Select, (clethodim) 250 mL/ha at 49 days after sowing (DAS). Insects were controlled with dimethoate (100 mL/ha) at 35 DAS and Fastac (alpha cypermethrin), 100 mL/ha at 114 DAS.

2.4. Sampling and Measurements

The dates of the developmental stages (phenostages) for anthesis and maturity (flag leaves had turned yellow) were recorded for each cultivar [42]. Daily observations were made, and the phenostage was noted when 50% of the plants in each plot had achieved that particular stage. Phenostages were defined using the Zadoks’ scale of cereal development [43]. Comparisons among cultivars in each treatment were made in days after sowing.
Aboveground plant material was collected from 1 m2 area (six adjacent rows of 1 m length) at anthesis (Z64) and at the final harvest of each cultivar for measuring aboveground dry matter (ABDM), grain yield and grain yield components. Sampling sites in each plot were assigned randomly, and there were three replicates per cultivar. The plant material cut at the soil surface and ears were separated from the plant material and counted before being dried at 70 °C for at least 48 h, and weighed. At maturity, the ears were threshed by hand, grain, and chaff re-dried and weighed. Grain number was counted by hand, and the mean individual grain weight was determined for each sample. A total of 50 spikes per plot were selected and labeled when they were on anthesis on the same day. The selected spikes were labeled with small plastic tags and used for measuring the superior and inferior grains, following the method described by Jiang et al. [13]. Briefly, the whole spike was divided into different spikelets, the grains located in the basal 1 to 5 spikelets were classified as superior grains; the first and second basal grains of the basal spikelets 6 to 12 (middle spikelets) were termed superior grains, whereas the third, fourth, and fifth distal grains on the same spikelets were termed inferior grains; the grains located in the top spikelets (13 to more depending on the wheat varieties) were classified inferior grain. The proportion (number) of superior and inferior grain types was estimated by dividing the superior and inferior grain number by the total number of grains per spike. Each spikelet was detached and separately weighed after being dried for 24 h at 60 °C, then the total per spikelet was measured for determining the spikelet weight per spike, the chaff was omitted in determining the spikelet weight. The number of spikelets per spike was counted by manual. Plant height was measured the day before final harvest from the soil surface to the top of the main spike (excluding awns) in each of five plants in each plot.
The difference between the aboveground biomass at anthesis and the final harvest was designated as post-anthesis gain in ABDM. The estimates of pre-anthesis stored dry matter remobilized to the grain were made from the analysis of the relationship between grain yield and the post-anthesis gain in ABDM [44,45,46]. This relationship assumes that if no remobilization of pre-anthesis stored dry matter occurred during grain filling, the ratio between grain yield and the gain in post-anthesis dry matter production is 1 [46]. Data points above the 1:1 line indicate that the increase in grain yield was proportionally greater than the gain in the biomass after anthesis, implying that grain yield was supported by pre-anthesis stored assimilates Data points below the 1:1 line indicate that the increase in grain yield was proportionally smaller than the increase in the biomass produced after anthesis, implying that the gain in biomass after anthesis was not converted fully into grain yield.

2.5. Drought Index

The drought index (DI) for the annual precipitation was calculated using Equation (1) to assess variations and the status in precipitation among different years [47]:
DI = (P − M)/σ
where P is the annual precipitation, M is the average precipitation, and σ is the standard error for the precipitations. DI is used to distinguish among the wet (DI > 0.35), normal (−0.35 ≤ DI ≤ 0.35), and dry (DI < −0.35) growing seasons [48]. The DI for the annual precipitation indicates that while the 2011–2012 cropping season fell into the “wet” category, the 2012–2013 season was the “dry” category.

2.6. Statistical Analysis

The two years were analyzed separately. The cultivar effect (year of release) on traits was assessed by firstly analyzing the data for normality and then by one-way ANOVA using SPSS (15th edition; VSN International, UK). Where significant treatment effects were identified, least significant difference (LSD) (P = 0.05) are given in the figures and tables. Chronological trends of phenotypic traits were tested using least-square regressions of trait deviation vs. the year of release. The relationship between spikelet number/spikelet weight and grain number per spike/average grain weight was determined by linear regression in SPSS. The frequency of individual grain weight was also fitted to a Gaussian distribution function to test the homogeneity of observations. These procedures were performed using SigmaPlot v. 14.0 software. Experimental error variances were homogeneous (P > 0.05) over environments using Bartlett’s test for all traits.

3. Results

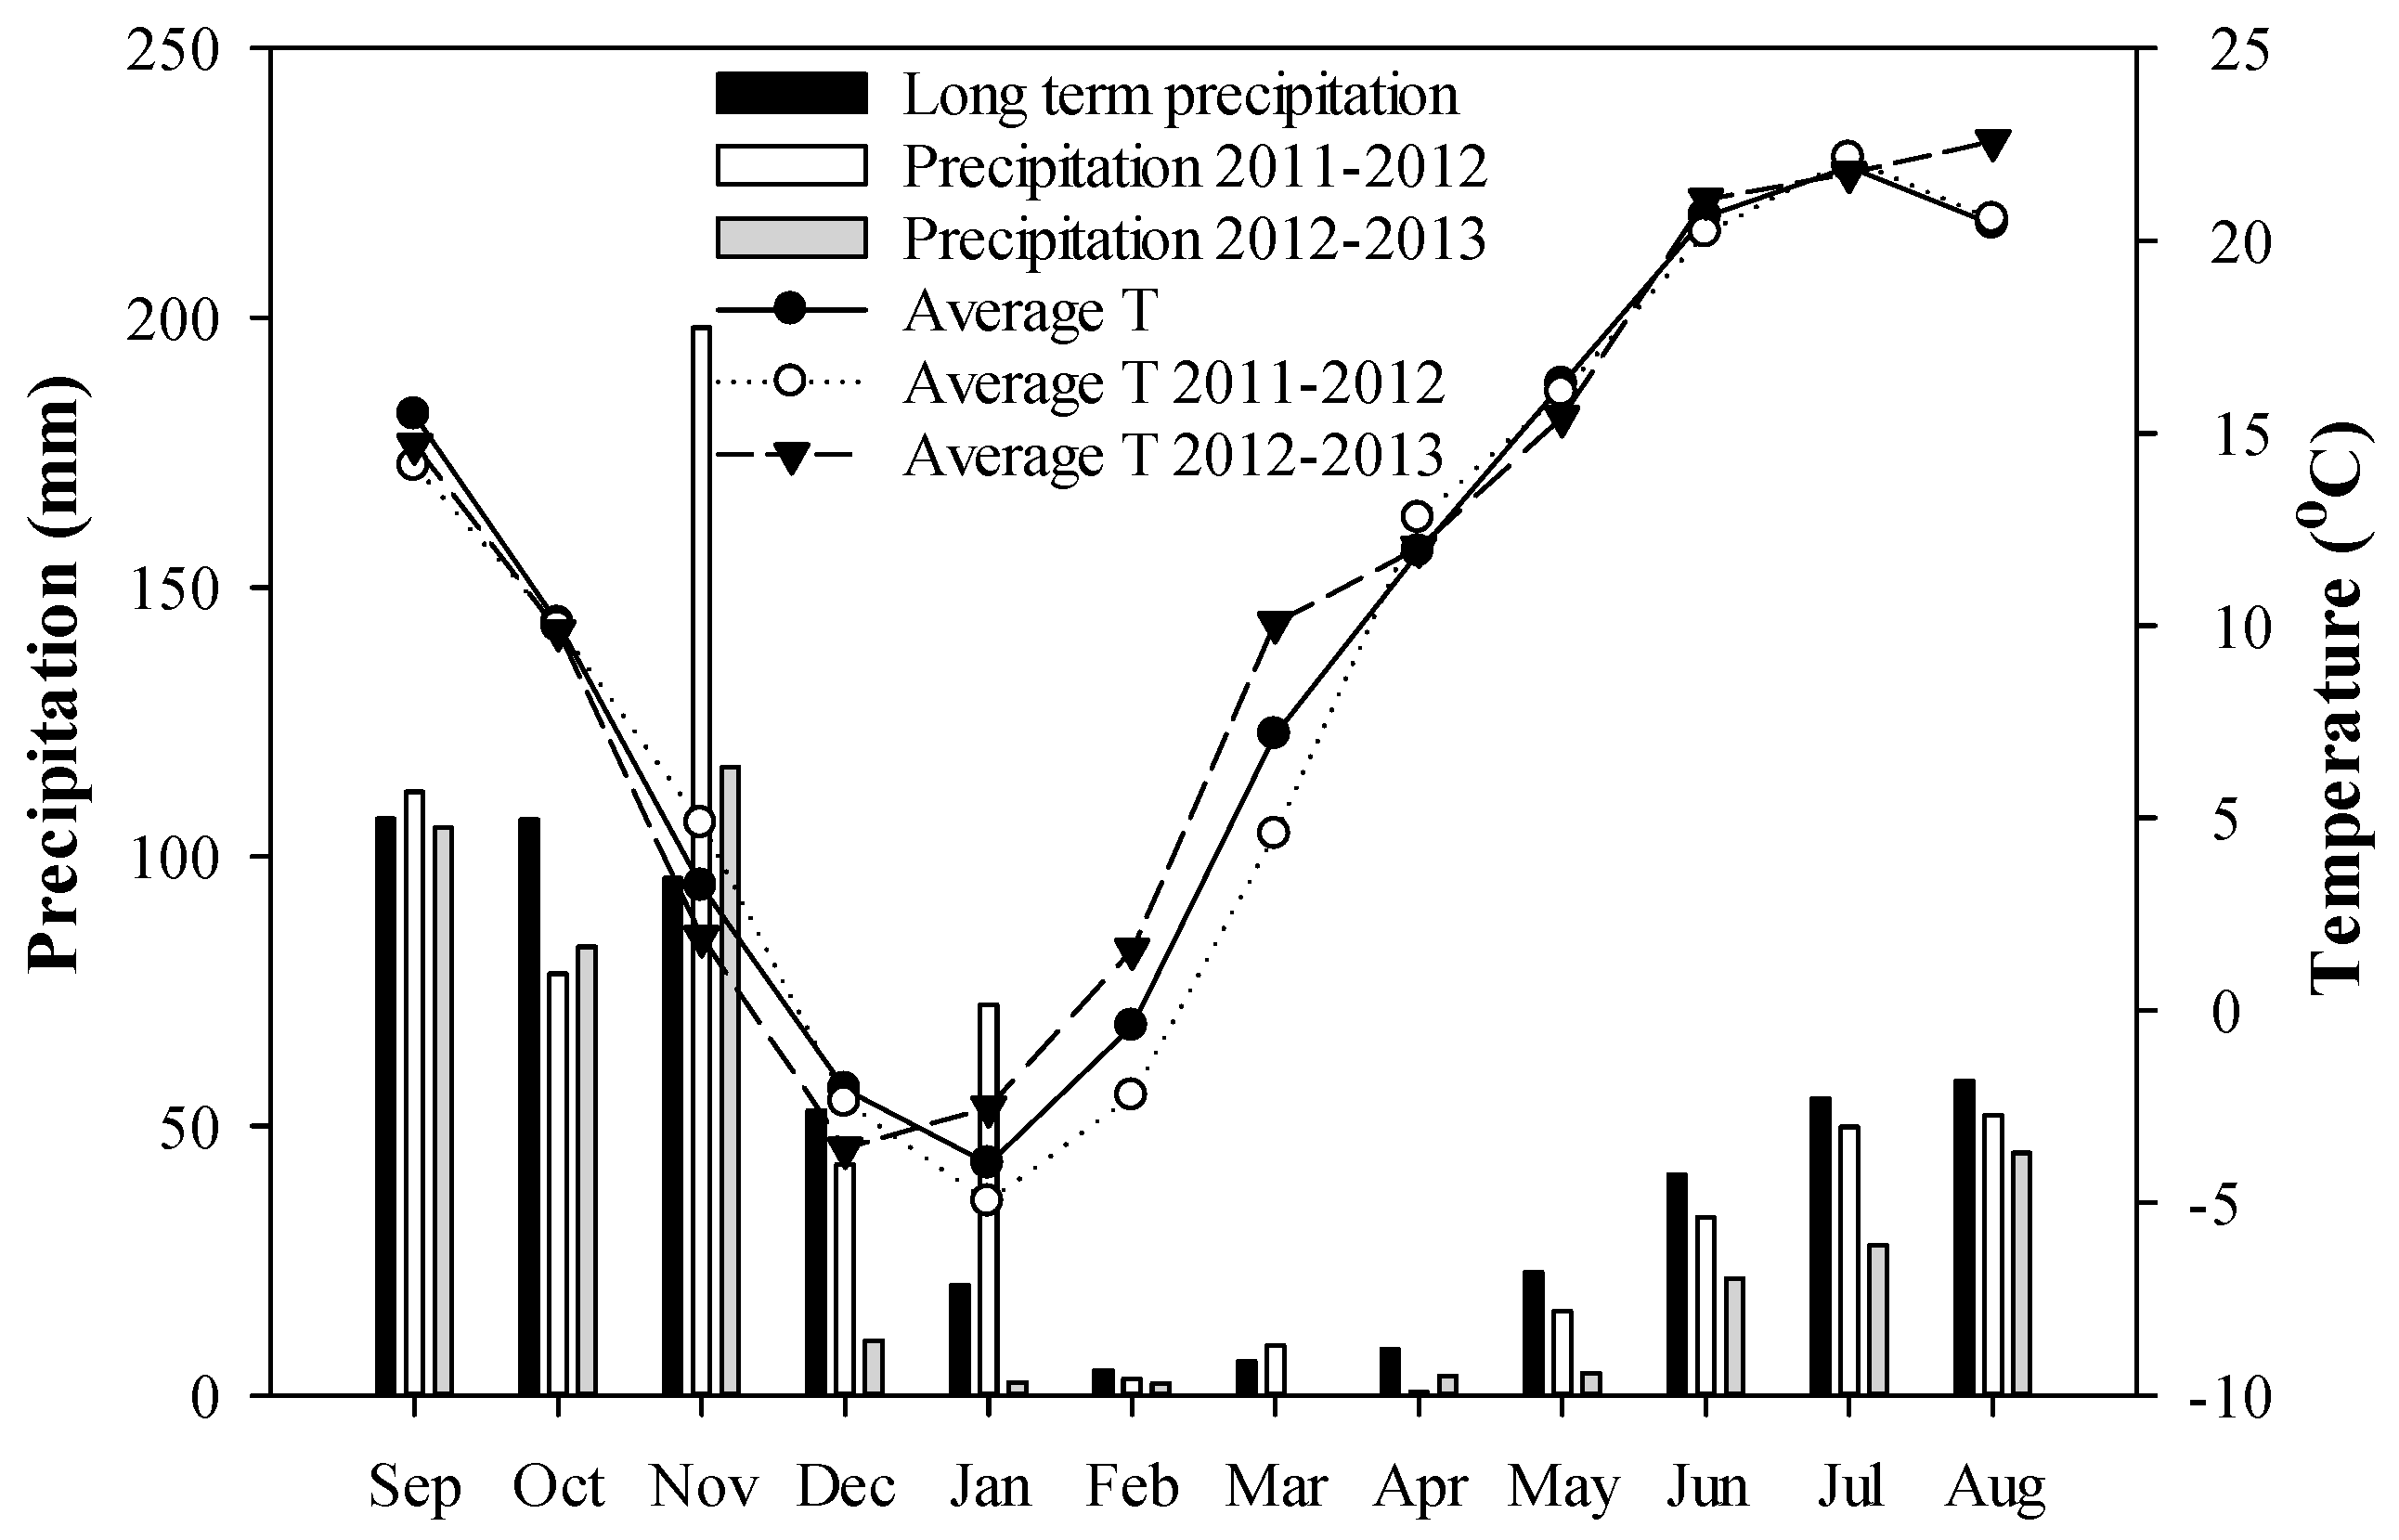
3.1. Seasonal Conditions

The long-term (1957–2006) annual mean precipitation at Changwu is 580 mm, and more than 60% occurs from June to September (summer fallow period) (Figure 1). There was a large difference in the precipitation during the 2011–2012 and 2012–2013 at the Changwu Agricultural Research Station, particularly during the winter wheat growth period. In the first (2011–2012) season, the total precipitation was 667 mm, of which 190 mm was in the period of fallow and 477 mm was in the winter wheat growing period. In the second (2012–2013) season, the total precipitation was 422 mm, of which 188 mm was during the summer fallow period and 234 mm in the winter wheat growing period. Precipitation in the first growing season was thus atypical and more than 50% of that in the second growing season. The average monthly mean temperature from 2007 to 2013 is 10.0 °C; the average monthly mean temperature in summer fallow and crop growth period is 21.0 °C and 7.8 °C, respectively (Figure 1). In the first (2011–2012) growing season, the monthly average temperature was 9.6 °C, the average monthly mean temperature in summer fallow and crop growth period was 21.3 °C and 6.9 °C, respectively. In the second growing season, the monthly average temperature was 10.4 °C, the average monthly mean temperature in summer fallow and crop growing period was 22.2 °C and 8.5 °C, respectively. On average, the temperature during the second growing season was higher than during the first growing season.

3.2. Phenology

Time to maturity was prolonged with the years of winter wheat varieties release (Table 2). The anthesis, maturity date, and grain filling during latest winter wheat cultivar (Changhan58) were significantly longer than that of the earliest winter wheat cultivar (Bima1); however, the difference in phenology in each variety (anthesis, maturity date, and grain filling during) was not significant. Wheat varieties released from 1942 to 2004 flowered earlier 1–2 days of each other, but the difference in time to maturity was prolonged by six days in Bima1 released in 1942 and Changhan58 released in 2004 during the 2011–2012 growing season. The growth period (from sowing to maturity) was shorter in 2012–2013 than in 2011–2012. Bima1 and Hanxuan10 had the earliest maturity in 2011–2012, but Bima1 had the shortest growth period in 2012–2013 among all winter wheat varieties in this study.

3.3. Plant Height

Plant height tended to decline linearly with the year of release in the 2011–2012 season, particularly from 1966 (variety Hanxuan10) to 1981 (variety Xiaoyan6), but in 2012–2013 plant height did not follow any trend with the year of release (Figure 2). Across varieties, the average plant height in 2011–2012 was 25% greater than in 2012–2013.

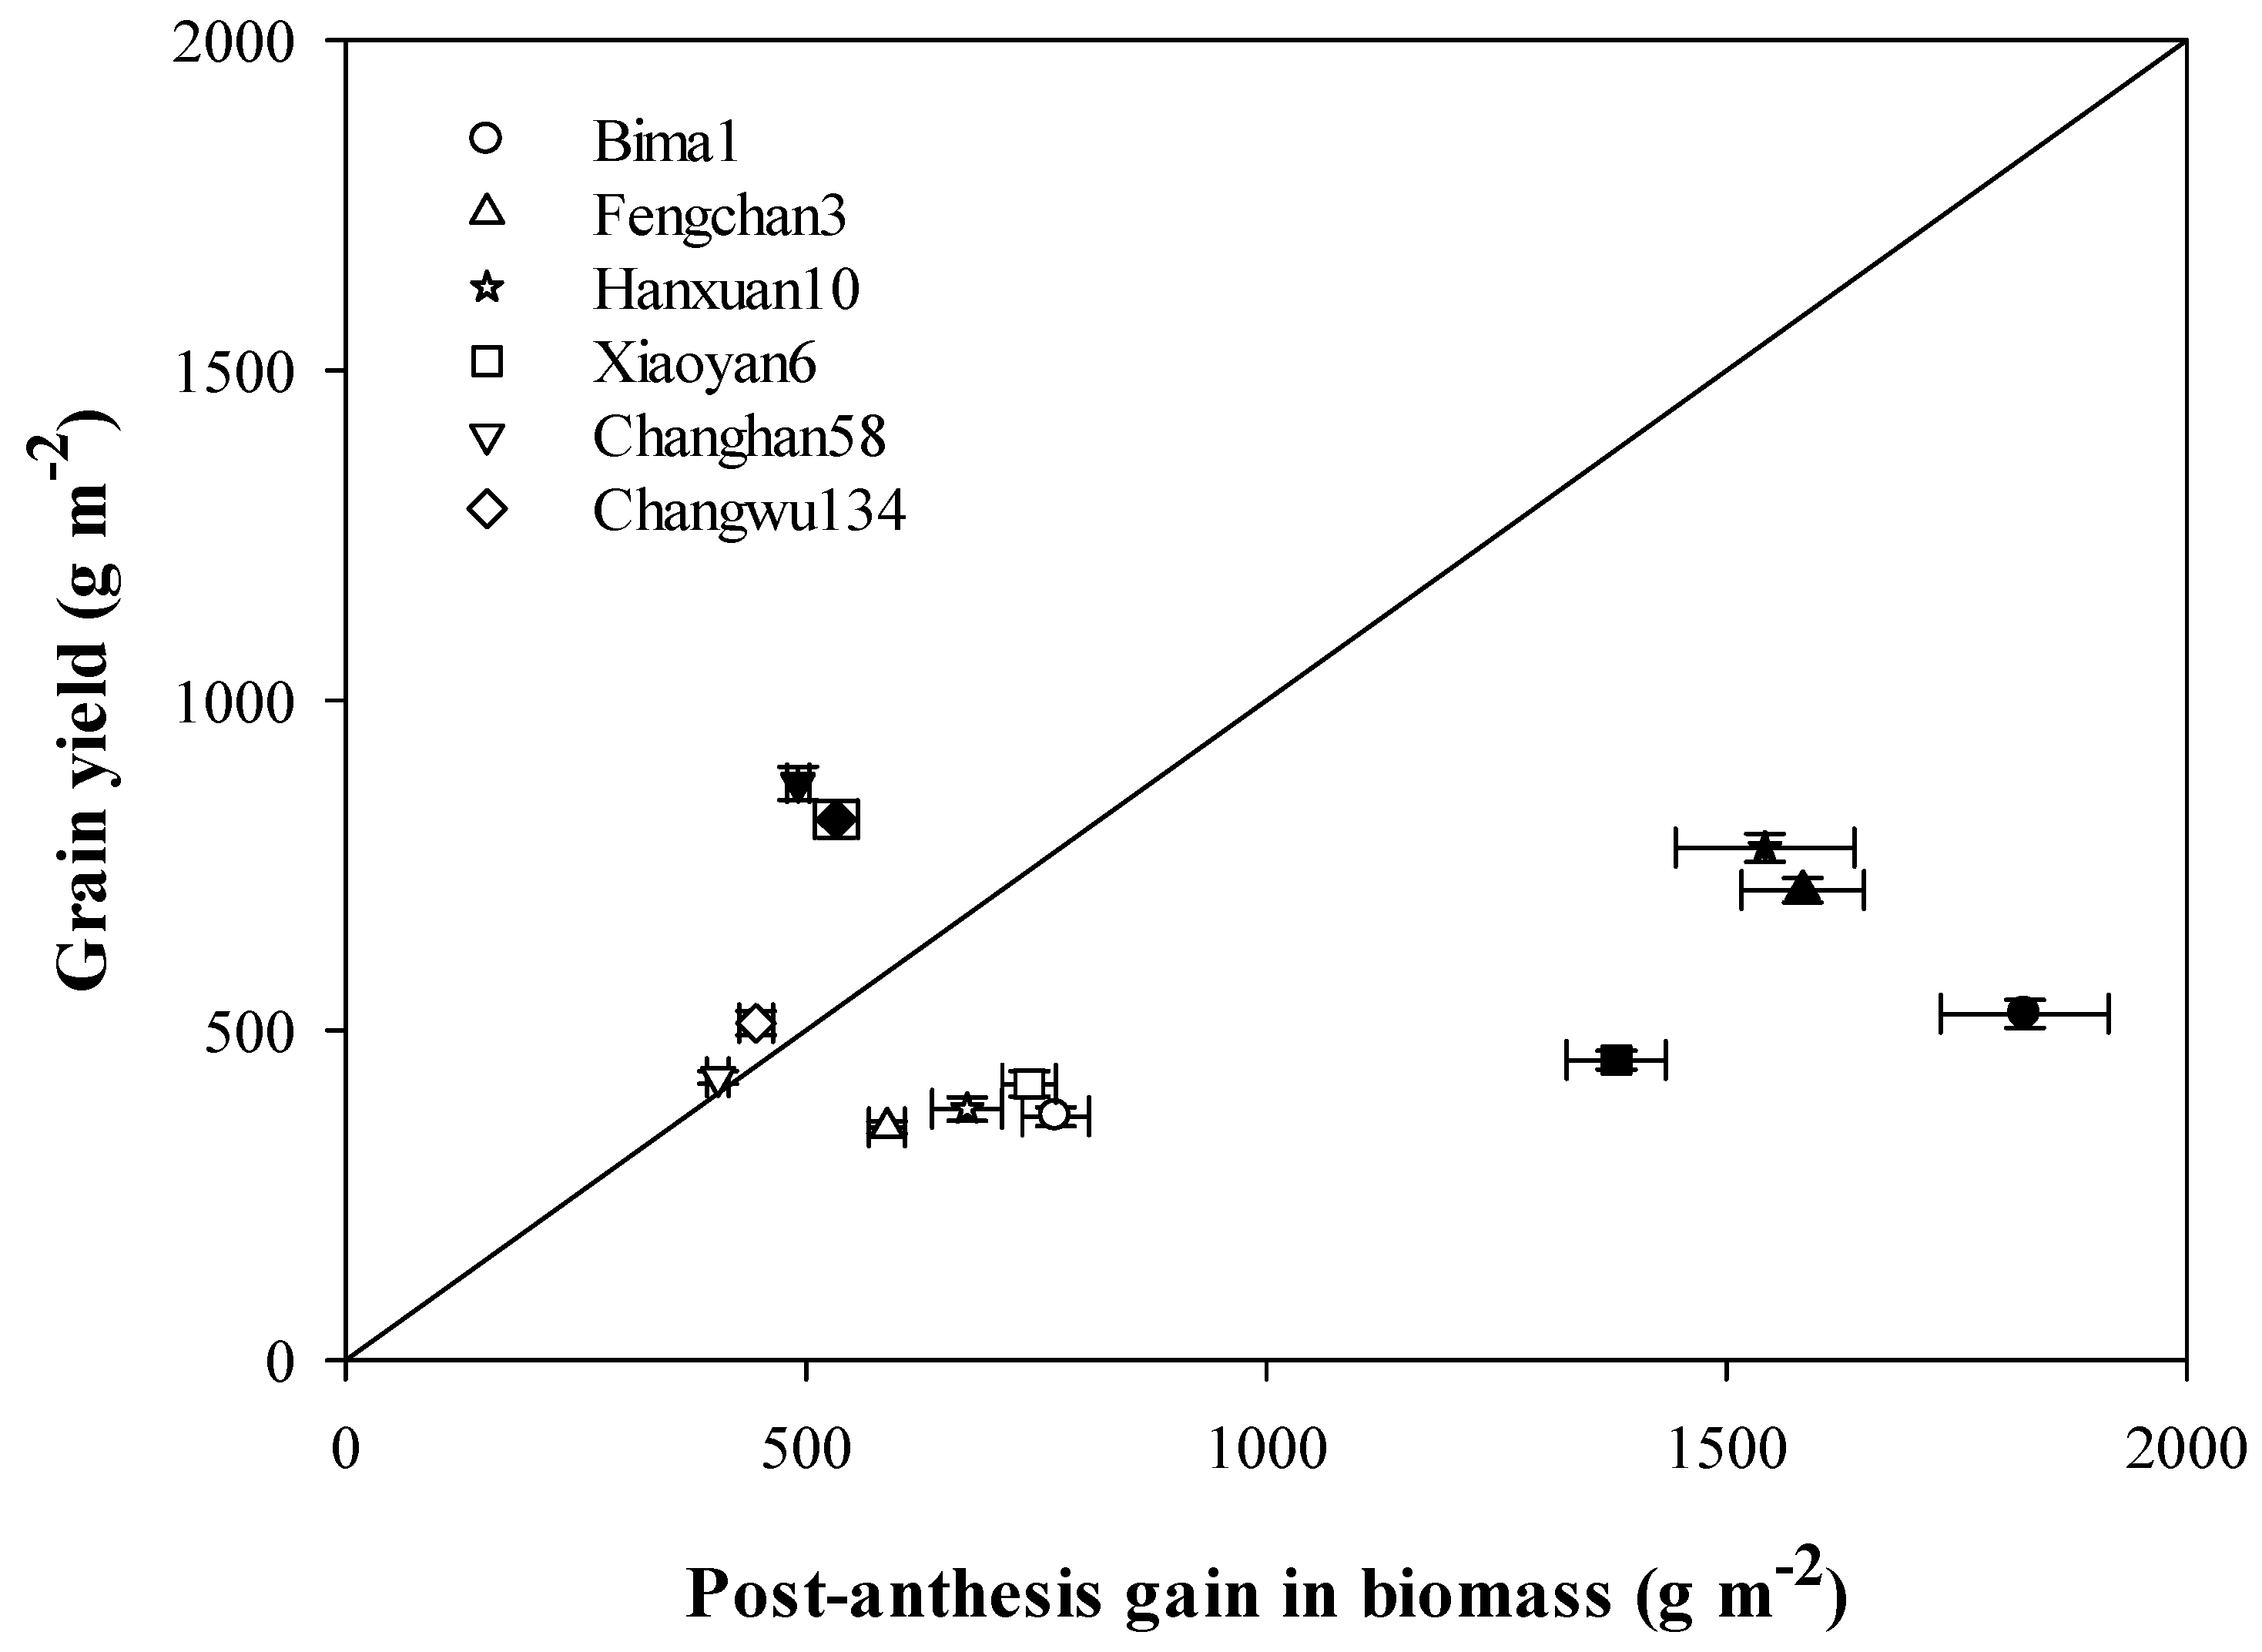
3.4. Grain Yield, Aboveground Biomass and Harvest Index

On average, the modern varieties had more yield than the older ones in the two cropping seasons. Grain yield in 2011–2012 increased linearly with the year of release, but 2012–2013, it did not follow a trend with the year of release (Figure 3). Across the varieties, the average GY of 6935 kg ha−1 in 2011–2012 was 70% higher than in 2012–2013. The GY of Changhan58 (8742 kg ha−1), released in 2004, was the highest while GY of Hanxuan10 (4546 kg ha−1), released in the 1970s was the lowest in 2011–2012 season. The GY of Changwu134 (5108 kg ha−1) was the highest in the 2012–2013 season while the grain yield of Fengchan3 (3525 kg ha−1) was the lowest in GY. Although GY showed no trend with the year of release in 2012–2013, grain yield increased from 3694 kg ha−1 for Bima1 released in 1942 to 4288 kg ha−1 for Changhan58 released in 2004.
Similarity with the effect of different cropping season on GY, the interaction rainfall x average temperature in each season x the winter wheat variety was associated with the variability in the AGBM (Figure 4), which was no more marked than the variability in the grain yield. There was a trend of linear increase in AGBM with the year of release in 2011–2012, at a rate of 73.9 kg year−1. The average AGBM in 2012–2013 of 7831 kg ha−1 was 50% of the AGBM in 2011–2012. There was a different AGBM response across varieties; Bima1 accumulated the lowest AGBM in 2011–2012, but in 2012–2013 it was Hanxuan10 that accumulated the lowest AGBM.
Harvest index (HI) showed a linear increasing trend with the year of release in both cropping seasons (Figure 5). In the 2011–2012 cropping season, the HI increased at a rate of 0.20% year−1 while in 2012–2013, the rate was 0.27% year−1. In 2011–2012, the variety Changhan58 had the highest HI, while Bima1 had the smallest one, in the 2012–2103 cropping season, Changwu134 had the highest HI and Hanxuan10 the lowest HI.

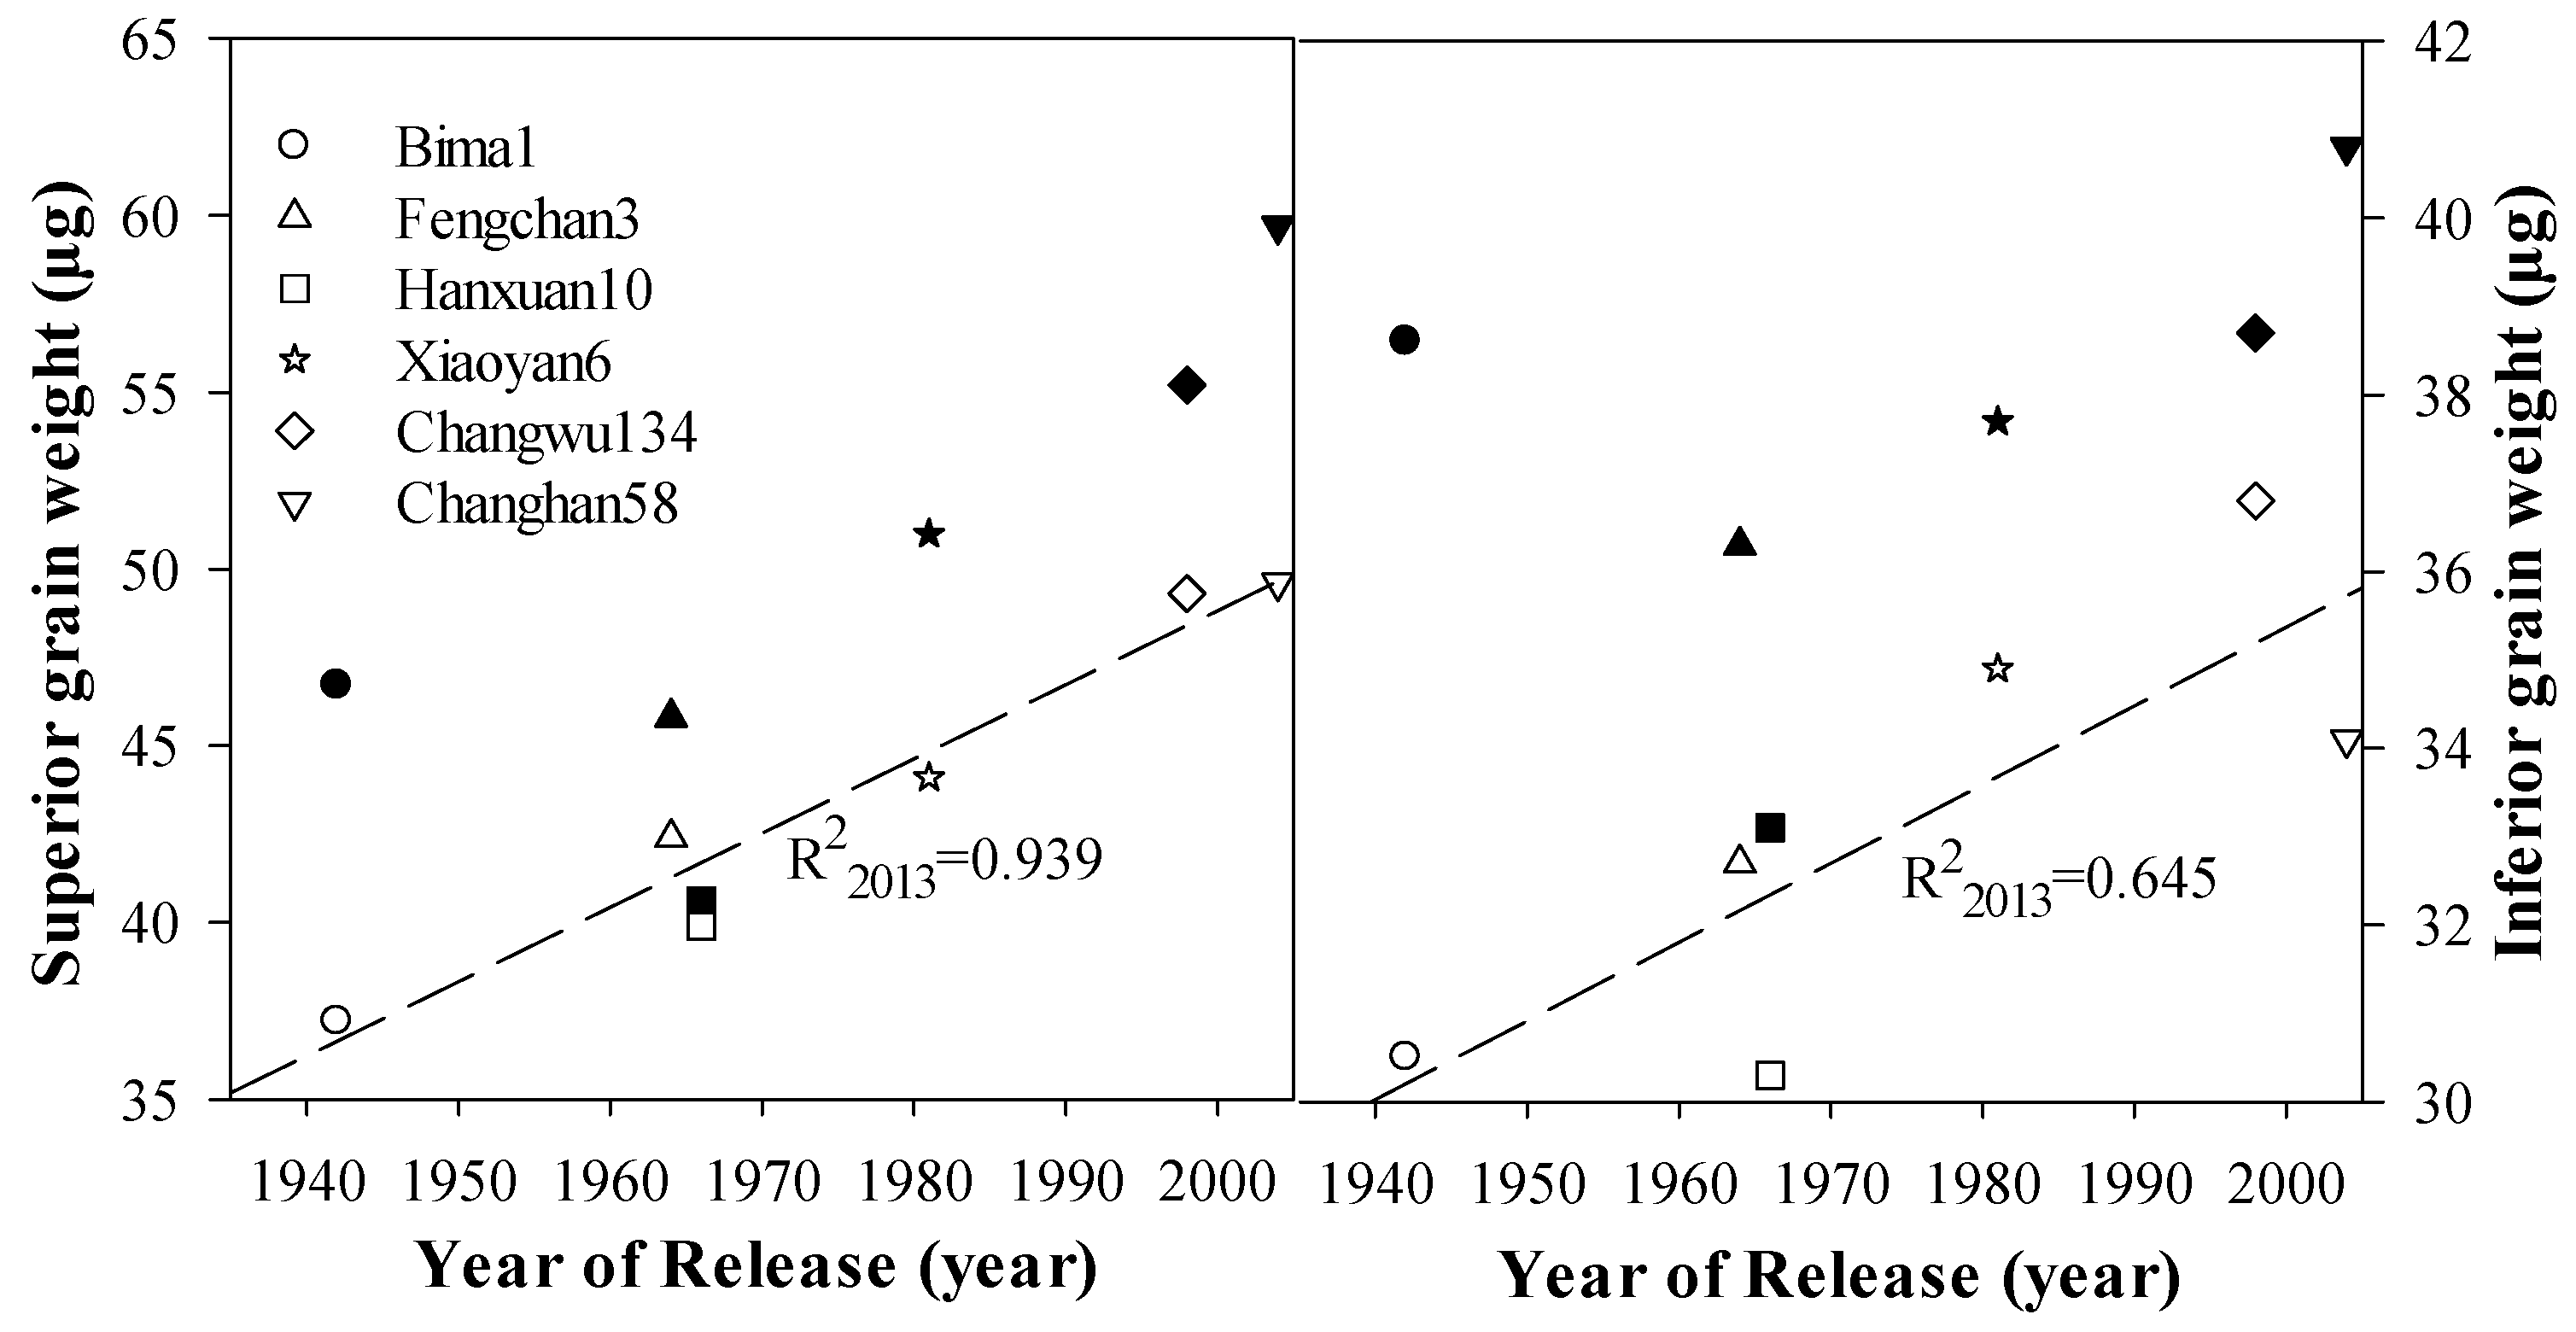
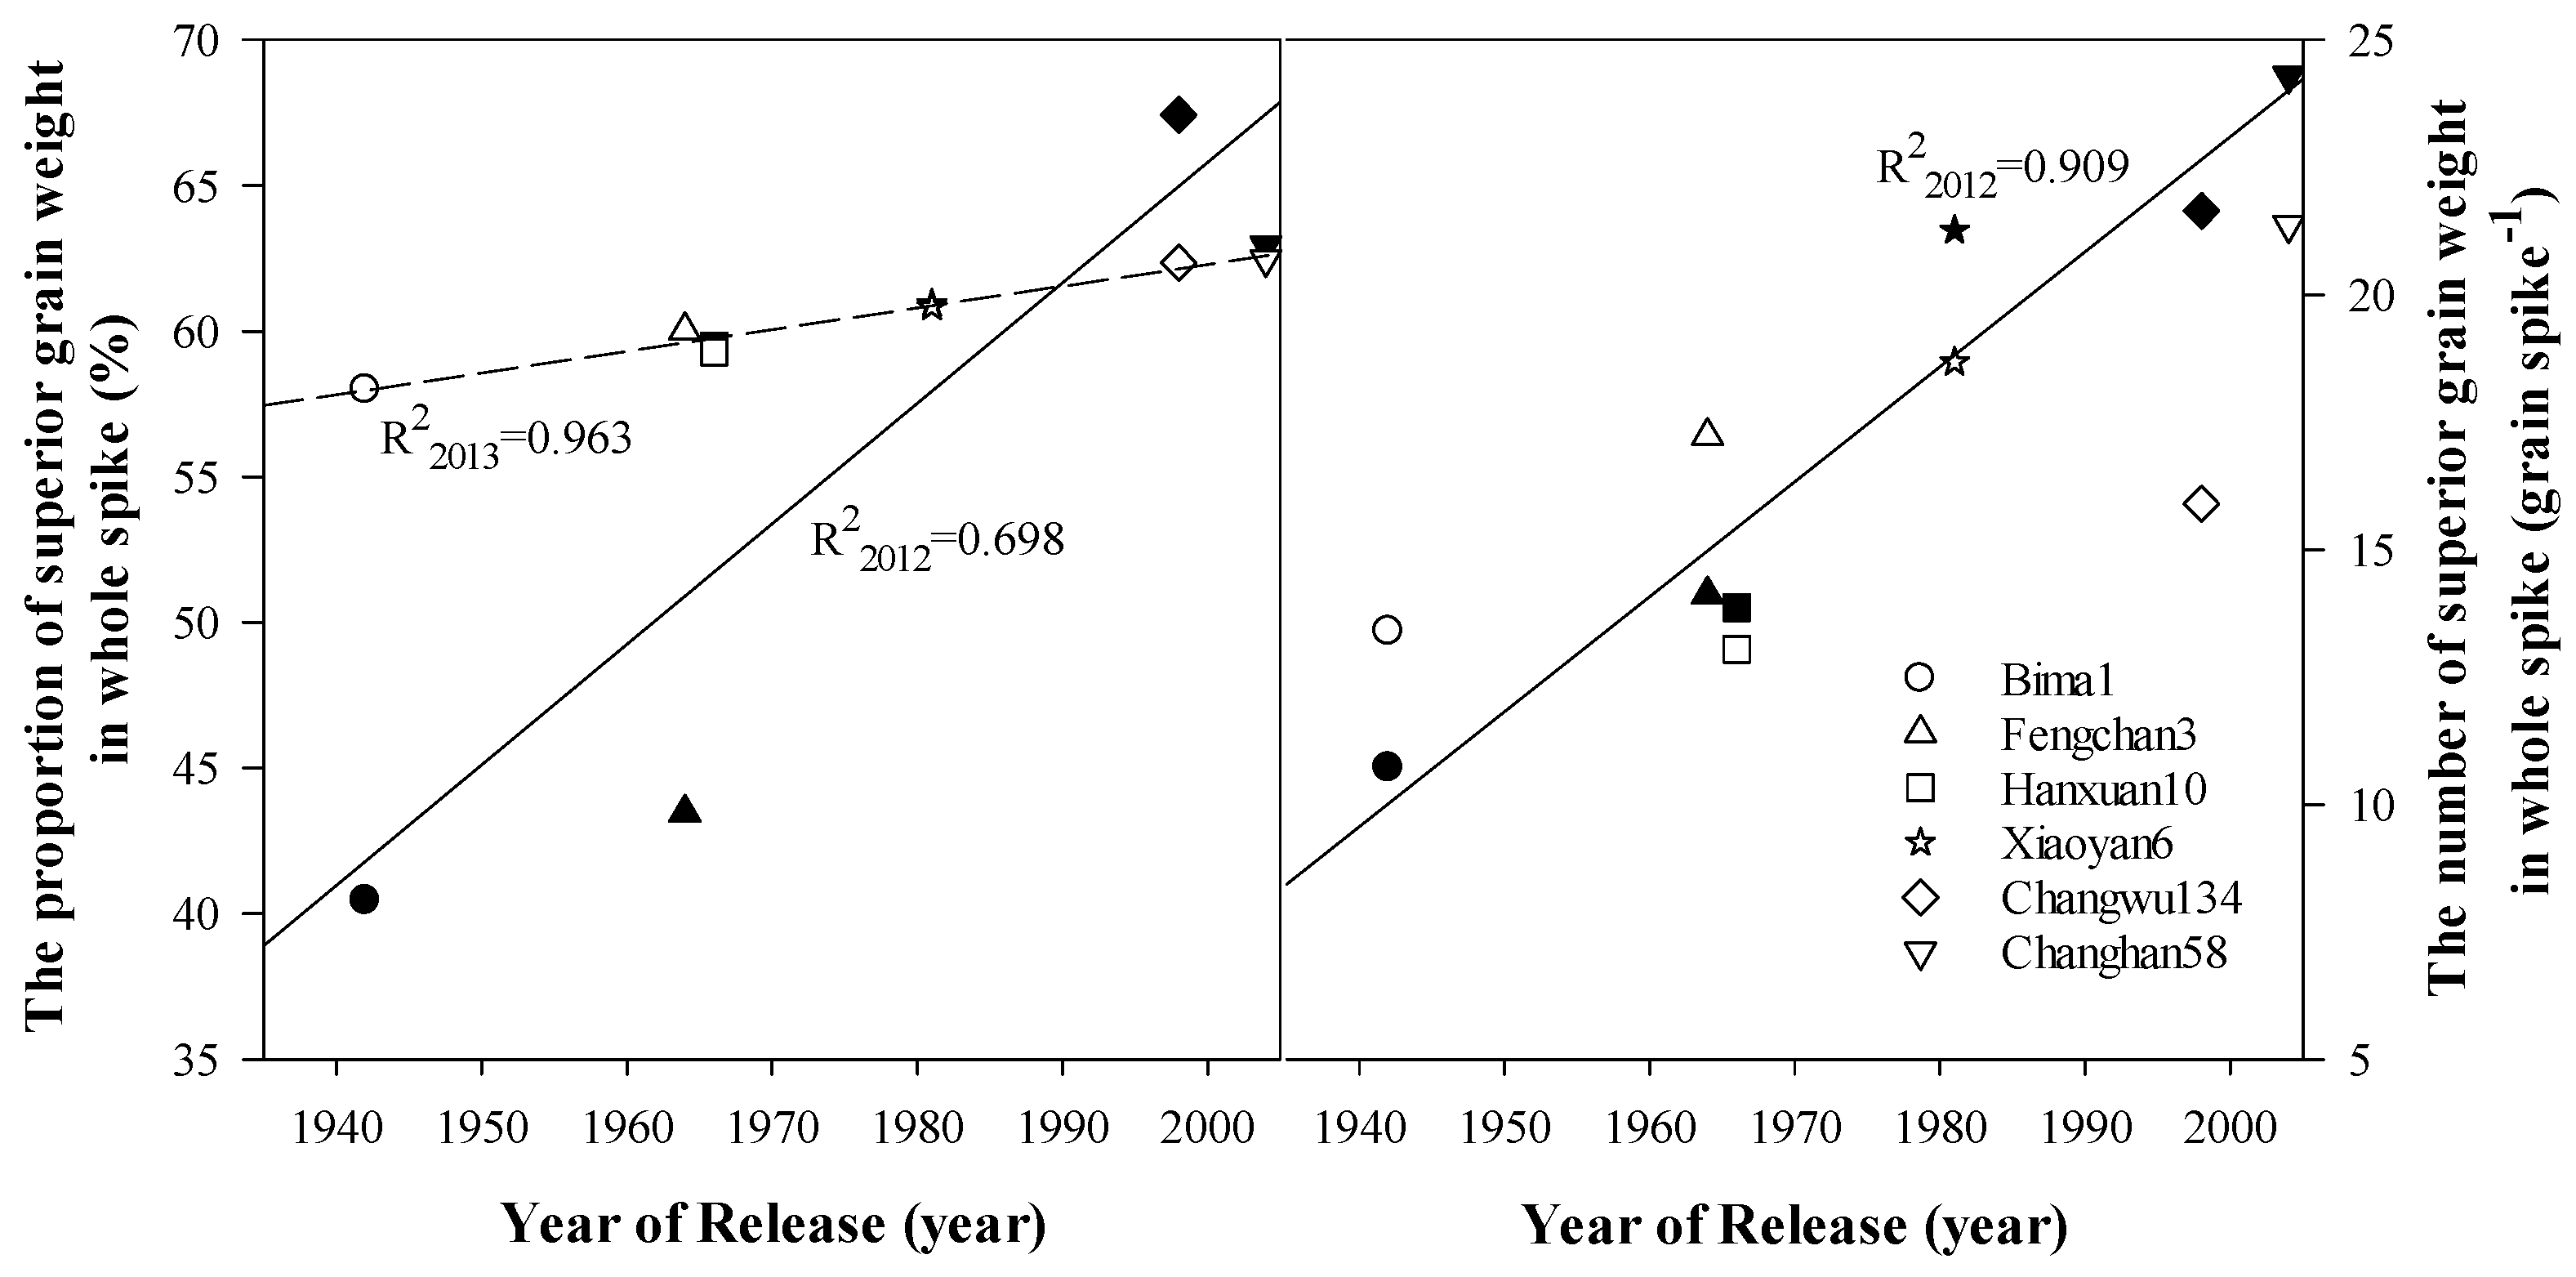
3.5. Yield Components

Average grain weight (AGW) was the only yield component that showed a linear increase with the year of release in both seasons (Table 3 and Figure 6). The relationship between GN and GNS with the year of release was not significant (Table 3), but GN and GNS tended to increase with the year of release, while SN tended to decrease. In the 2011–2012 cropping season, the variety Fengchan3 had the highest GN, while Bima1 had the smallest one, while, in 2012–2013, Changhan58 had the highest GN, followed by Fengchan3, but Bima1 had the smallest one, indicating that there were differences among the winter wheat varieties in the GN response to the different weather conditions. GNS was higher in the 2011–2012 cropping season than in the 2012–2013 and the variety Changhan58 released in 2004 had the highest GNS in each cropping season while Hanxuan10, released in 1966 had the smallest one. There were differences in SN between the two seasons with 729 spikes m−2 in 2011–2012 cropping season, which was more than 50% in 2012–2013. In 2011–2012 cropping season, the AGW fluctuated 39.8 mg for Hanxuan10 released in 1966 to 56.7 mg for Changhan58 released in 2004 with an annual increase rate at 0.281 mg, which was bigger than that of in the 2012–2013 cropping season (Figure 6).
The variety Hanxuan10, released in 1966, had a high frequency of low grain weight in the rank 0.02–0.03 g grain−1, but did not have the frequency for grain weight in the high grain weight in the range 0.06–0.07 g grain−1, resulting in the smallest AWG (Figure 7). In contrast, Changhan58, released in 2004 had a high frequency of high grain weigh in the rank 0.06–0.07 g grain−1 and a low frequency of low grain weight in the rank 0.02–0.03 g grain−1, resulting in high average grain weight. The modern wheat varieties Changwu134 (released in 1998) and Changhan58 (released in 2004) had a similar grain weight distribution pattern; more grains were within the high weight range (0.06–0.07 g grain−1) in both seasons. The increased in AGW mainly resulted from more grains within the high individual grain weight range.
The traits of superior and inferior grains changed with the release of wheat varieties (Figure 8, Figure 9 and Figure 10). The weight of superior grains ranged from 40.6 μg in the Hanxuan10 release in 1966 to 59.7 μg in the Changhan58 release in 2004, with a mean of 49.8 μg grain−1 in 2011–2012 (Figure 8). A linear increase in superior and inferior grain weight with the year of release was observed in 2012–2013 only, and the rate of increasing superior grain was 0.2 μg year−1, while in the inferior grain was 0.089 μg year−1 (Figure 8).
Both the proportion and number of different grain types changed with the year of release, the proportion, and number of different grain types contributed to the increase in AGW in the modern varieties. The proportion of superior grains in the whole spike increased linearly with the year of release in both seasons (Figure 9). There was a linear increase in the number of superior grains with the year of release in 2011–2012 only, at a rate of 0.226 grain−1 spike−1 year−1 (Figure 9). In contrast, the proportion of inferior grains to the total grain declined linearly with the year of release in both cropping seasons (Figure 10).

3.6. Remobilized Dry Matter

There were differences in the remobilization of pre-anthesis stored dry matter to the grain as the year of release progressed from 1942 to 2004 in the Loess Plateau of China (Figure 11). The two modern varieties Changwu134 and Changhan58 were able to use some pre-anthesis stored dry matter for grain filling in both seasons. In 2011–2012, the wetter cropping season, the contribution of pre-anthesis stored dry matter for grain filling was 374 (g m−2) in Changhan58 and 319 (g m−2) in Changwu134 (Figure 11). In 2012–2013, the dry season, the two modern varieties used less pre-anthesis stored dry matter to fill the grain than in 2011–2012 and most of the contribution to grain yield was from post-anthesis assimilates. There was no contribution of pre-anthesis stored assimilates to the grain yield of the other four old varieties in both seasons (Figure 11). The yield of these four varieties was reliant on post-anthesis assimilates and the contribution of post-anthesis assimilates to the grain yield of the oldest variety Bima1 was the lowest one in both seasons.

4. Discussion

The differences in GY and yield components of the varieties were affected by the large differences in the precipitation and temperature in the two successive growing seasons. Precipitation during the first season was more than 50% during the second one, and most of it fell during the vegetative growth explaining the difference in AGBM between the two growing seasons. The 15.6 mm of rainfall that fell around anthesis in the first season was higher than the 4.2 mm that fell around anthesis in the second season, triggering a delay to anthesis in the first season. The precipitation during post-anthesis in the first season, which was twice that in the second season, delayed time to maturity. The average monthly temperature during the first season, which was slightly higher than in the second season also contributed to the differences in time to anthesis and maturity between the two seasons. The higher GY and AGBM in 2011–2012 than in 2012–2013 was also likely associated to the differences in the total and seasonal distribution of rainfall. The differences in precipitation, particularly during the vegetative growth, between the two cropping seasons, contributed to the difference in AGBM between the two cropping seasons. Across all varieties, the AGBM in 2011–2012 was 52% higher than in 2012–2013, reflecting the differences in rainfall and temperature between the two seasons. In the wet cropping season (2011–2012), more AGBM was accumulated, but in the dry season (2012–2013), less AGBM was accumulated, indicating that more precipitation contributed to more AGBM accumulation.
Aboveground biomass is one of the factors influence GY, but there are other factors also involved in the generation of grain yield. Harvest index in 2011–2012 was 13% higher than in 2012–2013, compared with the influence of different seasons (different precipitation and average temperature), the influence of different precipitation and the average temperature was smaller than that in AGBM. Grain yield in 2011–2012 was 38% higher than in 2012–2013, mainly because the difference in climate conditions, which influenced, firstly the accumulation of AGBM, but then some varieties under different climatic conditions were able to shift the dry matter remobilization to the grain, influencing grain yield.
Although increases in GY with the year of release has also been shown in other studies [4,5,12,27,32], we found a linear increase in GY over the period between 1942 and 2004 in the 2011–2012 in this study. The differences in rainfall and temperature between the two seasons induced differences in the traits that generate GY. More precipitation often enhances GY in most seasons, but in the drier season of this study, the modern wheat varieties yielded more than the old ones, indicating that modern wheat varieties were better adapted the drier seasons. This is likely that different grain yield traits have different ability to adapt to different climate conditions. In the wet cropping season of 2011–2012, the precipitation enhanced ABGM accumulation in all varieties, but in the dry season, the modern varieties used less water during vegetative growth and more water after anthesis, increasing grain weight [49].
In the wetter season of 2011–2012, the increase in GY was parallel to the increase in AGBM accumulation, HI, AGW, and the decrease in plant height. In the drier season of 2012–2013, the increase in GY was parallel to the increase in HI and AGW. During the last few decades, the annual precipitation in the Loess Plateau has decreased at a rate of 3 mm decade−1 as a consequence of climate change [14,50]. Since the HI and AGW made a great contribution to the increase in grain yield in both seasons, a further increase in HI and AGW could be considered as potential traits for breeding under climate change.
Despite this enormous amount of biomass accumulated by older cultivars, the yield of modern winter wheat varieties was higher than in the older ones. Since climatic variability interacts with the process of cultivar selection, climate resilience of wheat must be better understood [51]. The winter wheat varieties released in the Loess Plateau of China from 1942 and 2004 had a progressive decrease in plant height and an increase in HI, which is consistent with the view that the efficiency of dry matter mobilization to the grain is higher in short than in tall plants [52]. The HI ceiling in wheat can be 60% [53] and the improved HI in varieties released for the Loess Plateau from 1942 and 2004, which maximum was 50% in Changwu134 in 2011–2012, indicates that there is still potential for further improvement in HI. Further reductions in plant height and improvements in the ability to use ABGM for grain yield are two potential opportunities to increase HI. However, the height of the modern high yielding varieties Changwu134 and Changhan58 (75 cm), is considered the optimum plant height [54]. So, little yield improvement may be expected from further reductions in plant height. Improving the ability to use ABGM for grain yield seems to be the achievable option to improve HI.
High photosynthesis efficiency is critical in improving grain yield in wheat [55], particularly in the Loess Plateau, where water is limited. Increases in grain yield in the Henan and Yangtze River Basin Province of China, have been are associated to improvements in both the rates of net photosynthesis and remobilization of pre-anthesis stored assimilates to the grain [9,27,28], but the contribution of photosynthesis to grain yield was low in varieties released from 1937 to 2004 in the Loess Plateau [56]. So the increase in grain yield, mainly comes from the capacity of using pre-anthesis stored assimilates or the ability to accumulate more current photoassimilates into the grain. Certainly, the modern wheat varieties had a high ability to use pre-anthesis stored assimilates.
Among the yield components, AGW was largely associated to the improvement in GY in the varieties released for the Loess Plateau from 1942 and 2004. This finding and the parallel decrease in SN is consistent with findings from previous studies [28,56]. The introduction of dwarfing genes was associated with high GNS [57], and three varieties with dwarfing genes had higher GNS in the 2011–2012 season and also higher AGW than varieties without dwarfing genes, which is in agreement agrees with a previous study [35]. Winter wheat cropping in the Loess Plateau of China, is characterized by the lack of irrigation, so crops grown under rainfed conditions [58]. Under these conditions, varieties decreased SN to regulate the GN and maintain a balance between GN and AGW. Since the competition between individual spikes for resources becomes strong as SN increase, particularly when the soil water availability is limited [59], the decrease in SN with the year of release of the winter wheat varieties indicates that the individual competition between spikes was less.
The harvest index was enhanced by increasing the mobilization of photosynthates from source organs to sink organs, but the photostnthates in sink organs also could be enhanced by increasing the proportion of superior to inferior grains in the spike. The superior grains had higher activities of the source to starch enzymes, which contributed to great sink strength and resulted in higher grain weight in superior grain than in inferior grain [60]. In this study, both the weight of superior and inferior grains increased with the year of release in the winter wheat varieties released from 1942 to 2004 during the 2012–2013 season, but the annual rate of increasing grain weight in the superior grain was faster than in the inferior grain, reflecting a greater ability of the superior grains in obtaining photosynthates. The number of superior and inferior grains also influence the AGW, as the proportion of superior grain increased with the year of release, while the proportion of inferior grain decreased. An increase in AGW and GN was accompanied by a decrease in the proportion of grain with low potential grain weight and SN, which maybe belongs to the secondary spike tillers. This finding is congruent with the noncompetitive hypothesis [32] that the increase in AGW is a consequence of the decrease in secondary spike tillers and the proportion of grains of lower potential grain weight placed in a distal position within the spikelets and the spike. The low SN had consistently high water-soluble carbohydrates [61] and high water-soluble carbohydrates could provide enough carbon source for grain filling, and superior grains have high ability to convert carbohydrates to starch [62], which may explain the grain weight in modern winter cultivars.
The increase in GY in the Loess Plateau of China, from 1942 to 2004 resulted mainly from the increase in AGW, reflecting the increased in the sink strength and grain growth [63]. Grain size in the present study was associated with the pre-anthesis dry matter remobilized to the grain, which was much higher in the wet season, reflecting an improvement in the efficiency that pre-anthesis dry matter contributed to grain yield. The increase in grain size with the year of release leads to an increase in grain yield, particularly because of more superior grains. More superior grains in the two modern varieties, Changhan58 and Changwu134, reflect a better ability of these varieties of providing photosynthates and remobilize assimilates to the grain, indicating an improvement in the strength of the sink. Adequate partitioning of photosynthates among plant organs is also crucial to ensure that plants with heavier grain yield [64]. The increase in the remobilization of pre-anthesis assimilates to grain offset the low contribution of leaf photosynthesis [56] to enhance the yield in Loess Plateau with the winter wheat replacement.

5. Conclusions

The GY has been significantly increased with the release of modern winter wheat varieties for the Loess Plateau of China. The increase in GY was associated with the increase in AGW and HI, and both traits can be considered as potential traits for the future winter wheat breeding. The increase in AGW was parallel with the increase in the proportion of superior grains and the reduction in the proportion of inferior grains. The reduction in the proportion of inferior grains was accompanied by the reduction in SN and the increase in GNS. Modern varieties had more superior grains across the whole spike because both the fertility of distal and middle position of grains were improved and the use of pre-anthesis stored dry matter for grain filling increased. The increase in AGW mainly resulted from the increase in both the proportion of superior grains and sink strength, which improved grain yield. Attention should be focused on improving the capacity of the source if further yield increases are targeted for wheat growing in the Loess Plateau of China.

Author Contributions

Conceptualization, S.Z.; Data Duration, W.C. and Y.S.; Investigation, W.C. and Y.S.; Writing—original draft preparation, W.C.; Writing—review and editing, W.C. and J.A.P.; Supervision, X.D.; funding acquisition, S.Z.

Funding

This study was supported by National Basic Research Program of China (2015CB150402), National Natural Science Foundation of China (41801069, 31871555), Shaanxi Key Laboratory of Disaster Monitoring and Mechanism Modeling (18JS006), Key Research Foundation of Baoji College of Arts and Science (ZK16066).

Acknowledgments

We acknowledge the reviewers for helping with the editing of the English.

Conflicts of Interest

The authors declare no conflict of interest.

Abbreviations

ABDM: aboveground dry matter; AGW: average grain weight; C: carbon; DI: drought index; GN: grain number per square meter; GNS: grain number per square meter; GY: grain yield; HI: harvest index; IG: inferior grain; LSD: least significant difference; N: nitrogrn; SG: superior grain; SN: spike number per square meter.

References

  1. Shearman, V.J.; Sylvesterbradley, R.; Scott, R.K.; Foulkes, M.J. Physiological processes associated with wheat yield progress in the UK. Crop Sci. 2005, 45, 175–185. [Google Scholar] [CrossRef]
  2. Brancourt-Hulmel, M.; Doussinault, G.; Lecomte, C.; Bérard, P.; Buanec, B.L.; Trottet, M. Genetic improvement of agronomic traits of winter wheat cultivars released in France from 1946 to 1992. Crop Sci. 2003, 43, 37–45. [Google Scholar] [CrossRef]
  3. Graybosch, R.A.; Peterson, C.J. Genetic improvement in winter wheat yields in the Great Plains of North America, 1959–2008. Crop Sci. 2010, 50, 1882–1890. [Google Scholar] [CrossRef]
  4. Keser, M.; Gummadov, N.; Akin, B.; Belen, S.; Mert, Z.; Taner, S.; Topal, A.; Yazar, S.; Morgounov, A.; Sharma, R.C.; et al. Genetic gains in wheat in Turkey: Winter wheat for dryland conditions. Crop J. 2017, 5, 533–540. [Google Scholar] [CrossRef]
  5. Sadras, V.O.; Lawson, C. Genetic gain in yield and associated changes in phenotype, trait plasticity and competitive ability of South Australian wheat varieties released between 1958 and 2007. Crop Pasture Sci. 2011, 62, 533–549. [Google Scholar] [CrossRef]
  6. Lo Valvo, P.J.; Miralles, D.J.; Serrago, R.A. Genetic progress in Argentine bread wheat varieties released between 1918 and 2011: Changes in physiological and numerical yield components. Field Crop. Res. 2017, 221, 314–321. [Google Scholar] [CrossRef]
  7. Laidig, F.; Piepho, H.P.; Drobek, T.; Meyer, U. Genetic and non-genetic long-term trends of 12 different crops in German official variety performance trials and on-farm yield trends. Theor. Appl. Genet. 2014, 127, 2599–2617. [Google Scholar] [CrossRef] [Green Version]
  8. Qin, X.L.; Zhang, F.X.; Liu, C.; Yu, H.; Cao, B.G.; Tian, S.Q.; Liao, Y.C.; Siddique, K.H.M. Wheat yield improvements in China: Past trends and future directions. Field Crop. Res. 2015, 177, 117–124. [Google Scholar] [CrossRef]
  9. Tian, Z.W.; Qi, J.; Dai, T.B.; Dong, J.; Cao, W.X. Effects of genetic improvements on grain yield and agronomic traits of winter wheat in the Yangtze River Basin of China. Field Crop. Res. 2011, 124, 417–425. [Google Scholar] [CrossRef]
  10. Xiao, Y.G.; Qian, Z.G.; Wu, K.; Liu, J.J.; Xia, X.C.; Ji, W.Q.; He, Z.H. Genetic gains in grain yield and physiological traits of winter wheat in Shandong Province, China, from 1969 to 2006. Crop Sci. 2012, 52, 44–56. [Google Scholar] [CrossRef]
  11. Sun, Y.Y.; Wang, X.L.; Wang, N.; Chen, Y.L.; Zhang, S.Q. Changes in the yield and associated photosynthetic traits of dry-land winter wheat (Triticum aestivum L.) from the 1940s to the 2010s in Shaanxi Province of China. Field Crop. Res. 2014, 167, 1–10. [Google Scholar] [CrossRef]
  12. Gao, F.; Ma, D.; Yin, G.; Rasheed, A.; Dong, Y.; Xiao, Y.; Xia, X.; Wu, X.; He, Z. Genetic progress in grain yield and physiological traits in Chinese wheat cultivars of Southern Yellow and Huai valley winter wheat zone since 1950. Crop Sci. 2017, 57, 760–773. [Google Scholar] [CrossRef]
  13. Zhao, Y.; Liu, X.H.; Sun, T.D. Prediction of Chinese arable land based on SAR Model. J. Arid Land Resour. Environ. 2013, 27, 1–5, (In Chinese with English abstract). [Google Scholar]
  14. Turner, N.C.; Molyneux, N.; Yang, S.; Xiong, Y.C.; Siddique, K.H. Climate change in south-west Australia and north-west China: Challenges and opportunities for crop production. Crop Pasture Sci. 2011, 62, 445–456. [Google Scholar] [CrossRef]
  15. Wang, X.C.; Li, J. Evaluation of crop yield and soil water estimates using the EPIC model for the Loess Plateau of China. Math. Comput. Modell. 2010, 51, 1390–1397. [Google Scholar] [CrossRef]
  16. Ding, D.Y.; Feng, H.; Zhao, Y.; He, J.Q.; Zou, Y.F.; Jin, J.M. Modifying winter wheat sowing date as an adaptation to climate change on the Loess Plateau. Agron. J. 2015, 108, 53–63. [Google Scholar] [CrossRef]
  17. Xin, Z.; Yu, X.; Li, Q.; Lu, X.X. Spatiotemporal variation in rainfall erosivity on the Chinese Loess Plateau during the period 1956–2008. Reg. Environ. Chang. 2011, 11, 149–159. [Google Scholar] [CrossRef]
  18. Jiang, D.; Cao, W.X.; Dai, T.B.; Jing, Q. Activities of key enzymes for starch synthesis in relation to growth of superior and inferior grains on winter wheat (Triticum aestivum L.) spike. Plant Growth Regul. 2003, 41, 247–257. [Google Scholar] [CrossRef]
  19. Yong, L.; Cui, Z.; Ni, Y.; Zheng, M.; Yang, D.; Min, J.; Jin, C.; Wang, Z.; Yin, Y. Plant density effect on grain number and weight of two winter wheat cultivars at different spikelet and grain positions. PLoS ONE 2016, 11, e0155351. [Google Scholar] [CrossRef]
  20. Acreche, M.M.; Slafer, G.A. Grain weight response to increases in number of grains in wheat in a Mediterranean area. Field Crop. Res. 2006, 98, 52–59. [Google Scholar] [CrossRef]
  21. Zhang, C.; Jiang, D.; Liu, F.; Cai, J.; Dai, T.; Cao, W. Starch granules size distribution in superior and inferior grains of wheat is related to enzyme activities and their gene expressions during grain filling. J. Cereal Sci. 2010, 51, 226–233. [Google Scholar] [CrossRef]
  22. Yang, J.C.; Zhang, J.H. Grain filling of cereals under soil drying. New Phytol. 2006, 169, 223–236. [Google Scholar] [CrossRef] [PubMed]
  23. Yang, J.; Zhang, J.; Liu, K.; Wang, Z.; Liu, L. Abscisic acid and ethylene interact in wheat grains in response to soil drying during grain filling. New Phytol. 2006, 171, 293–303. [Google Scholar] [CrossRef]
  24. Yang, J.; Zhang, J. Grain-filling problem in ‘super’ rice. J. Exp. Bot. 2010, 61, 1–5. [Google Scholar] [CrossRef] [PubMed]
  25. Yu, A.; Li, Y.; Ni, Y.; Yang, W.; Yang, D.; Cui, Z.; Wang, Z.; Yin, Y. Differences of starch granule distribution in grains from different spikelet positions in winter wheat. PLoS ONE 2014, 9, e114342. [Google Scholar] [CrossRef] [PubMed]
  26. Yang, J.C.; Zhang, J.H.; Wang, Z.Q.; Liu, K.; Wang, P. Post-anthesis development of inferior and superior spikelets in rice in relation to abscisic acid and ethylene. J. Exp. Bot. 2006, 57, 149–160. [Google Scholar] [CrossRef]
  27. Zhang, Y.; Xu, W.G.; Wang, H.W.; Dong, H.B.; Qi, X.L.; Zhao, M.Z.; Fang, Y.H.; Gao, C.; Hu, L. Progress in genetic improvement of grain yield and related physiological traits of Chinese wheat in Henan Province. Field Crop. Res. 2016, 199, 117–128. [Google Scholar] [CrossRef]
  28. Zheng, T.C.; Zhang, X.K.; Yin, G.H.; Wang, L.N.; Han, Y.L.; Chen, L.; Huang, F.; Tang, J.W.; Xia, X.C.; He, Z.H. Genetic gains in grain yield, net photosynthesis and stomatal conductance achieved in Henan Province of China between 1981 and 2008. Field Crop. Res. 2011, 122, 225–233. [Google Scholar] [CrossRef]
  29. Sanchez-Garcia, M.; Royo, C.; Aparicio, N.; Martín-Sánchez, J.A.; Alvaro, F. Genetic improvement of bread wheat yield and associated traits in Spain during the 20th century. J. Agric. Sci. 2013, 151, 105–118. [Google Scholar] [CrossRef]
  30. Blum, A.; Mayer, J.; Golan, G. The effect of grain number per ear (sink size) on source activity and its water-relations in wheat. J. Exp. Bot. 1988, 39, 106–114. [Google Scholar] [CrossRef]
  31. Cartelle, J.; Pedro, A.; Savin, R.; Slafer, G.A. Grain weight responses to post-anthesis spikelet-trimming in an old and a modern wheat under Mediterranean conditions. Eur. J. Agron. 2006, 25, 365–371. [Google Scholar] [CrossRef]
  32. González, F.G.; Aldabe, M.L.; Terrile, I.I.; Rondanini, D.P. Grain weight response to different postflowering source: Sink ratios in modern high-yielding Argentinean wheats differing in spike fruiting efficiency. Crop Sci. 2014, 54, 297–309. [Google Scholar] [CrossRef]
  33. Slafer, G.A.; Miralles, D.J. Fruiting efficiency in three bread wheat (Triticum aestivum) cultivars released at different eras. Number of grains per spike and grain weight. J. Agron. Crop Sci. 1993, 170, 251–260. [Google Scholar] [CrossRef]
  34. Miralles, D.J.; Slafer, G.A. Individual grain weight responses to genetic reduction in culm length in wheat as affected by source-sink manipulations. Field Crop. Res. 1995, 43, 55–66. [Google Scholar] [CrossRef]
  35. Feng, F.; Han, Y.; Wang, S.; Yin, S.; Peng, Z.; Zhou, M.; Gao, W.; Wen, X.; Qin, X.; Siddique, K.H.M. The effect of grain position on genetic improvement of grain number and thousand grain weight in winter wheat in North China. Front. Plant Sci. 2018, 9, 129. [Google Scholar] [CrossRef] [PubMed]
  36. Zhang, H.P.; Turner, N.C.; Poole, M.L. Source–sink balance and manipulating sink–source relations of wheat indicate that the yield potential of wheat is sink-limited in high-rainfall zones. Crop Pasture Sci. 2010, 61, 852–861. [Google Scholar] [CrossRef]
  37. Borras, L.; Slafer, G.A.; Otegui, M.E. Seed dry weight response to source-sink manipulations in wheat, maize and soybean: A quantitative reappraisal. Field Crop. Res. 2004, 86, 131–146. [Google Scholar] [CrossRef]
  38. Asseng, S.; Kassie, B.T.; Labra, M.H.; Amador, C.; Calderini, D.F. Simulating the impact of source-sink manipulations in wheat. Field Crop. Res. 2016, 202, 47–56. [Google Scholar] [CrossRef]
  39. Lawlor, D.W.; Paul, M.J. Source/sink interactions underpin crop yield: The case for trehalose 6-phosphate/SnRK1 in improvement of wheat. Front. Plant Sci. 2014, 5, 418. [Google Scholar] [CrossRef]
  40. Reynolds, M.; Foulkes, J.; Furbank, R.T.; Griffiths, S.; King, J.; Murchie, E.; Parry, M.A.; Slafer, G.A. Achieving yield gains in wheat. Plant Cell Environ. 2012, 35, 1799–1823. [Google Scholar] [CrossRef]
  41. Gong, Z.; Zhang, G.; Chen, Z. Pedogenesis and Soil Taxonomy; Beijing Science Press Publishing: Beijing, China, 2007. (In Chinese) [Google Scholar]
  42. Hanft, J.M.; Wych, R.D. Visual indicators of physiological maturity of hard red spring wheat. Crop Sci. 1982, 22, 584–588. [Google Scholar] [CrossRef]
  43. Zadoks, J.C.; Chang, T.T.; Konzak, C.F. A decimal code for the growth stages of cereals. Weed Res. 1974, 14, 415–421. [Google Scholar] [CrossRef]
  44. Kobata, T.; Palta, J.A.; Turner, N.C. Rate of development of postanthesis water deficits and grain filling of spring wheat. Crop Sci. 1992, 32, 1238–1242. [Google Scholar] [CrossRef]
  45. Palta, J.A.; Fillery, I. N application increases pre-anthesis contribution of dry matter to grain yield in wheat grown on a duplex soil. Aust. J Agr. Res. 1995, 46, 507–518. [Google Scholar] [CrossRef]
  46. Takami, S.; Kobata, T.; Bavel, C.H.M.V. Quantitative method for analysis of grain yield in rice. Agron. J. 1990, 82, 1149–1153. [Google Scholar] [CrossRef]
  47. Guo, S.; Zhu, H.; Dang, T.; Wu, J.; Liu, W.; Hao, M.; Li, Y.; Syers, J.K. Winter wheat grain yield associated with precipitation distribution under long-term nitrogen fertilization in the semiarid Loess Plateau in China. Geoderma 2012, 189–190, 442–450. [Google Scholar] [CrossRef]
  48. Xing, N.Q.; Zhang, Y.Q.; Wang, L.X. The Study on Dryland Agriculture in North China; Chinese Agriculture Press: Beijing, China, 2002. [Google Scholar]
  49. Fang, Y.; Du, Y.; Wang, J.; Wu, A.; Qiao, S.; Xu, B.; Zhang, S.; Siddique, K.H.M.; Chen, Y. Moderate drought stress affected root growth and grain yield in old, modern and newly released cultivars of winter wheat. Front. Plant Sci. 2017, 8, 672. [Google Scholar] [CrossRef]
  50. Wang, Q.X.; Wang, M.B.; Fan, X.H.; Feng, Z.; Zhu, S.Z.; Zhao, T.L. Trends of temperature and precipitation extremes in the Loess Plateau Region of China, 1961–2010. Theor. Appl. Climatol. 2016, 92–93, 949–963. [Google Scholar] [CrossRef]
  51. Kahiluoto, H.; Kaseva, J.; Balek, J.; Olesen, J.E.; Ruiz-Ramos, M.; Gobin, A.; Kersebaum, K.C.; Takáč, J.; Ruget, F.; Ferrise, R.; et al. Decline in climate resilience of European wheat. Proc. Natl. Acad. Sci. USA 2019, 116, 123–128. [Google Scholar] [CrossRef]
  52. Ehdaie, B.; Alloush, G.A.; Madore, M.A.; Waines, J.G. Genotypic variation for stem reserves and mobilization in wheat: I. Postanthesis changes in internode dry matter. Crop Sci. 2006, 46, 735–746. [Google Scholar] [CrossRef]
  53. Austin, R.B.; Bingham, J.; Blackwell, R.D.; Evans, L.T.; Ford, M.A.; Morgan, C.L.; Taylor, M. Genetic improvements in winter wheat yields since 1900 and associated physiological changes. J. Agric. Sci. 1980, 94, 675–689. [Google Scholar] [CrossRef]
  54. Flintham, J.E.; Börner, A.; Worland, A.J.; Gale, M.D. Optimizing wheat grain yield: Effects of Rht (gibberellin-insensitive) dwarfing genes. J. Agric. Sci. 1997, 128, 11–25. [Google Scholar] [CrossRef]
  55. Parry, M.; Reynolds, M.; Salvucci, M.; Raines, C.; Andralojc, P.; Zhu, X.; Price, G.; Condon, A.; Furbank, R. Raising yield potential of wheat. II. Increasing photosynthetic capacity and efficiency. J. Exp. Bot. 2011, 62, 453–467. [Google Scholar] [CrossRef] [PubMed]
  56. Chen, X.; Hao, M.D. Low contribution of photosynthesis and water-use efficiency to improvement of grain yield in Chinese wheat. Photosynthetica 2015, 53, 519–526. [Google Scholar] [CrossRef]
  57. Youssefian, S.; Kirby, E.J.M.; Gale, M.D. Pleiotropic effects of the GA-insensitive Rht dwarfing genes in wheat. 2. Effects on leaf, stem, ear and floret growth. Field Crop. Res. 1992, 28, 191–210. [Google Scholar] [CrossRef]
  58. Deng, X.P.; Shan, L.; Zhang, H.P.; Turner, N.C. Improving agricultural water use efficiency in arid and semiarid areas of China. Agr. Water Manag. 2006, 80, 23–40. [Google Scholar] [CrossRef]
  59. Evans, L.T. Crop Evolution, Adaptation and Yield; Cambridge University Press: Cambridge, UK, 1993; pp. 133–142. [Google Scholar]
  60. Liang, W.; Zhang, Z.; Wen, X.; Liao, Y.; Yang, L. Effect of non-structural carbohydrate accumulation in the stem pre-anthesis on grain filling of wheat inferior grain. Field Crop. Res. 2017, 211, 66–76. [Google Scholar] [CrossRef]
  61. Dreccer, M.F.; Herwaarden, A.F.V.; Chapman, S.C. Grain number and grain weight in wheat lines contrasting for stem water soluble carbohydrate concentration. Field Crop. Res. 2009, 112, 43–54. [Google Scholar] [CrossRef]
  62. Yang, J.; Zhang, J.; Wang, Z.; Xu, G.; Zhu, Q. Activities of key enzymes in sucrose-to-starch conversion in wheat grains subjected to water deficit during grain filling. Plant Physiol. 2004, 135, 1621–1629. [Google Scholar] [CrossRef]
  63. Chen, J.; Tian, Y.; Zhang, X.; Zheng, C.; Song, Z.; Deng, A.; Zhang, W. Nighttime warming will increase winter wheat yield through improving plant development and grain growth in north China. J. Plant Growth Regul. 2014, 33, 397–407. [Google Scholar] [CrossRef]
  64. Reynolds, M.; Bonnett, D.; Chapman, S.C.; Furbank, R.T.; Manès, Y.; Mather, D.E.; Parry, M.A.J. Raising yield potential of wheat. I. Overview of a consortium approach and breeding strategies. J. Exp. Bot. 2011, 62, 439–452. [Google Scholar] [CrossRef] [PubMed]
Figure 1. Monthly precipitation and average temperature at the Changwu Agricultural Research Station, Shaanxi province in the 2011–2012 and 2012–2013 growing seasons, along with the long-term (1957–2006) precipitation and average temperature (2007–2013).
Agronomy 09 00612 g001
Figure 2. Plant height measured at the final harvest in different cropping seasons of winter wheat varieties released from 1942 to 2004 in the Loess Plateau of China and grown at the Changwu Agricultural Research Station, Shaanxi province. Different legends showed different winter wheat varieties. Legends filled with black stand for the 2011–2012 cropping season, legends filled with white stand for the 2012–2013 cropping season. The solid line stands for the regression between plant height and the year of release in the 2011–2012 cropping season. (P = 0.019, LSD is 3.8 and P = 0.129, LSD is 4.4 in 2011–2012 and 2012–2013, respectively).
Agronomy 09 00612 g002
Figure 3. Grain yield measured at the final harvest in different cropping seasons of winter wheat varieties released from 1942 to 2004 in the Loess Plateau of China and grown at the Changwu Agricultural Research Station, Shaanxi province. Different legends show different winter wheat varieties. Legends filled with black stand for the 2011–2012 cropping season, legends filled with white stand for the 2012–2013 cropping season. The solid line stands for the regression between GY and the year of release in the 2011–2012 cropping season. (P = 0.042, LSD is 287 and P = 0.130, LSD is 154 in 2011–2012 and 2012–2013, respectively).
Agronomy 09 00612 g003
Figure 4. Aboveground biomass measured at the final harvest in different cropping seasons of the winter wheat varieties released from 1942 to 2004 in the Loess Plateau of China and grown at the Changwu Agricultural Research Station, Shaanxi province. Different legends show different winter wheat varieties. Legends filled with black stand for the 2011–2012 cropping season, legend filled with white stand for the 2012–2013 cropping season. The solid line stands for the regression between AGW and the year of release in 2011–2012 cropping season. (P = 0.002, LSD is 1421 and P = 0.192, LSD is 362 in 2011–2012 and 2012–2013, respectively).
Agronomy 09 00612 g004
Figure 5. Harvest index measured at the final harvest in different cropping seasons of winter wheat varieties released from 1942 to 2004 in the Loess Plateau of China and grown at the Changwu Agricultural Research Station, Shaanxi province. Different legends show different winter wheat varieties. Legends filled with black stand for the 2011–2012 cropping season, legends filled with white stand for the 2012–2013 cropping season. The solid line stands for the regression between the HI and the year of release in 2011–2012 cropping season, the long dash line stands for the regression between the HI and the year of release in the 2012–2013 cropping season (P = 0.010, LSD is 2.0, and P = 0.042, LSD is 1.7 in 2011–2012 and 2012–2013, respectively).
Agronomy 09 00612 g005
Figure 6. Average grain weight measured at the final harvest in different cropping seasons of winter wheat varieties released from 1942 to 2004 in the Loess Plateau of China and grown at the Changwu Agricultural Research Station, Shaanxi province. Different legends show different winter wheat varieties. Legends filled with black stand for the 2011–2012 cropping season, legends filled with white stand for the 2012–2013 cropping season. The solid line stands for the regression between the AGW and the year of release in the 2011–2012 cropping season, the long dash line stands for the regression between the AGW and the year of release in 2012–2013 cropping season (P = 0.041, LSD is 1.8 and P = 0.005, LSD is 1.6 in 2011–2012 and 2012–2013, respectively).
Agronomy 09 00612 g006
Figure 7. Frequency distribution of the individual grain weight in different cropping seasons of winter wheat varieties released from 1942 to 2004 in the Loess Plateau of China and grown at the Changwu Agricultural Research Station, Shaanxi province. Legends filled with black stand for the 2011–2012 cropping season, legends filled with white stand for the 2012–2013 cropping season.
Agronomy 09 00612 g007
Figure 8. The weight of superior and inferior grain in different cropping seasons of winter wheat varieties released from 1942 to 2004 in the Loess Plateau of China and grown at the Changwu Agricultural Research Station, Shaanxi province. Different legends show different winter wheat varieties. Legends filled with black stand for the 2011–2012 cropping season, legends filled with white stand for the 2012–2013 cropping season. The long dash line stands for the regression between the weight of different grain types and the year of release in the 2012–2013 cropping season. (P = 0.051, LSD is 5.0 and P = 0.001, LSD is 4.2 in 2011–2012 and 2012–2013, respectively for the superior grain weight; P = 0.355, LSD is 3.6 and P = 0.049, LSD is 8.9 in 2011–2012 and 2012–2013, respectively for the inferior grain weight).
Agronomy 09 00612 g008
Figure 9. The proportion and number of superior grain in two cropping seasons of winter wheat varieties released from 1942 to 2004 in the Loess Plateau of China and grown at the Changwu Agricultural Research Station, Shaanxi province. Legends filled with black stand for the 2011–2012 cropping season, legends filled with white stand for the 2012–2013 cropping season. The solid line stands for the regression between the proportion or number and the year of release in the 2011–2012 cropping season, the long dash line stands for the regression between the proportion or the number and the year of release in the 2012–2013 cropping season. (P = 0.025, LSD is 3.2 and P = 0.003, LSD is 4.1 in 2011–201,2 and 2012–2013, respectively for the proportion of superior grain; P = 0.001, LSD is 1.6, and P = 0.109, LSD is 3.5 in 2011–2012 and 2012–2013, respectively for the number of superior grain).
Agronomy 09 00612 g009
Figure 10. The proportion and number of inferior grain in two cropping seasons of winter wheat varieties released from 1942 to 2004 in the Loess Plateau of China and grown at the Changwu Agricultural Research Station, Shaanxi province. Legends filled with black stand for the 2011–2012 cropping season, legends filled with white stand for the 2012–2013 cropping season. The solid line stands for the regression between the proportion or number and the year of release in the 2011–2012 cropping season, the long dash line stands for the regression between the proportion or the number and the year of release in the 2012–2013 cropping season (P = 0.024, LSD is 2.8 and P = 0.005 LSD is 4.7 in 2011–2012, and 2012–2013, respectively for the proportion of inferior grain; P = 0.459, LSD is 1.1 and P = 0.309, LSD is 0.98 in 2011–2012 and 2012–2013, respectively for the number of inferior grain).
Agronomy 09 00612 g010
Figure 11. Relationship between grain yield and the gain in biomass after anthesis in six winter wheat varieties released from 1942 to 2004 in the Loess Plateau of China and grown at the Changwu Agricultural Research Station, Shaanxi province during two cropping seasons. Legend filled with black stand for the 2011–2012 cropping season, legends filled with white stand for the 2012–2013 cropping season.
Agronomy 09 00612 g011
Table 1. List of representative winter wheat varieties and their characteristics released from 1942 to 2004 in the Loess Plateau of China.
VarietyTime of ReleaseDecade of Main PlantDwarfing GeneCharacteristics
Bima119421950sNoneLodging Resistance
Fengchan319641960sNoneResistance to stripe rust
Hanxuan1019661970sNoneDrought resistance
Xiaoyan619811980sRht-B1b+Rht8Resistance to stripe rust
Changwu13419981990sRht-B1bDrought resistance
Changhan5820042000sRht-B1bDrought resistance
Table 2. Days after sowing (DAS) to anthesis, maturity, and duration of grain filling for winter wheat varieties released from 1942 to 2004 in the Loess Plateau of China and grown at the Changwu Agricultural Research Station, Shaanxi province in the 2011–2012 and 2012–2013 growing seasons.
Variety2011–20122012–2013
Anthesis (DAS)Maturity (DAS)Duration Grain Filling (d)Anthesis (DAS)Maturity (DAS)Duration Grain Filling (d)
Bima12302693922626135
Fengchan323327239230266a36
Hanxuan102302693922726437
Xiaoyan62312714023026838
Changwu1342312734223026838
Changhan582322754323127140
LSD0.051.62.82.71.32.02.8
Table 3. Yield components of winter wheat varieties released from 1942 to 2004 in the Loess Plateau of China and grown at the Changwu Agricultural Research Station, Shaanxi province in the 2011–2012 and 2012–2013 growing seasons.
VarietySN (Spikes m−2)GN (Grains m−2)GNS (Grains Spike−1)
2011–20122012–20132011–20122012–20132011–20122012–2013
Bima1756 b606 a20041 b11020 c26.5 c23.1 c
Fengchan3765 b424 c24849 a13148 a32.5 b28.7 c
Hanxuan10703 c577 a16992 c13091 a23.3 c22.0 c
Xiaoyan6833 a406 c24788 a12368 b34.9 a30.7 b
Changwu134700 c519 b22441 a13108 a32.1 b25.5 c
Changhan58619 d399 d23893 a13752 a38.6 a34.2 a
Mean729489221671274831.327.4
a,b,c,d Means followed by a common letter within a column were not significantly different at P = 0.05. SN: spike number per unit area; GN: grain number per spike; GNS: grain number per spike.

