Article

A Comparative Analysis of the Hybrid Maize (Zea mays L.) Seed Quality in China from 2013 to 2018

1
Dryland Technology Key Laboratory of Shandong Province, Qingdao Agricultural University, Qingdao 266109, China
2
Maize Research Institute, Qingdao Agricultural University, Qingdao 266109, China
3
Dryland Farming Institute, Hebei Academy of Agriculture and Forestry Sciences, Hengshui 053000, China
4
Seed Science and Technology Research Center, China Agricultural University, Beijing 100193, China
5
College of Agriculture and Food Science, Zhejiang Agriculture and Forestry University, Lin’an 311300, China
*
Author to whom correspondence should be addressed.
These authors contributed equally to this paper.
Agronomy 2019, 9(10), 625; https://doi.org/10.3390/agronomy9100625
Submission received: 20 August 2019 / Revised: 8 October 2019 / Accepted: 9 October 2019 / Published: 10 October 2019
(This article belongs to the Section Farming Sustainability)

Abstract

:
In this study, a comparative analysis of seed quality indicators of 1196 hybrid maize seed samples from the main maize-producing areas in China from 2013 to 2018 was carried out. The results showed that the maize seed quality in China had changed obviously in the past six years, and was mainly as follows: The percentage of samples with coated seed in 2015–2018 was higher than 62.8% in 2013 and all exceeded 97%; the sample rate of packaging according to seed number was from 24.5% in 2013 to 58.6% in 2018, and the percentage of samples which met the prescribed quality standards was from 89.2% in 2013 to 98.4% in 2018. Principal component analysis indicated that standard germination energy (SGE), standard germination percentage (SGP), cold test germination percentage (CTGP), accelerated aging test germination percentage (AATGP), and mean field seedling emergence (FSE) were the primary predictors of seed germination and seedling emergence. Meanwhile, combining other statistical methods, regression models of SGE, SGP, CTGP, and AATGP were established to predict the field seedling emergence. Furthermore, seed bulk density and total starch content were correlated with seed vigor, which needs to be further studied. This study offered a theoretical basis and data support to better understand the changes of maize quality in China over the past six years, and provided an important reference to further improve the maize seed quality in the future.

1. Introduction

In China, hybrid maize comprises more than 95% of maize cultivation [1], and the annual demand for hybrid seeds is approximately 1.1 billion kg [2]. The production of high-quality hybrid maize seeds is one of the foundations of successful agriculture and can comprehensively enhance the development level of modern agriculture. For a long time, China has many seed companies (5808 companies in 2018, data from China Seed Congress 2019, Beijing, China) and crop varieties. It is worth noting that the seed production levels of different seed enterprises are inconsistent. This may be due to the low entry threshold of China’s seed enterprises in the past. In contrast, most maize growers in the USA depend on a relatively small number of relatively large seed companies that maintain advanced standards of seed quality. More importantly, the seed quality in China has remained unclear in recent years. Thus, it is important to investigate the seed quality of the main crops, i.e., maize, rice, and wheat, in China.
Recently, many studies about seed vigor, as an important index, reflecting seed quality have been reported [3,4,5]. In particular, the quality of maize seeds has attracted wide attention. For example, regarding maize seed production and storage, the ideal harvest time for the seed production of XY335 and ZD958 with the highest vigor across eight environments has been identified [6]. Seeds of the maize inbred line Zheng 58 from the middle and bottom section of the ear have lower abscisic acid (ABA)/gibberellin acid (GA) ratios in the embryos and higher seed vigor, stress resistance, and carbon and nitrogen metabolism [7]. Twenty-three candidate genes for association with maize seed vigor traits coinciding with 13 quantitative trait loci (QTLs) with functions in the glycolytic pathway and in protein metabolism under artificial aging conditions, were mapped using recombinant inbred line (RIL) maize populations (Yu82 × Shen137 and Yu537A × Shen137) [8]. Six known genes and five novel candidate genes related to germination in aged seeds of the maize inbred lines P39 and EP44 were identified by simple sequence repeats (SSRs) [9]. The raffinose family oligosaccharides play important roles in modulating maize seed vigor and seed longevity in storage [10]. Regarding the genetics of maize seed vigor-related traits, Jiang et al. (2011) detected 10 QTLs controlling coleorhiza length, which were closely related to seed vigor [11], and Li et al. [12] detected 43 QTLs related to seed low-temperature germination ability in two cold-tolerant inbred lines (220 and P9-10), two susceptible lines (Y1518 and PH4CV), and three connected F2:3 populations.
It is very important to analyze the maize seed quality by collecting and testing the seed samples of cultivated varieties in the main maize production areas in China. However, there are few reports on the market research analysis of maize seed quality; for example, Zhang et al. [13] investigated the maize seed quality in the Shandong province of China through a questionnaire survey in 2014. However, the relationships between indices of maize seed’s physical and chemical characteristics and seed vigor need to be further elucidated [14], and high-vigor seed traits also need to be continuously examined.
In this study, we investigated the seed quality of commercial maize hybrid samples which were collected from the main maize-producing areas of China from 2013 to 2018 and performed a comparative analysis of seed quality of these maize samples in different years. At the same time, the prediction model of seed quality correlation was established. This work will provide a basis to better understand the changes of maize quality in China over the past six years and offer an important reference for improving the maize seed quality.

2. Materials and Methods
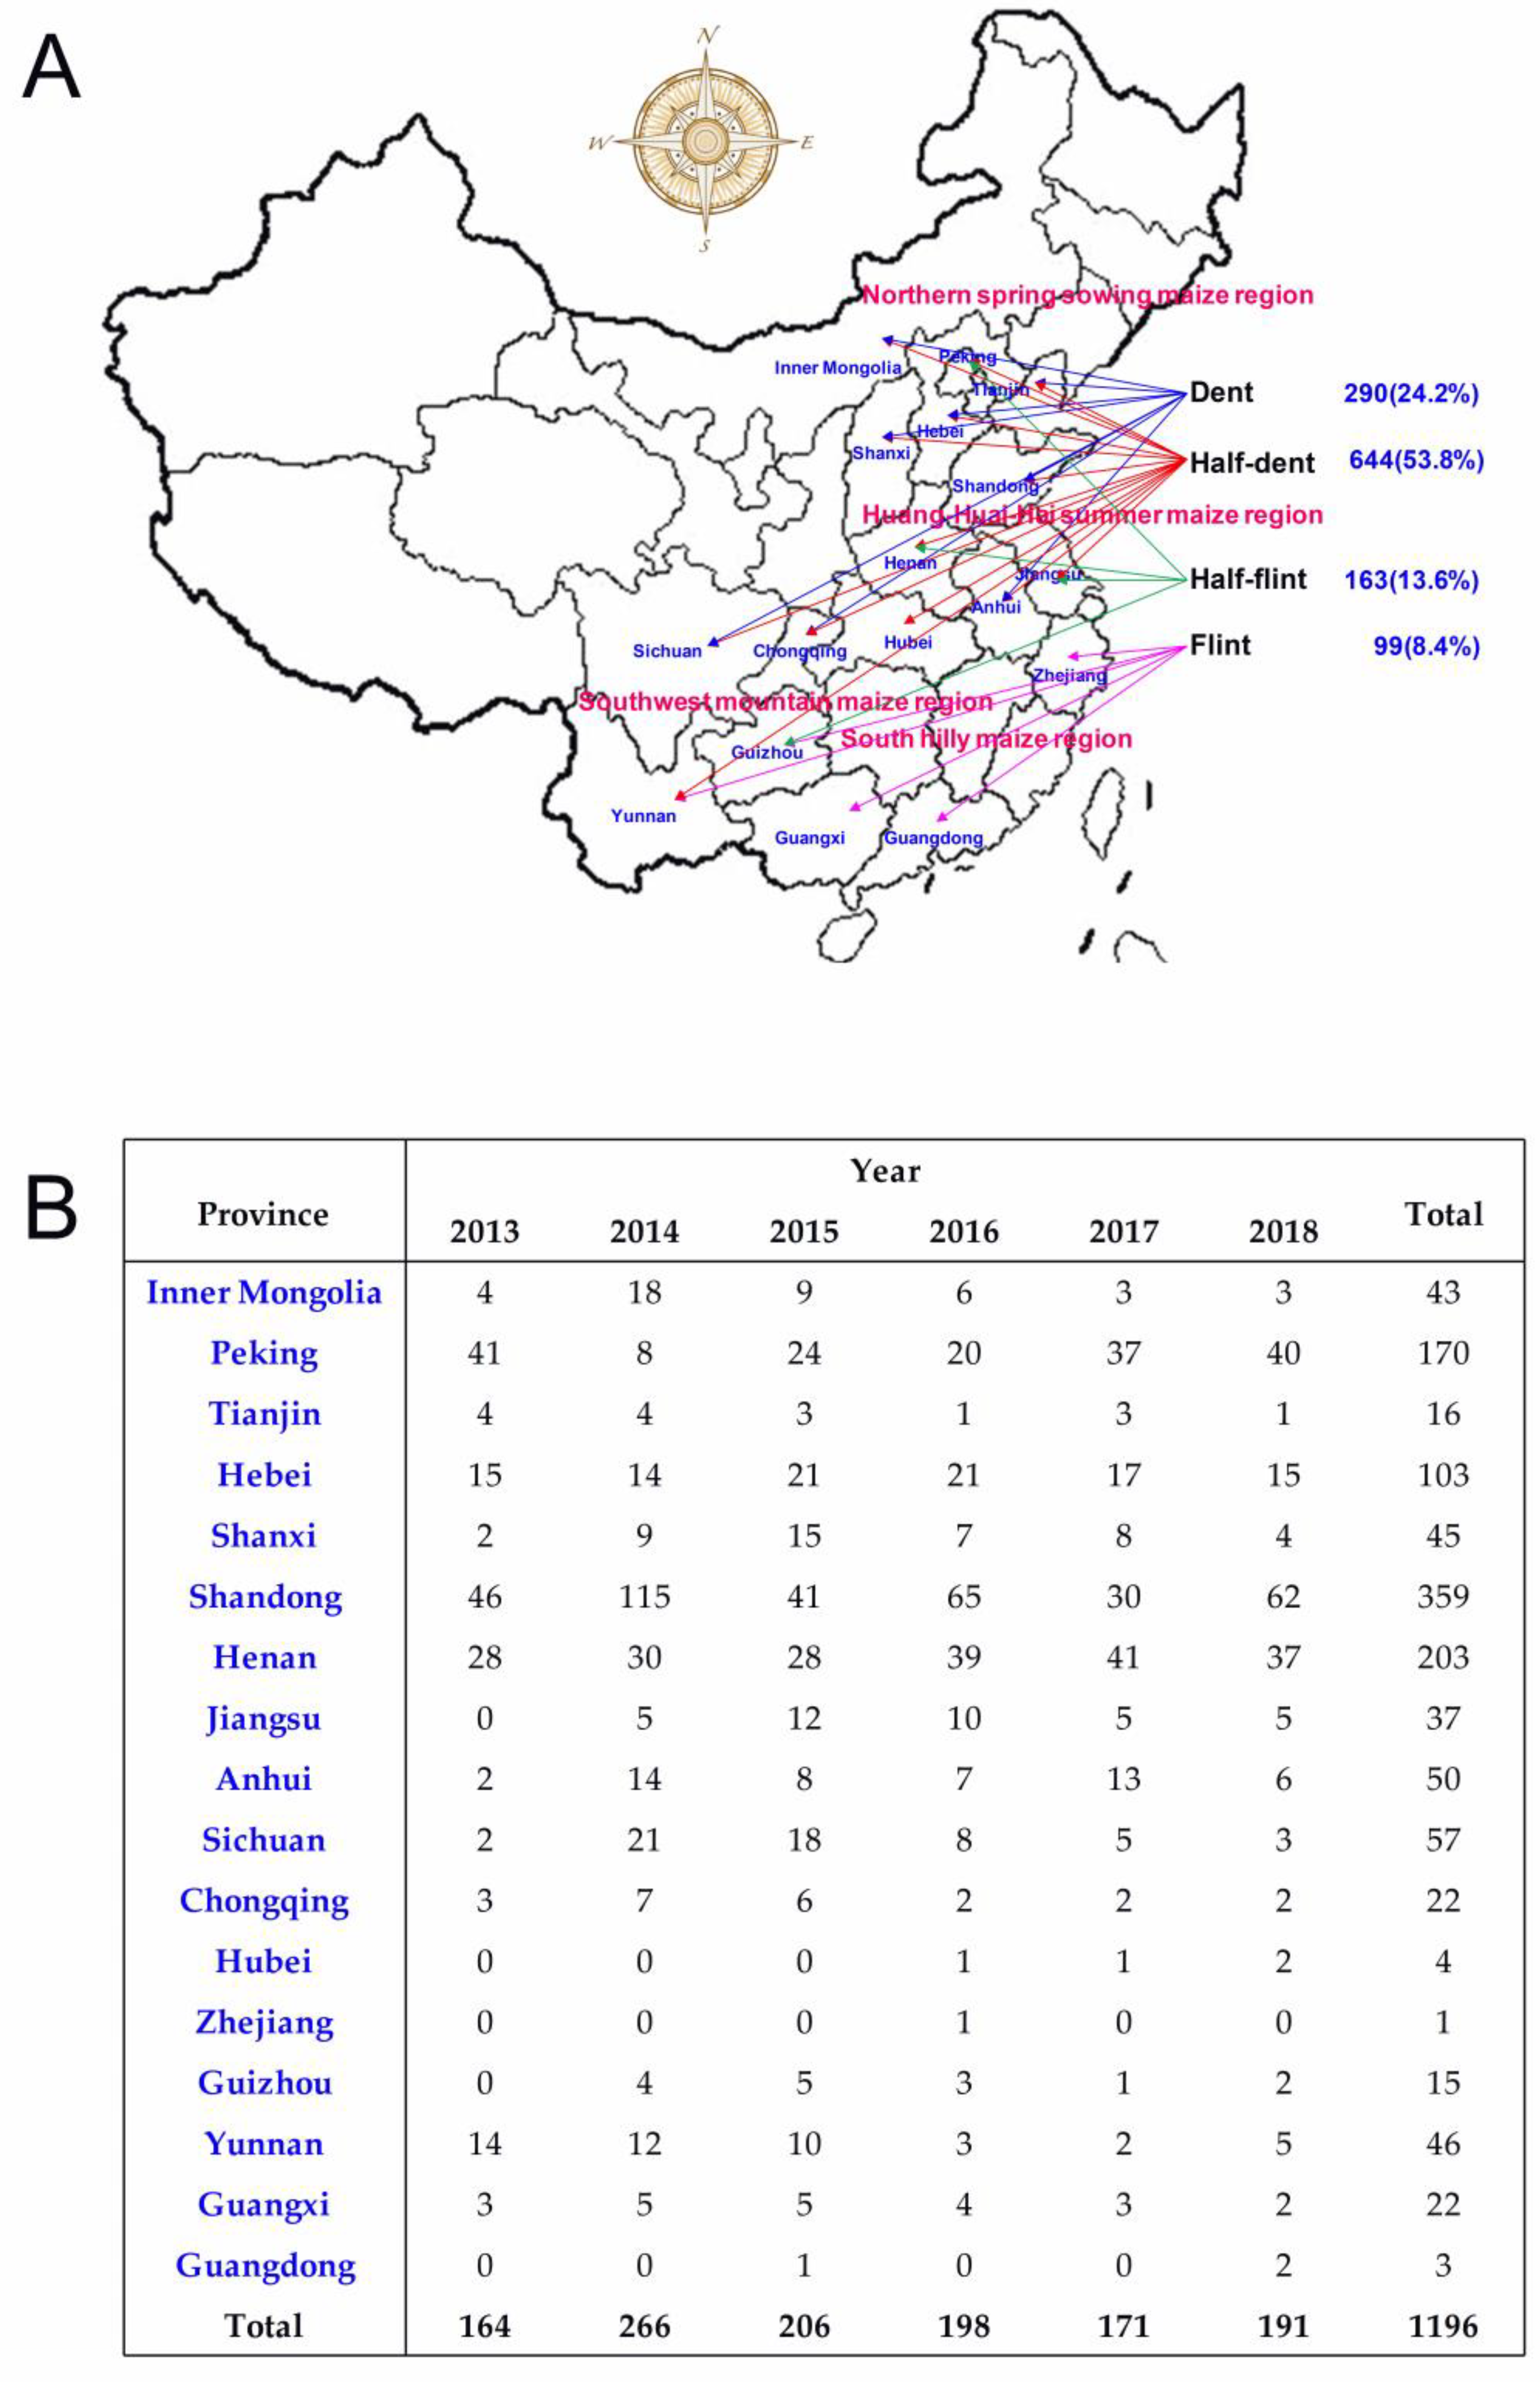
2.1. Region

According to the ecological type, the maize production areas in China were divided into seven regions, namely northeast, north, Huanghuai, northwest, southwest, southeast, and south [15]. In this study, we mainly focused on five regions: north, Huanghuai, northwest, southwest, and south (NHNSS for short).

2.2. Plant Materials

From 2013 to 2018, the samples of commercial maize hybrid seeds collected from NHNSS were used in this study. The variety coverage rate was over 90% to ensure that samples taken were representative of all commercial maize varieties. Two rules of the sample collection were as follows: (1) each sample was a cultivar; (2) each cultivar had only one sample collected, except for individual cultivars with multipacks. Moreover, related conclusions were verified again using 30 maize seed varieties produced by hand pollination (Table S1) in 2018. A total of 100 samples with complete packaging and a specific date regarding manufacture and manufacturer were randomly selected each year. These samples data were used to make further comparison and statistical analysis, including principal component analysis. All seeds were stored in a low temperature and low humidity seed bank (Beijing Kulan Technology Co., Ltd., Beijing, China) at 10 °C, 40% RH (relative humidity).

2.3. Measurements

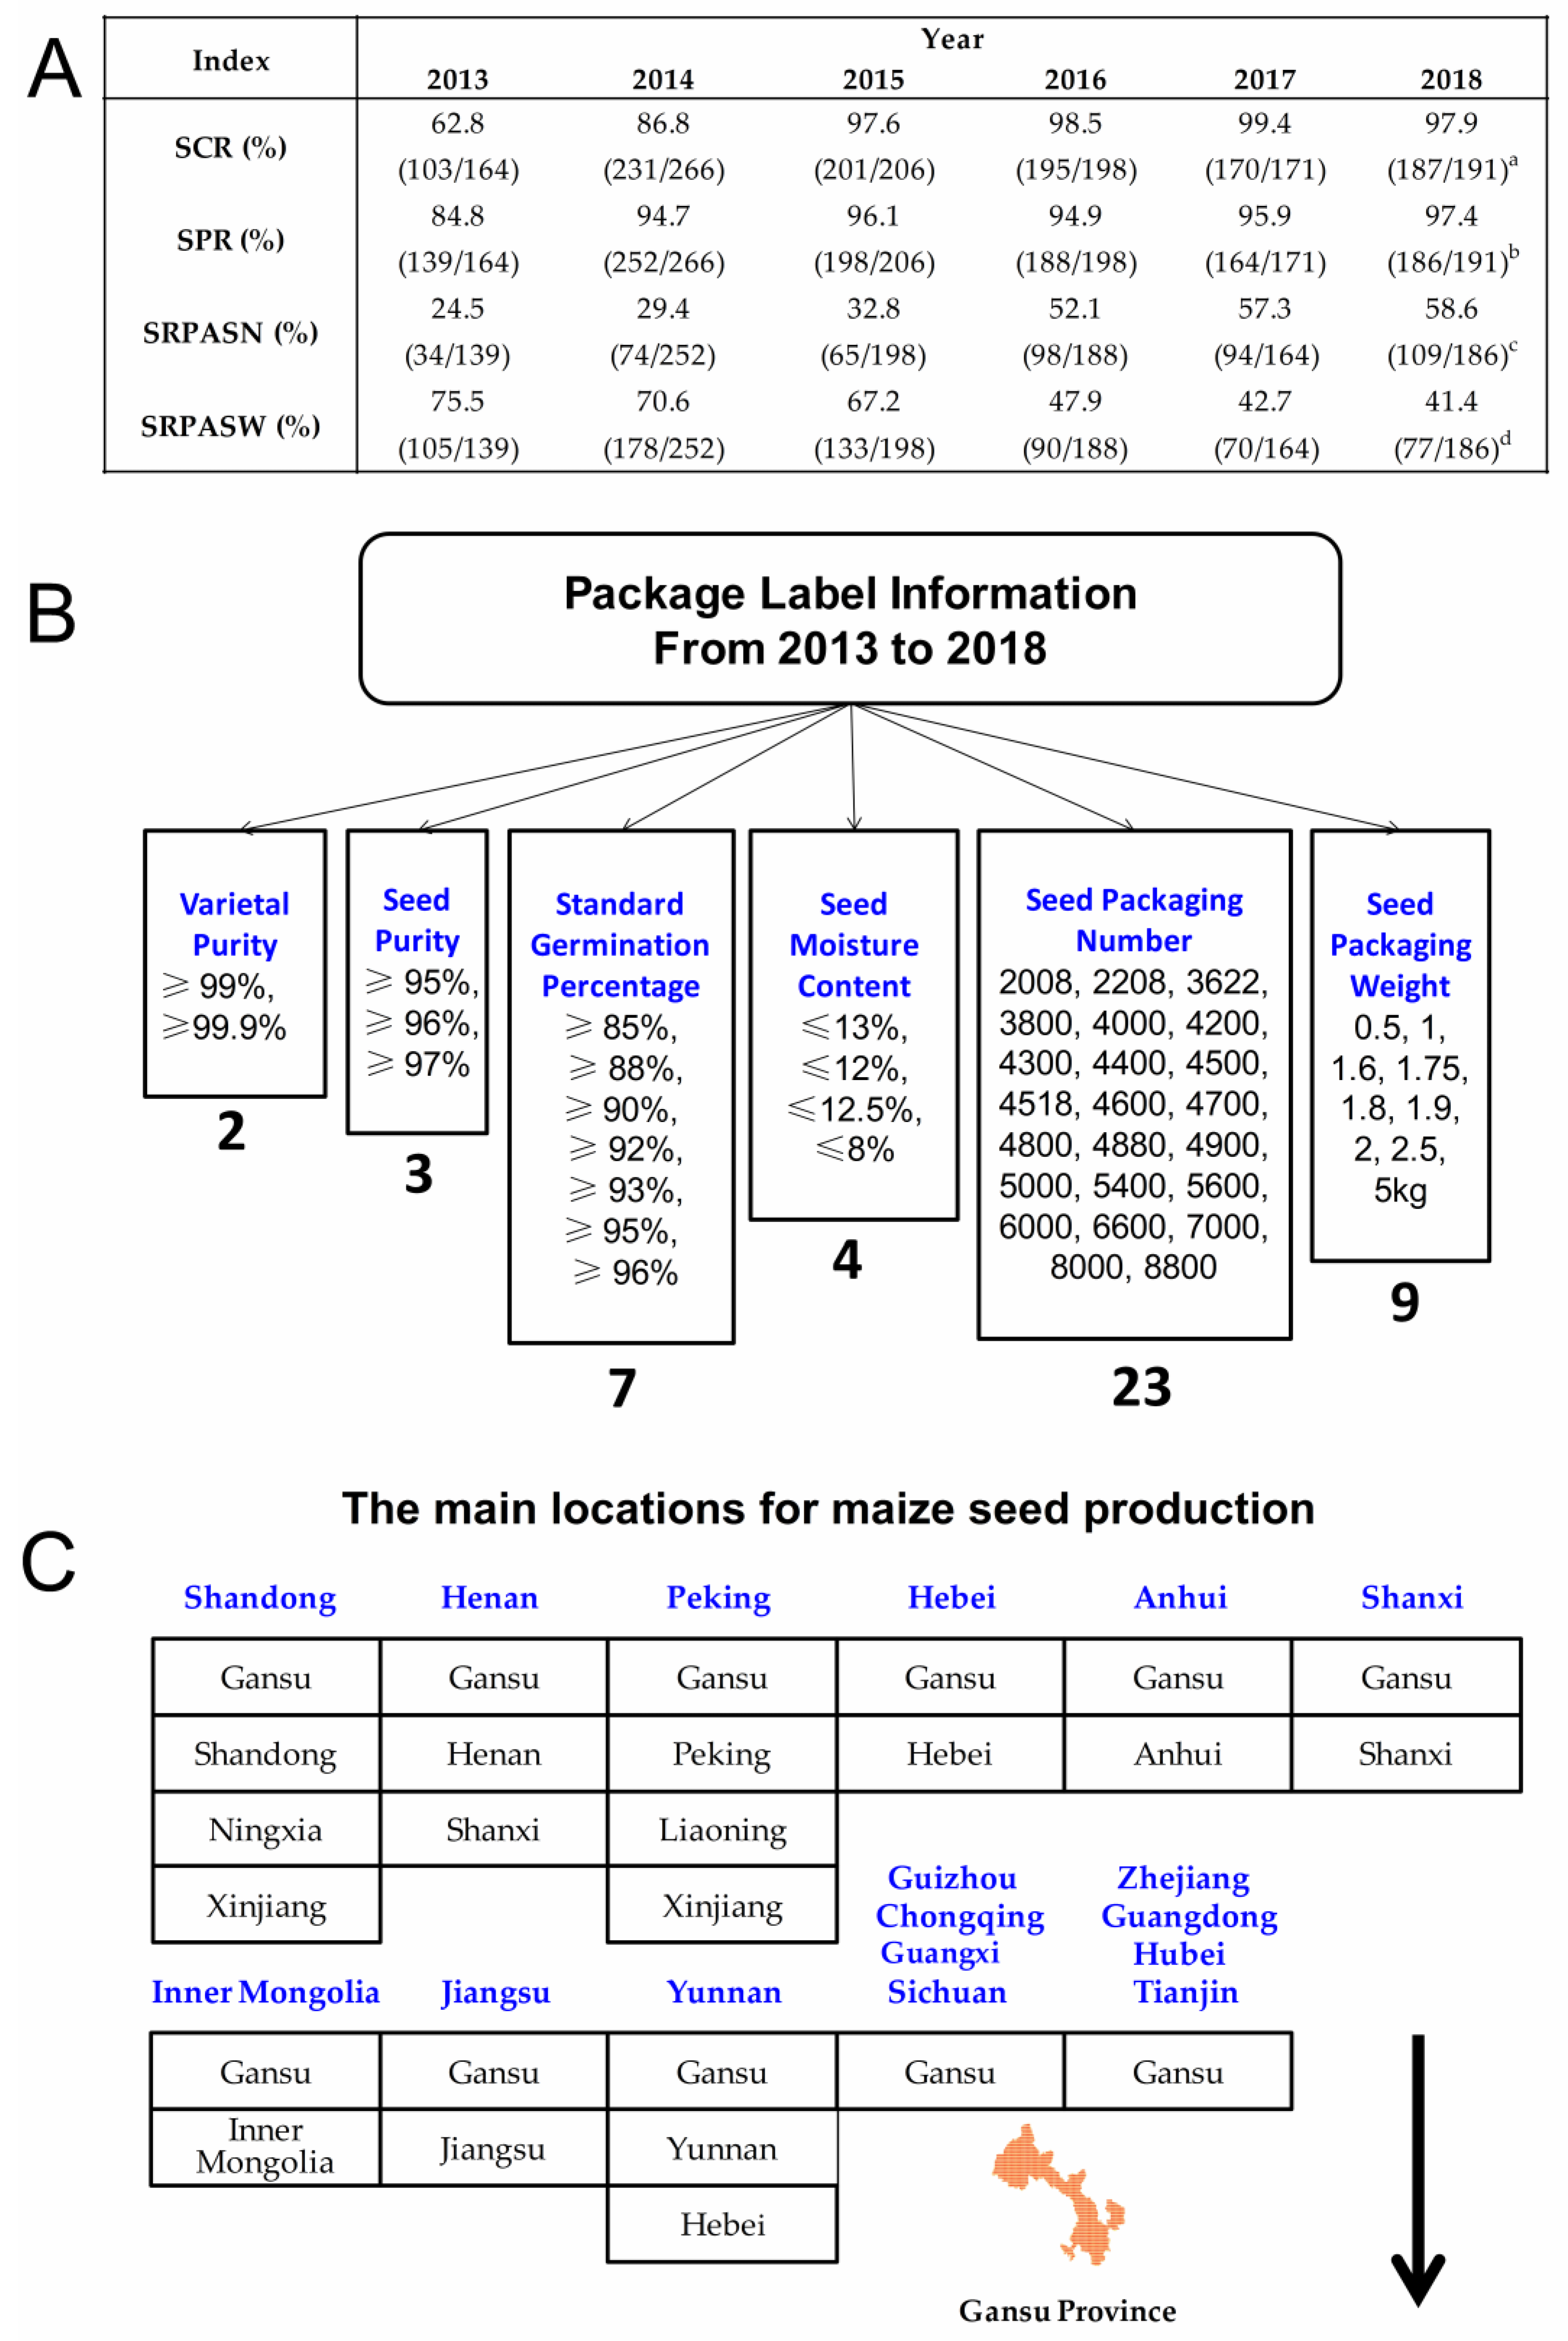
2.3.1. Sample Information

The basic information included sales, packaging, coating, seed type, and package label information (e.g., seed moisture content).

2.3.2. Seed Purity and Varietal Purity Test

Seed purity and varietal purity were measured according to the International Rules for Seed Testing [16] and the Rules for Agricultural Seed Testing (GB/T3543-1995) [17]. Among them, the varietal purity test mainly adopted the morphological identification method.

2.3.3. Sample Seed Type Classification

According to the main type of actual seeds and the structure of endosperm [18,19], the collected samples were classified into four types: dent, half-dent, half-flint, and flint.

2.3.4. Thousand-Seed Weight, Seed Moisture Content, Seed Bulk Density, and Seed Hardness Test

Seeds were randomly selected from each sample in this study. The thousand-seed weight was measured using 500 seeds in each of three replicates and then converted into thousand-seed weight. For the seed moisture test, seeds were ground and dried at 130 ± 0.5 °C for four hours [20], and the moisture content was calculated on the fresh-weight basis. The seed bulk density was measured by a volume–weight instrument (Seedburo 151). For the seed hardness test, the average value of flat compression yield stress, side compression yield stress and column compression yield stress were measured using ten seeds of each sample by an electronic universal testing machine (SANS CMT5204).

2.3.5. Total Starch Content, Crude Protein Content, and Crude Fat Content Test

The total starch content, crude protein content, and crude fat content of samples were measured using the dual-wavelength method [21], Kjeldahl method [22], and Soxhlet extraction [23], respectively. At the same time, the experiments were carried out by referring to the methods introduced in the Experimental Technology of Seed Science [24]. The experiments were repeated three times. Three indices were calculated, as follows:
①. Total starch content (%) = amylose content (%) + amylopectin content (%); amylose content (%) = {[A × a × (b/c)]/m} × 10−6 × 100 = A/(10 × m), amylopectin content (%) = {[B × a × (b/c)]/m} × 10−6 × 100 = B/(10 × m), where A = amylose concentration in sample solution (µg/mL); a = the total volume of the solution after the addition of 50 mL iodine reagent; b = the total volume of the solution after the addition of 50 mL KOH; c = the sample solution suction volume, 2.5 mL; m = sample mass (g); 10−6 = converted µg into g; 100 = the percentage of starch content; B = amylopectin concentration in sample solution (µg/mL).
②. Crude protein content (%, dry basis) = {[(V2 − V1) × M × 0.0140 × K × 100]/[m × (100 − X)]} × 100, where V2 = the volume of consumed acid standard solution in sample titration (mL); V1 = the volume of consumed acid standard solution in blank titration (mL); M = the concentration of the standard acid solution (mol/L); K = the coefficient of nitrogen conversion to crude protein; m = sample mass (g); X = sample moisture content; 0.0140 = grams of nitrogen per mM.
③. Crude fat content (%, dry basis) = [crude fat mass (g)/sample mass (g) × (1 − moisture content)] × 100.

2.3.6. Germination Test

Seeds were randomly selected for germination and surface sterilized for ten minutes in 1% NaClO (w/v, Beijing Chemical Reagent Company, Beijing, China) and then washed thrice with distilled water (the coated seeds were cleaned with distilled water before surface sterilization). For rolled paper germination, two pieces of germination paper (Anchor Paper Co., St Paul, MN, USA) were stacked and wet by distilled water. Excess water on the paper was removed by a towel, then the sterilized seeds were placed in a loose vertical roll of germination paper and incubated at 25 ± 0.5 °C in a Versatile Environmental Test Chamber (MGC-350HP, Shanghai Yiheng Technology Instrument Co., Ltd., Shanghai, China) with three replicates of 100 seeds and germination in darkness [25]. The standard germination energy (SGE) and standard germination percentage (SGP) were determined on the fourth and seventh day, respectively, after the test had been set up [24]. SGP is the number of normal seedlings on the seventh day after the seed was planted.

2.3.7. Samples Met the Prescribed Quality Standards Test

According to the Seed Law of the People’s Republic of China [26], if any one of the SGP, seed purity, varietal purity, and seed moisture content is under the national standard or label, the sample should be identified as unqualified. With reference to the Chinese national standard (GB4404.1-2008) [27] and the Rules for Agricultural Seed Testing [28], the minimum quality standards of the SGP, seed purity, and varietal purity for maize seeds sold on the market should not be less than 85%, 96.0%, and 98.0%, respectively, as well as not less than the sample’s packing label value. Additionally, the seed moisture content should not be more than 13.0% (the national standard), as well as not more than the sample’s packing label value.

2.3.8. Pest Damage Rate Test

Referring to the Rules for Agricultural Seed Testing (GB/T 3543.7-1995, National Standards of the People’s Republic of China) [17] and Experimental Technology of Seed Science [24], “visual examination + potassium permanganate staining + anatomical examination” method was used, three replicates of 400 seeds were used for the pest damage rate test. The pest damage rate (%) = (number of seeds with pest damage/number of seeds tested) × 100.

2.3.9. Seed Breakage Rate Test

Referring to the Modern Seed and Seedling Lab Manual [29], three replicates of 200 seeds were used for seed breakage rate testing. The fast green staining method was used to count the broken seeds and obvious crack seeds. The seed breakage rate (%) = (number of damaged seeds/number of seeds tested) × 100.

2.3.10. Cold Test and Accelerated Aging Test

The cold test and accelerated aging test were conducted referring to the Seed Quality Testing and Evaluation Manual of Corn (Zea mays) [30] and ISTA Rules [16], respectively. For the cold test, three replicates of 100 seeds were held in moist paper towels for seven days at 10 ± 0.5 °C followed by seven days at 25 ± 0.5 °C in the dark, and normal germination was counted to calculate the cold test germination percentage (CTGP). There was moist soil medium taken from a maize field (pH: 6–8) on paper towels. For the accelerated aging test, each sample had three replicates, with 100 seeds in each replicate. Each group of 100 seeds was placed on the accelerated aging box (12 cm × 12 cm) before they were placed in the seed aging test chamber (LH-150S, Hangzhou Qianjiang Instrument and Equipment Co., Ltd., Hangzhou, China) precisely set at 43 ± 0.3 °C, 98% RH (relative humidity) and left for 72 h. After accelerated aging treatment, seeds were carried out for a germination test at 25 ± 0.5 °C for seven days in the dark, after which normal seedlings were counted to calculate the accelerated aging test germination percentage (AATGP) [31].

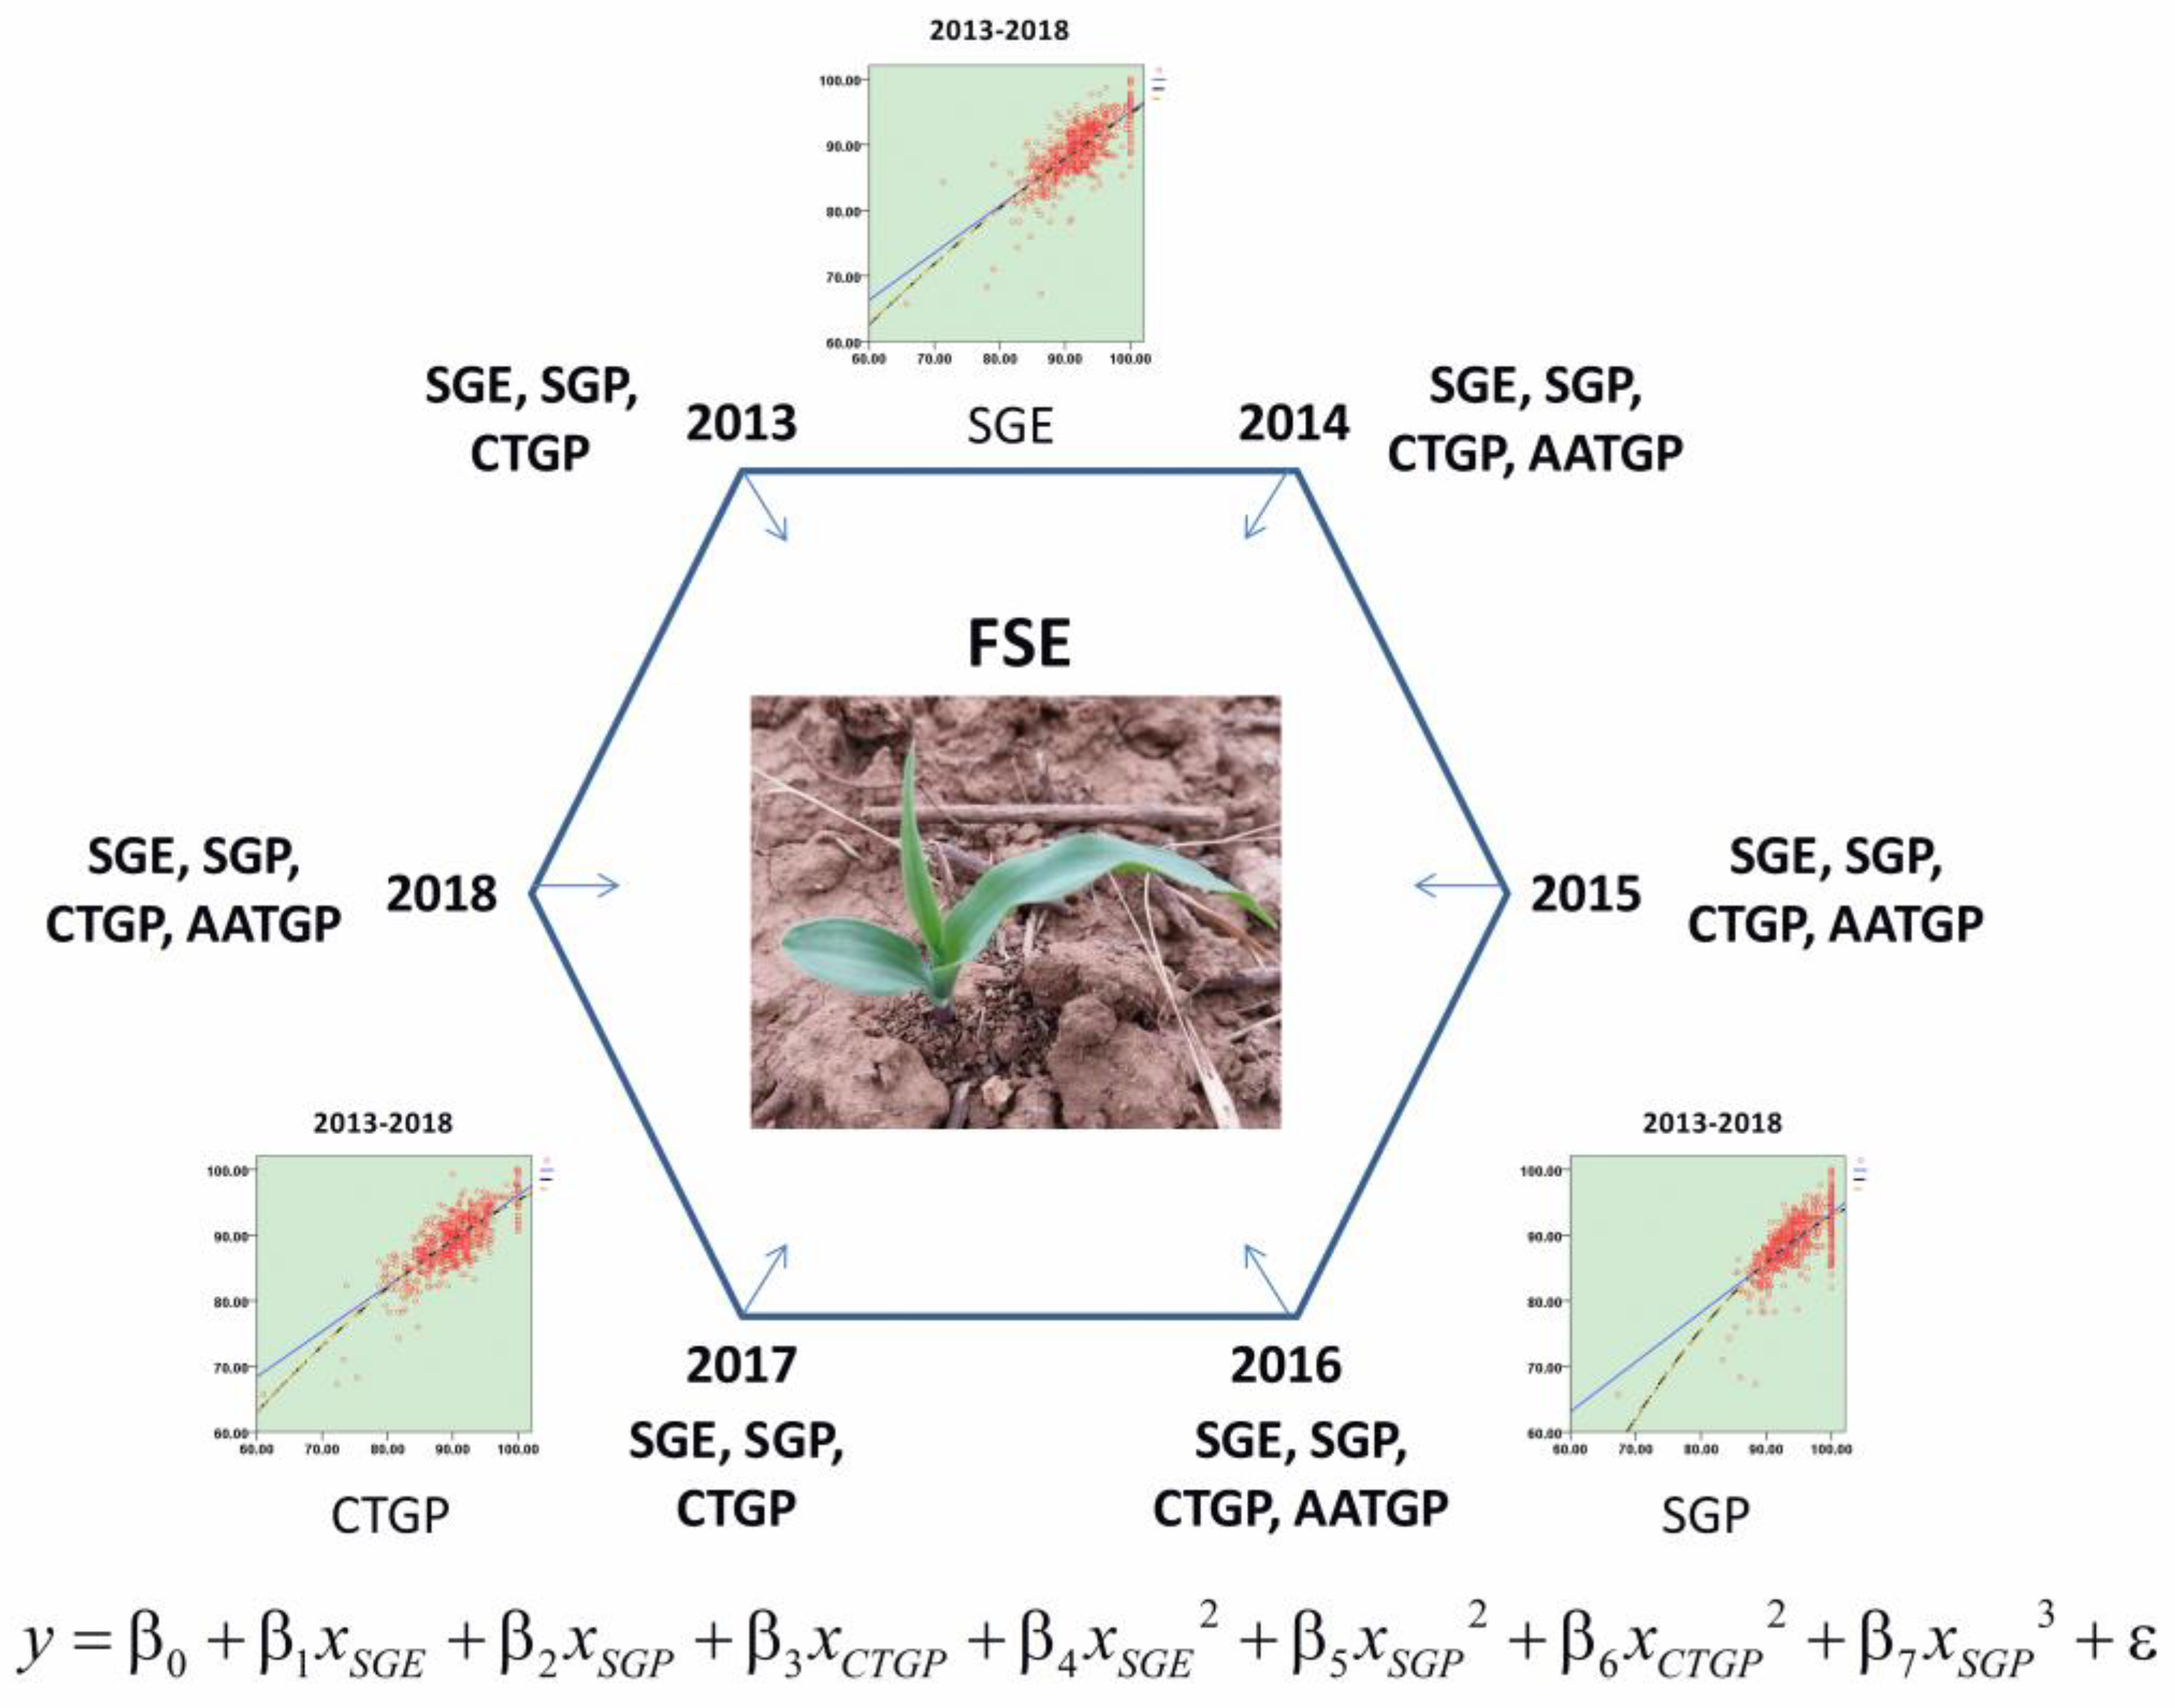
2.3.11. Field Seedling Emergence Test

For field seedling emergence, the samples were sown at the Jiaozhou, Laiyang, and Jimo experimental base, Shandong, China, in 2013 to 2018. The three experimental sites all belong to the temperate continental monsoon climate, semihumid, and drought-prone areas. In this region, the environmental stresses affecting maize seed field seedling emergence mainly include low temperature, high temperature, and drought. For example, here, maize field seedling emergence is vulnerable to low temperature stress during spring sowing, the average maximum temperature and the average minimum temperature in May 2018 of Jimo were 22 °C and 14 °C, respectively. Moreover, the soil types of seed bed in Jiaozhou, Laiyang, and Jimo experimental sites were sandy soil, loam soil, and sandy soil, respectively, and their soil organic matter content of them was 14.9, 13.7, and 9.6 g/kg, and their soil pH values of them were 7.3, 7.5, and 6.6, respectively.
In this study, the row spacing, spacing between rows, and length of rows were 0.06, 0.06, and 0.60 m, respectively. The seeds were sown using a single-seed planting method, with 10 seeds in each row, 10 rows (continuous row, 100 seeds) per replication, and three replications. Seed arrangement was based on the partition comparison method design. The field seedling emergence test was completed in May. FSE was counted at the three-leaf stage of maize. FSE (%) = [mean FSE-Jiaozhou (%) + mean FSE-Laiyang (%) + mean FSE-Jimo (%)]/3.

2.4. Statistical Analysis

Data for the seed germination test, seed bulk density test, seed hardness test, seed chemical component indices test, cold test, accelerated aging test, and field seedling emergence were analyzed by a one-way analysis of variance (ANOVA) using the SAS statistical software package (SAS Institute) [32], followed by the calculation of the lowest significant differences (LSD). The data was used to make a comparison and statistical analysis by SPSS 11.0, Matlab 7.0, and Excel including descriptive statistics analysis, principal component analysis, cluster analysis, correlation analysis, and regression analysis.
The annual works were completed from March to September in the Lab of Seed Science & Engineering, Qingdao Agricultural University.

3. Results

3.1. Overview of Sample Collection

From 2013 to 2018, we collected 1196 samples of maize hybrid cultivars covering 17 provinces of China, and the number of samples was 164, 266, 206, 198, 171, and 191, respectively (Figure 1). Dent and half-dent samples comprised the majority of all the samples with proportions of 24.2% and 53.8%, respectively. Moreover, we found that dent samples were mainly distributed in the northern provinces and flint samples in the south provinces (Figure 1A). A total of 359, 203, 170, and 103 samples were collected from Shandong, Henan, Peking, and Hebei, respectively. Compared with these provinces, the number of samples collected from Zhejiang, Hubei, and Guangdong was relatively small (Figure 1B).
Compared with 2013 and 2014, the sample coating rate (SCR, namely the percentage of samples with coated seed; here seed coating means film coating), sample packaging rate, sample rate of packaging according to seed number (SRPASN) were relatively high from 2015 to 2018. On the contrary, the sample rate of packaging according to seed weight (SRPASW) exhibited a downward trend (Figure 2A). By analyzing the statistical data of packaging identification information from all packaged samples, we found that there were 2, 3, 7, 4, 23, and 9 identity types of varietal purity, seed purity, germination percentage, seed moisture content, seed packaging number, and seed packaging weight, respectively (Figure 2B). Among them, multiple types of seed packaging number and seed packaging weight were related to the characteristics of maize varieties and the requirements of mechanization precision planting. Moreover, based on the seed production location choice priority, we found that Gansu, Xinjiang, Liaoning, and Ningxia were the main locations for seed production in NHNSS (Figure 2C). This is because these locations have excellent geographical conditions, climate, and soil for maize seed production. In addition to these considerations, abundant labor resources, convenient transportation, and the low cost of fertilizer and water are also important aspects of the priority selection of a seed production base [33].

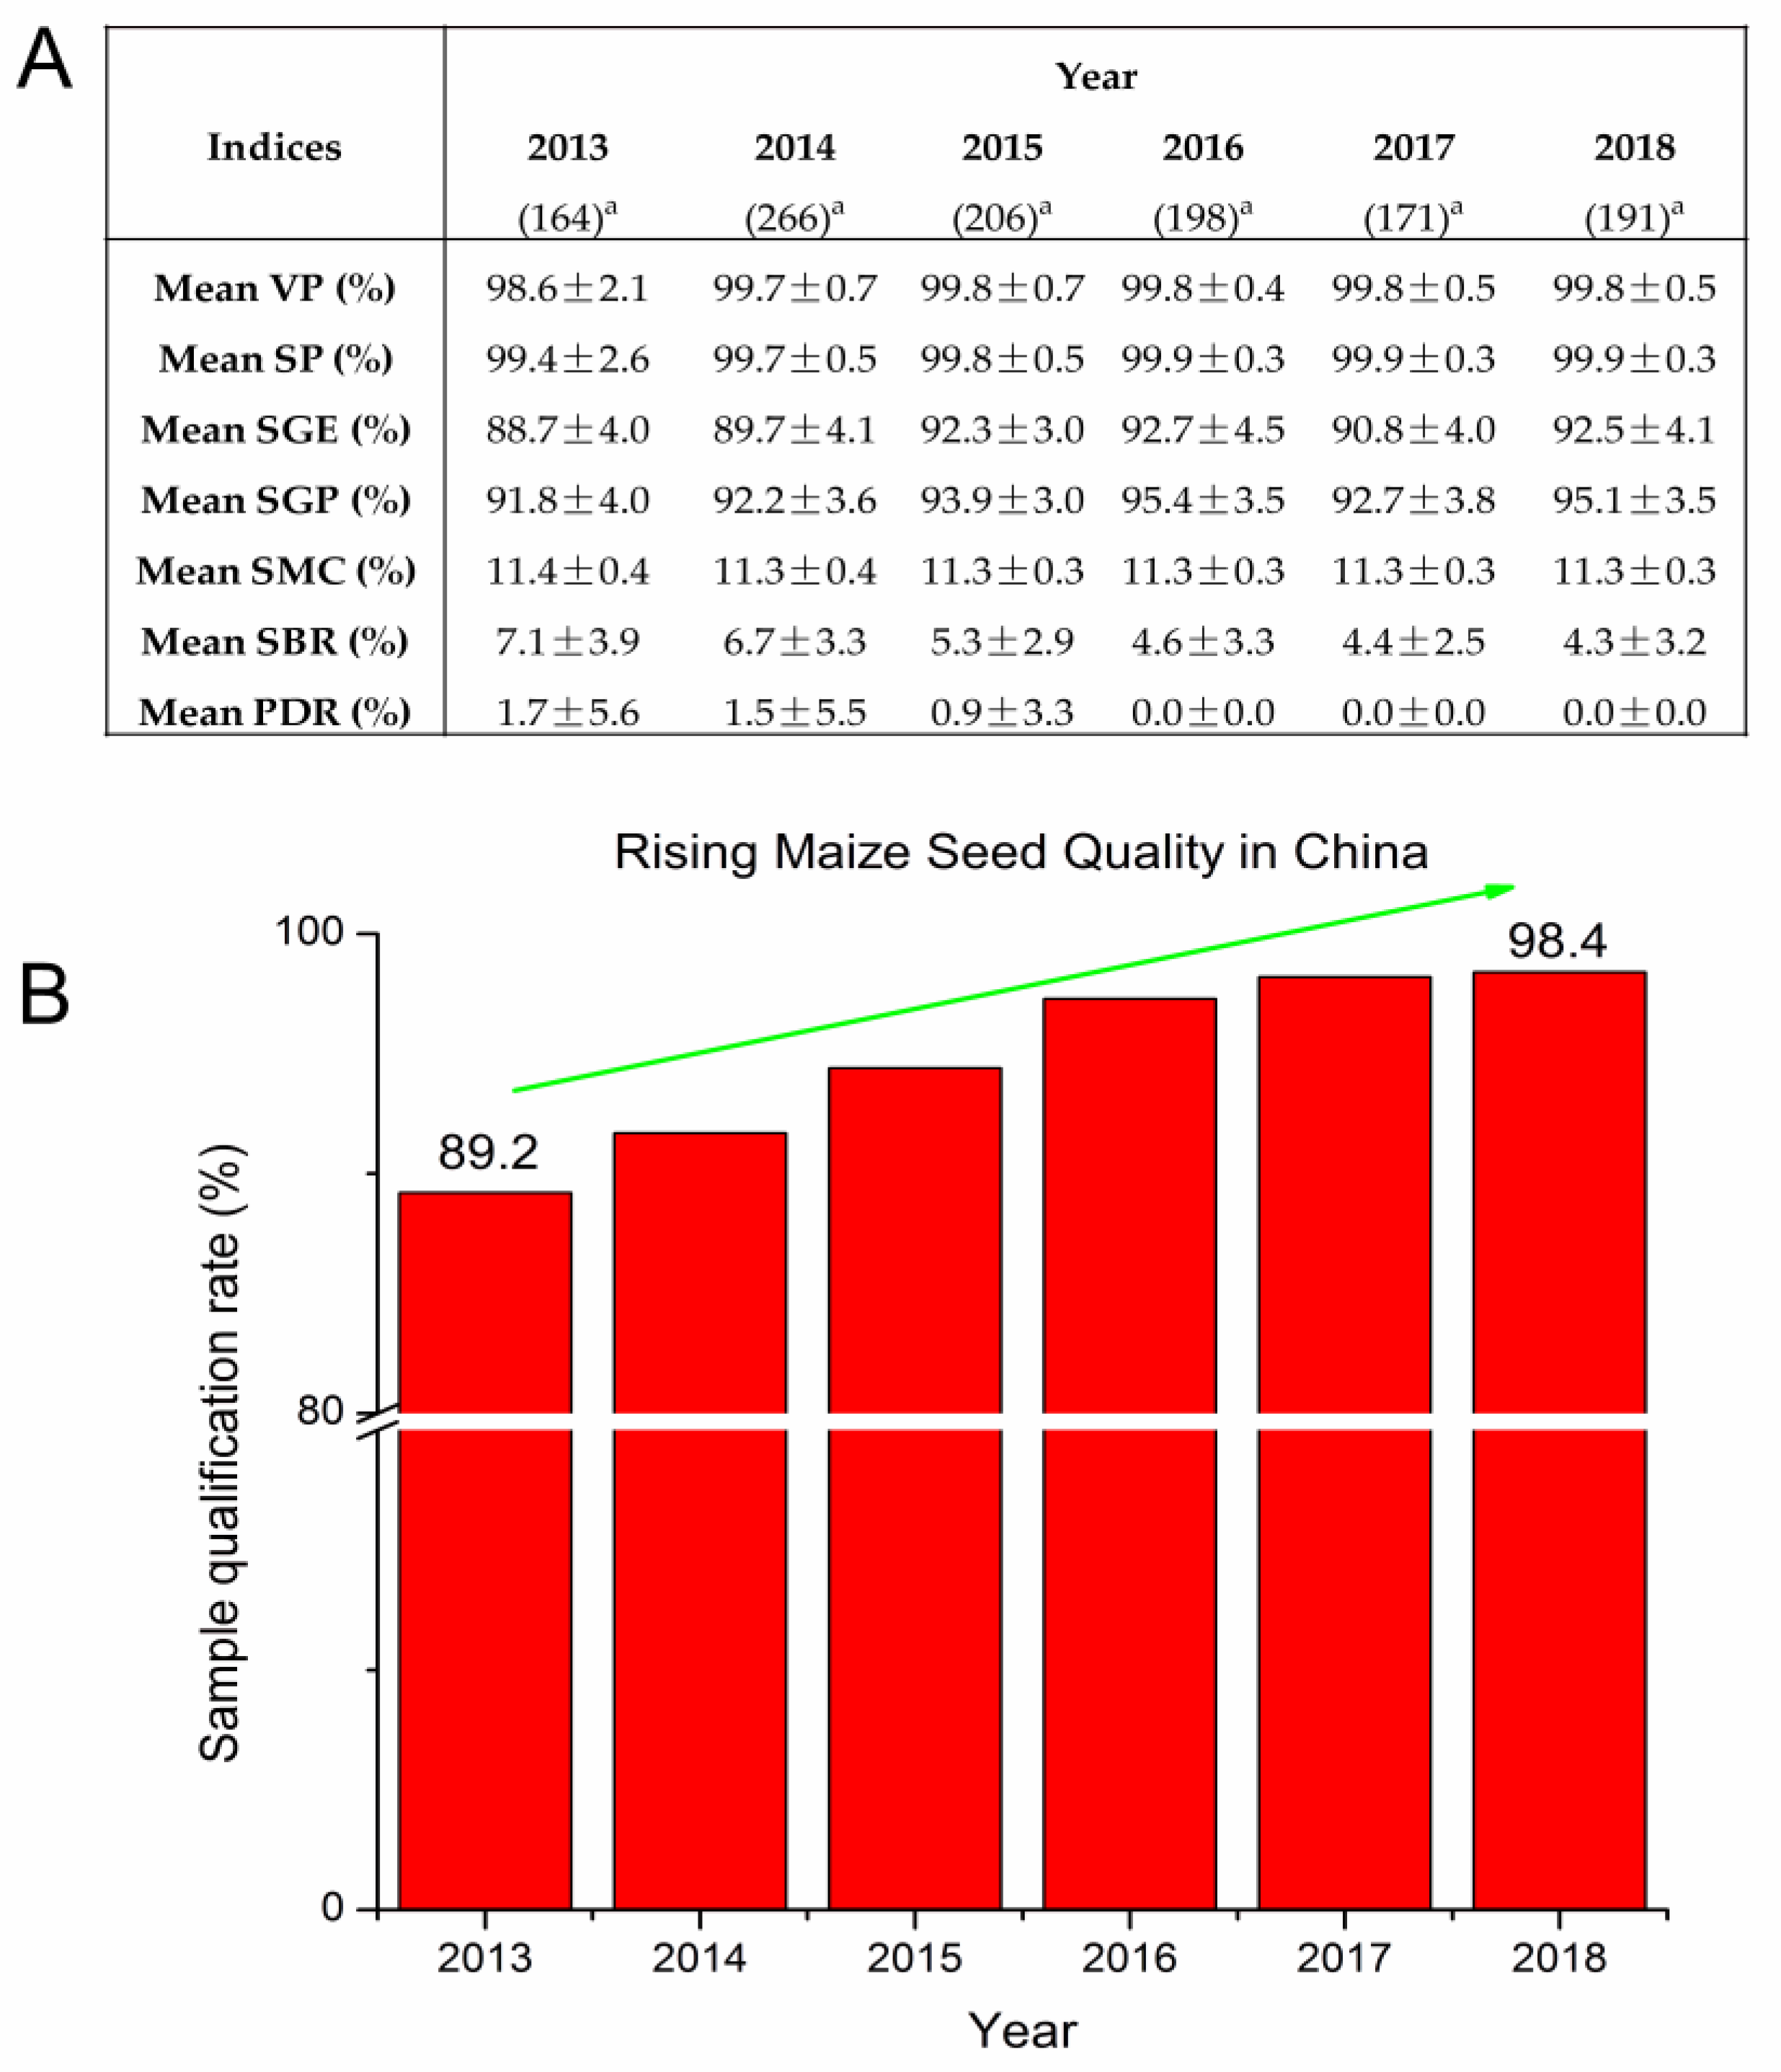
3.2. Comparative Analysis of Mean Values of Seed Quality Indices and Sample Qualification Rate (Namely the Percentage of Samples Which Met the Prescribed Quality Standards) from 2013 to 2018

Compared with 2013 and 2014, the mean standard germination energy (SGE), and standard germination percentage (SGP) were relatively high from 2015 to 2018. On the contrary, the mean seed breakage rate, and pest damage rate exhibited a downward trend. In particular, the mean SGE and SGP initially increased, then slightly decreased, and finally increased. The mean SGP was 91.8% in 2013 to 95.4% in 2016 but decreased to 92.7% in 2017 (Figure 3A), which may be attributed to the excessive production capacity of maize in China in 2015 and/or 2016. Furthermore, we found that the mean SGP slightly fluctuated from 2013 to 2018, but the value each year was over 92% except for 2013 (91.8%), which was clearly higher than the national standard germination percentage (85%). The mean varietal purity and the mean seed purity both exceeded the national standard and were close to 100%. By contrast, the mean seed breakage rate decreased, from 7.1% in 2013 to 4.3% in 2018 (Figure 3A). The sample coating rate (SCR, namely the percentage of samples with coated seed) increased from 62.8% in 2013 to 97.9% in 2018. The mean pest damage rate decreased from 1.7% in 2013 to 0 in 2016–2018 (Figure 3A). This finding is in line with the significant improvement of China’s control technology of seed diseases and insect pests in recent years. This is also evidenced by the increasing SCR. Moreover, some seed coatings contain specific fungicides, insecticides, and so on, which can effectively reduce or avoid the occurrence of seed diseases or insect pests (Figure 2A). The mean seed moisture content was 11%–12% which was lower than the national standard of safe water content (13%) each year (Figure 3A). Judging from the sample qualification rate (the packing samples), the index showed a steady upward trend, from 89.2% in 2013 to 98.4% in 2018, which also marked the continuous improvement of the overall quality level of Chinese maize seeds compared with the past (Figure 3B).

3.3. Descriptive Statistics Analysis of Seed Quality Indices from 2013 to 2018

Descriptive statistics were used to summarize the data of seed quality indices of maize samples from 2013 to 2018 (Table S2). Through the variation of the maximum, minimum, and mean value of 14 seed quality indices among different years, we found that the mean SGE, SGP, cold test germination percentage (CTGP), accelerated aging test germination percentage (AATGP), and FSE were on the rise. Additionally, the coefficients of variation of most seed quality indices were under 12.6%, except for flat compression yield stress, side compression yield stress, and column compression yield stress, with a relatively high coefficient of variation. This showed the data centralization of the various indices was good.

3.4. Principal Component Analysis of Seed Quality Indices from 2013 to 2018

In this paper, the factor analysis to estimate the loadings is performed by applying the method of principal component analysis. Based on the Kaiser–Meyer–Olkin (KMO) and Bartlett’s test, results indicated that the KMO measure of sampling adequacy and significance level of Bartlett’s test of sphericity of all the original data for each year were >0.6 and <0.05, respectively (Table S3). These showed that the degree of common variance among the variables each year was quite high; therefore, factor analysis could be conducted. Based on the output of communalities for maize seed quality indices from 2013 to 2018, we found that the communalities of variables of ”seed bulk density (2013)”, ”column compression yield stress (2015)”, ”column compression yield stress (2018)”, ”total starch content (2017)”, ”AATGP (2015)“, and ”AATGP (2016)“ were less than 0.5. The six variables had a lower portion of the variance that contributed to the common factors (Table 1). The communality is the sum of squares of the loadings of the variable. Therefore, the six variables can be taken out from the data set. In this study, two methods were used to decide the number of factors: i.e., the scree plot (Figure S1) and the total variance explained (Table 2 and Table S4). Based on the scree plots (Figure S1), five common factors can be extracted from the data of maize seed quality indices each year. Each year five principal components with eigen values more than 1 were extracted. The representation of the first five principal components is also shown in Table S6, in which the associations between maize seed quality indices can be seen. As listed in Table 2 and Table S4, principal component analysis led to a reduction of the initial dimension of the dataset to five components which explained 65.5% (2013), 70.3% (2014), 66.0% (2015), 63.9% (2016), 69.4% (2017), and 66.4% (2018) of the data variation. Each year, the first principal component that, with the high loadings, accounted for 25.0% (2013), 31.3% (2014), 27.2% (2015), 24.5% (2016), 28.8% (2017), and 31.0% (2018) of variance appeared to represent a ‘resembles the seed germination and field seedling emergence factor’. The second principal component explained 12.8% (2013), 13.6% (2014), 13.9% (2015), 13.0% (2016), 14.1% (2017), and 12.8% (2018) of variance, mainly appearing to represent a ‘resembles the seed physical characteristics factor’. Furthermore, the third group mainly appeared to represent a ‘resembles the seed chemical characteristics factor’ (Table 2, Tables S4 and S6). It was interesting that the seed quality indices of the annual first principal component were closely related to seed germination and seedling, and SGE, CTGP, and AATGP, which are seed vigor indices.

3.5. Cluster Analysis of Maize Seed Quality Indices from 2013 to 2018

In this study, we performed clustering analysis of maize seed quality indices from 2013 to 2018 with the system clustering method and summarized the key indices for seed quality evaluation. Based on the results of the hierarchical cluster analysis (Figure S2) and agglomeration schedule (Table S5) of maize seed quality indices from 2013 to 2018, we found that the 14 seed quality indices were combined at the different stages with the mean distances for combining the clusters (Table S5). Large coefficients or small coefficients in Table S5 indicated that a cluster was relatively heterogeneous and contained units which were considerably different from each other. Fourteen maize seed quality indices were divided into 7, 7, 6, 6, 4, and 6 groups from 2013 to 2018, respectively (Table 3). Each year, most of the indices of the first group were associated with seed germination and seedlings, which was consistent with the result of principal component analysis. Furthermore, the total starch content was grouped into the first group for most of the six years; this might be associated with the amylase activity, which could play an important role in promoting seed germination [34]. Besides this, the indices belonging to the second group were associated with seed hardness.

3.6. Correlation Analysis of Maize Seed Quality Indices

There were significant correlations for SGE (r = 0.650, 0.795, 0.674, 0.556, 0.730, and 0.382 from 2013 to 2018, respectively; p < 0.01), SGP (r = 0.551, 0.803, 0.621, 0.592, 0.677, and 0.819 from 2013 to 2018, respectively; p < 0.01), CTGP (r = 0.578, 0.798, 0.697, 0.695, 0.833, and 0.838 from 2013 to 2018, respectively; p < 0.01), and AATGP (r = 0.383, 0.585, 0.421, 0.430, 0.428, and 0.639 from 2013 to 2018, respectively; p < 0.01) with FSE (Table 4 and Table S7). Additionally, we found a positive correlation between the seed bulk density, flat compression yield stress, total starch content, and FSE, and for some years the correlation coefficients were significant or highly significant. Besides this, some other relationships were obtained as follows: (1) each year, the seed bulk density was highly positively correlated with flat compression yield stress (r = 0.311, 0.406, 0.449, 0.397, 0.555, and 0.330 from 2013 to 2018, respectively; p < 0.01); (2) the total starch content was negatively correlated with the crude protein content and positively correlated with the SGE, SGP, CTGP, AATGP from 2013 to 2018, and for some years the correlation coefficients were significant or highly significant; (3) the SGE, SGP, CTGP, and AATGP were positively or highly positively correlated with each other from 2013 to 2018. According to the correlation analysis, the results of seed quality indices of 30 maize varieties seeds hand pollinated (Table 4, Tables S1 and S8) have further proved the validity of these conclusions.

3.7. Variance Analysis of Maize Seed Quality Indices from 2013 to 2018

As shown in Table 5, data for maize seed quality indices from 2013 to 2018 were analyzed by one-way analysis of variance (ANOVA). Compared with 2013, the mean thousand-seed weight (TSW), seed bulk density (SBD), side compression yield stress (SCYS), total starch content (TSC), crude protein content (CPC), and crude fat content (CFC) in other years had no significant difference except the mean SBD (2015), SCYS (2016), TSC (2016), and CPC (2014). However, compared with 2013, the mean flat compression yield stress (FCYS), column compression yield stress (CCYS), seed moisture content (SMC), standard germination energy (SGE), standard germination percentage (SGP), cold test germination percentage (CTGP), accelerated aging test germination percentage (AATGP), and mean field seedling emergence (FSE) had significant differences (p < 0.05 or p < 0.01) except the mean FCYS (2015), CCYS (2014, 2018), SMC (2014), and SGP (2017). Additionally, the mean SGE, SGP, CTGP, AATGP, and FSE all tended to increase from 2013 to 2016. In particular, all five indices in 2018 reached significant differences (p < 0.01) compared with 2013 (Table 5).

3.8. Regression Analysis for Data of Maize Seed Quality Indices from 2013 to 2018

In this study, the indices of the first principal component represent a ‘resembles the seed germination and field seedling emergence factor’ and can be classified into the same cluster (Figure S2 and Table S5). It is important to use the regression analysis method to establish a model to predict FSE by using the first main component and other seed quality indices. The seed quality indices of the first principal component in each year from 2013 to 2018 are as follows: SGE, SGP, CTGP, FSE (2013 and 2017), and SGE, SGP, CTGP, AATGP, FSE (2014, 2015, 2016, and 2018). Different seed quality indices and FSE showed a more obvious linear trend or curve trend (Figure S3). Through curve estimation, the suitable model for each variable of FSE prediction in different years was determined. Linear curve, quadratic curve, and cubic curve regression models were used to estimate the curve, and the results showed that the fitting degree of the cubic curve model and quadratic curve model was significantly better than the linear model (Table S9). Taking SGE, SGP, and CTGP in 2013 as an example, the R2 values of the equation, quadratic and cubic model were higher than the linear model. The R2 value and F value of quadratic equations and cubic equations of SGE were the same. The models with good fitting degree are the quadratic curve model and the cubic curve model. Considering that the cubic curve model is more complex than the quadratic curve model, it is ideal to choose the quadratic curve model. According to the curve estimation, SGE, SGP, and FSE are suitable for the linear model, while CTGP and FSE are more suitable for the cubic curve model. The cubic curve function can be transformed into the quadratic curve function, the cube of CTGP can be introduced as a new independent variable, and the regression model of SGE, SGP, CTGP, SGE square, SGP square, CTGP square, CTGP cube, and FSE can be established by multivariate linear regression analysis, and the regression model for each index in 2013–2018 is shown in Tables S10 and S11.
In addition, we adopted SGE, SGP, and CTGP, three indices of data for six years, to build a mathematical model to predict FSE (Table S11, Figure 4), and the equation is given by
y = β0 + β1xSGE + β2xSGP+ β3xCTGP+ β4xSGE 2 + β5xSGP2 + β6xCTGP2 + β7xSGP3 + ε
where xSGE is SGE, xSGP is SGP, xCTGP is CTGP, y is FSE, ε is random error, and βi is the regression coefficient.
Obtaining a solution, the equation is given by:
y = −18.870 − 1.290xSGE + 1.055xSGP+ 1.447xCTGP+ 0.009xSGE 2 − 0.006xCTGP2 + 0.000xSGP3 + ε
where xSGE is SGE, xSGP is SGP, xCTGP is CTGP, y is FSE, ε is random error, and βi is the regression coefficient.
Equation (2) can be simplified to:
y = 1.447xCTGP + ε
The above all models can effectively predict FSE.

4. Discussion

Maize is a high-yielding crop used for food, feed, energy, and industrial materials. It is vital for global food security. Moreover, China is an important maize-producing country globally. Understanding the changes of maize seed quality in the main production areas of China in the past six years will be important for further improving the quality of China’s maize seeds, breeding high-vigor maize, and promoting the rapid development of modern agriculture.
From 2013 to 2018, we collected 1196 maize hybrid cultivar samples in the market from the NHNSS regions of China. We acquired the basic information of these samples, including the variety name, collecting location, packaging type, seed type, and package label information. Meanwhile, the seed quality tests were performed mainly according to the International Rules for Seed Testing made by the ISTA [16] and Rules for Agricultural Seed Testing [17]. In particular, the maize seed quality indices were performed for comparative analysis in different years, and the relationships between seed quality-related indices and FSE were investigated.
Some results attracted our attention. First, the sample packaging rate was only 84.8% in 2013, and it has been on the rise in recent years; for example, it was 97.4% in 2018. This is closely related to the application and implementation of the Seed Law of the People’s Republic of China [26] and the promotion of people’s seed quality consciousness. With the single seed sowing technology popularized and applied to maize, high-quality seeds are an important prerequisite for applying this technology to obtain high yield [35]. The sample coating rate, namely the percentage of samples with coated seed obviously increased from 2013 to 2018. Seed coating has been used widely in the production if many crops production. This may be due to its specialized functions to improve handling, protection, and, to a lesser extent, germination enhancement and plant establishment [36,37,38,39]. Packaging according to seed number has changed the unit of measurement of maize packaging, which mainly depends on the variety characteristics such as the number of plants in the unit area. The SRPASN climbed to 58.6% in 2018 from 24.5% in 2013. Wang et al. [14] concluded that the seed quality of samples packaged according to seed number was better than that of samples packaged according to seed weight, and multiple types of seed packaging number were related to the characteristics of maize varieties and the requirements of mechanization precision planting. Therefore, the increase in sample coating rate and SRPASN are important aspects that signify the improvement in maize seed quality in China.
Second, the mean standard germination percentage (SGP) increased from 91.8% in 2013 to 95.1% in 2018. However, the index slightly declined in 2017 compared with 2016. The main reason for this may be attributed to the excessive production capacity of maize in China in 2015 and/or 2016, which led to the samples with old seeds making up a high proportion of the total in 2017. Furthermore, the overproduction of maize seeds led to a large amount of seeds being in stock. Seeds stored for a long time will obviously age, which leads to decreased seed quality-related indices, such as seed vigor. According to the Seed Law of the People’s Republic of China, seeds stored for a long time can be sold on the market as long as the standard germination percentage is not lower than the national standard germination percentage (85%) [31]. It is noteworthy that seed vigor declines continuously during seed storage, and the degree of seed vigor decline is commonly associated with different maize varieties and seed high-vigor maintenance techniques. According to the quality standards for grain crop seeds in China (GB4404.1-2008) [27] and the Seed Law of the People’s Republic of China [26], maize samples seeds in different years of production also can be sold on the market as long as the standard germination percentage of these seeds is not less than 85%. For example, in 2017, many sample packaging bags were not marked with the production date; instead, the seed testing date or seed processing date was indicated. Therefore, the quality of seeds stored for a long time has already declined. How to effectively improve seed stand storage has become a great concern at the present stage of maize seed destocking in China.
Third, the sample qualification rate, namely the percentage of samples which met the prescribed quality standards continued to increase and even reached 98.4% in 2018. This finding reflects the increase in maize seed quality. However, compared with developed countries, there is still great room for the improvement and control of seed quality. We think there are two aspects of the problem that need to be solved: on the one hand, at present, there are only four indicators for evaluating seed quality in China, including varietal purity, seed purity, germination percentage, and seed moisture content, and there is no form of explanation or requirement for the indices of seed vigor; on the other hand, compared with seed companies in developed countries (e.g., DuPont Pioneer, which had an identifying germination percentage of ≥95% for maize seed production six years ago), the current national standard germination percentage of China is only 85%. Thus, it is necessary to raise the current standards of seed quality in China while adding the indices of seed vigor to meet the future challenge of maize seed quality. Based on the analysis of this research, we suggest increasing the GP of current national standards from 85% to 92%. Finally, there are more types of purity, clarity, standard germination percentage, moisture, seed packing number, and seed packing weight of the packaging label. This is because different varieties have different characteristics. More importantly, China has many seed companies and maize varieties. This may be due to the low entry threshold of China’s seed enterprises in the past (8700 companies in 2010, data from China Seed Congress 2019, Beijing, China), and this leads to seed production levels becoming uneven. Therefore, in the future, China will continuously raise the entry of threshold of seed enterprises, constantly improve the level of seed production and processing, and guarantee the production of high-quality seeds.
In addition, the 14 seed quality indices data of 100 maize samples per year were used for comparative analysis. Five principal typical components from 14 seed quality indices’ data each year were extracted by the principal component analysis. The top three components were ‘resembles the seed germination and field seedling emergence factor’, ‘resembles the seed physical characteristics factor’, and ‘resembles the seed chemical characteristics factor’, respectively. Among them, the first component that explained a 25.0% in 2013, 31.3% in 2014, 27.2% in 2015, 24.5% in 2016, 28.8% in 2017, and 31.0% in 2018 of the data variation received more attention (Table 2 and Table S4). In particular, the results of cluster analysis showed that the indices of the first principal component (resembles the seed germination and field seedling emergence factor) can be classified into the same cluster annually (Figure S2, Table S5).
It is of great significance to understand the relationship between different seed quality indices and FSE for seed quality control. In this research, based on the samples collected in the market from 2013 to 2018 and 30 samples of seeds from different hybrid varieties intercrossed by hand in 2018, we obtained the following main conclusions: (1) there were significantly correlations (p < 0.01) for standard germination energy (SGE), standard germination percentage (SGP), cold test germination percentage (CTGP) and accelerated aging test germination percentage (AATGP) with mean field seedling emergence (FSE). Among them, the cold test germination percentage and accelerated aging test germination percentage were the two most widely parameters of seed vigor [5]; In this study, the cold test was better than the accelerated aging test in predicting the field emergence rate (Table 5); (2) the variance analysis showed that these five indices in 2018 all reached significant differences (p < 0.01) compared with 2013 (Table 5). Moreover, SGE, SGP, CTGP, AATGP, and FSE had a very significant positive correlation (Table 4). Furthermore, we took SGE, SGP, CTGP, and AATGP as independent variables, FSE as a dependent variable, and carried out the multiple regression analysis each year (2013–2018) and for the total six years. According to the model parameters to evaluate the model fitting, we established the regression equations of each year, and the equation of six years, which was the appropriate regression model and could better predict the field seedling emergence (Figure 4 and Figure S3, Tables S9–S11); (3) there were significant correlations (p < 0.05 or p < 0.01) between seed bulk density, flat compression yield stress, and FSE. Zhang et al. [40] analyzed the correlation of the seed density, yield, and quality of maize seeds and concluded that to increase the seed bulk density of maize, the total starch content of maize seeds should be increased first. Related studies on seed hardness of crops have been reported [41,42]. Li et al. [43] isolated chromosome 5ra-specific genes responsible for seed hardness. Hardness is closely related to the mechanical properties of maize seeds during seed production and processing. The study demonstrated that flat compression yield stress, as one of the seed hardness indices, deserves to be further investigated; (4) starch metabolism plays an important role in seed germination and the vigor of crops [44]. Here, we found that total starch content was positively correlated with FSE (significantly correlated in some years, p < 0.05 or p < 0.01). Therefore, total starch content and related indices such as the activity of amylase activity can be used as a typical characteristic of high-vigor maize seeds; however, further studies are needed to confirm this.

5. Conclusions

In this study, a comparative analysis of seed quality indicators of 1196 hybrid maize seed samples from the main maize-producing areas in China from 2013 to 2018 was carried out. The results show that the maize seed quality in China has changed obviously in the past six years. This was mainly reflected by the following aspects: In 2013 and 2014, the percentage of samples with coated seed were 62.8% and 86.8%, respectively, and compared with them, the percentage increased obviously in 2015–2018, all exceeding 97%. The sample rate of packaging according to seed number was from 24.5% in 2013 to 58.6% in 2018, and the percentage of samples which met the prescribed quality standards continuously was 89.2% in 2013 to 98.4% in 2018. Based on the principal component analysis, the first principal component each year “resembles the seed germination and field seedling emergence factor”; taken together, mainly including standard germination energy (SGE), standard germination percentage (SGP), cold test germination percentage (CTGP), accelerated aging test germination percentage (AATGP), and mean field seedling emergence (FSE), and by cluster analysis, they could be divided into the same group. More importantly, the mean SGE, SGP, CTGP, AATGP, and FSE in other years were higher than in 2013 and reached significant differences (p < 0.05 or p < 0.01), except the mean SGP (2017). Furthermore, SGE, SGP, CTGP, and AATGP were used to establish the field emergence rate prediction models of each year (2013–2018) and SGE, SGP, and CTGP were selected to establish the field seedling emergence prediction models for the total six years. In addition, a series of important results were also obtained, which need to be further studied; the seed bulk density, total starch content, and flat compression yield stress were closely correlated with seed vigor. This study provided a theoretical basis and data support to better understand the changes of maize quality in China over the past six years and offered an important reference to further improve the maize seed quality in the future.

Supplementary Materials

The following are available online at https://www.mdpi.com/2073-4395/9/10/625/s1, Figure S1: Principal component analysis (the scree plot method) of maize seed quality indices from 2013 to 2018. Figure S2: Hierarchical cluster analysis of maize seed quality indices from 2013 to 2018. Figure S3: Curve estimation of SGE, SGP, CTGP with FSE. Table S1: 30 maize varieties’ parents. Table S2: Seed quality indices characteristics of maize samples from 2013 to 2018. Table S3: KMO and Bartlett’s test. Table S4: Total variance explained for data of maize seed quality indices from 2013 to 2018. Table S5: Agglomeration schedule of maize seed quality indices from 2013 to 2018. Table S6: Rotated component matrix for data of maize seed quality indices from 2013 to 2018. Table S7: Correlations between maize seed quality indices from 2013 to 2018. Table S8: Correlations between maize seed quality indices using 30 maize varieties of seed samples. Table S9: Model summary and parameter estimates of SGE, SGP, CTGP, AATGP with FSE from 2013 to 2018. Table S10: Model coefficients of curve estimation between SGE, SGP, CTGP, AATGP with FSE from 2013 to 2018. Table S11: Model establishment and solution from 2013 to 2018.

Author Contributions

H.L. and H.Y. were responsible for data analyses and writing the manuscript. H.L., H.Y., L.L., C.S., X.Z., J.L. and Z.Y. contributed to experimental work. J.W., G.Z. and X.S. participated in experimental design and provided important research assistance to this study. X.J. was responsible for the experimental design and reviewing final manuscript.

Funding

This research was supported by the National Natural Science Foundation of China (31601386), Special Fund for Agro-scientific Research in the Public Interest (201303002), National Key Research and Development Program of China (2017YFD0701203), National System (Maize) of Modern Industrial Technology (nycytx-02), Shandong Key Research and Development Plan (Public Welfare) Special Project (2017GNC11103), A Project of Shandong Province Higher Educational Science and Technology Program (J18KA121).

Acknowledgments

We thank student volunteers: Wenjian Zhang, Xiaokun Wang, Jiabin Chen, Fei Peng, Juan Liu, Fang Tian, Mingzhu Jiang, Wenchao Liu, Yuanyuan Liu, Wendi Sun, Xiaoxiao Suo, Lizhen Zhang, Min Wang, Xiaoying Yang, Xiaojuan Cui, Yujie Wei, Dong Wang, Wanjiang Sun, Shuaiqiang Guo, Xinkang Feng, Kaili Zhu, Xueying Xin, Xin Du, Meijuan Wang, Han Zhang, Xiaojing Lan, Xingxing Wang, Xingmeng Zhang, Xiaohui Wu, Wenwen Wang, CunBao Zhao, Zhen Wang, Yu Liu. They have been done a lot of research work on the maize seed quality investigation in China.

Conflicts of Interest

The authors declare no conflict of interest.

Abbreviations

AATGPaccelerated aging test germination percentage
CCYScolumn compression yield stress
CFCcrude fat content
CPCcrude protein content
CTGPcold test germination percentage
FCYSflat compression yield stress
FSEmean field seedling emergence
PDRpest damage rate
SBDseed bulk density
SBRseed breakage rate
SCRsample coating rate, namely the percentage of samples with coated seed
SCYSside compression yield stress
SGEstandard germination energy
SGPstandard germination percentage
SMCseed moisture content
SPseed purity
SPRsample packaging rate
SRPASNsample rate of packaging according to seed number
SRPASWsample rate of packaging according to seed weight
TSCtotal starch content
TSWthousand-seed weight
VPvarietal purity

References

  1. Chen, Y.L.; Xiao, C.X.; Wu, D.L.; Xia, T.T.; Chen, Q.W.; Chen, F.J.; Yuan, L.X.; Mi, G.H. Effects of nitrogen application rate on grain yield and grain nitrogen concentration in two maize hybrids with contrasting nitrogen remobilization efficiency. Eur. J. Agron. 2015, 62, 79–89. [Google Scholar] [CrossRef]
  2. Li, A.L.; Ma, Y.G.; Yang, M.K.; Zhang, Y.; Ma, X.L. Effects of different harvest time on seed vigor of maize hybrid Qidan 1. Shandong Agric. Sci. 2014, 46, 34–37. [Google Scholar]
  3. Rajjou, L.; Debeaujon, I. Seed longevity: Survival and maintenance of high germination ability of dry seeds. C. R. Biol. 2008, 331, 796–805. [Google Scholar] [CrossRef] [PubMed]
  4. Rajjou, L.; Duval, M.; Gallardo, K.; Catusse, J.; Bally, J.; Job, C.; Job, D. Seed germination and vigor. Annu. Rev. Plant Biol. 2012, 63, 507–533. [Google Scholar] [CrossRef] [PubMed]
  5. Marcos-Filho, J. Seed vigor testing: An overview of the past, present and future perspective. Sci. Agric. 2015, 72, 363–374. [Google Scholar] [CrossRef]
  6. Gu, R.L.; Li, L.; Liang, X.L.; Wang, Y.B.; Fan, T.L.; Wang, Y.; Wang, J.H. The ideal harvest time for seeds of hybrid maize (Zea mays L.) XY335 and ZD958 produced in multiple environments. Sci. Rep. 2017, 7, 17537. [Google Scholar] [CrossRef] [PubMed]
  7. Wang, M.M.; Qu, H.B.; Zhang, H.D.; Liu, S.; Li, Y.; Zhang, C.Q. Hormone and RNA-seq analyses reveal the mechanisms underlying differences in seed vigour at different maize ear positions. Plant Mol. Biol. 2019, 99, 461–476. [Google Scholar] [CrossRef]
  8. Han, Z.P.; Ku, L.X.; Zhang, Z.Z.; Zhang, J.; Guo, S.L.; Liu, H.Y.; Zhao, R.F.; Ren, Z.Z.; Zhang, L.K.; Su, H.H.; et al. QTLs for seed vigor-related traits identified in maize seeds germinated under artificial aging conditions. PLoS ONE 2014, 9, e92535. [Google Scholar] [CrossRef]
  9. Revilla, P.; Butron, A.; Rodriguez, V.M.; Malvar, R.A.; Ordas, A. Identification of genes related to germination in aged maize seed by screening natural variability. J. Exp. Bot. 2009, 60, 4151–4157. [Google Scholar] [CrossRef]
  10. Li, T.; Zhang, Y.M.; Wang, D.; Liu, Y.; Dirk, L.M.A.; Goodman, J.; Downie, A.B.; Wang, J.M.; Wang, G.Y.; Zhao, T.Y. Regulation of seed vigor by manipulation of raffinose family oligosaccharides (RFOs) in maize and Arabidopsis. Mol. Plant 2017, 10, 1540. [Google Scholar] [CrossRef]
  11. Jiang, X.W.; Tian, B.H.; Zhang, W.M.; Wang, G.Y.; Wang, J.H. QTL mapping of coleorhiza length in maize (Zea mays L.) under two germination environmental conditions. Plant Breed. 2011, 130, 625–632. [Google Scholar] [CrossRef]
  12. Li, X.H.; Wang, G.H.; Fu, J.J.; Li, L.; Jia, G.Y.; Ren, L.S.; Lubberstedt, T.; Wang, G.Y.; Wang, J.H.; Gu, R.L. QTL mapping in three connected populations reveals a set of consensus genomic regions for low temperature germination ability in Zea mays L. Front. Plant Sci. 2018, 9, 1–11. [Google Scholar] [CrossRef] [PubMed]
  13. Zhang, W.J.; Li, H.Q.; Jiang, X.W. The investigation and analysis of the results of farmers to realize the seed quality of maize in Shandong province. J. Anhui. Agric. Sci. 2014, 42, 8795–8796. [Google Scholar]
  14. Wang, X.K.; Li, H.Q.; Jiang, X.W.; Wang, J.H. Analysis and proposals for commercial hybrid maize seed quality in shandong province. Shandong Agric. Sci. 2015, 47, 33–35. [Google Scholar] [CrossRef]
  15. Chinese Academy of Agricultural Sciences. Territorial Crop Conformation; China Agricultural Press: Beijing, China, 1984. [Google Scholar]
  16. ISTA. International Rules for Seed Testing; International Seed Testing Association: Bassersdorf, Switzerland, 2019. [Google Scholar]
  17. Standardization Administration. Rules for Agricultural Seed Testing; Standards Press of China: Beijing, China, 1995. [Google Scholar]
  18. Ma, Q.; Wang, Y.; Guo, H.; Zhu, D.H.; Liu, Z.; Zhang, X.D.; Li, S.M. High-throughput maize grain type identification system based on sparse representation algorithm. Trans. Chin. Soc. Agric. Eng. 2017, S1, 219–224. [Google Scholar] [CrossRef]
  19. Liu, H.B.; Zhang, W.M.; Gao, C.H.; Yao, D.N.; Zhang, C.Q.; Hu, J. Effect of different grading of grain on maize seed vigor and plant growth. Seed 2013, 32, 26–32. [Google Scholar] [CrossRef]
  20. ISTA. Handbook on Moisture Determination; International Seed Testing Association: Bassersdorf, Switzerland, 2007. [Google Scholar]
  21. Zeng, F.K.; Zhao, X.; Zhou, T.H.; Liu, G. Dual-wavelength colorimetric method for measuring amylose and amylopectin contents of potato starch. Mod. Food Sci. Technol. 2012, 28, 119–122. [Google Scholar] [CrossRef]
  22. Kjeldahl, J. A new method for the determination of nitrogen in organic matter. Z. Anal. Chem. 1883, 22, 366. [Google Scholar] [CrossRef]
  23. Yang, X.S.; Wang, L.L.; Zhou, X.R.; Shuang, S.M.; Zhu, Z.H.; Li, N.; Li, Y.; Liu, F.; Liu, S.C.; Lu, P.; et al. Determination of protein, fat, starch, and amino acids in foxtail millet [Setaria italica (L.) Beauv.] by fourier transform near-infrared reflectance spectroscopy. Food Sci. Biotechnol. 2013, 22, 1495–1500. [Google Scholar] [CrossRef]
  24. Yin, Y.P.; Dong, X.H. The Experimental Technology of Seed Science; China Agriculture Press: Beijing, China, 2015. [Google Scholar]
  25. Jiang, X.W.; Li, H.Q.; Wei, Y.J.; Song, X.Y.; Wang, J.H. Seed biomechanical monitoring: A new method to test maize (Zea mays) seed vigour. Seed Sci. Technol. 2016, 44, 382–392. [Google Scholar] [CrossRef]
  26. The National People’s Congress. The Seed Law of The People’s Republic of China; China Legal Publishing House: Beijing, China, 2016. [Google Scholar]
  27. Standardization Administration. GB/T4404.1-2008, Seed of Food Crops—Part 1: Cereals; Standards Press of China: Beijing, China, 2008. [Google Scholar]
  28. ISTA. Handbook of Seed Vigour Test Methods; International Seed Testing Association: Bassersdorf, Switzerland, 1995. [Google Scholar]
  29. Zhao, G.W.; Zhong, T.L.; Ying, Y.Q. The Modern Seed and Seedling Lab Manual; China Agriculture Press: Beijing, China, 2015. [Google Scholar]
  30. Wang, J.H. Seed Quality Testing and Evaluation Manual of Corn (Zea mays); China Agricultural University Press: Beijing, China, 2016. [Google Scholar]
  31. Matthews, S.; Wagner, M.H.; El-Khadem, R.; Casarini, E.; Khajeh-Hosseini, M.; Nasehzadeh, M. Rate of physiological germination compared with the cold test and accelerated ageing as a repeatable vigour test for maize. Seed Sci. Technol. 2010, 38, 379–389. [Google Scholar] [CrossRef]
  32. SAS Institute. SAS Procedures Guide; Version 6; SAS/STAT Institute, Inc.: Cary, NC, USA, 1999. [Google Scholar]
  33. Zhang, W.M.; Jiang, X.W.; Wang, Y.; Liu, X.Y.; Duan, X.Y.; Han, W.T.; Wang, J.H. Investigation report on seed production in Jiuquan region of Gansu province. China Seed Ind. 2011, 6, 32–34. [Google Scholar] [CrossRef]
  34. Zhang, X.W.; Wang, S.E.; Shao, X.Y.; Guo, S.Q.; Li, H.Q.; Wang, J.H.; Song, X.Y.; Jiang, X.W. Maize seed quality of main producing region in China. J. Maize Sci. 2017, 25, 42–50. [Google Scholar] [CrossRef]
  35. Zhao, L.; Han, Z.; Yang, J.; Qi, H. Single seed precise sowing of maize using computer simulation. PLoS ONE 2018, 13, e0193750. [Google Scholar] [CrossRef] [PubMed]
  36. Scott, J.M. Seed coatings and treatments and their effects on plant establishment. Adv. Agron. 1989, 42, 43–83. [Google Scholar] [CrossRef]
  37. Copeland, L.O.; McDonald, M.B. Principles of Seed Science and Technology, 3rd ed.; Chapman and Hall: New York, NY, USA, 1995. [Google Scholar]
  38. Hara, Y. Comparison of the effects of seed coating with tungsten and molybdenum compounds on seedling establishment rates of rice, wheat, barley, and soybean under flooded conditions. Plant Prod. Sci. 2017, 20, 406–411. [Google Scholar] [CrossRef] [Green Version]
  39. Pedrini, S.; Merritt, D.J.; Stevens, J.; Dixon, K. Seed coating: Science or marketing spin? Trends Plant Sci. 2017, 22, 106–116. [Google Scholar] [CrossRef]
  40. Zhang, L.; Dong, S.T.; Liu, C.H.; Wang, K.J.; Zhang, J.W.; Liu, P. Correlation analysis on maize test weight, yield and quality. Sci. Agric. Sin. 2007, 40, 405–411. [Google Scholar]
  41. Gasparis, S.; Orczyk, W.; Zalewski, W.; Nadolska-Orczyk, A. The RNA-mediated silencing of one of the Pin genes in allohexaploid wheat simultaneously decreases the expression of the other, and increases grain hardness. J. Exp. Bot. 2011, 62, 4025–4036. [Google Scholar] [CrossRef] [Green Version]
  42. Arena, S.; D’Ambrosio, C.; Vitale, M.; Mazzeo, F.; Mamone, G.; Stasio, L.D.; Maccaferri, M.; Curci, P.L.; Sonnante, G.; Zambrano, N.; et al. Differential representation of albumins and globulins during grain development in durum wheat and its possible functional consequences. J. Proteomics 2017, 162, 86–98. [Google Scholar] [CrossRef]
  43. Li, G.R.; Gao, D.; La, S.X.; Wang, H.J.; Li, J.B.; He, W.L.; Yang, E.N.; Yang, Z.J. Characterization of wheat-Secale africanum chromosome 5Ra derivatives carrying Secale specific genes for grain hardness. Planta 2016, 243, 1203–1212. [Google Scholar] [CrossRef] [PubMed]
  44. Styer, R.C.; Cantliffe, D.J. Dependence of seed vigor during germination on carbohydrate source in endosperm mutants of maize. Plant Physiol. 1984, 76, 196–200. [Google Scholar] [CrossRef] [PubMed]
Figure 1. Overview of sample collection. (A) The main distribution of samples with four types in different provinces of north, Huanghuai, northwest, southwest, and south China (NHNSS). (B) The sample number collected from the provinces of NHNSS from 2013 to 2018.
Agronomy 09 00625 g001
Figure 2. Survey results for sample coating, packaging, packet identification, and related information. (A) Comparative analysis of sample coating rate (SCR, namely the percentage of samples with coated seed), sample packaging rate (SPR), sample rate of packaging according to seed number (SRPASN), and sample rate of packaging according to seed weight (SRPASW) from 2013 to 2018. (B) Survey analysis of the types of seed purity, varietal purity, standard germination percentage (SGP), seed moisture content, seed packaging number, and seed packaging weight of the packing label. (C) The main locations for maize seed production in NHNSS. Note: a, number of coating samples/number of total samples; b, number of packaging samples/number of total samples; c, number of packaging according to seed number samples/number of total packaging samples; d, number of packaging according to seed weight samples/number of total packaging samples. NHNSS, north, Huanghuai, northwest, southwest and south China.
Agronomy 09 00625 g002
Figure 3. Comparison analysis of mean values of varietal purity (VP), seed purity (SP), standard germination energy (SGE), standard germination percentage (SGP), seed moisture content (SMC), seed breakage rate (SBR), pest damage rate (PDR) (A), and sample qualification rate (namely the percentage of samples which met the prescribed quality standards) (B) from 2013 to 2018. a The annual numbers of samples; from 2013 to 2018, the annual numbers of samples were 164, 266, 206, 198, 171 and 191, respectively.
Agronomy 09 00625 g003
Figure 4. Model establishment and solution. Note: SGE—standard germination energy; SGP—standard germination percentage; CTGP—cold test germination percentage; AATGP—accelerated aging test germination percentage; FSE—mean field seedling emergence. xSGE is SGE, xSGP is SGP, xCTGP is CTGP, y is FSE, ε is random error, βi is regression coefficient.
Agronomy 09 00625 g004
Table 1. Communalities for data of maize seed quality indices from 2013 to 2018.
IndicesInitialExtraction
201320142015201620172018
TSW1.0000.6860.7860.7750.5400.5690.638
SBD1.0000.3790.7360.6120.6390.7430.659
FCYS1.0000.7230.7060.6300.5650.6390.676
SCYS1.0000.6240.5820.6400.5250.6530.663
CCYS1.0000.6380.5880.4340.5270.6860.416
SMC1.0000.8510.5630.7980.5070.7470.743
TSC1.0000.5530.5750.6320.6270.4670.584
CPC1.0000.6140.6280.7110.5830.7200.662
CFC1.0000.6970.7320.5780.8460.7380.602
SGE1.0000.7600.8610.7840.8090.7900.841
SGP1.0000.7760.8440.7500.8310.7800.840
CTGP1.0000.5690.8110.7440.7480.8440.872
AATGP1.0000.6350.5940.4260.4130.5240.614
FSE1.0000.6600.8380.7280.7800.8090.866
Note: TSW—thousand-seed weight; SBD—seed bulk density; FCYS—flat compression yield stress; SCYS—side compression yield stress; CCYS—column compression yield stress; SMC—seed moisture content; TSC—total starch content; CPC—crude protein content; CFC—crude fat content; SGE—standard germination energy; SGP—standard germination percentage; CTGP—cold test germination percentage; AATGP—accelerated aging test germination percentage; FSE—mean field seedling emergence. Extraction method is principal component analysis.
Table 2. Variance of five components explained for the data of maize seed quality indices from 2013 to 2018.
ComponentInitial EigenvaluesInitial Eigenvalues
Total% of VarianceCumulative %Total% of VarianceCumulative %
20132014
13.49924.99124.9914.38731.33531.335
21.78612.76037.7511.89813.55844.894
31.45410.38948.141.3419.57654.469
41.3179.40557.5451.1258.03362.503
51.1087.91265.4571.0937.81070.313
20152016
13.80427.17127.1713.43324.52024.520
21.94613.89841.0691.82413.02937.549
31.40810.05951.1271.49810.69748.246
41.0677.61958.7461.1218.00956.255
51.0187.27066.0161.0647.60163.856
20172018
14.03028.78728.7874.33930.99230.992
21.97214.08842.8751.79112.79343.786
31.49610.68753.5621.3249.45453.24
41.1177.97861.5411.1528.22661.467
51.0957.82069.3611.0697.63769.103
Note: Extraction method is principal component analysis. Five components have been extracted.
Table 3. Cluster analysis of maize seed quality indices from 2013 to 2018.
YearGroupIndices
20131SGESGPFSECTGPAATGPTSC
2SBD
3TSW
4SMC
5FCYSSCYS
6CCYSCFC
7CPC
20141SGESGPFSECTGPAATGPTSC
2SBDFCYS
3CFC
4SCYSCCYS
5SMC
6TSW
7CPC
20151SGESGPCTGPFSEAATGPTSC
2FCYSSCYSSBD
3TSW
4CCYSCFC
5CPC
6SMC
20161SGESGPCTGPFSEAATGPTSC
2SBDFCYSSCYS
3TSW
4SMC
5CCYSCFC
6CPC
20171CTGPFSESGESGPTSCAATGP
2SBDFCYSSCYSTSW
3CCYSCFCCPC
4SMC
20181SGPFSECTGPSGEAATGP
2FCYSSCYSCCYSTSC
3CPC
4TSWCFC
5SMCSBD
Note: TSW—thousand-seed weight; SBD—seed bulk density; FCYS—flat compression yield stress; SCYS—side compression yield stress; CCYS—column compression yield stress; SMC—seed moisture content; TSC—total starch content; CPC—crude protein content; CFC—crude fat content; SGE—standard germination energy; SGP—standard germination percentage; CTGP—cold test germination percentage; AATGP—accelerated aging test germination percentage; FSE—mean field seedling emergence. Component 1 represents a ‘resembles the seed germination and field seedling emergence factor’.
Table 4. Relationships between seed physical and chemical indices, seed germination indices, and mean field seedling emergence (FSE).
YearTSWSBDFCYSSCYSCCYSSMCTSCCPCCFCSGESGPCTGPAATGP
20130.1820.1870.046−0.041−0.124−0.0540.382 **−0.0130.0130.650 **0.551 **0.578 **0.383 **
20140.0550.352 **0.170−0.006−0.063−0.0350.354 **0.150.242 *0.795 **0.803 **0.798 **0.585 **
20150.0230.280 **0.1320.159−0.109−0.0510.228 *0.0540.0660.674 **0.621 **0.697 **0.421 **
20160.1070.249 *0.1630.1790.0100.0100.189−0.0380.215 *0.556 **0.592 **0.695 **0.430 **
20170.1030.224 *0.313 **0.0230.008−0.0220.487 **−0.016−0.0770.730 **0.677 **0.833 **0.428 **
20180.1120.236 *0.226 *0.2390.072−0.0030.1300.0830.0000.382 **0.819 **0.838 **0.639 **
30 varieties0.1510.471 **0.472 *0.2770.151−0.2110.267−0.162−0.1930.789 **0.633 **0.778 **0.725 **
Note: * means significant at 0.05 level; ** means significant at 0.01 level. TSW—thousand-seed weight; SBD—seed bulk density; FCYS—flat compression yield stress; SCYS—side compression yield stress; CCYS—column compression yield stress; SMC—seed moisture content; TSC—total starch content; CPC—crude protein content; CFC—crude fat content; SGE—standard germination energy; SGP—standard germination percentage; CTGP—cold test germination percentage; AATGP—accelerated aging test germination percentage.
Table 5. Variance analysis for data of maize seed quality indices from 2013 to 2018.
Indices201320142015201620172018
Mean TSW (g)334.8 abAB334.0 abAB337.9 aAB327.6 bB334.9 abAB339.6 aA
Mean SBD (g/L)736.8 bB739.8 abAB744.9 aA739.6 abAB738.5 bAB742.0 abAB
Mean FCYS (KN)2.6 cB2.8 aAB2.6 bcB2.7 abAB2.7 abAB2.8 aA
Mean SCYS (KN)1.6 bA1.6 abA1.6 bA1.7 aA1.6 abA1.7 abA
Mean CCYS (KN)0.8 bB0.8 abAB0.9 aAB0.9 aAB0.9 aA0.9 abAB
Mean SMC (%)11.3 (3) aA11.2 (8) abAB11.2 (5) bB11.2 (6) bAB11.2 (6) bAB11.2 (5) bB
Mean TSC (%)72.5 aA72.7 aA72.5 abA71.8 bA72.1 abA72.4 abA
Mean CPC (%)9.9 aAB9.7 bB9.8 abAB9.8 abAB10.0 aA9.9 abAB
Mean CFC (%)4.2 aA4.2 aA4.2 aA4.2 aA4.2 aA4.2 aA
Mean SGE (%)88.8 dE90.4 cD92.6 bBC94.3 aA91.1 cCD93.5 abAB
Mean SGP (%)92.4 dB93.4 cB95.2 bA96.4 aA93.1 cdB96.0 abA
Mean CTGP (%)85.8 dC88.6 cB89.8 bB91.7 aA91.7 aA92.2 aA
Mean AATGP (%)79.6 cB83.0 bA83.9 abA84.7 abA82.6 bAB85.5 aA
Mean FSE (%)85.7 dD89.3 bcBC89.6 bcBC90.4 abAB88.7 cC91.2 aA
Note: Values followed by different lower-case letters within same row indicate significant differences at p < 0.05; Values followed by different capital letters within same row indicate significant differences at p < 0.01 level. TSW—thousand-seed weight; SBD—seed bulk density; FCYS—flat compression yield stress; SCYS—side compression yield stress; CCYS—column compression yield stress; SMC—seed moisture content; TSC—total starch content; CPC—crude protein content; CFC—crude fat content; SGE—standard germination energy; SGP—standard germination percentage; CTGP—cold test germination percentage; AATGP—accelerated aging test germination percentage; FSE—mean field seedling emergence.

