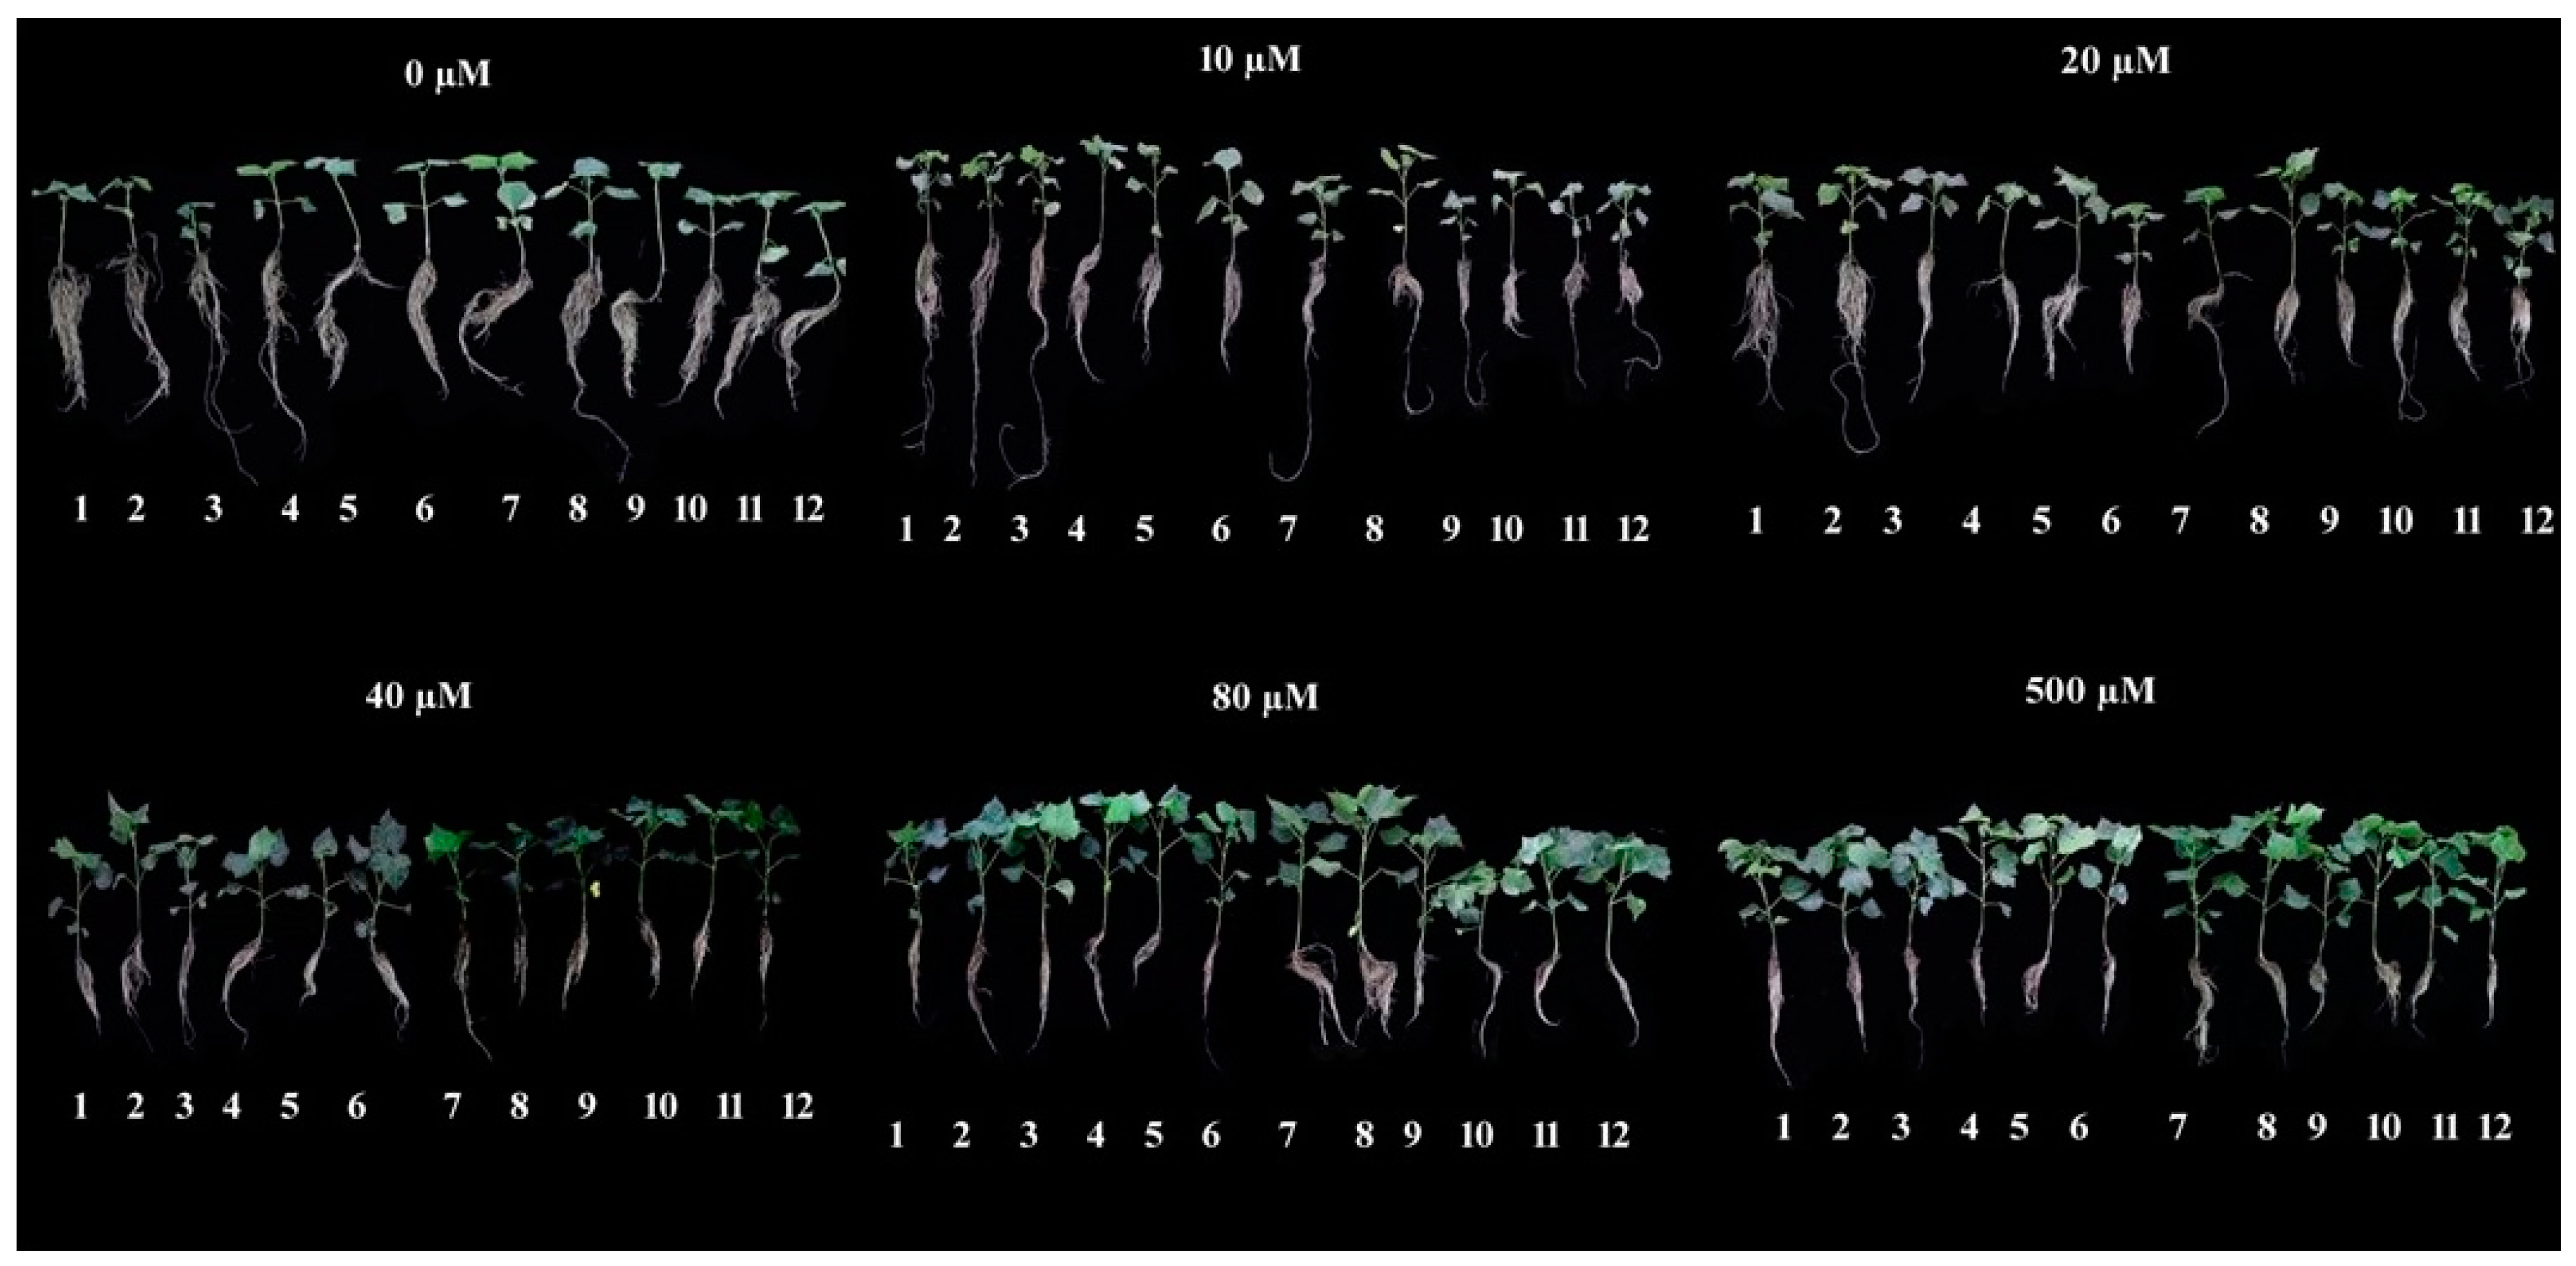
Article

Genotypic Variation in Cotton Genotypes for Phosphorus-Use Efficiency

State Key Laboratory of Cotton Biology, Institute of Cotton Research of Chinese Academy of Agricultural Sciences, Anyang 455000, China
*
Authors to whom correspondence should be addressed.
Agronomy 2019, 9(11), 689; https://doi.org/10.3390/agronomy9110689
Submission received: 11 September 2019 / Revised: 24 October 2019 / Accepted: 25 October 2019 / Published: 28 October 2019

Abstract

:
Low phosphorus (P) availability is a major constraint for cotton production. Consequently, P-efficient genotypes can improve productivity under conditions where the higher application of P is not economical. This study was conducted to characterize cotton genotypes for P-use efficiency under various P concentrations (0, 10, 20, 40, 80, and 500 μM KH2PO4). The results showed large genotypic variation in five selected traits, such as root dry weight, shoot dry weight, photosynthetic activity, P-utilization efficiency, and P-uptake efficiency. Based on these five selected traits, the genotypes were grouped into three main classes as efficient, moderate efficient, and inefficient genotypes as proposed by different researchers. Most of the genotypes behaved in a similar pattern under different P concentrations. Among the genotypes, Xinluzao-49 and Xinluzao-48 were considered as P efficient while CCRI-64 and Yumian-21 as inefficient genotypes. However, the rest of the genotypes were considered as moderately P efficient. The results prove that a large genetic potential exists in cotton genotypes for P-use efficiency, and the use of P-efficient genotypes for cultivation will reduce the application of phosphatic fertilizers. Furthermore, the use of P-efficient genotypes will improve cotton breeding activities and help in improving the environmental sustainability of cotton production.

1. Introduction

Cotton is an important fiber crop grown worldwide [1] in arid and semi-arid regions [2]. However, arid and semi-arid regions face major issues, including low nutrient availability, especially nutrients with low diffusion coefficients, such as phosphorus (P) [3]. P deficiency in cotton causes slow shoot development, dark green leaves, flower bud necrosis, and the yellowing of older leaves. Low P availability may also directly affect flower bud development, decrease the absorption of nitrogen and magnesium, and finally inhibit plant growth [4]. In contrast, limited availability of P triggers various physiological adaptive responses, such as increased root surface area and density, which helps in P uptake [5]. The variability in these responses indicates that cultivars having a greater capacity to grow in soils with low P availability could offer an alternative to P fertilizers [6]. A huge difference still exists between crop potential and actual production under unfavorable conditions, like P deficiency [7]. The basic knowledge about the morphology, physiology, biochemical, and molecular mechanisms is essential to develop and screen P-efficient cotton genotypes. Before proceeding to know the molecular mechanism about P-use efficiency, it is very important to know different morphological and physiological traits contributing to P-use efficiency. Moreover, identification and development of P-efficient cotton genotypes coupled with good management practices are pivotal for the sustainability of cotton production.
Phosphorus (P) is one of the most limiting factors in crop production [8]. Throughout the world, about 40% (5.7 billion ha) of cultivated land is P deficient [9]. Besides this, 80% of the applied P fertilizer becomes unavailable for plants [9] due to its fixation with oxides and hydroxides of iron and aluminum in acidic soils [10] and with calcium in alkaline soils [11]. Therefore, chemical P fertilizers are used to overcome this deficiency, but immobilization and runoff make it unavailable for successful crop production [12]. Besides, this injudicious use of P fertilizers leads to environmental pollution and increases the cost of production [13]. Moreover, the naturally available reservoirs of rock phosphate are depleting day by day due to its overuse and prices are rising as the resource becomes scarcer [14]. Therefore, adoption and invention of new strategies of P fertilizer management and breeding for higher P-use efficiency are the utmost need of modern crop production [15]. Several researchers have already reported that breeding for genotypes with high P-uptake efficiency is the best approach under P-deficient soils [16] while genotypes with high P-utilization efficiency will produce more dry matter per unit of P consumption [17].
P-use efficiency is comprised of two major components, i.e., P uptake and utilization efficiency. P-uptake efficiency is the capacity of plants to uptake P from the soils while how efficiently the plants utilize the absorbed P is utilization efficiency [18]. The P-use efficiency among cotton genotypes varies with traits and the method of screening. Therefore, different scientists have proposed different criteria of screening genotypes for P-use efficiency under P-deficient conditions, such as total P uptake [19], dry matter produced per unit of P applied [20], and the ratio of physiologically active P to total P uptake [21]. Besides this, care should be taken in comparing the genetic and physiological components to measure P efficiency, as different methods may lead to different P efficiency under the same condition [18]. Some researchers have focused on the importance of root architecture for P efficiency under deficient P conditions [19,22]. However, both root and shoot should be taken into account for studying P efficiency under low P conditions as roots help in P acquisition and shoots in P utilization [18]. Many researchers have found that an extensive root system under low P conditions could enable the plant to improve root volume to explore and uptake more P [17,23,24]. Similarly, root size was also found to be important for P acquisition followed by root dry weight [23]. Moreover, root vigor and [24] leaf photosynthetic activity also have beneficial roles in P acquisition [25].
The basic knowledge of different traits associated with P-use efficiency is important for the identification and classification of P-efficient cotton genotypes. Taking into consideration the constraints described above and the lack of information on genotypic variation of phosphorus use efficiency (PUE) in cotton, the aims of this study were (1) to evaluate the genotype variability for PUE in cotton genotypes under various P concentrations, and (2) to determine the relationships that exist between plant characteristics and PUE to facilitate the identification and choice of P-efficient genotypes.

2. Materials and Methods

2.1. Plant Material and Growth Conditions

The current study was designed to know the P-efficient cotton genotypes and the most important traits contributing to PUE. Twelve cotton genotypes (TM-1, Yumian-21, CCRI-64, CCRI-27, Xinluzhong-17, Xinluzao-35, Xinluzao-48, Xinluzao-49, Xinluzhong-12, Xinluzhong-15, Xinluzao-20, and CCRI-12) were characterized for different morphological and physiological traits under various P concentrations (0, 10, 20, 40, 80, and 500 µM KH2PO4) in hydroponic culture. The experiment was set up in the growth chamber at the Cotton Research Institute of Chinese Academy of Agricultural Sciences, Anyang, China. The genotypes were sown in a mixture of sand and vermiculate for one week in a germinator. After the full opening of two cotyledons, four seedlings of each genotype with uniform height were selected and transplanted into 7-L containers in the growth chamber (16/8 h light/dark cycle, 28 °C temperature, 60% relative humidity). After transplanting, the seedlings were supplied with half-strength during the first week, followed by full-strength Hoagland solution (2 mM Ca(NO3)2, 2 mM KCL, 2 mM MgSO4, 0.1 mM EDTA·Fe·Na, 46.2 uM H3BO3, 9.1 uM MnCl2·4H2O, 0.8 uM ZnSO4·7H2O, 0.3 uM CuSO4·5H2O, 1.0 uM (NH4)6Mo7O24·4H2O)). At the two-true-leaves stage, seedlings were exposed to various P concentrations (0, 10, 20, 40, 80, and 500 µM KH2PO4). The solutions were replaced on a weekly basis and aerated with an electric pump. After cultivation for four weeks, various morphological and physiological characteristics were measured.

2.2. Shoot and Root Morphology

Data on shoot length (cm) were measured by a ruler by randomly taking four plants in each replication, and then averaging them to determine shoot length. Similarly, the lengths and widths of each leaf were measured, and the mean single leaf area was obtained from the product of the length, width, and correction factor (0.75). After four weeks, the plants were harvested and dried at 105 °C for 1 h followed by 80 °C for 48 h. Part of the root system was excised from each plant and then scanned and analyzed by using WinRHIZO root analyzer system (WinRHIZO version 2007b, Regent Instruments Canada, Montreal, QC, Canada). The shoot, root, and total dry weight were measured using an electronic balance.

2.3. Leaf Photosynthetic Traits and SPAD Value

The photosynthetic characteristics (i.e., photosynthetic assimilation rate (A), stomatal conductance (gs), intercellular CO2 concentration (Ci), and transpiration rate (E)) of the third fully expanded leaves of six selected plants were measured using a portable photosynthesis system (Li-Cor-6800; Li-Cor, Inc., Lincoln, NE, USA) from 9:00 to 11:00 a.m. in the growth chamber. The relative chlorophyll content was measured with a portable chlorophyll meter (SPAD 502 Meter, Minolta Corporation, Tokyo, Japan).

2.4. Phosphorus-Use Efficiency Indexes

Nitrogen concentrations of plant tissues were measured through the Kjeldahl method [26]. The dried samples of shoot and root were ground into a fine powder and around 0.2 g of each sample powder was weighed, digested with H2SO4-H2O2, and then analyzed for nitrogen and P concentrations using the Bran + Luebbe Continuous-Flow AutoAnalyzer III (AA3-Australia). Additionally, PUE definitions for cotton genotypes grown under various P concentrations were calculated as follows:
(1)
Total P accumulation (TPA) calculated as the P concentration x total plant dry matter;
(2)
P utilization efficiency (PUtE) calculated as the total plant dry matter divided by P concentration;
(3)
P uptake efficiency (PUpE) calculated as TPA divided by root dry matter; and
(4)
Physiological P-use efficiency (PPUE) calculated as shoot P concentration divided by shoot dry matter [26].

2.5. Classification of Cotton Genotypes

Cotton genotypes were classified into 3 categories as proposed by [27] and [28]. These categories include I) efficient (E), II) medium (M), and (III) inefficient (I). The genotypes were assigned as efficient if their mean was >μ + SD, medium if their mean was between μ−SD and μ + SD, and inefficient if their mean was <μ-SD. The score assigned 3 to efficient (E), 2 to medium (M), and 1 to inefficient (I) in respective parameters and the cumulative score was counted by summing up the individual scores of different traits of a genotype.

2.6. Statistical Analysis

The experiment was triplicated using a completely randomized design. The obtained data were analyzed using Statistix 8.1 (Analytical Software, Tallahassee, FL, USA). The least significance difference (LSD) test was used to compare the mean value, in all cases at the significant level of 0.05. Graphs were generated using Origin Pro 2016 (Origin Lab Corporation, Northampton, MA, USA). *, **, and *** represent p ≤ 0.05, 0.01, and 0.001, respectively, and ns stands for not significant.

3. Results

3.1. Plant Morphology and Dry Biomass

The cotton genotypes varied significantly in morphology and dry biomass in response to various P concentrations (Figure 1 and Table 1). Under 0-µM P, shoot length was greatly inhibited relative to P application. However, the shoot length increased linearly with an increase in P concentrations (Table 1). At P-deficient levels (10–20 µM), no difference in shoot length was recorded. Different cotton genotypes showed a distinct response to P concentrations, with Xinluzao-49 showing the maximum and CCRI-64 the minimum shoot length (Table 1). Root, shoot, and total plant dry weight were lowered under 0-µM P; however, it increased with an increase in P concentrations. The maximum root, shoot, and total plant dry weight was recorded under the 500-µM P concentration (Table 1). In the case of genotypes, Xinluzao-49 showed the maximum values for root, shoot, and total dry weight while CCRI-64 had the minimum as compared to other genotypes irrespective of the P concentrations. The number of leaves and leaf area of cotton genotypes was also significantly affected by P concentrations (Table 1). Under the 0-µM P, the leaf number and area were greatly reduced as compared to P-treated plants. Both leaf number and area were improved under the 500-µM P concentration as compared to other rates, especially P-deficient conditions (0, 10, and 20 µM P). Genotype Xinluzao-49 produced the maximum number of leaves and leaf area while Xinluzao-35 showed the lowest number of leaves and leaf area as compared to other genotypes (Table 1). Overall plant morphology and dry biomass were improved in Xinluzao-49 under the 500-µM P concentration. Poor performance was noted in the genotypes CCRI-64 and Xinluzao-35 in terms of plant morphology and dry biomass.

3.2. Root Morphology

The results showed that almost all root morphological traits of cotton genotypes were significantly affected by P concentrations (Table 2 and Table 3). The root shoot ratio of cotton genotypes was significantly different under each P concentration. Among the genotypes, Xinluzao-49 and Xinluzao-48 had the maximum root shoot ratio while CCRI-64 had the lowest as compared to other genotypes (Table 2). A linear reduction in the root to shoot ratio was found with increasing P concentrations. Root morphological traits of Xinluzao-49 were significantly improved except root thickness and root density. Other than Xinluzao-49, the response of genotypes was different for different traits. Genotypes that showed the genotypic response for root morphological traits was not constant and depended on the genotypes as well as P concentrations. Unlike other root morphological traits, the root thickness of Xinluzao-49 was comparatively lower than Yumian-21 and Xinluzhong-17 and from Xinluzao-48 and Xinluzao-20 for root density (Table 3). Almost all root morphological traits were decreased with an increase in P concentrations; however, the increased extent varied among the genotypes (Table 2 and Table 3). In contrast, root diameter and volume were less affected by P starvation (0 µM P), as moderate to high concentrations of P significantly increased root diameter and volume (Table 2). It should be noted that Xinluzao-49 showed a dramatic increase in root morphological traits in response to P concentrations.
This indicated that the genotype is P efficient and tolerant to P deficiency by maintaining a well-established root system. Moreover, P starvation and deficiency (0, 10, and 20 µM P) induce root morphological traits as a systematic response to increase root growth and development for better nutrient uptake.

3.3. Leaf Photosynthetic Traits and SPAD Value

The results showed that leaf photosynthesis, stomatal conductance, and transpiration rate were significantly higher in genotype Xinluzao-49 as compared to other genotypes (Table 4). The leaf transpiration rate of Xinluzao-48 and Xinluzhong-17 were also significantly higher and similar to Xinluzao-48 than other genotypes. However, a lower photosynthetic rate and stomatal conductance were recorded from CCRI-64, which was similar to Yumian-21 for stomatal conductance (Table 4). The intercellular CO2 concentration was significantly lower in Xinluzao-49, Xinluzao-20, Xinluzao-48, and Xinluzhong-17 as compared to other genotypes. The lowered intercellular CO2 concentration of these genotypes is due to their high photosynthetic efficiency, which can effectively utilize carbon dioxide. Leaf photosynthetic traits were significantly increased with an increase in P concentrations. The maximum leaf photosynthesis and stomatal conductance were obtained under 500-µM P as compared to the low concentrations (Table 4). In contrast, leaf photosynthesis and stomatal conductance were greatly inhibited by P-starved (0 µM) and -deficient (10 µM) conditions (Table 4). Unlike these traits, the leaf transpiration rate showed less variation among P concentrations; however, increased transpiration was noted with an increase in P concentrations (Table 4). The SPAD value of cotton genotypes was also significantly affected by P concentrations (Table 4). However, the variation was found to be less as compared to photosynthetic traits. Xinluzao-49 showed significantly higher SPAD values as compared to all other genotypes, which show similar values as shown in Table 4.

3.4. Tissue Nitrogen and P Concentrations

Different P concentrations significantly affected shoot, root, and total nitrogen concentration (Table 5). The variation among genotypes for tissues and total plant nitrogen concentrations was less. However, Xinluzao-49 had significantly higher shoot and total nitrogen concentration as compared to other genotypes (Table 5). A significant variation was noted among P concentrations, where increasing P linearly increased shoot and total plant nitrogen concentration (Table 5). The difference between 80 and 500 µM was not significant; however, significant variation was observed under low concentrations. Comparatively, root nitrogen concentration showed variation among the genotypes. However, genotype Xinluzao-49 and Xinluzhong-15 had higher root nitrogen concentrations as compared to other genotypes (Table 5). Root nitrogen concentration significantly increased with an increase in P concentrations in the medium. However, at higher concentrations, the difference was not significant (Table 5). Shoot, root, and total plant P concentrations of cotton genotypes were also significantly affected by P concentrations (Table 5). Unlike nitrogen, shoot, root, and total P concentrations of cotton genotypes showed a similar trend, where genotypes Xinluzao-49, Xinluzhong-12, Xinluzao-48, CCRI-12, CCRI-27, and Xinluzhong-15 showed significantly higher shoot, root, and total P concentrations as compared to other genotypes (Table 5). However, at moderate and high P concentrations (40, 80, and 500 µM), there were no significant differences between tissue and total plant P concentration (Table 5).

3.5. P-Use Efficiency Indexes

The P-use efficiency indexes, like P accumulation, P-utilization efficiency, P-uptake efficiency and physiological P-use efficiency, were also recorded to know the potential of cotton genotypes. Root, shoot, and total plant P accumulation of cotton genotypes were significantly affected by various P concentrations (Table 6). Among the genotypes, Xinluzao-49 had significantly higher root, shoot, and total P accumulation while the remaining genotypes mostly showed statistically similar responses in terms of the root, shoot, and total P accumulation (Table 6). An increasing trend in the root, shoot, and total P accumulation was noted with an increase in P concentrations (Table 6). It was observed that tissue and total plant P accumulation was greatly inhibited under P starvation while in contrast, high application of P (500 µM) dramatically improved root, shoot, and total P accumulation (Table 6).
The P-utilization efficiency of cotton genotypes was significantly affected by P concentrations (Table 6). The P-utilization efficiency of genotypes Xinluzao-35, Yumian-21, Xinluzhong-15, and Xinluzao-49 were significantly higher than other cotton genotypes. However, the remaining genotypes showed statistically similar and lower P-utilization efficiency (Table 6). In case of P concentrations, phosphorus utilization efficiency significantly increased with an increase in P concentrations (Table 6). P-uptake efficiency was significantly higher in genotype CCRI-64, which was statistically similar to Xinluzao-49 and TM-1 (Table 6). Among the genotypes, P-uptake efficiency was significantly lower in genotypes Xinluzao-35 and Xinluzhong-15 (Table 6). A linear increase in P-uptake efficiency was noted with an increase in P concentrations (Table 5). However, P-uptake efficiency was higher under 500-µM P. This indicated that an increase in P concentration in the medium could increase P uptake. Physiological P-use efficiency of Xinluzao-49 was significantly higher than other cotton genotypes (Table 6). The physiological P-use efficiency was low under P-starved (0 µM) and -deficient conditions (10 and 20 µM) while it was increased significantly with an increase in P concentrations. The highest physiological P-use efficiency was recorded under the 500-µM P concentration (Table 6). Overall, the P-use efficiency traits were higher for genotype Xinluzao-49, which indicated that this genotype has a great potential for P uptake and utilization. The response of other genotypes was not constant and varied among the P concentrations for different PUE traits.

3.6. Relationship between Morphological and Physiological Traits

Morphophysiological traits, like shoot dry weight, root dry weight, photosynthesis, P utilization, and uptake efficiency, showed a positive relationship (Table 7). The relationship of shoot dry weight with photosynthesis (0.92%), P utilization efficiency (0.73), and uptake efficiency (0.97%) was strong and highly positive as compared to root dry weight. The relationship of both shoot and root dry weight with P uptake efficiency is 0.97% and 0.71%, respectively, which is highly positive and strong compared to that with P utilization efficiency: 0.73% and 0.42%, respectively (Table 7). Therefore, most of the genotypes with high uptake efficiency have higher shoot and root dry weight. Moreover, a comparatively low relationship of P-utilization efficiency with morphological traits suggests that this component of PUE needs to be improved as a huge potential is left in the genotypes for higher utilization. The improvement in this component of PUE will greatly increase P-use efficiency, crop productivity, and net returns.

3.7. Classification of Cotton Genotypes for Phosphorus-Use Efficiency

The cotton genotypes showed a great variation with respect to each trait under similar conditions (Table 8). Under P-starved conditions (0 µM P), the maximum and minimum score was gained by genotype Xinluzao-49 (13 out of 15) and genotype CCRI-64 (7 out of 15), respectively. The number of efficient genotypes was more in P-utilization and -uptake efficiency (three each). The response of cotton genotypes under P-deficient conditions (10 µM P) was quite similar to P-starved conditions (Table 9). Genotypes Xinluzao-49 and Xinluzao-48 scored maximum (13 out of 15) while genotype CCRI-64 gained a minimum point score (8 out of 15). Here, most of the high scoring genotypes have high P-uptake efficiency. The response of cotton genotypes under sufficient P conditions (500 µM P) was quite different (Table 10). The maximum score was gained by genotype Xinluzao-49 (15 out of 15) and was found to be efficient for each testing trait (Table 10). In contrast, the minimum point score was gained by genotype Yumian-21 (9) and CCRI-64 (9). The point score at all three conditions (i.e., P starved, deficient, and sufficient) was summed up in another table to check the overall performance of genotypes (Table 11). The maximum point score was obtained by genotype Xinluzao-49 (41 out of 45) followed by genotype Xinluzao-48 (35 each out of 45) while the minimum point score was obtained by genotype CCRI-64 (22 out of 45) followed by genotype Yumian-21 (26 out of 45).

3.8. Principal Component and Cluster Analysis

Based on the multi-correlation analysis of five selected traits, we performed principal component analysis (PCA) to know the traits that give more response to P concentrations among cotton genotypes (Figure 2). The 12 cotton genotypes under various P concentrations showed 88.36% variation in the first two components (Table 12). The first component (PC1) represented 56.86% of the variability primarily for shoot and root dry weight. The second component (PC2) showed 31.50% variability primarily comprising of shoot dry weight and P-uptake efficiency (Figure 2, Table 12).
The hierarchical cluster analysis of cotton genotypes is also useful for the classification of genotypes for P-use efficiency. Therefore, based on the morphophysiological traits, hierarchical cluster analysis was performed to know the similarity of the genotypes (Figure 3). A total of 12 cotton genotypes were grouped into five main groups. Cluster 1, 2, and 3 comprised of one genotype each as Xinluzao-49, Xinluzao-35, and CCRI-64, respectively. Cluster 4 consisted of two cotton genotypes Xinluzao-20 and Xinluzao-48. Cluster 5 comprised of seven genotypes, which are Xinluzhong-17, Xinluzhong-15, Yumian-21, CCRI-12, CCRI-27, Xinluzhong-12, and TM-1. The farthest genotypes were genotype TM-1 and Xinluzao-49 while genotype Xinluzao-48 and Xinluzao-20, as well as CCRI-27 and CCRI-12, were found as the closet (Figure 3).

4. Discussion

4.1. Variation in Morphological and Physiological Traits

The crop species and genotypes of different species have varied responses under contrasting P supply [29]. In our study, cotton genotypes also showed differential responses to various P concentrations (Figure 1). A distinct variation among cotton genotypes was observed for various morphological and physiological traits. Generally, the variations among shoot and root morphological traits are very important for genotype selection and varietal development and can also be used in the future for the development of highly P-efficient genotypes [30]. The genotype, such as Xinluzao-49, which can grow better under both P-deficient and -sufficient conditions is desired because it can be successfully grown in a low P input without affecting yield [27]. Generally, for screening P-efficient genotypes, high dry matter production under P-deficient conditions is the most important trait [27]. As most of the genotypes have lower dry matter production under P-starved and -deficient conditions, the plants tend to partition more dry matter to the growing shoot and root tips [29]. This dry matter partitioning into different growing parts is also important to know the extent of efficiency among the genotypes. Therefore, P-efficient genotypes produced more root dry biomass under P-deficient conditions as compared to inefficient genotypes. As mentioned in the result part, most of the root morphological traits were significantly increased under P-deficient conditions, which is beneficial for better P acquisition [31]. Moreover, the increase in P acquisition in P-efficient genotypes might be due to an increase in the root absorption area, which may also affect the ability of plants to acquire nutrients from the medium [32]. The increase in root morphological traits under P-deficient conditions was also noted in other crops [33,34]. In the current study, increased root length and surface area were observed in Xinluzao-49 and consequently the root and shoot biomass were increased significantly as compared to other cotton genotypes. This suggests that Xinluzao-49 is the distinct P-efficient genotype due to its better root system and P acquisition. Based on the higher root surface area, a significant increase in nutrient uptake was also noted in Brassica species [35]. Similarly, the root shoot ratio was also improved under P-deficient conditions (Table 2). This increase in root to shoot ratio is due to more biomass allocation to the root as an adaptive strategy to absorb more P from the medium [28]. A significant and positive correlation was observed between morphological traits and P utilization and uptake efficiency, which showed that an increase in shoot root morphological traits increases uptake and utilization efficiency and ultimately yield [36].
A drastic reduction in photosynthesis, stomatal conductance, and transpiration rate were noted under P-starved and -deficient conditions. Previous reports also showed that P deficiency affects leaf photosynthetic traits and subsequently plant growth [37]. However, the reduction in growth may not always correlate with photosynthesis [38]. The P starvation effect on photosynthesis is largely species specific as different species show a dramatic reduction in photosynthesis [39]. This sharp reduction in photosynthesis may be an adaptive mechanism of P starvation. The relationship of photosynthesis with morphological traits (root and shoot dry weight) and P utilization and uptake efficiency is strongly positive (Table 7). This result suggests that an increase in leaf photosynthesis enhances dry matter production, plant growth, and subsequently increases P uptake and utilization as an increase in root and shoot growth, respectively. Besides this, the leaf transpiration rate was also reported to be an important trait contributing to P acquisition [40]. A strong positive correlation was observed between leaf P contents and the transpiration rate [40]. Thus, our results suggest that leaf photosynthetic traits also contribute to P acquisition, especially under P-deficient conditions for cotton genotypes. Leaf photosynthetic traits, like photosynthesis and particularly transpiration, could be further studied for its role in mass flow transport of P to the root surface, which further enhances P acquisition.

4.2. Variation and Classification of Cotton Genotypes for P Use Efficiency

The variation in P concentration among the genotypes was less, however, root, shoot, and total P accumulation was significantly higher in Xinluzao-49 as compared to other genotypes. This might be due to the high root and shoot dry weight of Xinluzao-49, which can survive P-deficient conditions with higher growth. Under P-starved and deficient conditions, P concentration and accumulation were greatly reduced in all cotton genotypes. However, the reduction varied among genotypes and the genotypes with comparatively less reduction were considered as P-efficient genotypes, such as Xinluzao-49 and Xinluzao-48. In line with the current findings, lowered root and shoot P concentrations and accumulation were observed in barley under low P concentrations [33]. Under P-deficient conditions, most of the P is translocated into leaves in P-efficient genotypes as described previously [41]. A significant correlation of shoot P concentrations and P uptake and transport efficiency were noted in Brassica [35]. Therefore, genotypes with high P transport efficiency can retain higher shoot P under P-starved and -deficient conditions [33].
P-use efficiency is the dry biomass produced per unit of P uptake [42]. It is well known that both P uptake and utilization are important for high P-use efficiency [43]. Usually, under high P concentrations, the uptake efficiency is high, but the utilization efficiency is low [44]. Genetic variation occurs in numerous crop species for better P uptake and utilization under P-deficient conditions [45], as large genetic variations in P-use efficiency have been reported in various wheat genotypes by several researchers [46,47]. Similarly, variation in growth and P uptake and utilization efficiency was noted in chickpea genotypes under both deficient and sufficient conditions [23]. A large genotypic variation in P-use efficiency has been observed in many species in P-deficient soils [48,49,50,51]. Leaf photosynthetic traits, like photosynthesis and transpiration rate, also have a positive effect on P uptake [52]. Additionally, remobilization of P during leaf senescence and enzymes involved in P metabolism also contribute to PUE [53]. Therefore, it may affect P uptake and utilization efficiency at various growth stages. Hence, future work is needed to know the biochemical and molecular mechanisms of P-use efficiency in cotton. This will enable breeders to develop highly P-efficient cotton genotypes.
There are many criteria proposed by different scientists for P-use efficiency, such as total P [54], dry matter production per unit of P [20], and ratios of physiologically active P to total P uptake [21,55]. However, variation in the shoot, root dry weight, shoot P content, P utilization efficiency, and physiological P-use efficiency were noted in chickpea genotypes under low P conditions [40]. In our study, both uptake and utilization efficiency varied among cotton genotypes. Therefore, different traits, like shoot, root dry weight, photosynthesis, P uptake, and utilization efficiency, were used to identify contrasting P-efficient cotton genotype. As relying on one or two traits is not sufficient for genotype screening, the objective must therefore be clear before starting genotype screening for P-use efficiency and further breeding purposes [28]. In the current study, based on the selected traits, the genotypes were classified into three classes as P efficient, moderately efficient, and inefficient genotypes [30,32]. Similar categorization of genotypes under low P conditions was done by many researchers [30,32]. However, this categorization did not answer how well the genotypes can respond to the available P in the root medium, as a genotype may be efficient under low P but could not produce adequate dry matter under high P. Therefore, the classification of genotypes at P-deficient and sufficient conditions is also needed. We classified genotypes under P-deficient (10 µM) and -sufficient (500 µM) conditions and interestingly some of the genotypes showed quite different responses than in P-starved conditions and were classified in different classes accordingly (Table 9 and Table 10). Genotypes performing the best in all three conditions are desired and therefore the points scored by each genotype were summed up and classification was made (Table 11). As expected, most of the genotypes were classified in the same class. Genotype Xinluzao-49 scored the maximum (41 out of 45) and genotypes CCRI-64 and Yumian-21 scored a minimum of 22 and 26 out of 45, respectively (Table 11). Besides this classification, hierarchical cluster analysis also showed Xinluzao-49 as a P-efficient genotype.

5. Conclusions

Classification and exploitation of the elite cotton germplasm for P-use efficiency is the utmost need of agriculture and also for breeding highly P-efficient cultivars. This study showed a large variation in shoot dry weight, root dry weight, photosynthetic activity, P uptake, and utilization efficiency among cotton genotypes under various P concentrations. The identification of Xinluzao-49 and Xinluzao-48 as P-efficient genotypes for all five traits demonstrates the possibility of using these genotypes as a reference set for breeding P-efficient genotypes. Moreover, the results of the current study could be employed to evaluate and develop genotypes with high P-use efficiency, which will reduce the dependency on P fertilizers and environmental problems.

Author Contributions

M.S., A.I. and Q.D. conceived and designed the experiment and wrote the manuscript. H.G. helped in chemical analysis. X.W. helped in data collection and plant materials. H.Z., N.P. analyzed the data.

Funding

This research was funded by National Key R & D program: Integrated research and demonstration of reduction technology of cotton fertilizer and pesticide (Grant No. 2017YFD0201900) and the state key laboratory of cotton biology (Grant No. CB2019C17).

Conflicts of Interest

The authors declare no conflict of interest.

References

  1. Chen, B.; Wang, Q.; Bücking, H.; Sheng, J.; Luo, J.; Chai, Z.; Kafle, A.; Hou, Y.; Feng, G. Genotypic differences in phosphorus acquisition efficiency and root performance of cotton (Gossypium hirsutum) under low-phosphorus stress. Crop Pasture Sci. 2019, 70, 344–358. [Google Scholar] [CrossRef]
  2. Roth, G.; Harris, G.; Gillies, M.; Montgomery, J.; Wigginton, D. Water-use efficiency and productivity trends in Australian irrigated cotton: A review. Crop Pasture Sci. 2014, 64, 1033–1048. [Google Scholar] [CrossRef]
  3. Zhang, W.; Liu, D.-Y.; Li, C.; Chen, X.-P.; Zou, C.-Q. Accumulation, partitioning, and bioavailability of micronutrients in summer maize as affected by phosphorus supply. Eur. J. Agron. 2017, 86, 48–59. [Google Scholar] [CrossRef] [Green Version]
  4. Dorahy, C.G.; Rochester, I.J.; Blair, G.J. Response of field-grown cotton (Gossypium hirsutum L.) to phosphorus fertilisation on alkaline soils in eastern Australia. Soil Res. 2005, 42, 913–920. [Google Scholar] [CrossRef]
  5. George, T.S.; Turner, B.L.; Gregory, P.J.; Cade-Menun, B.J.; Richardson, A.E. Depletion of organic phosphorus from Oxisols in relation to phosphatase activities in the rhizosphere. Eur. J. Soil Sci. 2006, 57, 47–57. [Google Scholar] [CrossRef]
  6. Zhang, F.; Cui, Z.; Chen, X.; Ju, X.; Shen, J.; Chen, Q.; Liu, X.; Zhang, W.; Mi, G.; Fan, M. Integrated nutrient management for food security and environmental quality in China. In Advances in Agronomy; Elsevier: Amsterdam, The Netherlands, 2012; pp. 1–40. [Google Scholar]
  7. Cattivelli, L.; Rizza, F.; Badeck, F.-W.; Mazzucotelli, E.; Mastrangelo, A.M.; Francia, E.; Marè, C.; Tondelli, A.; Stanca, A.M. Drought tolerance improvement in crop plants: An integrated view from breeding to genomics. Field Crop. Res. 2008, 105, 1–14. [Google Scholar] [CrossRef]
  8. Iqbal, A.; Song, M.; Shah, Z.; Alamzeb, M.; Iqbal, M. Integrated use of plant residues, phosphorus and beneficial microbes improve hybrid maize productivity in semiarid climates. Acta Ecol. Sin. 2018, 39, 348–355. [Google Scholar] [CrossRef]
  9. Vance, C.P.; Uhde-Stone, C.; Allan, D.L. Phosphorus acquisition and use: Critical adaptations by plants for securing a nonrenewable resource. New Phytol. 2003, 157, 423–447. [Google Scholar] [CrossRef]
  10. Wang, R.; Guo, S.; Li, N.; Li, R.; Zhang, Y.; Jiang, J.; Wang, Z.; Liu, Q.; Wu, D.; Sun, Q. Phosphorus accumulation and sorption in calcareous soil under long-term fertilization. PLoS ONE 2015, 10, e0135160. [Google Scholar] [CrossRef]
  11. Delgado, A.; Scalenghe, R. Aspects of phosphorus transfer from soils in Europe. J. Plant Nutr. Soil Sci. 2008, 171, 552–575. [Google Scholar] [CrossRef]
  12. Niu, Y.F.; Chai, R.S.; Jin, G.L.; Wang, H.; Tang, C.X.; Zhang, Y.S. Responses of root architecture development to low phosphorus availability: A review. Ann. Bot. 2012, 112, 391–408. [Google Scholar] [CrossRef] [PubMed]
  13. Ghaffar, S.; Stevenson, R.J.; Khan, Z. Effect of phosphorus stress on Microcystis aeruginosa growth and phosphorus uptake. PLoS ONE 2017, 12, e0174349. [Google Scholar] [CrossRef] [PubMed]
  14. Fixen, P.E.; Johnston, A.M. World fertilizer nutrient reserves: A view to the future. J. Sci. Food Agric. 2012, 92, 1001–1005. [Google Scholar] [CrossRef] [PubMed]
  15. Rose, T.; Liu, L.; Wissuwa, M. Improving phosphorus efficiency in cereal crops: Is breeding for reduced grain phosphorus concentration part of the solution? Front. Plant Sci. 2013, 4, 444. [Google Scholar] [CrossRef] [Green Version]
  16. Ortiz-Monasterio, J.I.; Pena, R.J.; Pfeiffer, W.H.; Hede, A.H. Phosphorus use efficiency, grain yield, and quality of triticale and durum wheat under irrigated conditions. In Proceedings of the 5th International Triticale Symposium, Radzikow, Poland, 30 June–5 July 2002; pp. 1–6. [Google Scholar]
  17. Simpson, R.J.; Oberson, A.; Culvenor, R.A.; Ryan, M.H.; Veneklaas, E.J.; Lambers, H.; Lynch, J.P.; Ryan, P.R.; Delhaize, E.; Smith, F.A. Strategies and agronomic interventions to improve the phosphorus-use efficiency of farming systems. Plant Soil 2011, 349, 89–120. [Google Scholar] [CrossRef]
  18. Bilal, H.M.; Aziz, T.; Maqsood, M.A.; Farooq, M.; Yan, G. Categorization of wheat genotypes for phosphorus efficiency. PLoS ONE 2018, 13, e0205471. [Google Scholar] [CrossRef]
  19. Sandaña, P. Phosphorus uptake and utilization efficiency in response to potato genotype and phosphorus availability. Eur. J. Agron. 2016, 76, 95–106. [Google Scholar] [CrossRef]
  20. Rahim, A.; Ranjha, A.M.; Waraich, E.A. Effect of phosphorus application and irrigation scheduling on wheat yield and phosphorus use efficiency. Soil Environ. 2010, 29, 15–22. [Google Scholar]
  21. Aziz, T.; Finnegan, P.M.; Lambers, H.; Jost, R. Organ-specific phosphorus-allocation patterns and transcript profiles linked to phosphorus efficiency in two contrasting wheat genotypes. Plant Cell Environ. 2014, 37, 943–960. [Google Scholar] [CrossRef]
  22. Hinsinger, P.; Brauman, A.; Devau, N.; Gérard, F.; Jourdan, C.; Laclau, J.-P.; Le Cadre, E.; Jaillard, B.; Plassard, C. Acquisition of phosphorus and other poorly mobile nutrients by roots. Where do plant nutrition models fail? Plant Soil 2011, 348, 29. [Google Scholar] [CrossRef]
  23. Srinivasarao, C.; Ganeshamurthy, A.N.; Ali, M.; Venkateswarlu, B. Phosphorus and micronutrient nutrition of chickpea genotypes in a multi-nutrient-deficient typic ustochrept. J. Plant Nutr. 2006, 29, 747–763. [Google Scholar] [CrossRef]
  24. Ali, Y.; Krishnamurthy, L.; Saxena, N.P.; Rupela, O.P.; Kumar, J.; Johansen, C. Scope for genetic manipulation of mineral acquisition in chickpea. In Food Security in Nutrient-Stressed Environments: Exploiting Plants’ Genetic Capabilities; Springer: Berlin/Heidelberg, Germany, 2002; pp. 165–176. [Google Scholar] [Green Version]
  25. Huang, G.; Hayes, P.E.; Ryan, M.H.; Pang, J.; Lambers, H. Peppermint trees shift their phosphorus-acquisition strategy along a strong gradient of plant-available phosphorus by increasing their transpiration at very low phosphorus availability. Oecologia 2017, 185, 387–400. [Google Scholar] [CrossRef] [PubMed]
  26. Abenavoli, M.R.; Longo, C.; Lupini, A.; Miller, A.J.; Araniti, F.; Mercati, F.; Princi, M.P.; Sunseri, F. Phenotyping two tomato genotypes with different nitrogen use efficiency. Plant Physiol. Biochem. 2016, 107, 21–32. [Google Scholar] [CrossRef] [PubMed]
  27. Osborne, L.D.; Rengel, Z. Screening cereals for genotypic variation in efficiency of phosphorus uptake and utilisation. Aust. J. Agric. Res. 2002, 53, 295–303. [Google Scholar] [CrossRef]
  28. Aziz, T.; Rahmatullah; Maqsood, M.A.; Sabir, M.; Kanwal, S. Categorization of Brassica cultivars for phosphorus acquisition from phosphate rock on basis of growth and ionic parameters. J. Plant Nutr. 2011, 34, 522–533. [Google Scholar] [CrossRef]
  29. Aziz, T.; Lambers, H.; Nicol, D.; Ryan, M.H. Mechanisms for tolerance of very high tissue phosphorus concentrations in P tilotus polystachyus. Plant. Cell Environ. 2015, 38, 790–799. [Google Scholar] [CrossRef]
  30. Manske, G.G.B.; Ortiz-Monasterio, J.I.; Van Ginkel, M.; Gonzalez, R.M.; Rajaram, S.; Molina, E.; Vlek, P.L.G. Traits associated with improved P-uptake efficiency in CIMMYT’s semidwarf spring bread wheat grown on an acid Andisol in Mexico. Plant Soil 2000, 221, 189–204. [Google Scholar] [CrossRef]
  31. Ma, Q.; Rengel, Z.; Siddique, K.H.M. Wheat and white lupin differ in root proliferation and phosphorus use efficiency under heterogeneous soil P supply. Crop Pasture Sci. 2011, 62, 467–473. [Google Scholar] [CrossRef]
  32. Hammond, J.P.; White, P.J. Sucrose transport in the phloem: Integrating root responses to phosphorus starvation. J. Exp. Bot. 2008, 59, 93–109. [Google Scholar] [CrossRef]
  33. Nadira, U.A.; Ahmed, I.M.; Zeng, J.; Bibi, N.; Cai, S.; Wu, F.; Zhang, G. The changes in physiological and biochemical traits of Tibetan wild and cultivated barley in response to low phosphorus stress. Soil Sci. Plant Nutr. 2014, 60, 832–842. [Google Scholar] [CrossRef] [Green Version]
  34. Lynch, J.P.; Brown, K. Whole-plant adaptations to low phosphorus availability. In Plant-Environment Interactions; CRC Press: Boca Raton, FL, USA, 2016; pp. 224–257. [Google Scholar]
  35. Akhtar, M.S.; Oki, Y.; Adachi, T. Genetic Variability in Phosphorus Acquisition and Utilization Efficiency from Sparingly Soluble P-Sources by Brassica Cultivars under P-Stress Environment. J. Agron. Crop Sci. 2008, 194, 380–392. [Google Scholar] [CrossRef]
  36. Lambers, H.; Shane, M.W.; Cramer, M.D.; Pearse, S.J.; Veneklaas, E.J. Root structure and functioning for efficient acquisition of phosphorus: Matching morphological and physiological traits. Ann. Bot. 2006, 98, 693–713. [Google Scholar] [CrossRef] [PubMed]
  37. Jacob, J.; Lawlor, D.W. Extreme phosphate deficiency decreases the in vivo CO2/O2 specificity factor of ribulose 1, 5-bisphosphate carboxylase-oxygenase in intact leaves of sunflower. J. Exp. Bot. 1993, 44, 1635–1641. [Google Scholar] [CrossRef]
  38. Crafts-Brandner, S.J. Phosphorus nutrition influence on leaf senescence in soybean. Plant Physiol. 1992, 98, 1128–1132. [Google Scholar] [CrossRef]
  39. Thuynsma, R.; Kleinert, A.; Kossmann, J.; Valentine, A.J.; Hills, P.N. The effects of limiting phosphate on photosynthesis and growth of Lotus japonicus. South Afr. J. Bot. 2016, 104, 244–248. [Google Scholar] [CrossRef]
  40. Pang, J.; Zhao, H.; Bansal, R.; Bohuon, E.; Lambers, H.; Ryan, M.H.; Siddique, K.H.M. Leaf transpiration plays a role in phosphorus acquisition among a large set of chickpea genotypes. Plant. Cell Environ. 2018, 41, 2069–2079. [Google Scholar] [CrossRef]
  41. Snapp, S.S.; Lynch, J.P. Phosphorus distribution and remobilization in bean plants as influenced by phosphorus nutrition. Crop. Sci. 1996, 36, 929–935. [Google Scholar] [CrossRef]
  42. Moll, R.H.; Kamprath, E.J.; Jackson, W.A. Analysis and interpretation of factors which contribute to efficiency of nitrogen utilization 1. Agron. J. 1982, 74, 562–564. [Google Scholar] [CrossRef]
  43. Buckley, C.; Wall, D.P.; Moran, B.; Murphy, P.N.C. Developing the EU Farm Accountancy Data Network to derive indicators around the sustainable use of nitrogen and phosphorus at farm level. Nutr. Cycl. Agroecosystems 2015, 102, 319–333. [Google Scholar] [CrossRef] [Green Version]
  44. Rose, T.J.; Rose, M.T.; Pariasca Tanaka, J.; Heuer, S.; Wissuwa, M. The frustration with utilization: Why have improvements in internal phosphorus utilization efficiency in crops remained so elusive? Front. Plant Sci. 2011, 2, 73. [Google Scholar] [CrossRef]
  45. Tariq Aziz, P.; Maqsood, M.A.; Mansoor, T. Differences in phosphorus absorption, transport and utilization by twenty rice (Oryza sativa L.) cultivars. Pak. J. Agric. Sci. 2005, 42, 3–4. [Google Scholar]
  46. Alam, S.M. Wheat yield and P fertilizer efficiency as influenced by rate andintegrated use of chemical and organic fertilizers. Pak. J. Soil Sci. 2003, 22, 72–76. [Google Scholar]
  47. Kosar, H.S.; Gill, M.A.; Aziz, T.; Tahir, M.A. Relative phosphorus utilization efficiency of wheat genotypes in hydroponics. Pak. J. Agric. Sci. 2003, 40, 28–32. [Google Scholar]
  48. Keneni, G.; Bekele, E.; Assefa, F.; Imtiaz, M.; Debele, T.; Dagne, K.; Getu, E. Characterization of Ethiopian chickpea (Cicer arietinum L.) germplasm accessions for phosphorus uptake and use efficiency II. Interrelationships of characters and gains from selection. Ethiop. J. Appl. Sci. Technol. 2015, 6, 77–96. [Google Scholar]
  49. Sulpice, R.; Ishihara, H.; Schlereth, A.; Cawthray, G.R.; Encke, B.; Giavalisco, P.; Ivakov, A.; Arrivault, S.; Jost, R.; Krohn, N. Low levels of ribosomal RNA partly account for the very high photosynthetic phosphorus-use efficiency of P roteaceae species. Plant Cell Environ. 2014, 37, 1276–1298. [Google Scholar] [CrossRef]
  50. Hidaka, A.; Kitayama, K. Divergent patterns of photosynthetic phosphorus-use efficiency versus nitrogen-use efficiency of tree leaves along nutrient-availability gradients. J. Ecol. 2009, 97, 984–991. [Google Scholar] [CrossRef]
  51. Hidaka, A.; Kitayama, K. Relationship between photosynthetic phosphorus-use efficiency and foliar phosphorus fractions in tropical tree species. Ecol. Evol. 2013, 3, 4872–4880. [Google Scholar] [CrossRef]
  52. Barber, S.A. Soil Nutrient Bioavailability: A Mechanistic Approach; John Wiley & Sons: Hoboken, NJ, USA, 1995. [Google Scholar]
  53. Veneklaas, E.J.; Lambers, H.; Bragg, J.; Finnegan, P.M.; Lovelock, C.E.; Plaxton, W.C.; Price, C.A.; Scheible, W.; Shane, M.W.; White, P.J. Opportunities for improving phosphorus-use efficiency in crop plants. New Phytol. 2012, 195, 306–320. [Google Scholar] [CrossRef]
  54. Sandaña, P.; Pinochet, D. Phosphorus acquisition of wheat, pea and narrow-leafed lupin under different P supplies. J. Soil Sci. Plant Nutr. 2016, 16, 537–549. [Google Scholar] [CrossRef]
  55. Ozturk, L.; Eker, S.; Torun, B.; Cakmak, I. Variation in phosphorus efficiency among 73 bread and durum wheat genotypes grown in a phosphorus-deficient calcareous soil. Plant Soil 2005, 269, 69–80. [Google Scholar] [CrossRef]
Figure 1. Representative examples of genotype-specific plant phenotypes of 12 cotton genotypes grown under various P concentrations (0, 10, 20, 40, 80, and 500 µM). Each number from 1 to 12 represents genotypes TM-1, Yumian-21, CCRI-64, CCRI-27, Xinluzhong-17, Xinluzao-35, Xinluzao-48, Xinluzao-49, Xinluzhong-12, Xinluzhong-15, Xinluzao-20, and CCRI-12, respectively.
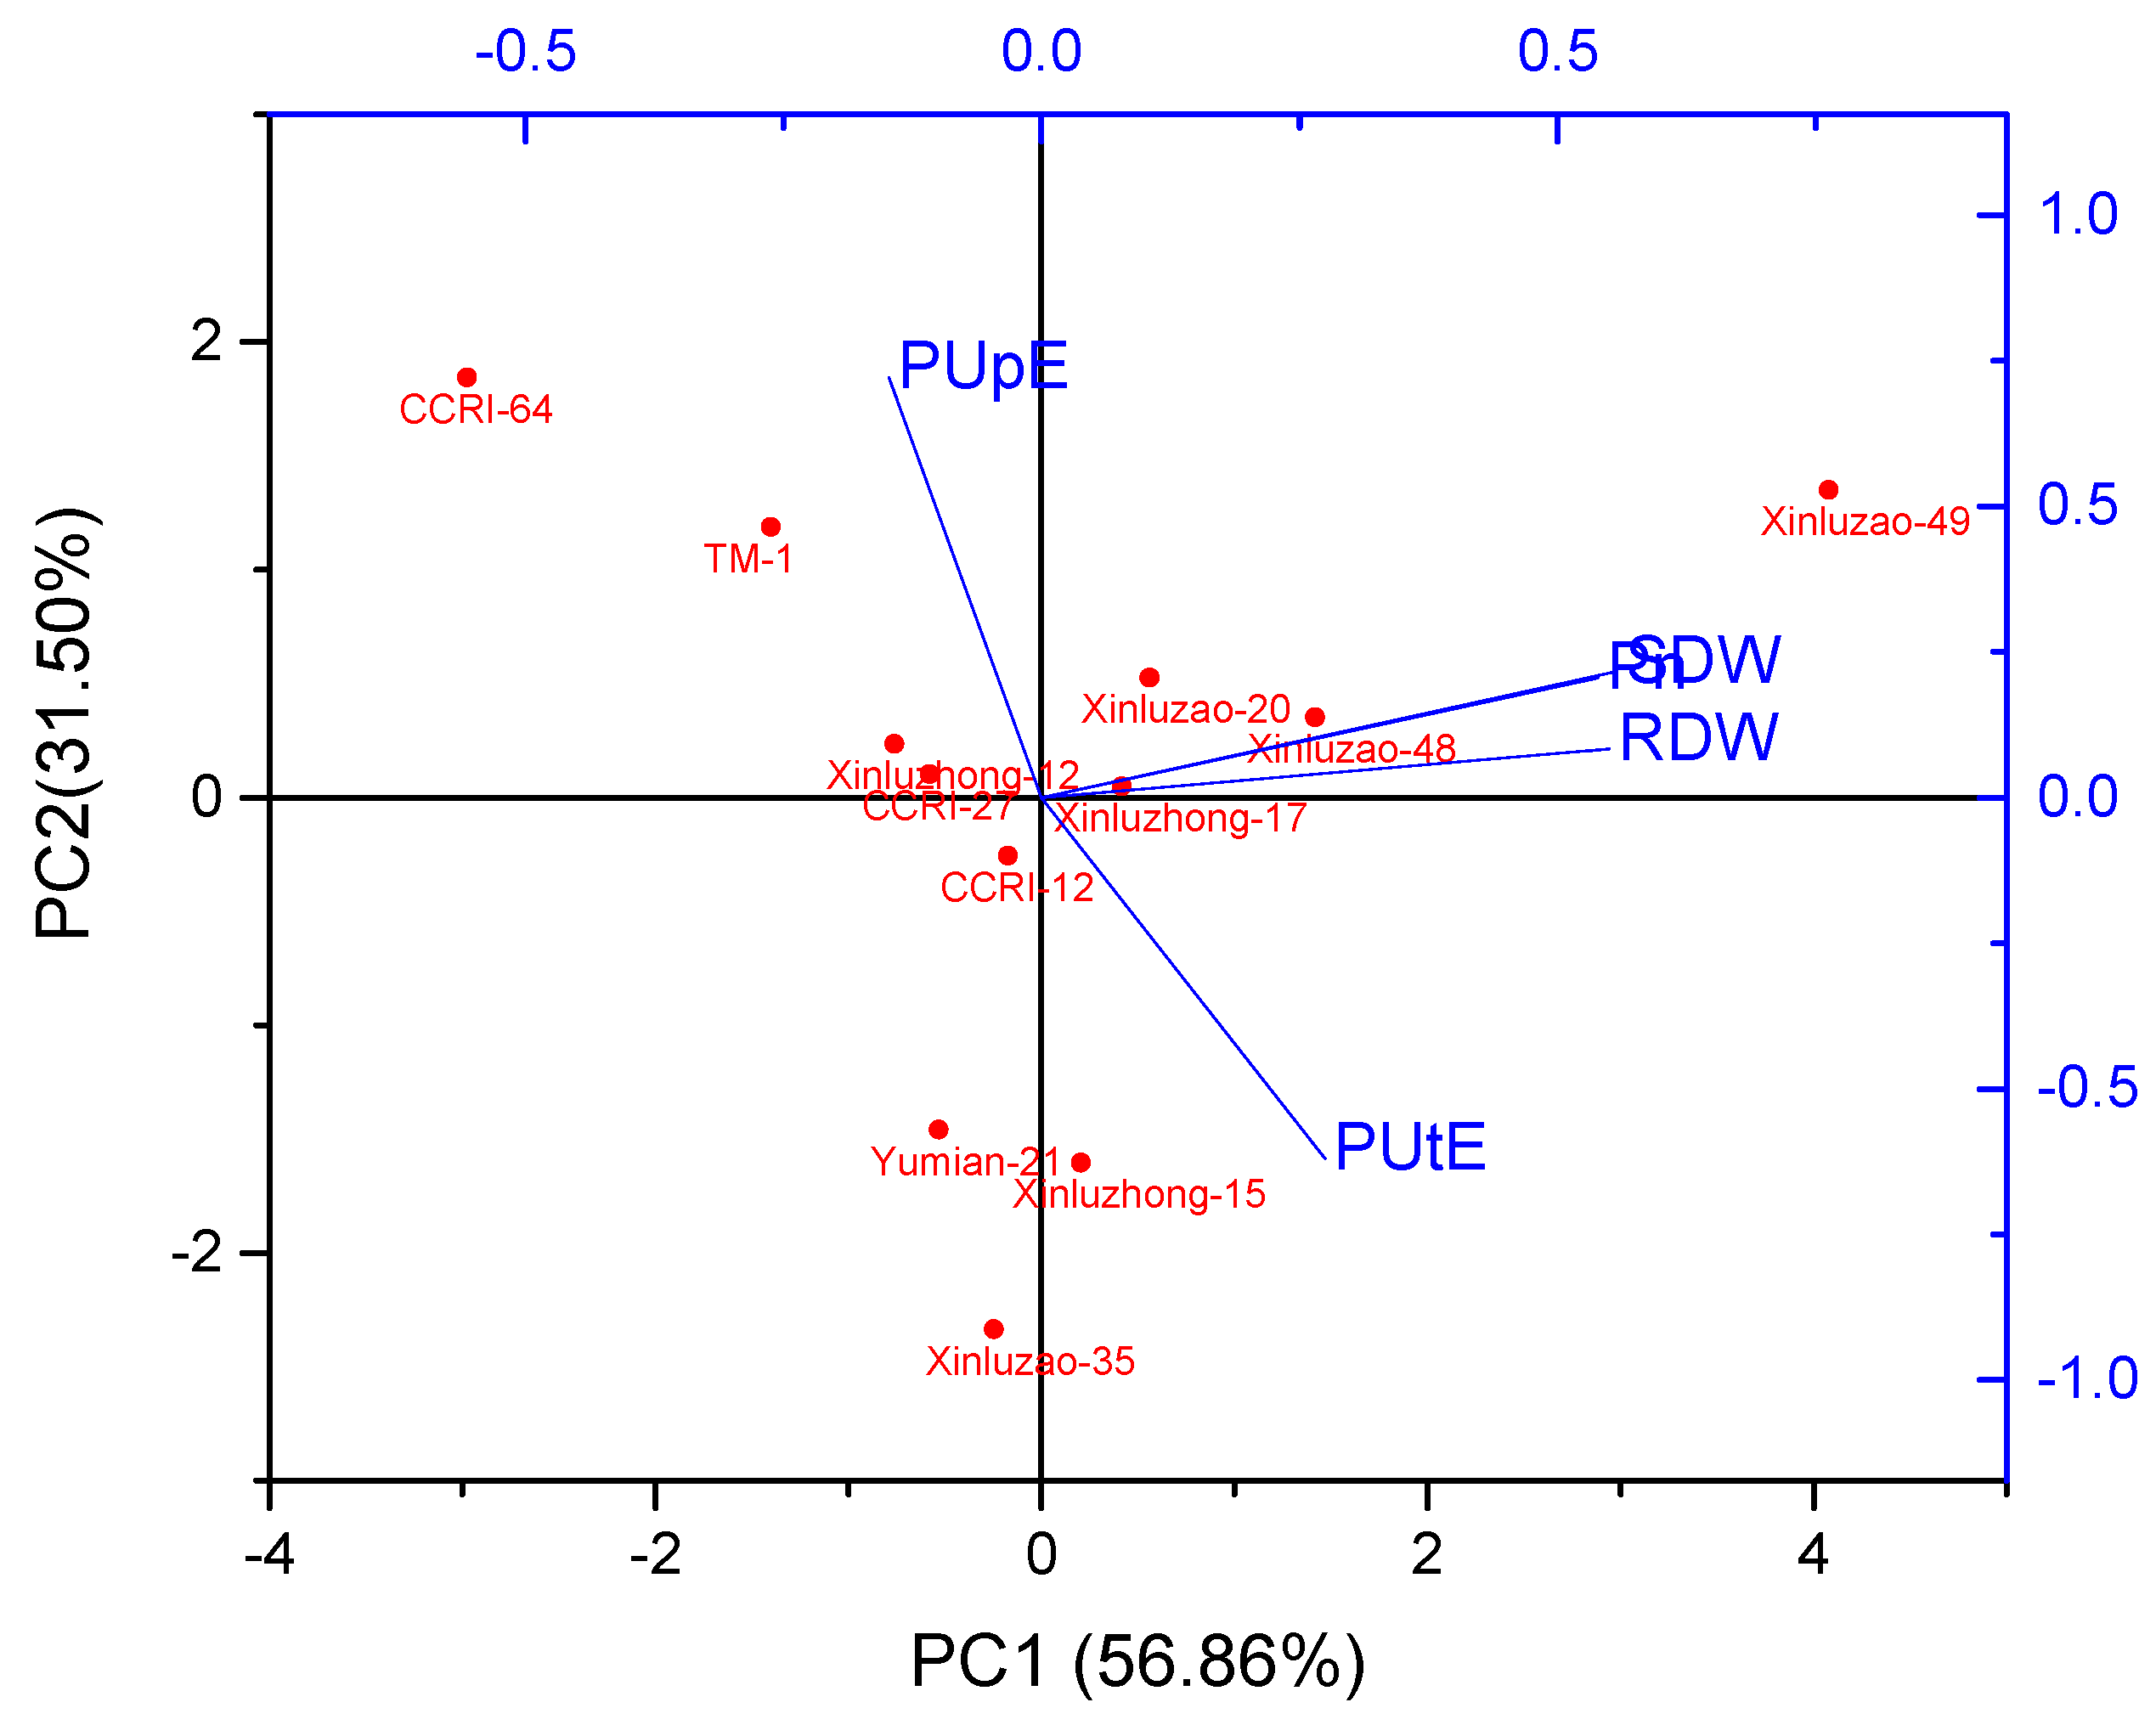
Agronomy 09 00689 g001
Figure 2. Principal component analysis (PCA) biplot of morphophysiological traits of 12 cotton genotypes grown under various P concentrations. SDW; shoot dry weight, RDW; root dry weight, Pn: net photosynthesis, PUpE; P uptake efficiency and PUtE; P utilization efficiency.
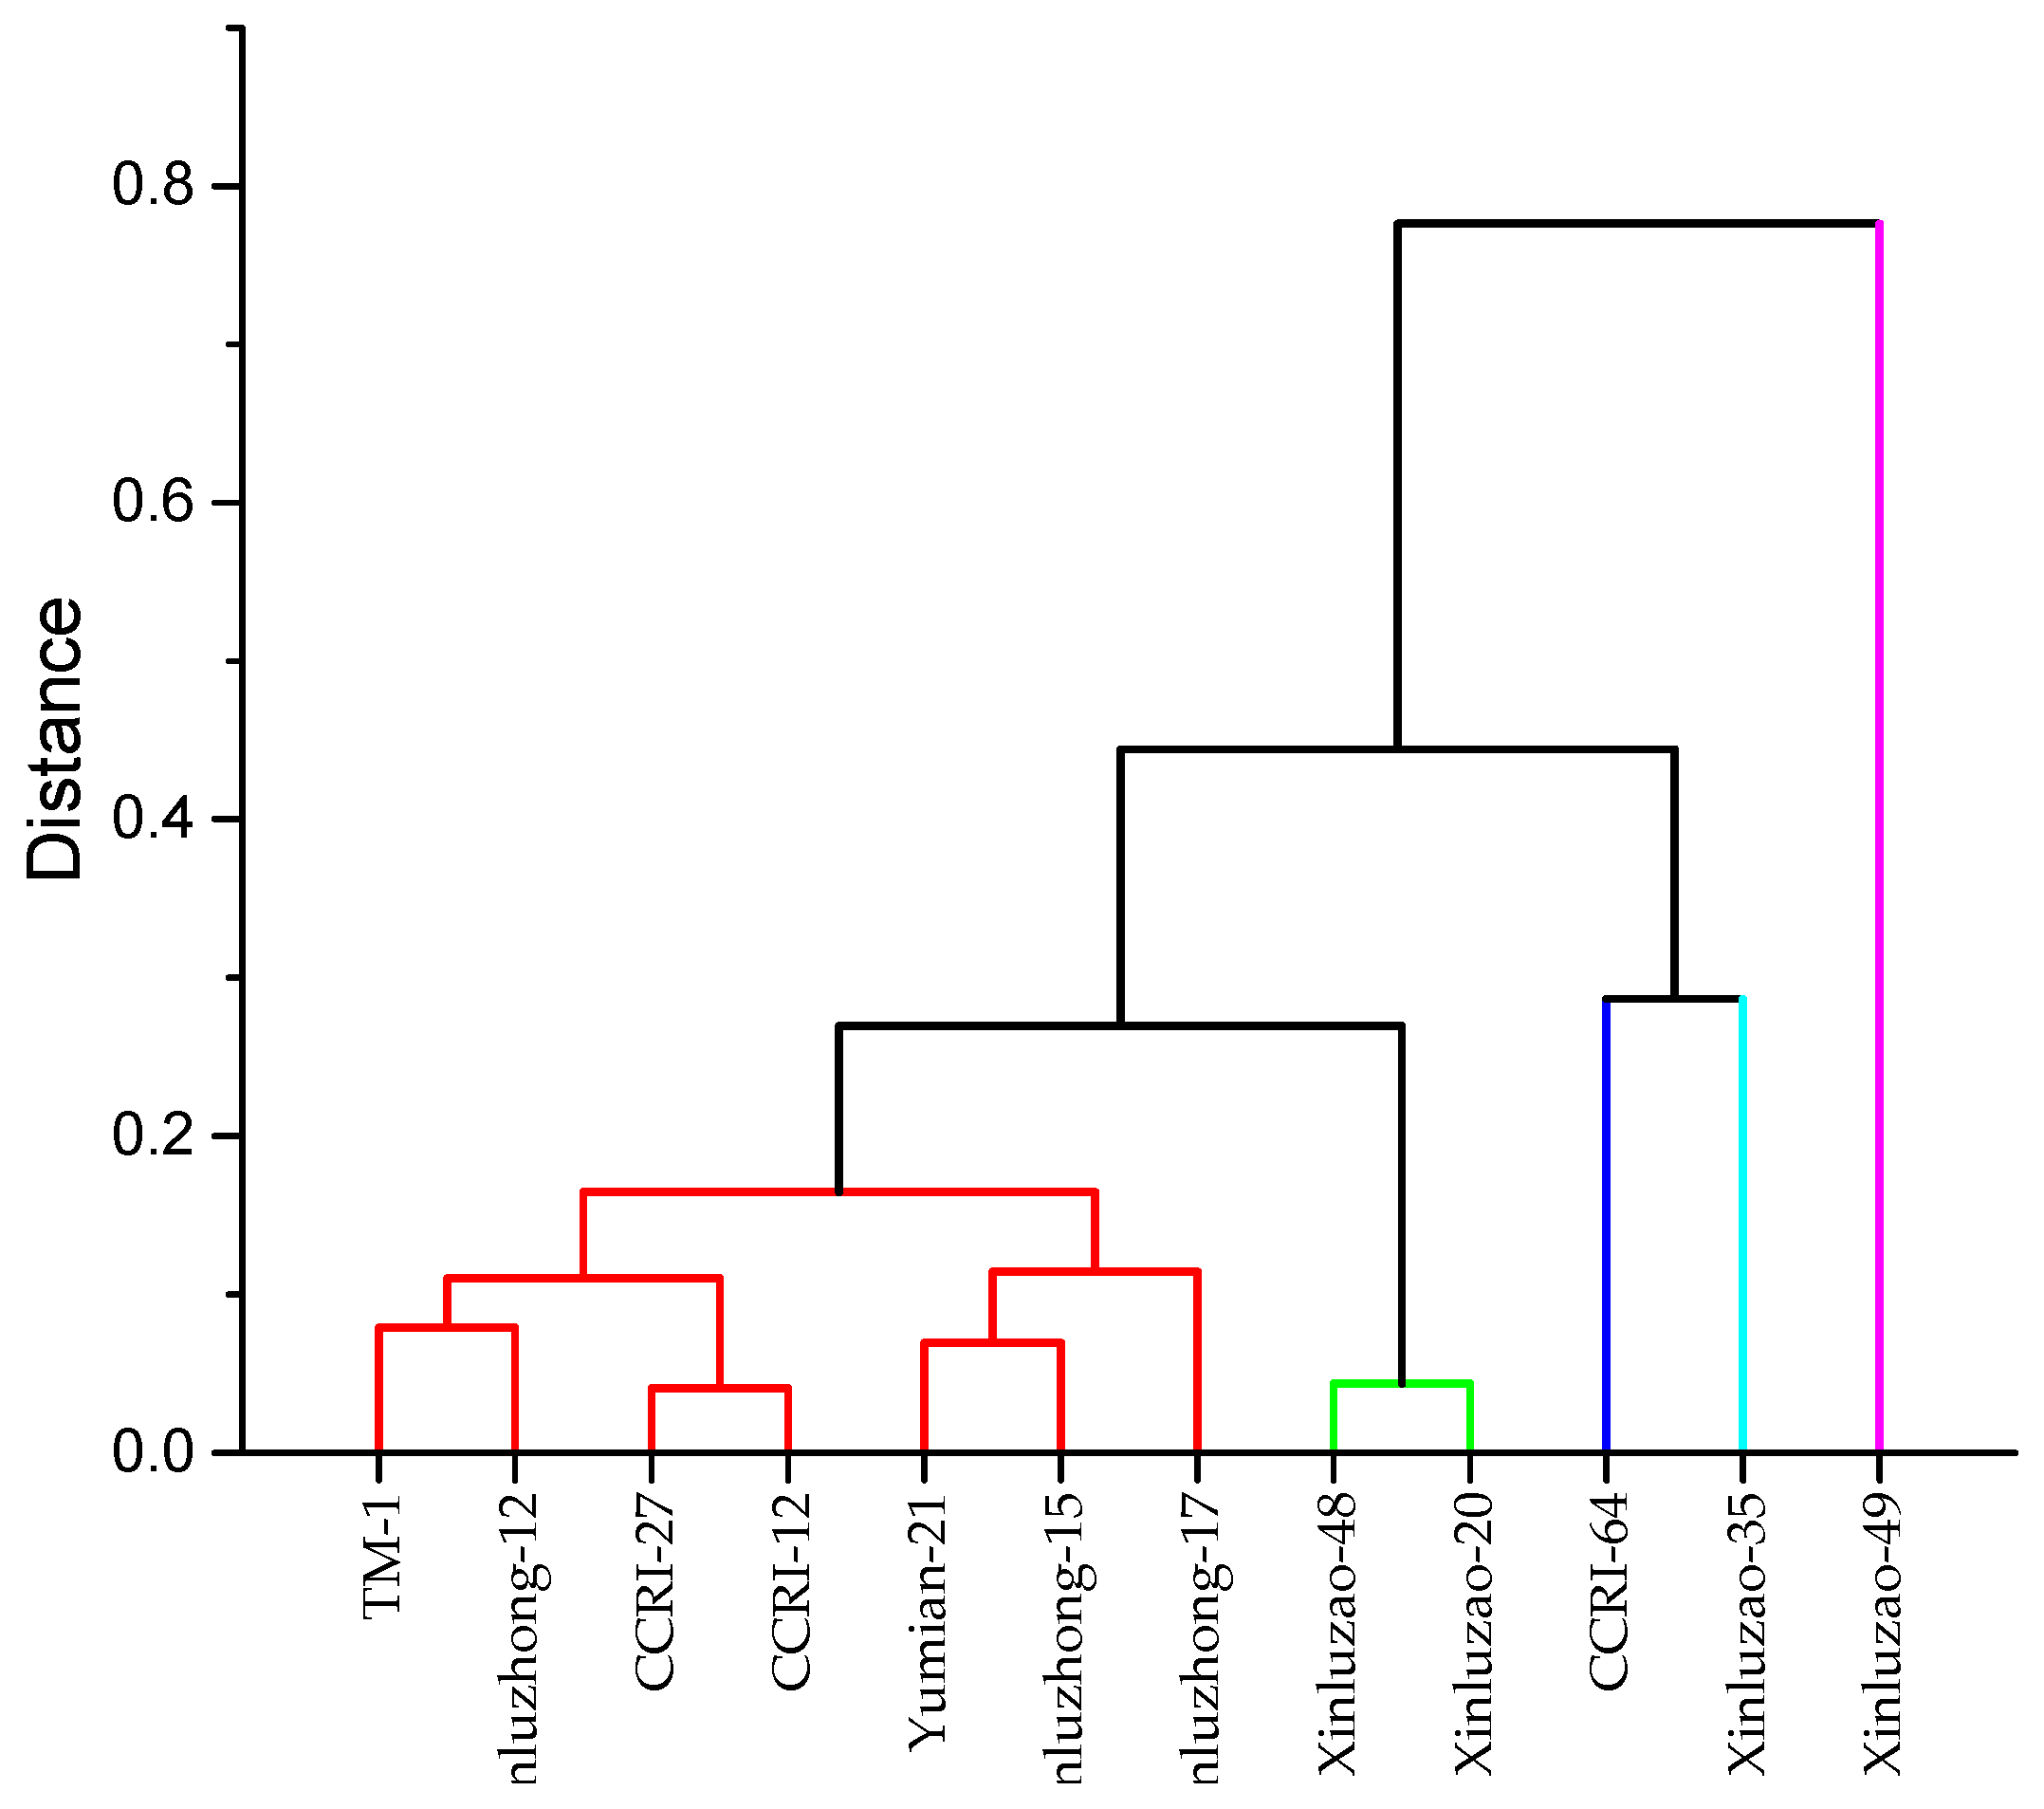
Agronomy 09 00689 g002
Figure 3. Dendrogram hierarchical cluster analysis of cotton genotypes based on morphophysiological traits grown under various P concentrations (0, 10, 20, 40, 80, and 500 µM).
Agronomy 09 00689 g003
Table 1. Shoot length (SL, cm), root dry weight (RDW, g), shoot dry weight (SDW, g), total plant dry weight (TDW, g), number of leaves (NOL), and leaf area (LA, cm2) of 12 cotton genotypes grown at different P concentrations in hydroponic culture.
GenotypesSLRDWSDWTDWNOLLA
TM-111.6 cd0.28 d0.64 b0.92 cd5.8 abc51.94 b
Yumian-2112.3 bcd0.27 de0.64 b0.91 cd5.8 abc50.83 b
CCRI-649.10 d0.26 e0.63 b0.89 d5.2 cd44.09 b
CCRI-2714.2 bc 0.30 c0.65 b0.95 bc5.7 bcd50.09 b
Xinluzhong-1716.6 b0.31 bc0.66 b0.97 bc5.3 cd55.05 ab
Xinluzao-3514.0 bc0.30 c0.65 b0.95 bc5.0 d41.63 b
Xinluzao-4817.0 b0.34 b0.67 b1.01 b6.2 ab54.93 ab
Xinluzao-4919.8 a0.36 a0.73 a1.09 a6.7 a76.84 a
Xinluzhong-1213.3 bc0.29 bc0.64 b0.93 bc5.0 d43.79 b
Xinluzhong-1514.2 bc0.30 bc0.65 b0.95 bc5.5 cd50.07 b
Xinluzao-2014.9 bc0.32 b0.66 b0.98 b6.3 ab43.42 b
CCRI-1214.7 bc0.31 bc0.65 b0.96 bc6.2 ab54.34 ab
P rates (µM)
06.3 e0.25 e0.40 e0.64 e2.8 f15.15 d
1010.4 d0.29 d0.51 d0.80 d4.9 e29.75 c
2011.4 d0.30 d 0.52 d0.82 d5.4 d40.65 c
4014.2 c0.32 c0.69 c1.01 c5.9 c61.37 b
8020.1 b0.33 b0.82 b1.15 b7.1 b79.75 a
50023.5 a0.35 a0.99 a1.33 a8.2 a81.83 a
Coefficient of variation (%)19.274.095.854.8810.1926.86
Note: Means followed by the same letters within the same category in the same columns are not different statistically at the 5% level of probability.
Table 2. Root shoot ratio (RSR), root length (RL, m), projected root area (PRA, cm2), root surface area (RSA, cm2), root diameter (RD, mm), and root volume (RV, cm3) of 12 cotton genotypes grown at different P concentrations in hydroponic culture.
GenotypesRSRRLPRARSARDRV
TM-10.46 d14.0 ab34.8 bc226 cd0.50 ab3.3 b
Yumian-210.45 de13.5 b 34.4 bc234 c0.48 b2.8 b
CCRI-640.44 e13.9 b35.4 b248 b0.57 ab3.8 b
CCRI-270.50 bc14.3 ab35.3 b253 b0.62 a3.2 b
Xinluzhong-170.50 c 11.0 c33.0 c213 d0.45 b2.3 b
Xinluzao-350.50 c12.5 c34.5 bc212 d0.51 ab3.2 b
Xinluzao-480.54 a11.7 c33.7 c221 cd0.54 ab2.9 b
Xinluzao-490.54 a15.1 a37.1 a281 a0.68 a4.2 a
Xinluzhong-120.48 c12.4 c34.4 bc219 d0.55 ab3.3 b
Xinluzhong-150.49 c11.5 c33.5 c217 d0.59 ab3.4 b
Xinluzao-200.52 b11.5 c33.5 c224 cd0.45 b2.6 b
CCRI-120.51 bc14.3 ab35.4 b244 b0.55 ab3.0 b
P rates (µM)
00.61 a14.1 b35.8 b159 c0.42 b2.2 c
100.57 b17.5 a39.5 a250 b0.45 b3.6 ab
200.57 b14.5 b36.0 b273 a0.57 a3.8 a
400.46 c12.3 c33.7 c247 b0.57 a3.4 ab
800.40 d10.1 d31.45 d241 b0.6 a3.3 ab
5000.35 e9.5 d31.5 d225 b0.61 a2.7 bc
Coefficient of variation (%)3.4413.45.41220.1720.3
Note: Means followed by the same letters within the same category in the same columns are not different statistically at the 5% level of probability.
Table 3. Root length ratio (RLR), root mass ratio (RMR), root thickness (RT), and root density (RD) of 12 cotton genotypes grown at different P concentrations in hydroponic culture.
GenotypesRLRRMRRTRD
TM-116.92 a0.314 d4.79 ab0.090 ab
Yumian-2116.39 a0.308 de5.46 a0.107 ab
CCRI-6417.24 a0.303 e3.78 b0.071 b
CCRI-2716.60 a0.331 bc4.72 ab0.099 ab
Xinluzhong-1712.26 c0.329 c5.42 a0.154 a
Xinluzao-3515.04 ab0.329 c4.08 ab0.099 ab
Xinluzao-4812.67 bc0.347 a4.14 ab0.126 a
Xinluzao-4915.27 ab0.345 a3.69 b0.088 b
Xinluzhong-1214.63 bc0.323 c4.39 ab0.101ab
Xinluzhong-1513.48 bc0.328 c3.51 b0.096 ab
Xinluzao-2012.47 c0.339 ab4.54 ab0.138 a
CCRI-1216.27 a0.334 bc4.89 ab0.108 ab
P rates (µM)
021.97 a0.379 a6.91 a0.125 ab
1021.77 a0.364 b4.90 b0.082 bc
2017.73 b0.362 b4.01 bc0.084 c
4012.20 c0.313 c3.96 bc0.104 bc
808.79 d0.285 d3.14 c0.104 bc
5007.16 e0.261 e3.78 c0.142 a
Coefficient of variation (%)12.533.2218.1920.51
Note: Means followed by the same letters within same category in the same columns are not different statistically at the 5% level of probability.
Table 4. Photosynthetic rate (Pn, µmol CO2 m−2 s−1), stomatal conductance (gs, mmol H2O m−2 s−1), transpiration rate (E, mmol m−2 s−1), intercellular CO2 concentration (Ci, µmol CO2 mol−1 air), and SPAD value of 12 cotton genotypes grown at different P concentrations in hydroponic culture.
GenotypesPnGsECiSPAD
TM-15.5 bcd0.291 c2.59 b312 a34.4 b
Yumian-215.6 bc0.288 d2.59 b310 ab34.4 b
CCRI-645.2 d0.288 d2.59 b313 a34.3 b
CCRI-275.5 bcd0.290 cd2.59 b309 ab34.4 b
Xinluzhong-175.7 bc0.292 bc2.60 a298 c34.3 b
Xinluzao-355.3 cd0.291 c2.59 b315 a34.8 b
Xinluzao-485.8 ab0.294 b2.60 a303 c35.9 b
Xinluzao-496.3 a0.299 a2.60 a291 c36.6 a
Xinluzhong-125.6 bc0.292 bc2.59 b311 ab34.9 b
Xinluzhong-155.6 bc0.292 bc2.59 b306 b34.6 b
Xinluzao-205.8 ab0.294 b2.59 b296 c34.5 b
CCRI-125.5 bcd0.292 bc2.59 b316 a34.7 b
P rates (µM)
03.5 f0.281 f2.58 c337 a30.5 f
104.7 e0.285 e2.59 b324 b33.6 e
205.1 d0.288 d2.59 b315 c34.8 d
406.1 c0.294 c2.60 a301 d35.8 c
806.9 b0.298 b2.60 a286 e36.7 b
5007.3 a0.301 a2.60 a281 e37.4 a
Coefficient of variation (%)6.68.64.1665.6
Note: Means followed by the same letters within the same category in the same columns are not different statistically at the 5% level of probability.
Table 5. Shoot nitrogen (SN%), root nitrogen (RN%), total nitrogen (TN%), shoot phosphorus (SP%), root phosphorus (RP%), and total phosphorus (TP%) of 12 cotton genotypes grown at different P concentrations in hydroponic culture.
GenotypesSN%RN%TN%SP%RP%TP%
TM-12.5 b1.4 ab3.9 b0.51 b0.33 b0.85 b
Yumian-212.5 b1.4 ab3.9 b0.48 b0.31 b0.78 b
CCRI-642.6 b1.4 ab4.0 b0.55 b0.38 b0.93 ab
CCRI-272.5 b1.4 ab4.0 b0.62 a0.45 a1.08 a
Xinluzhong-172.4 b1.2 b3.7 b0.39 b0.22 c0.61 b
Xinluzao-352.5 b1.3 b3.8 b0.51 b0.36 b0.87 b
Xinluzao-482.7 b1.3 b4.0 b0.63 a0.46 a1.08 a
Xinluzao-493.2 a1.5 a4.7 a0.69 a0.49 a1.18 a
Xinluzhong-122.6 b1.4 ab4.0 b0.66 a0.47 a1.13 a
Xinluzhong-152.7 b1.6 a4.2 b0.62 a0.45 a1.07 a
Xinluzao-202.6 b1.3 b3.9 b0.50 b0.33 b0.83 b
CCRI-122.6 b1.4 ab4.0 b0.63 a0.46 a1.08 a
P rates (µM)
01.4 e0.7 e2.1 e0.35 d0.18 d0.53 d
102.1 d1.0 d3.1 d0.48 c0.31 c0.79 c
202.6 c1.3 c3.9 c0.53 bc0.36 bc0.90 bc
403.0 d1.5 b4.5 b0.65 ab0.48 ab1.12 ab
803.3 a 1.9 a5.2 a0.68 a0.51 a1.18 a
5003.3a1.9 a5.2 a0.70 a0.53 a1.24 a
Coefficient of variation (%)7.111.77.616.9114.715.64
Note: Means followed by the same letters within the same category in the same columns are not different statistically at the 5% level of probability.
Table 6. Root phosphorus accumulation (RPA), shoot phosphorus accumulation (SPA), total plant phosphorus accumulation (TPA), phosphorus utilization efficiency (PUtE, g DW mg−1 P), phosphorus uptake efficiency (PUpE, mg P g−1 RDW), and physiological phosphorus-use efficiency (PPUE, g2 DW mg−1 P) of 12 cotton genotypes grown at different P concentrations in hydroponic culture.
GenotypesRPASPATPAPUtEPUpEPPUE
TM-10.08 de0.31 bc0.39 bc1.2 b1.4 a1.3 c
Yumian-210.07 e0.29 c0.36 c1.3 a1.3 b1.5 a
CCRI-640.07 e0.30 bc0.38 bc1.2 c1.4 a1.3 c
CCRI-270.09 c0.32 bc0.41 bc1.2 b1.3 b1.3 c
Xinluzhong-170.09 c0.32 bc0.42 bc1.3 a1.3 b1.4 b
Xinluzao-350.08 de0.30 bc0.38 bc1.3 a1.2 c1.4 b
Xinluzao-480.11 b0.34 b0.45 b1.2 b1.3 b1.3 c
Xinluzao-490.12 a0.38 a0.49 a1.3 a1.4 a1.5 a
Xinluzhong-120.09 c0.31 bc0.39 bc1.2 b1.3 b1.4 b
Xinluzhong-150.08 de0.30 bc0.39 bc1.3 a1.2 c1.4 b
Xinluzao-200.10 b0.33 b0.43 b1.2 b1.3 b1.3 c
CCRI-120.09 c0.32 bc0.41 b1.2 b1.3 b1.4 b
P rates (µM)
00.04 f0.14 e0.18 e1.2 d0.8 e1.1 d
100.08 e0.23 d0.31 d1.1 d1.1 d1.1 d
200.09 d0.24 d0.33 d1.1 d1.1 d1.2 d
400.10 c0.34 c0.44 c1.3 c1.4 c1.4 c
800.11 b0.42 b0.53 b1.4 b1.6 b1.6 b
5000.12 a0.53 a0.66 a1.5 a1.9 a1.8 a
Coefficient of variation (%)7.68.267.5915.1014.5715.24
Note: Means followed by the same letters within the same category in the same columns are not different statistically at the 5% level of probability.
Table 7. Relationship between shoot dry weight (SDW), root dry weight (RDW), photosynthesis (Pn), phosphorus utilization efficiency (PUtE), and phosphorus uptake efficiency (PUpE).
SDWRDWPnPUtEPUpE
SDW 10.78 *0.92 *0.73 *0.97 *
RDW0.78 *10.80 *0.42 *0.71 *
Pn0.92 *0.80 *10.58 *0.91 *
PUtE0.73 *0.42 *0.58 *10.58 *
PUpE0.97 *0.71 *0.91 *0.58 *1
Note: * represents that the correlation between the traits is significant at p < 0.05.
Table 8. Classification of cotton genotypes (grown at P starvation; 0 μM KH2PO4) based on their index scores of various parameters into efficient (E), medium (M), and inefficient (I) scoring genotypes.
GenotypesSDWRDWPnPUtEPUpETotal Score
TM-1MMMMM10
Yumian-21MIMEI9
CCRI-64IIIMM7
CCRI-27MMMMM10
Xinluzhong-17MMEMM11
Xinluzao-35MMMEI10
Xinluzao-48EEMIE12
Xinluzao-49EEEMM13
Xinluzhong-12MMMMM10
Xinluzhong-15MMMEI10
Xinluzao-20MMMIE10
CCRI-12MMMIE10
The scores are given to each genotype based on its performance in various parameters. The maximum score 15 assigned with 3 to efficient (E), 2 to medium (M), and 1 to inefficient (I) in respective parameters.
Table 9. Classification of cotton genotypes (grown at P deficient; 10 μM KH2PO4) based on their index scores of various parameters into efficient (E), medium (M), and inefficient (I) scoring genotypes.
GenotypesSDWRDWPnPUtEPUpETotal Score
TM-1MMMMM10
Yumian-21MIIEI8
CCRI-64IIIIM6
CCRI-27MMMMM10
Xinluzhong-17MMEMM11
Xinluzao-35MMMMI9
Xinluzao-48EEEIE13
Xinluzao-49EEEMM13
Xinluzhong-12MMMIE10
Xinluzhong-15MMMMI9
Xinluzao-20MMMIE10
CCRI-12MMMIE10
The scores are given to each genotype based on its performance in various parameters. The maximum score 15 assigned with 3 to efficient (E), 2 to medium (M), and 1 to inefficient (I) in respective parameters.
Table 10. Classification of cotton genotypes (grown at P sufficient; 500 μM KH2PO4) based on their index scores of various parameters into efficient (E), medium (M), and inefficient (I) scoring genotypes.
GenotypesSDWRDWPnPUtEPUpETotal Score
TM-1MMMIE10
Yumian-21MIMMM9
CCRI-64MIIME9
CCRI-27MMMMM10
Xinluzhong-17MMMMM10
Xinluzao-35MMMEI10
Xinluzao-48MEMMI10
Xinluzao-49EEEEE15
Xinluzhong-12MMMMM10
Xinluzhong-15MMEEM12
Xinluzao-20MMMMM10
CCRI-12MMMMM10
The scores are given to each genotype based on its performance in various parameters. The maximum score 15 assigned with 3 to efficient (E), 2 to medium (M), and 1 to inefficient (I) in respective parameters.
Table 11. Scoring of genotypes grown at P starvation (P; 0 μM KH2PO4), P deficient (P; 10 μM KH2PO4) and P sufficient (P; 500 μM KH2PO4) concentration under hydroponic conditions.
GenotypesScore at 0 μM/15Score at 10 μM/15Score at 500 μM/15Total Score/45
TM-110101030
Yumian-2198926
CCRI-6476922
CCRI-2710101030
Xinluzhong-1711111032
Xinluzao-351091029
Xinluzao-4812131035
Xinluzao-4913131541
Xinluzhong-1210101030
Xinluzhong-151091231
Xinluzao-2010101030
CCRI-1210101030
Table 12. Principal component analysis of morphophysiological traits under high and low nitrogen either from ammonium nitrate or nitrate.
Traits PC1PC2
Shoot dry weight0.560.22
Root dry weight0.550.08
Photosynthesis0.540.21
P utilization efficiency0.27−0.62
P uptake efficiency−0.150.72
Eigen value2.841.58
Variance contribution rate56.9%31.5%
Cumulative percentage56.9%88.4%

