Article

Nondestructive Estimation of the Chlorophyll b of Apple Fruit by Color and Spectral Features Using Different Methods of Hybrid Artificial Neural Network

by
Yousef Abbaspour-Gilandeh
1,*,
Sajad Sabzi
1,
Mario Hernández-Hernández
2,
Jose Luis Hernández-Hernández
3 and
Farzad Azadshahraki
4
1
Department of Biosystems Engineering, College of Agriculture, University of Mohaghegh Ardabili, Ardabil 56199-11367, Iran
2
Faculty of Engineering, Autonomous University of Guerrero, Chilpancingo 39070, Mexico
3
Division of Research and Graduate Studies, TecNM/Technological Institute of Chilpancingo, Chilpancingo 39070, Mexico
4
Agricultural Engineering Research Institute, Agricultural Research, Education and Extension Organization (AREEO), Karaj 31585-845, Iran
*
Author to whom correspondence should be addressed.
Agronomy 2019, 9(11), 735; https://doi.org/10.3390/agronomy9110735
Submission received: 15 September 2019 / Revised: 6 November 2019 / Accepted: 7 November 2019 / Published: 9 November 2019

Abstract

:
Nondestructive estimation of the various physicochemical features of food such as fruits and vegetables will create a dramatic development in the food industry. The reason for this development is that the estimation is non-destructive, online, and most importantly fast. Regarding the advantages, various researchers have focused on how to undertake non-destructive estimation of the physicochemical features of various nutrients. Three main goals were pursued in this article. These are: 1. Nondestructive estimation of the chlorophyll b content of red delicious apple using color features and hybrid artificial neural network-cultural algorithm (ANN-CA), 2. Nondestructive estimation of chlorophyll b content of red delicious apple using spectral data (around a range of 680 nm) and hybrid Artificial Neural Network-biogeography-based algorithm (ANN-BBO), 3. Nondestructive estimation of the chlorophyll b content of red delicious apple using different groups of selective spectra by the hybrid artificial neural network-differential evolution algorithm (ANN-DA). In each of these methods, 1000 replications were performed to evaluate the reliability of various hybrids of the artificial neural network. Finally, the results indicated that the average determination coefficient in 1000 replications for the hybrid artificial neural network, the cultural algorithm, and the hybrid artificial neural network, the biogeography-based optimization algorithm, was 0.882 and 0.932, respectively. Also, the results showed that the highest value of the coefficient of determination among the different groups of effective features is related to the group of features with 10 spectra. The coefficient of determination in this case was 0.93.

1. Introduction

Fruits are foods that are rich in vitamins and are consumed among people all over the world. Different fruits grow based on the water, air, and soil of each region of the planet. Therefore, standards must be considered for the distribution of these fruits in the country or export to other countries, otherwise, they will be damaged after harvesting and this will lead to a loss of quality. In general, in order to evaluate the quality of fruits, researchers should look from two perspectives, external quality and internal quality. The external quality includes the size, weight, no damage on the skin of the fruits, and the internal quality includes the soluble solids content, total acidity, and sugar content. Measuring the external quality of the fruits requires the production of various sorting and grading machines [1,2,3]. These methods were all non-destructive methods, namely, there is no need to damage the product to determine their external quality. Unlike external quality measurement methods, most methods for measuring the internal quality of the fruits are destructive, time-consuming, and costly [4]. In recent years, various studies have been done to predict the chemical features of fruits that determine their internal quality [5]. Various methods have been proposed to non-destructively evaluate quality, including near-infrared spectroscopy [6], multi-spectral and hyperspectral imaging systems [7], nuclear magnetic resonance imaging [8,9] and X-rays [10,11]. In addition to the above-mentioned methods, visible and near-infrared (vis/NIIR) is also widely used by researchers, as one of the most successful non-destructive methods for measuring chemical components and quality characteristics of fruits and vegetables [12,13,14,15]. The visible and near-infrared (vis/NIIR) spectroscopy is applied on different fruits such as apricot [16], olive [17], pear [18], apple [19], grapefruit [20], jujube [21], and tomato [22]. Measuring the strength of the pulp of fruits is one of the applications of the visible and near-infrared (vis/NIIR) spectroscopy. Uwadaira et al. [23] provided a visible and near-infrared (vis/NIIR) spectroscopy system for the non-destructive evaluation of peach fruit. To perform the test, 40 peaches were collected from the field in Japan. For spectroscopy, the visible and near-infrared (vis/NIIR) spectrum of each sample was measured in the range of 500 to 1000 nm. After spectral measurements, the firmness and soluble solid content were measured using destructive methods from each sample. The results showed that partial least squares (PLS) regression model had a coefficient of 0.8 for firmness. Another study by Oliveira-Folador et al. [24], suggested a quick method for evaluating the quality of the passion fruit using two methods of near-infrared spectroscopy (IR) and mid-infrared (IR) spectroscopy. In total, 130 samples of passion fruit were used for testing. Finally, they provided models for predicting chemical features of fructose, titratable acidity, vitamin C (ascorbic acid), soluble solid content, sucrose, and glucose, using linear partial least squares regression analysis. The coefficient of determination of these models was in the range of 0.74 to 0.95. Color is one of the most important factors in the quality of food and especially fruits, which is a determinative factor for food taste [25,26,27]. The color of the fruits changes during the ripening stages of some fruits, like red apples and tomatoes. This color change is measured based on the chromaticity measurements expressed in color space L*a*b* [28,29] or RGB [30,31]. In this regard, Schouten et al. [32] proved that visible spectroscopy is an accurate and rapid method for detecting the amount of chlorophyll and lycopene in tomato tissue. Huang et al. [22] investigated the tomato quality using absorption and scattering of light features in the range of 300 to 550 nm using a spatially resolved diffuse reflectance technique. The evaluated features include firmness, soluble solid content, and PH. For performing the test, 600 tomatoes were used in 6 different ripening stages. The partial least squares regression model predicted the firmness, the soluble solid content, and PH with coefficients of 0.894, 0.623, and 0.769, respectively. In another, lycopene and β -carotene content of tomatoes were estimated by Chromameter and visible and near-infrared light spectra. This research was carried out by Tilahun et al. [33]. To conduct the experiment, 244 tomatoes were used in three ripening stages. At first, spectroscopy operation was performed at 500 to 1100 nm and then Lycopene and β -carotene were extracted by destructive methods. The regression coefficient between color variables (a*, a*/b*, (a*/b*)2) and measured values of lycopene and β -carotene were between 0.52 and 0.98, respectively. On the other hand, the partial least squares model of visible and near-infrared light spectra had good predictive power for lycopene and beta-carotene. In the investigated research, a part of the applications of non-destructive methods was expressed and the importance of using these methods in agriculture and food industry was proven. Therefore, in this research, two non-destructive methods are used for estimating the chlorophyll b property as a ripening index during different growth stages of red delicious apple (due to peel color changes at different ripening stages). The first method is based on the color specification and hybrid artificial neural network-the Cultural Algorithm, and the second method is based on spectral data and hybrid artificial neural network-biogeography-based optimization algorithm.

2. Materials and Methods

As stated, in this study, the color and spectral methods were used for non-destructive estimation of chlorophyll b. Figure 1 shows the flowchart of the various stages of the non-destructive estimation of the chlorophyll b content using two color and spectral methods.

2.1. Samples Used

For color and spectral analysis, 42 different samples of red delicious apple are randomly selected at various ripening stages in different gardens of Kermanshah, Iran (longitude: 7.03 E; latitude: 4.22 N). In total, 10 samples of 42 samples were related to the unripe stage (135 days after flowering of apple fruit), 9 samples were related to the half-ripe stage (145 days after flowering of apple fruit), 12 samples were related to the ripe stage (155 days after flowering of apple fruit) and 11 samples were related to the overripe stage (165 days after flowering of apple fruit). Figure 2 shows a few examples of test apples. To extract spectral features, samples were transferred to Shahid Beheshti University. After that, to extract color and chemical features of chlorophyll b, samples were transferred to the Agricultural Engineering Technical Research Center. Color data and spectra data were extracted from 5 direction on samples and then the average of them were considered as final values.

2.2. Development of Visible and Near-Infrared Light Spectroscopy System

The configuration of the spectroscopy system is one of the steps to measure the spectrum. Figure 3 shows the configuration of the visible and near-infrared light spectroscopy system.
As you can see, the mode of measurement in this research is reflective. The spectrometer EPP200NIR (StellarNet, USA) with an Indium Gallium-Arsenide (InGaAs) detector and a range of 200 nm to 1100 nm and a resolution of 1 to 3 nm was used which connected to a computer via a USB2 cable. The light source model was SLI-CAL (StellarNet, USA) and made with 20-watt tungsten halogen. A laptop with Intel Corei3CFI, 330 M at 2.13 GHz, 4 GB of RAM, and Windows 10 equipped with Spectra Wiz software is used to store the resulting spectrum in a computer. An optical fiber with two ends was used to guide light from the light source to apples and from apples to the spectrometer. Because of intense noise, 200 first wavelengths and 100 end wavelengths were eliminated, and thus the spectral range was 400 nm to 1000 nm.

2.3. Extracting Color Features

From the peel of each apple sample, three color components of L*, a*, and b* were measured using the CR-400 colorimetric device (Konika Minolta, Japan). After measuring these three components, the color purity indices (C*) and the fame angle (ha) are calculated using Equations (1) and (2), [34].
C * = [ ( a * ) 2 + ( b * ) 2 ] 1 2
h a = t a n 1 ( b a )

2.4. Extraction of Chlorophyll b

Due to the change in the value of chlorophyll b during the ripening stages of fruits, especially red delicious apple, its non-destructive estimation will be useful for predicting the ripening stage [16,35]. To measure the actual amount of chlorophyll b, the method used by Ncama et al. [20] was used. Based on this method, the formula for calculating the value of chlorophyll b is based on Equation (3).
C h l b = 21.50 A 646.8 5.10 A 663.2
where A is the absorbance of the sample at the subscript wavelengths of A. For example, A 646.8 are absorbance of the sample at 646.8 nm.

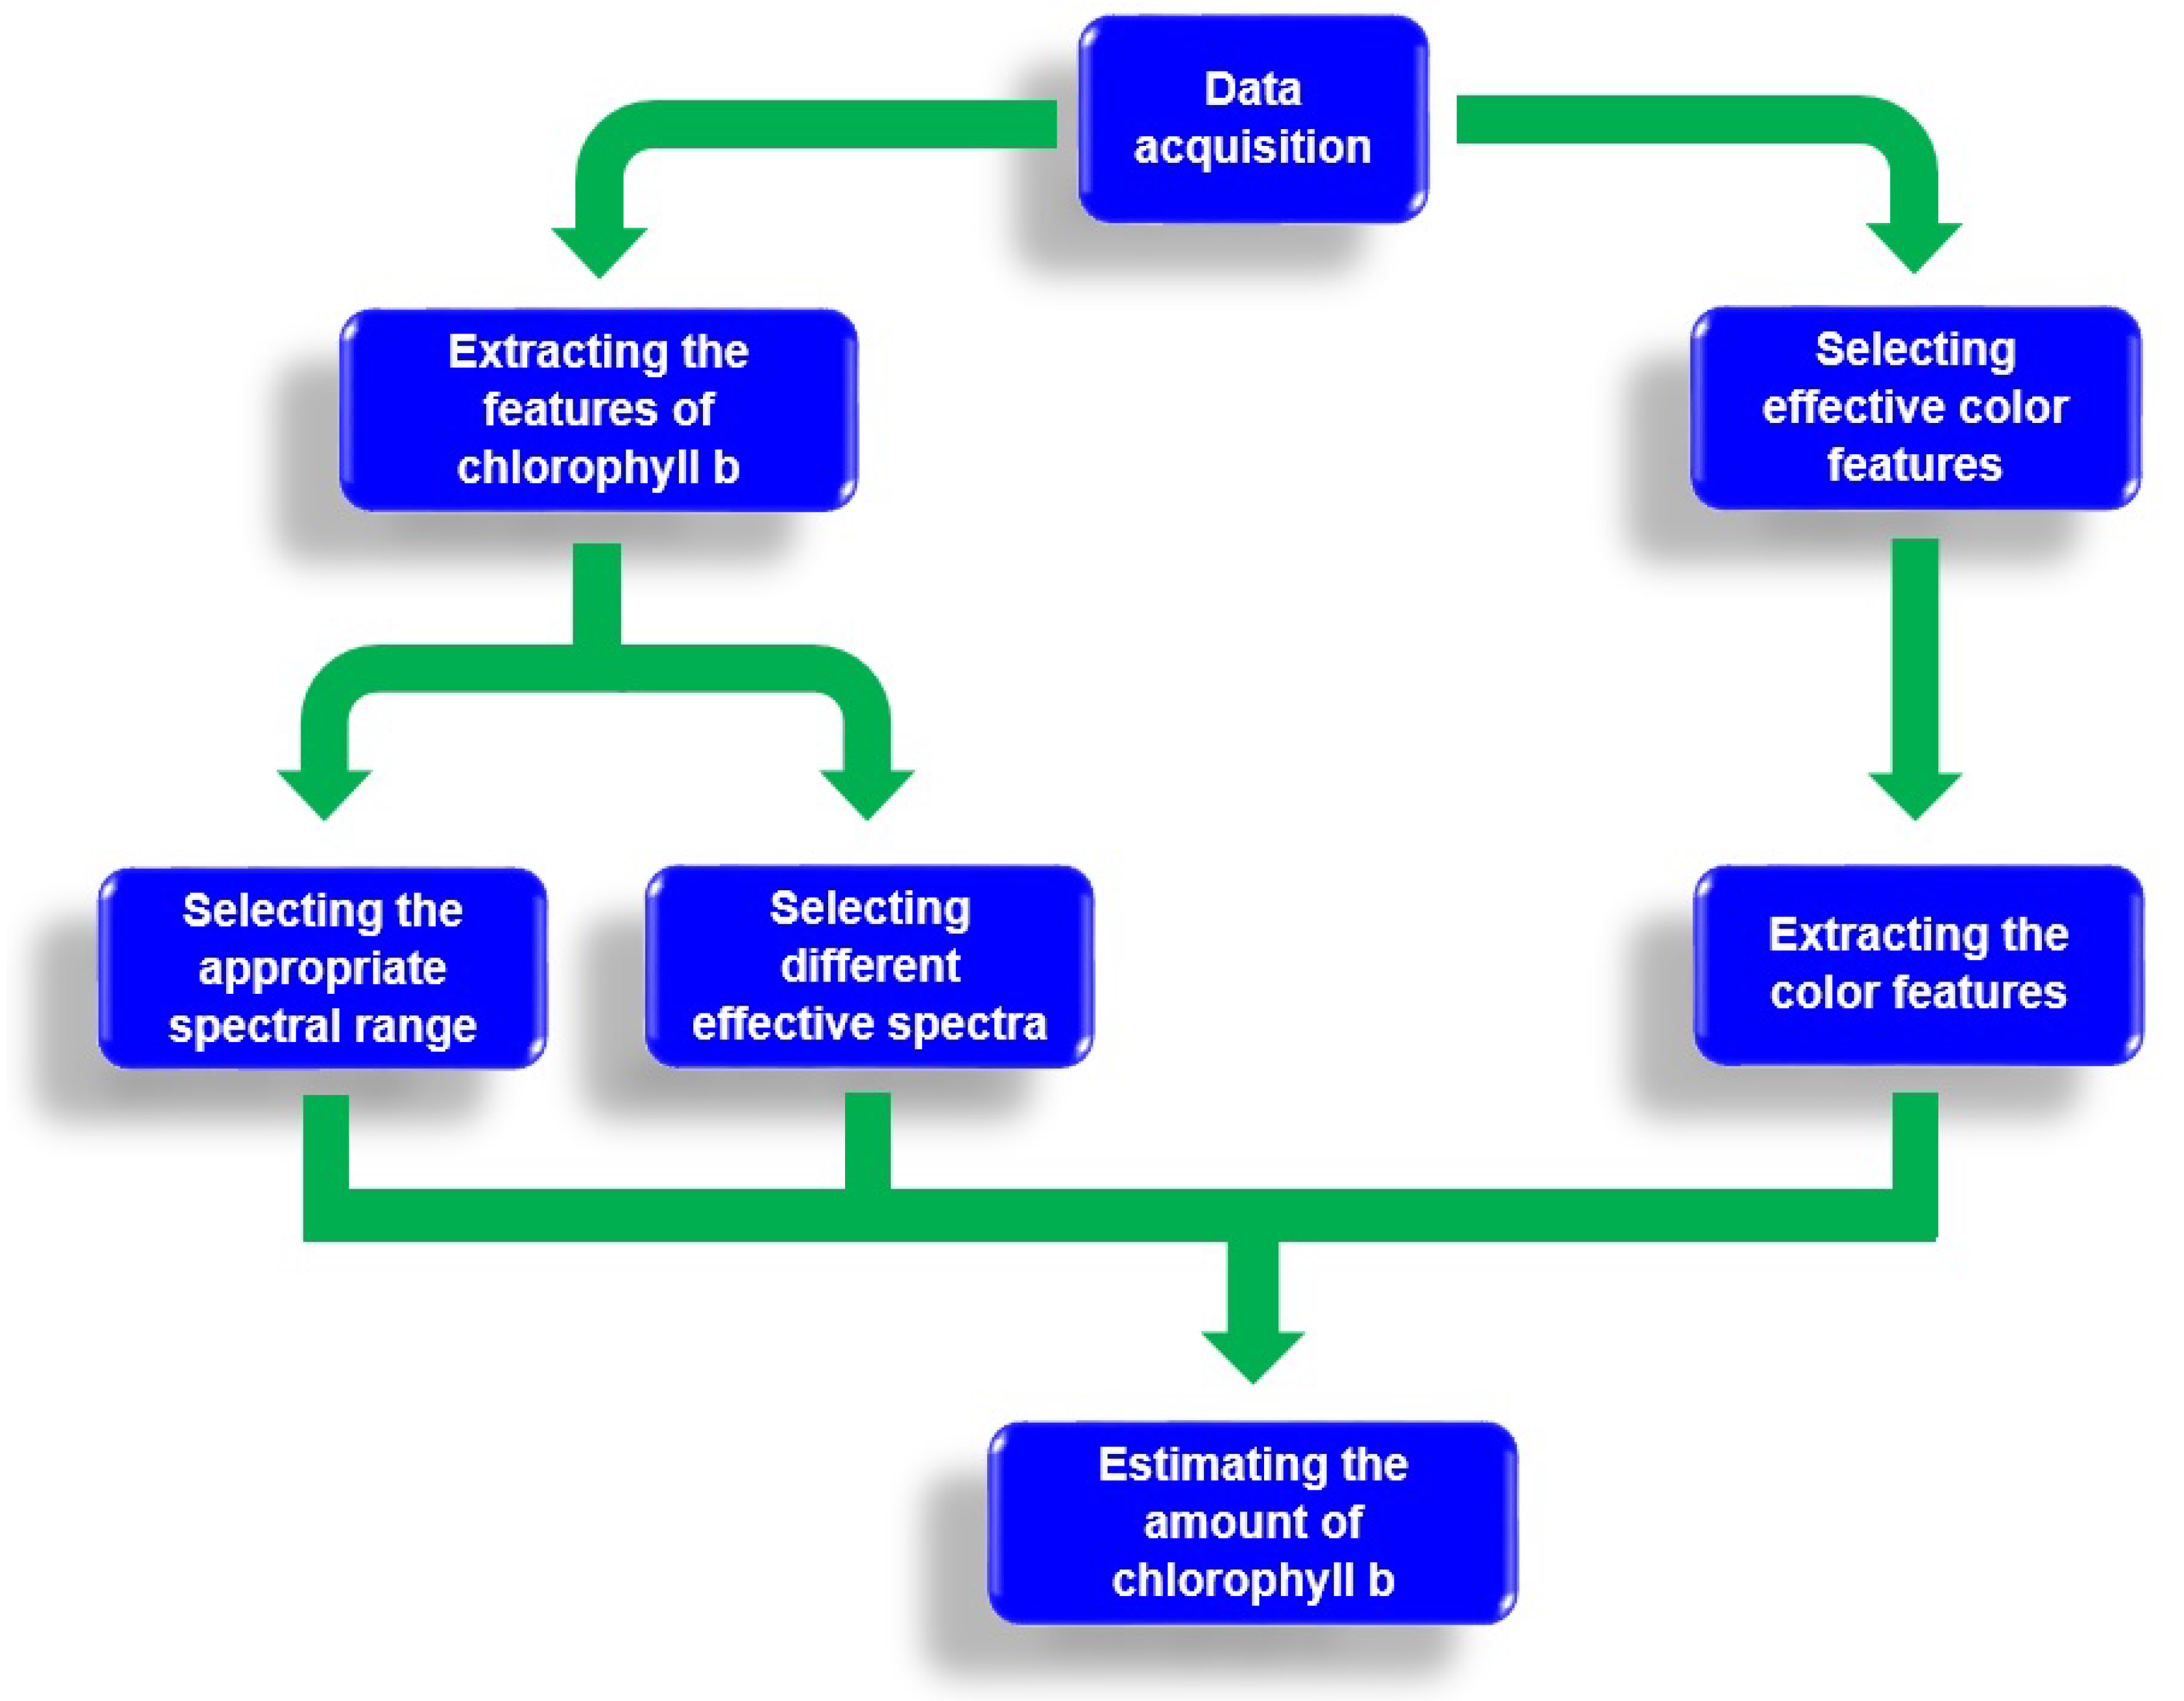
2.5. Different Hybrids of Artificial Neural Networks Used for Selecting Effective Features and Predicting Chlorophyll b

Artificial neural network-particle swarm optimization algorithm (ANN-PSO). For selecting effective color features among 5 color extracted features, hybrid ANN-PSO was used. Also, hybrid ANN-DE was used for selecting effective wavelengths among 120 extracted wavelengths. The procedure of these two hybrids is the same, but their optimization algorithm is different.
For predicting chlorophyll b based on color features and spectral data, hybrid ANN-CA and hybrid ANN-BBO were used respectively. The algorithms of CA and BBO determine the best structure of ANNs for predicting chlorophyll b. 120 wavelengths were extracted in this region and were used as inputs to hybrid ANN-BBO.

2.6. Hybrid Neural Networks Used to Select the Most Effective Color Features

After extracting different color features from each sample, some effective features to input to hybrid artificial neural network-cultural algorithm (ANN-CA) were selected for providing and estimating the amount of chlorophyll b using hybrid artificial neural network-particle swarm optimization algorithm (ANN-PSO). Particle swarm algorithm is a metaheuristic algorithm that emulates the collective movements of birds in order to optimize various issues. This algorithm was originally proposed by Kennedy and Eberhart [36]. Each answer is considered as a particle. Each particle is constantly searching and moving. The motion of each particle depends on three factors: 1. the current position of the particle; 2. the best position ever had; and 3. the best position that the whole set of particles has ever had. The procedure is that, initially, the PSO algorithm considers a vector with all extraction features, and in the next step, smaller vectors of the features, for example, vectors with 2, 3, 4, etc., members are sent as inputs to ANN with the hidden layer features shown in Table 1. The output of ANN is chlorophyll b. Each time that a vector of features is sent for ANN, the mean squared error of ANN is recorded and finally, the vector having the least-squares error is selected as the optimal vector and the characteristics of the vector are selected as effective characteristics. In this research, among the five color features extraction, two color features of a* and C* were selected as effective features.
In fact, the input of the neural network of vectors transmitted by the particle swarm optimization algorithm and its output is the chemical extraction characteristic of chlorophyll b. The neural network divides inputs in the ratio of 70% for training, 15% for validation, and 1% for testing. The mean squared error of each input vector to the multi-layer perceptron neural network is recorded and, finally, the vector with the least-squares error is selected as the optimal vector and the characteristics of the vector are selected as effective characteristics. In this research, among the five color features extraction, two color features of a* and C* were selected as effective features.

2.7. Neural Network Hybrid Used to Estimate the Amount of Chlorophyll b Using Color Features

In order to estimate the amount of chlorophyll b using color features, the hybrid artificial neural network-cultural algorithm is used. The cultural algorithm, like the genetic algorithm, performs the optimization process. In fact, in the genetic algorithm, a natural and biological evolution are considered. However, in the cultural algorithm, cultural evolution and the impact of cultural and social space are considered, which ultimately leads to a model for solving an optimization problem. In a society, every person who is famous, directly and indirectly, will have the greatest impact on cultural evolution. In fact, these people will affect the way people talk, walk, dress, and so on. The ultimate goal of this algorithm is to find these elites and develop them for cultural evolution [37]. The task of the cultural algorithm in this section is to determine the optimal values of the multilayer perceptron neural network parameters. The network has 5 adjustable parameters and, if the parameters have optimal values, the neural network will have the highest performance. These parameters include the number of neurons, the number of layers, the transfer function, the back propagation network training function, weight learning/bias back propagation function. In this study, the minimum and a maximum number of neurons in each layer could be 0 and 25, respectively. The minimum and a maximum number of layers could be 1 and 3, respectively. The transfer function for each layer is selected among the transfer functions of tansig, logsig, purelin, hardlim, compet, hardlims, netinv, poslin, radbas, satlin, satlins, softmax, tribas. Back propagation network training function is selected among trainlm, trainbfg, trainrp, traincgb, traincgf, traincgp, traincgb, trainscg, trainass, traingda, traingdx, trainb, trainbfgc, trainbr, trainbuwb, trainc, traingdm, trainr, trains. Finally, the weight learning/bias back propagation function is selected among learngdm, learngd, learncon, learnh, learnhd, learnis, learnk, learnlv1, learnlv2, learnos, learnp, learnpn, learnsom, learnsomb, learnwh. The methodology is such that at first the cultural algorithm considers a vector of the same size with the number of parameters mentioned, namely a vector with minimum four and maximum eight members. Each member represents a parameter. For example, the vector x = [8, 14, 21, tribas, satlins, logsig, trainrp, learnp] indicates that the investigated network has three hidden layers with 8, 14, and 21 neurons, the first layer transfer function of tribas, the the second layer transfer function of satlins, the third layer transfer function of logsig, the back propagation network training function of trainrp, and the weight learning/bias back propagation function of learnp. The results of each vector sent to the neural network are measured by the mean squared error. Finally, each vector with the least mean squared error is used as the optimal vector for setting the parameters of the multilayer perceptron neural network.

2.8. Neural Network Hybrid Used to Select Effective Wavelengths

A hybrid artificial neural network-differential evolution algorithm was used to select effective wavelengths. The differential evolution algorithm, like many optimization algorithms, is based on population and has a random behavior proposed by Storn and Price [38]. This algorithm consists of two main steps: initialization and evolution. While the optimization problem has no initial information, so a random population should be first created, and then, in order to optimize the problem, population members are recovered through mutation, recombination, and selection process as long as the optimization is done. The method in this case is similar to the hybrid artificial neural network-particle swarm optimization algorithm. Table 2 shows the features of the hidden layers of the multi-layer perceptron neural network used in this section.

2.9. Neural Network Hybrid Used to Estimate Chlorophyll b Content Using Spectral Data

To estimate the amount of chlorophyll b using spectral data, an artificial neural network hybrid-biogeography-based optimization algorithm is used. The biogeography-based optimization algorithm is inspired by how different animal and plant species are distributed in different parts of the world [39]. The various stages of biogeography-based optimization Algorithm 1 are described below.
Algorithm 1: Algorithm of biogeography-based optimization.
  1: Production of initial populations and sorting
  2: Determining rates of immigrant receptivity and receiving
  3: For (habitat like j)
  4: For (variable such as k in the habitat j)
  5: With the probability of immigrant receptivity in a settlement in the variable, changes are applied according to steps 6 to 8
  6: Determining the origin of immigration using immigrant receptivity values randomly
  7: Immigration from a settlement to another
  8: With a certain probability, are applied to the variable component (random changes (mutation))
  9: end for
  10: end for
  11: The set of new answers is evaluated
  12: Combining the main population (old) and the population from migration Create a new stage population
  13: If the termination conditions are not fulfilled, the algorithm will be returned to step 3
  14: End process
The method of this hybrid is similar to hybrid artificial neural network-cultural algorithm.

2.10. Parameters Used to Evaluate the Performance of Proposed Methods for Estimating the Amount of Chlorophyll b

In order to evaluate the performance of models predicting the amount of chlorophyll b by various hybrids artificial neural network, the coefficients of determination (R 2 ), sum squared error (SSE), mean absolute error (MAE), mean square error (MSE), and root mean square error (RMSE) are used [40,41].

3. Results and Discussion

3.1. Response of Apple Samples to Visible/Near-Infrared Wavelengths

Figure 4 shows the response of red delicious apple to spectra in a range of 400 to 1000 nm, in both the reflection spectrum and absorption spectra of the samples. The absorption spectrum of the sample was obtained using the log (1/R) relation, in which R is a reflection spectrum. As shown in Figure 4 with the box, there is a peak between 680 and 700 nm, which is related to the absorption of chlorophyll [42,43].

3.2. Estimation of chlorophyll b Using Color Features

As described in the materials and methods section, among the five color features extracted, two features of a* and C* are used as inputs of hybrid ANN-CA to estimate the chlorophyll b features. Table 3 shows the optimal structure of the hidden layers of the multilayer perceptron neural network set by a cultural algorithm to estimate the amount of chlorophyll b.
As can be seen, the network has three hidden layers with the characteristics of each layer. After determining the best artificial neural network structure, 1000 repetitions are used to evaluate the reliability of the predictive method. Table 4 shows the mean, standard deviation, and best performance of hybrid ANN-CA for 1000 repetitions on color data.
The criteria for evaluating the performance of the predictive method are the coefficient of determination, the sum squared error, the mean absolute error, the mean square error, the root mean square error. As the table shows, the mean coefficient of determination is 0.882 and the best value of the coefficient of determination is more than 0.99, which indicates the high performance of the method used to estimate the amount of chlorophyll b. Figure 5 shows the regression analysis of the scatter plot between the estimated mean and the actual value (measured) of the chlorophyll b content of red delicious apple (test set) using color data. Each replicate contains 13 test samples, so there will be 13,000 samples in 1000 replicates, and since there are only 42 samples, there will be more than 309 replicates per sample, the mean of which is measured.
Each replicate contains 13 test samples, so there will be 13,000 samples in 1000 replicates, and since there are only 42 samples, there will be more than 309 replicates per sample, and their average is measured. As can be seen, the regression coefficient between the mean of predicted and measured values is more than 0.977, which indicates the high performance of the proposed method for the non-destructive estimation of chlorophyll b content. Figure 6 shows a graphical example for comparing the actual value of chlorophyll b content of apple samples with a mean estimated value of chlorophyll b using color data in 1000 replicates. As can be seen, in most samples, actual values and mean estimated values of chlorophyll b are superimposed, indicating an acceptable prediction of the method used.

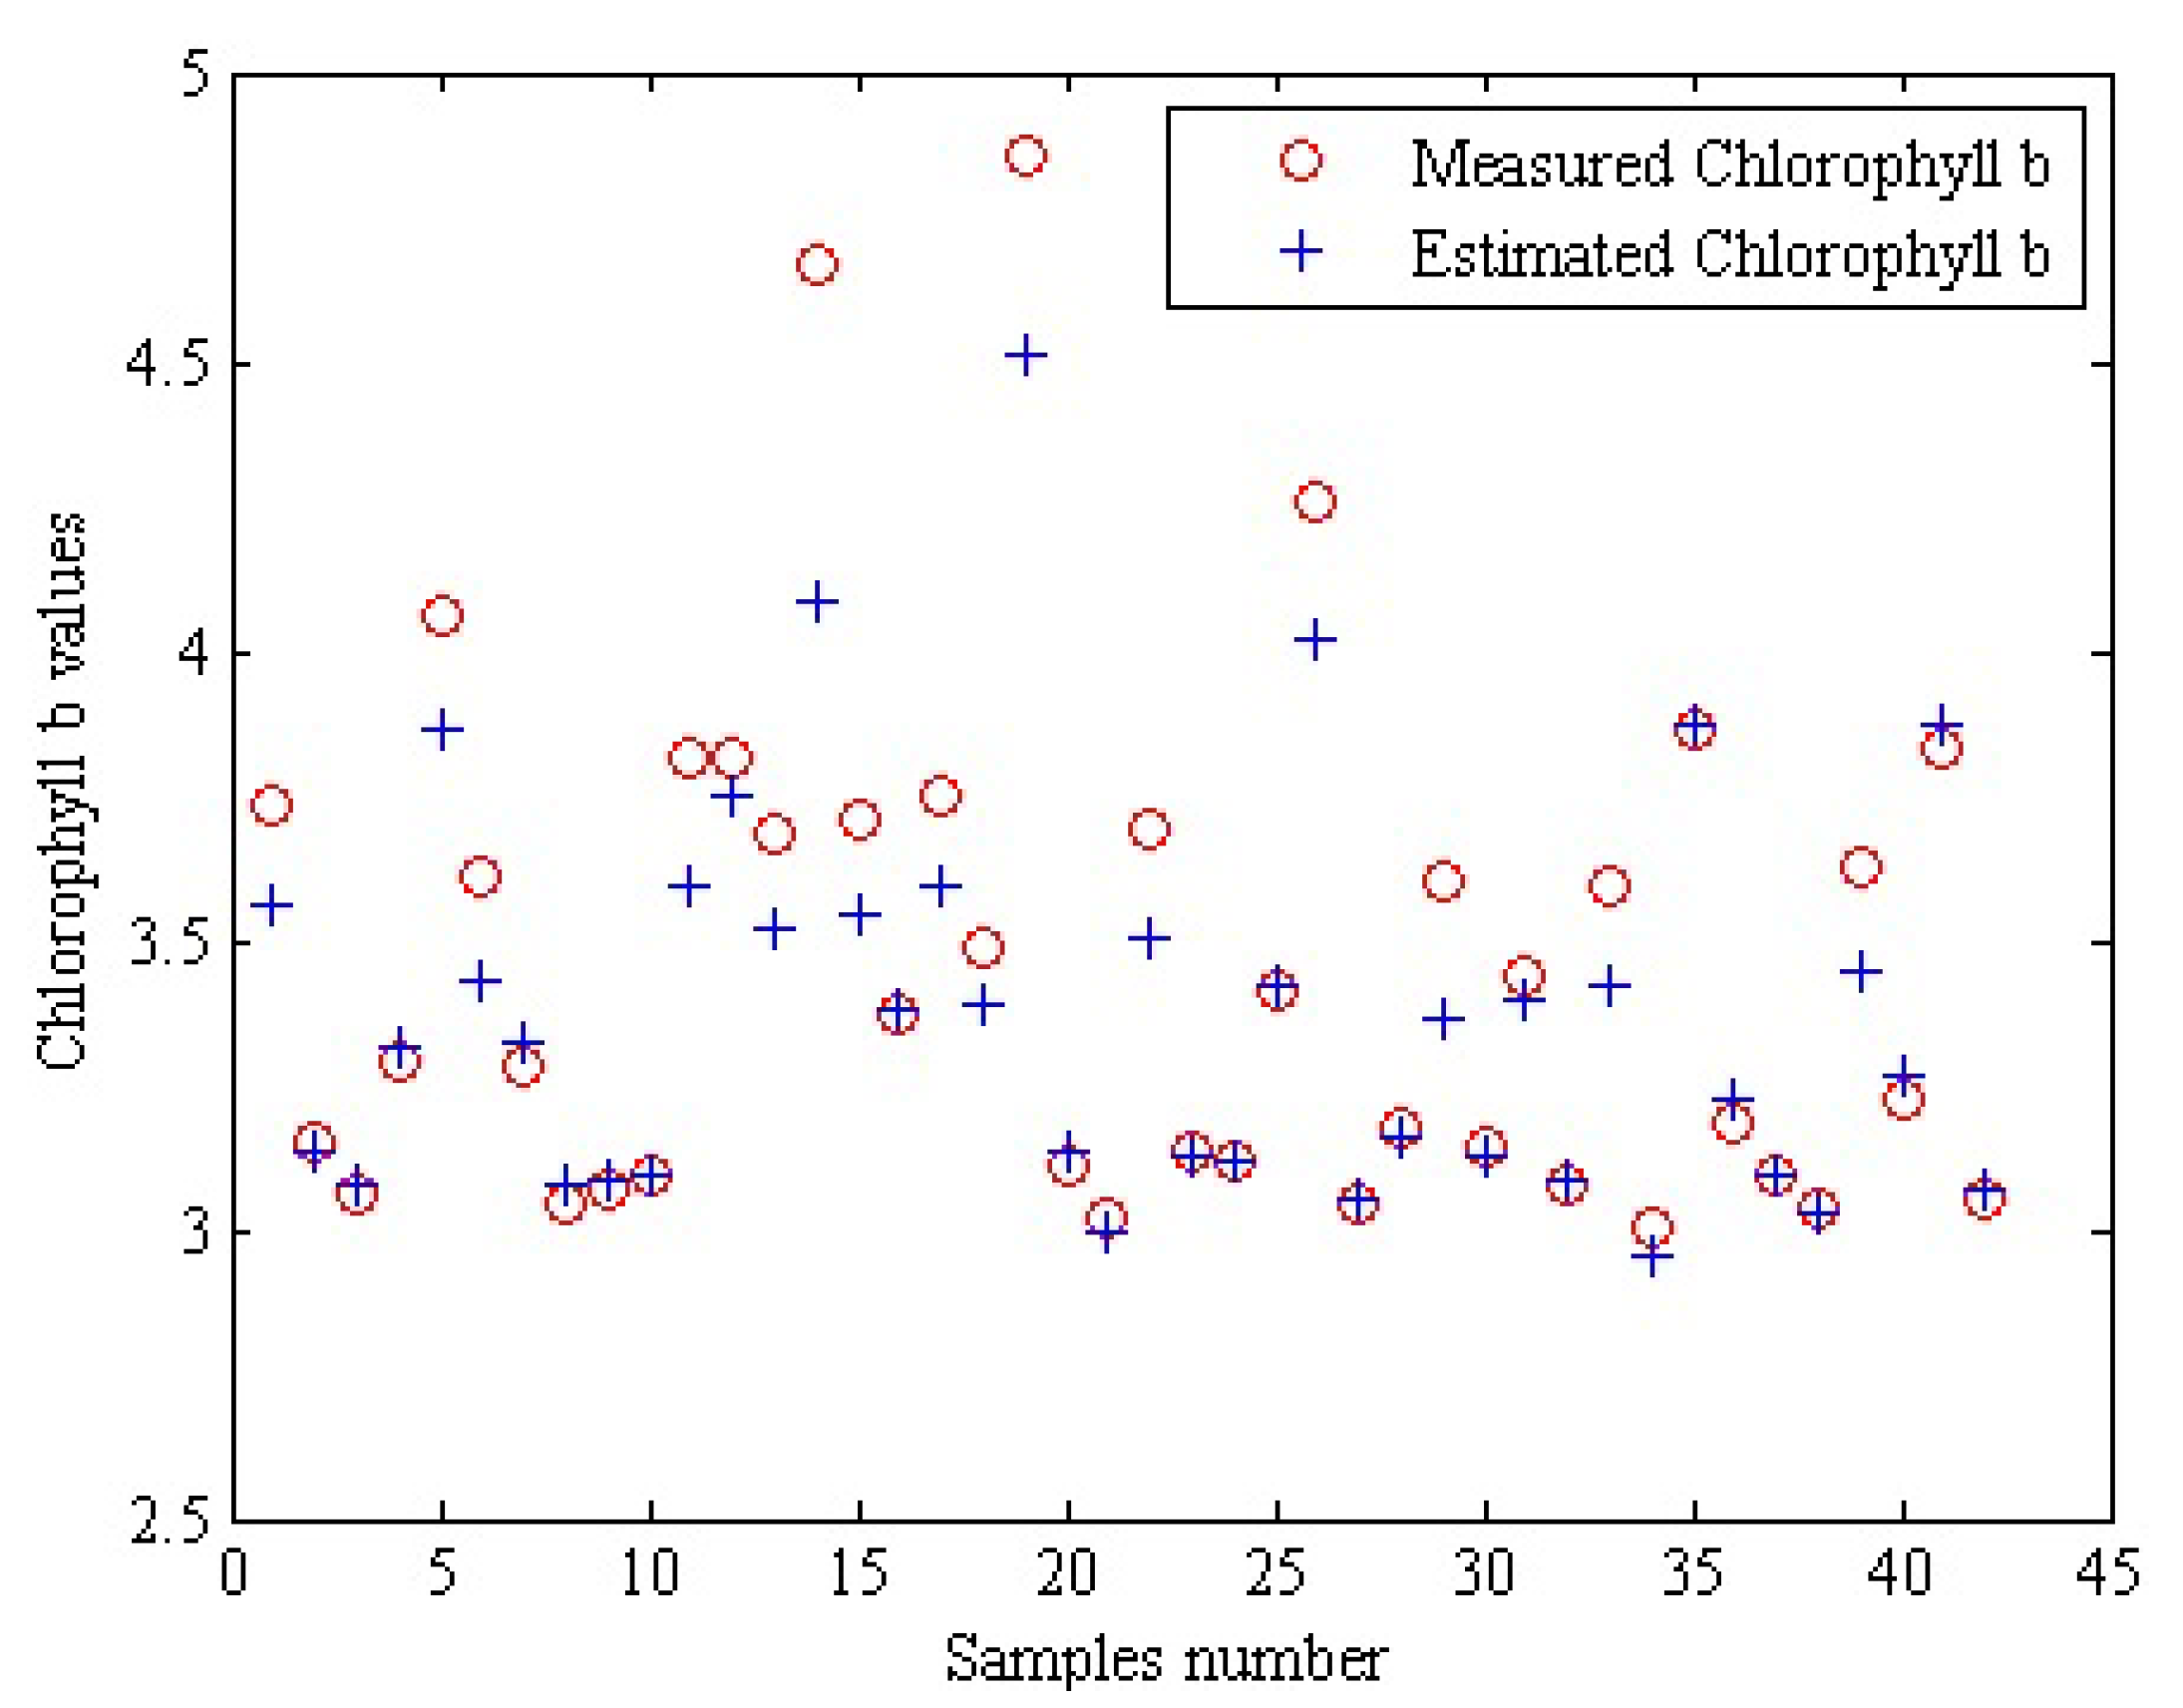
3.3. Estimation of Chlorophyll b Content Using Non-Destructive Spectroscopy Method

Table 5 shows the optimal structure of the hidden layers of the multilayer perceptron neural network set by a biogeography-based optimization algorithm to estimate the amount of chlorophyll b using spectral data. This table shows that the best artificial neural network structure has three hidden layers.
In this case, after determining the optimal structure, 1000 replications were conducted to evaluate the validity of the hybrid ANN-BBO for estimating the amount of chlorophyll b. Table 6 shows the mean, standard deviation, and best performance of hybrid ANN-BBO for 1000 repetitions on spectral data.
As can be seen, the mean values for the error and standard deviation are small, and in the best-case are close to zero, indicating a high performance of this method. Figure 7 shows the regression analysis of the scatter plot between the estimated mean in 1000 replicates and the actual value (measured) of chlorophyll b content of the red delicious apple (test set) using spectral data. The regression coefficient for this state is higher than 0.991 which indicates the high performance of the proposed method. Finally, Figure 8 shows a visual example for comparing the actual value of the chlorophyll content of apple samples with a mean estimated value in 1000 replicates using spectral data. As can be seen, in most samples, the mean estimated values of chlorophyll b are close to the actual values of the samples, which indicates the acceptable prediction of the method used. Each replicate contains 13 test samples, so there will be 13,000 samples in 1000 replicates, and since there are only 42 samples, there will be more than 309 replicates per sample, the mean of which is measured.

3.4. Analyzing the Performance of Chlorophyll b Predictive Systems Based on Color and Spectroscopy Methods

Figure 9 and Figure 10 illustrate the boxplots obtained by differentiating the actual amount of chlorophyll b and its estimated values using color and spectral data. Each replicate contains 13 test samples, so there will be 13,000 samples in 1000 replicates, and since there are only 42 samples, each sample will have more than 309 replicates. In a large number of these samples, box plots are compressed, which means that predictive methods have close results in different replicates, which indicates the reliability of the methods used. Finally, Table 7 and Table 8 show the actual value, mean, standard deviation, and predicted value of chlorophyll b content of 42 red delicious apples on the test data set using color and spectral data.
In this case, each replicate contains 13 test samples, so there will be 13,000 samples in 1000 replicates, and since there are only 42 samples, there will be more than 309 replicates per sample, the mean of which is measured.

3.5. Effective Wavelengths Selected by the Hybrid Artificial Neural Network—Differential Evolution Algorithm

It is possible to estimate the amount of chlorophyll b by developing an on-line multi-spectrum system (2–10 spectra). For this reason, in this section, different effective spectral properties are selected by a hybrid artificial neural network-differential evolution algorithm (Table 9).

3.6. The Performance of the Chlorophyll b Estimation System Based on the Effective Wavelengths Selected

After selecting different groups of effective spectra, these spectra were sent as inputs to the hybrid ANN-BBO for estimating the amount of chlorophyll b properties. Table 10 shows the mean, standard deviation, and best results of evaluation parameters of performance of hybrid ANN-BBO on the data of selected effective wavelengths in 1000 replicates. As can be seen, the highest value of the coefficient of determination for the input set with the number of effective features is 10. Of course, there is little difference between the coefficients of determination in different categories of effective features. In the same way, Figure 11 and Figure 12 show the box plots of error assessment criteria, regression coefficients, and determination of the hybrid neural network-biogeography optimization algorithm method in non-destructive estimation of the amount of chlorophyll b for 1000 replicates.
The subscript numbers show the number of effective features. As can be seen, on the one hand, the graphs are all compressed, and on the other hand, the error estimation criteria have low values and regression and determination coefficients have values close to 1. The sum of these three states indicates the high performance of the proposed method. In the end, in order to compare the performance of the proposed methods in this study, four different studies which carried out a non-destructive prediction of chlorophyll content, are used. The results of this research are shown in Table 11 in the form of regression coefficients. As can be seen, the proposed color and spectral methods in this study have higher regression coefficients than other methods.

4. Conclusions

In this paper, two color and spectral methods based on different hybrids of the artificial neural network are used to non-destructive estimation of the chlorophyll b content of red delicious apple. The most important results of this research are:
  • The cost of the configuration and set-up of the spectroscopy system is very important for real time aims. To reduce the cost of configuration, a small window of around 680 nm wavelength could be used instead of using spectroscopy over the entire visible/near-infrared range.
  • The largest peak in spectral diagrams in the visible light region is related to the chlorophyll absorption because the chlorophyll b content was predicted to be high when the coefficient was predicted using the relevant spectral data of this region.
  • There is a relationship between the color features of the apple and the amount of chlorophyll b so that the chlorophyll b values are estimated using these color features, with a coefficient of more than 0.996.
  • Performance of the spectral method is higher than the color method in terms of the determination and regression coefficients as well as the error estimation parameters.
  • When effective spectra selected by the hybrid artificial neural network-differential evolution algorithm are introduced as an input to a hybrid artificial neural network-biogeography-based algorithm, it has high regression and determination coefficients.

Author Contributions

Conceptualization, S.S. and Y.A.-G.; methodology, S.S., Y.A.-G., J.L.H.-H., M.H.-H.; and F.A.; software, S.S.; validation, S.S., Y.A.-G., J.L.H.-H., M.H.-H.; and F.A.; formal analysis, S.S., and J.L.H.-H.; investigation, S.S., Y.A.-G., J.L.H.-H., M.H.-H.; and F.A.; resources, S.S.; data curation, S.S.; writing—original draft preparation, S.S.; writing—review and editing, J.L.H.-H.; visualization, S.S.; supervision, Y.A.-G.; project administration, Y.A.-G.; funding acquisition, Y.A.-G.

Funding

This research was funded by the European Union (EU) under Erasmus+ project entitled “Fostering Internationalization in Agricultural Engineering in Iran and Russia” [FARmER] with grant number 585596-EPP-1-2017-1-DE-EPPKA2-CBHE-JP.

Acknowledgments

Authors are grateful to University of Mohaghegh Ardabili, Autonomous University of Guerrero, TecNM/Technological Institute of Chilpancingo and Agricultural Engineering Research Institute for supporting this work.

Conflicts of Interest

The authors declare no conflict of interest. The funders had no role in the design of the study; in the collection, analyses, or interpretation of data; in the writing of the manuscript, or in the decision to publish the results.

References

  1. Blasco, J.; Aleixos, N.; Moltó, E. Machine vision system for automatic quality grading of fruit. Biosyst. Eng. 2003, 85, 415–423. [Google Scholar] [CrossRef]
  2. Leemans, V.; Magein, H.; Destain, M.F. AE—Automation and emerging technologies: On-line fruit grading according to their external quality using machine vision. Biosyst. Eng. 2002, 83, 397–404. [Google Scholar] [CrossRef]
  3. Kondo, N.; Ahmad, U.; Monta, M.; Murase, H. Machine vision based quality evaluation of Iyokan orange fruit using neural networks. Comput. Electron. Agric. 2000, 29, 135–147. [Google Scholar] [CrossRef]
  4. Liu, Y.; Sun, X.; Zhang, H.; Aiguo, O. Nondestructive measurement of internal quality of Nanfeng mandarin fruit by charge coupled device near infrared spectroscopy. Comput. Electron. Agric. 2010, 71, S10–S14. [Google Scholar] [CrossRef]
  5. Arendse, E.; Fawole, O.A.; Magwaza, L.S.; Opara, U.L. Non-destructive prediction of internal and external quality attributes of fruit with thick rind: A review. J. Food Eng. 2018, 217, 11–23. [Google Scholar] [CrossRef]
  6. Nicolai, B.M.; Beullens, K.; Bobelyn, E.; Peirs, A.; Saeys, W.; Theron, K.I.; Lammertyn, J. Nondestructive measurement of fruit and vegetable quality by means of NIR spectroscopy: A review. Postharvest Biol. Technol. 2007, 46, 99–118. [Google Scholar] [CrossRef]
  7. Gowen, A.; O’Donnell, C.; Cullen, P.; Downey, G.; Frias, J. Hyperspectral imaging—An emerging process analytical tool for food quality and safety control. Trends Food Sci. Technol. 2007, 18, 590–598. [Google Scholar] [CrossRef]
  8. Marcone, M.F.; Wang, S.; Albabish, W.; Nie, S.; Somnarain, D.; Hill, A. Diverse food-based applications of nuclear magnetic resonance (NMR) technology. Food Res. Int. 2013, 51, 729–747. [Google Scholar] [CrossRef]
  9. Zhang, L.; McCarthy, M.J. Assessment of pomegranate postharvest quality using nuclear magnetic resonance. Postharvest Biol. Technol. 2013, 77, 59–66. [Google Scholar] [CrossRef]
  10. Donis-González, I.R.; Guyer, D.E.; Fulbright, D.W.; Pease, A. Postharvest noninvasive assessment of fresh chestnut (Castanea spp.) internal decay using computer tomography images. Postharvest Biol. Technol. 2014, 94, 14–25. [Google Scholar] [CrossRef]
  11. Magwaza, L.S.; Opara, U.L. Investigating non-destructive quantification and characterization of pomegranate fruit internal structure using X-ray computed tomography. Postharvest Biol. Technol. 2014, 95, 1–6. [Google Scholar] [CrossRef]
  12. Clément, A.; Dorais, M.; Vernon, M. Nondestructive measurement of fresh tomato lycopene content and other physicochemical characteristics using visible- NIR spectroscopy. J. Agric. Food Chem. 2008, 56, 9813–9818. [Google Scholar] [CrossRef] [PubMed]
  13. Baranska, M.; Schütze, W.; Schulz, H. Determination of lycopene and β-carotene content in tomato fruits and related products: Comparison of FT-Raman, ATR-IR, and NIR spectroscopy. Anal. Chem. 2006, 78, 8456–8461. [Google Scholar] [CrossRef] [PubMed]
  14. Pan, L.; Lu, R.; Zhu, Q.; McGrath, J.M.; Tu, K. Measurement of moisture, soluble solids, sucrose content and mechanical properties in sugar beet using portable visible and near-infrared spectroscopy. Postharvest Biol. Technol. 2015, 102, 42–50. [Google Scholar] [CrossRef]
  15. Huang, Y.; Lu, R.; Chen, K. Assessment of tomato soluble solids content and pH by spatially-resolved and conventional Vis/NIR spectroscopy. J. Food Eng. 2018, 236, 19–28. [Google Scholar] [CrossRef]
  16. Amoriello, T.; Ciccoritti, R.; Paliotta, M.; Carbone, K. Classification and prediction of early-to-late ripening apricot quality using spectroscopic techniques combined with chemometric tools. Sci. Hortic. 2018, 240, 310–317. [Google Scholar] [CrossRef]
  17. Moscetti, R.; Haff, R.P.; Monarca, D.; Cecchini, M.; Massantini, R. Near-infrared spectroscopy for detection of hailstorm damage on olive fruit. Postharvest Biol. Technol. 2016, 120, 204–212. [Google Scholar] [CrossRef]
  18. Bexiga, F.; Rodrigues, D.; Guerra, R.; Brázio, A.; Balegas, T.; Cavaco, A.M.; Antunes, M.D.; de Oliveira, J.V. A TSS classification study of ‘Rocha’pear (Pyrus communis L.) based on non-invasive visible/near infra-red reflectance spectra. Postharvest Biol. Technol. 2017, 132, 23–30. [Google Scholar] [CrossRef]
  19. Eisenstecken, D.; Stürz, B.; Robatscher, P.; Lozano, L.; Zanella, A.; Oberhuber, M. The potential of near infrared spectroscopy (NIRS) to trace apple origin: Study on different cultivars and orchard elevations. Postharvest Biol. Technol. 2019, 147, 123–131. [Google Scholar] [CrossRef]
  20. Ncama, K.; Opara, U.L.; Tesfay, S.Z.; Fawole, O.A.; Magwaza, L.S. Application of Vis/NIR spectroscopy for predicting sweetness and flavour parameters of ‘Valencia’orange (Citrus sinensis) and ‘Star Ruby’grapefruit (Citrus x paradisi Macfad). J. Food Eng. 2017, 193, 86–94. [Google Scholar] [CrossRef]
  21. Nordey, T.; Joas, J.; Davrieux, F.; Chillet, M.; Léchaudel, M. Robust NIRS models for non-destructive prediction of mango internal quality. Sci. Hortic. 2017, 216, 51–57. [Google Scholar] [CrossRef]
  22. Huang, Y.; Lu, R.; Hu, D.; Chen, K. Quality assessment of tomato fruit by optical absorption and scattering properties. Postharvest Biol. Technol. 2018, 143, 78–85. [Google Scholar] [CrossRef]
  23. Uwadaira, Y.; Sekiyama, Y.; Ikehata, A. An examination of the principle of non-destructive flesh firmness measurement of peach fruit by using VIS-NIR spectroscopy. Heliyon 2018, 4, e00531. [Google Scholar] [CrossRef] [PubMed] [Green Version]
  24. Oliveira-Folador, G.; de Oliveira Bicudo, M.; de Andrade, E.F.; Renard, C.M.G.C.; Bureau, S.; de Castilhos, F. Quality traits prediction of the passion fruit pulp using NIR and MIR spectroscopy. LWT 2018, 95, 172–178. [Google Scholar] [CrossRef]
  25. Francis, F. Quality as influenced by color. Food Qual. Prefer. 1995, 6, 149–155. [Google Scholar] [CrossRef]
  26. Crisosto, C.H.; Crisosto, G.M.; Metheney, P. Consumer acceptance of ‘Brooks’ and ‘Bing’cherries is mainly dependent on fruit SSC and visual skin color. Postharvest Biol. Technol. 2003, 28, 159–167. [Google Scholar] [CrossRef]
  27. Nisha, P.; Singhal, R.S.; Pandit, A.B. Kinetic modelling of colour degradation in tomato puree (Lycopersicon esculentum L.). Food Bioprocess Technol. 2011, 4, 781–787. [Google Scholar] [CrossRef]
  28. Hertog, M.L.; Lammertyn, J.; Desmet, M.; Scheerlinck, N.; Nicolaı, B.M. The impact of biological variation on postharvest behaviour of tomato fruit. Postharvest Biol. Technol. 2004, 34, 271–284. [Google Scholar] [CrossRef]
  29. Pinheiro, J.; Alegria, C.; Abreu, M.; Gonçalves, E.M.; Silva, C.L. Kinetics of changes in the physical quality parameters of fresh tomato fruits (Solanum lycopersicum, cv.‘Zinac’) during storage. J. Food Eng. 2013, 114, 338–345. [Google Scholar] [CrossRef]
  30. Lana, M.M.; Tijskens, L.; De Theije, A.; Hogenkamp, M.; Van Kooten, O. Assessment of changes in optical properties of fresh-cut tomato using video image analysis. Postharvest Biol. Technol. 2006, 41, 296–306. [Google Scholar] [CrossRef]
  31. Schouten, R.E.; Huijben, T.P.; Tijskens, L.; Van Kooten, O. Modelling quality attributes of truss tomatoes: Linking colour and firmness maturity. Postharvest Biol. Technol. 2007, 45, 298–306. [Google Scholar] [CrossRef]
  32. Schouten, R.E.; Farneti, B.; Tijskens, L.; Alarcón, A.A.; Woltering, E.J. Quantifying lycopene synthesis and chlorophyll breakdown in tomato fruit using remittance VIS spectroscopy. Postharvest Biol. Technol. 2014, 96, 53–63. [Google Scholar] [CrossRef]
  33. Tilahun, S.; Park, D.S.; Seo, M.H.; Hwang, I.G.; Kim, S.H.; Choi, H.R.; Jeong, C.S. Prediction of lycopene and β-carotene in tomatoes by portable chroma-meter and VIS/NIR spectra. Postharvest Biol. Technol. 2018, 136, 50–56. [Google Scholar] [CrossRef]
  34. Clerici, M.; Kallmann, C.; Gaspi, F.; Morgano, M.; Martinez-Bustos, F.; Chang, Y. Physical, chemical and technological characteristics of Solanum lycocarpum A. St.-HILL (Solanaceae) fruit flour and starch. Food Res. Int. 2011, 44, 2143–2150. [Google Scholar] [CrossRef]
  35. Costa, G.; Noferini, M.; Fiori, G.; Torrigiani, P. Use of Vis/NIR spectroscopy to assess fruit ripening stage and improve management in post-harvest chain. Fresh Prod 2009, 1, 35–41. [Google Scholar]
  36. Eberhart, R.; Kennedy, J. Particle swarm optimization. In Proceedings of the IEEE International Conference on Neural Networks, Perth, WA, Australia, 27 November–1 December 1995; Volume 4, pp. 1942–1948. [Google Scholar]
  37. Ali, M.Z.; Awad, N.H.; Suganthan, P.N.; Duwairi, R.M.; Reynolds, R.G. A novel hybrid Cultural Algorithms framework with trajectory-based search for global numerical optimization. Inf. Sci. 2016, 334, 219–249. [Google Scholar] [CrossRef]
  38. Storn, R.; Price, K. Minimizing the real functions of the ICEC’96 contest by differential evolution. In Proceedings of the IEEE International Conference on Evolutionary Computation, Nagoya, Japan, 20–22 May 1996; pp. 842–844. [Google Scholar]
  39. Simon, D. Biogeography-based optimization. IEEE Trans. Evol. Comput. 2008, 12, 702–713. [Google Scholar] [CrossRef]
  40. Sabzi, S.; Javadikia, P.; Rabani, H.; Adelkhani, A. Mass modeling of Bam orange with ANFIS and SPSS methods for using in machine vision. Measurement 2013, 46, 3333–3341. [Google Scholar] [CrossRef]
  41. Sabzi, S.; Arribas, J.I. A visible-range computer-vision system for automated, non-intrusive assessment of the pH value in Thomson oranges. Comput. Ind. 2018, 99, 69–82. [Google Scholar] [CrossRef]
  42. Cayuela, J.A. Vis/NIR soluble solids prediction in intact oranges (Citrus sinensis L.) cv. Valencia Late by reflectance. Postharvest Biol. Technol. 2008, 47, 75–80. [Google Scholar] [CrossRef]
  43. Martínez-Valdivieso, D.; Font, R.; Blanco-Díaz, M.T.; Moreno-Rojas, J.M.; Gómez, P.; Alonso-Moraga, Á.; Del Río-Celestino, M. Application of near-infrared reflectance spectroscopy for predicting carotenoid content in summer squash fruit. Comput. Electron. Agric. 2014, 108, 71–79. [Google Scholar] [CrossRef]
  44. Adebayo, S.E.; Hashim, N.; Abdan, K.; Hanafi, M.; Mollazade, K. Prediction of quality attributes and ripeness classification of bananas using optical properties. Sci. Hortic. 2016, 212, 171–182. [Google Scholar] [CrossRef]
  45. Betemps, D.L.; Fachinello, J.C.; Galarça, S.P.; Portela, N.M.; Remorini, D.; Massai, R.; Agati, G. Non-destructive evaluation of ripening and quality traits in apples using a multiparametric fluorescence sensor. J. Sci. Food Agric. 2012, 92, 1855–1864. [Google Scholar] [CrossRef] [PubMed]
  46. Kuckenberg, J.; Tartachnyk, I.; Noga, G. Evaluation of fluorescence and remission techniques for monitoring changes in peel chlorophyll and internal fruit characteristics in sunlit and shaded sides of apple fruit during shelf-life. Postharvest Biol. Technol. 2008, 48, 231–241. [Google Scholar] [CrossRef]
Figure 1. Flowchart of different stages of non-destructive estimation of chlorophyll b content using two color and spectral methods.
Agronomy 09 00735 g001
Figure 2. Example of apples used (a,b).
Agronomy 09 00735 g002
Figure 3. Configuring the visible and near-infrared spectroscopy.
Agronomy 09 00735 g003
Figure 4. The reaction of red delicious apple to spectra in a range between 400 and 1000 nm.
Agronomy 09 00735 g004
Figure 5. Regression analysis of the scatter plot between the estimated mean and the actual value (measured) of the chlorophyll b of red delicious apple (test set) using color data.
Agronomy 09 00735 g005
Figure 6. A graphical example for comparative purposes. Comparing the actual value of chlorophyll b content of apple samples with a mean estimated value of chlorophyll b using color data in 1000 replicates.
Agronomy 09 00735 g006
Figure 7. Regression analysis of the scatter plot between the estimated mean and the actual value (measured) of chlorophyll b content of the red delicious (test set) using spectral data.
Agronomy 09 00735 g007
Figure 8. A visual example for comparative purposes. Comparing the actual value of chlorophyll b content of apple samples with a mean estimated value of chlorophyll b using spectral data in 1000 replicates.
Agronomy 09 00735 g008
Figure 9. Box plots for 42 red delicious apple using color data.
Agronomy 09 00735 g009
Figure 10. Box plots for 42 red delicious apple using spectral data.
Agronomy 09 00735 g010
Figure 11. Box plot of hybrid neural network method-biogeography-based algorithm error assessment criteria for non-destructive estimation of chlorophyll b for 1000 repetition. The subscript numbers show the number of effective features.
Agronomy 09 00735 g011
Figure 12. Box plot of regression and determination coefficients of hybrid neural network method-biogeography-based algorithm in the non-destructive estimation of chlorophyll b for 1000 repetition. The subscript numbers show the number of effective features.
Agronomy 09 00735 g012
Table 1. Hidden layers values of multi-layer perceptron neural network adjustable parameters.
ParameterValues
Number of layers2
Number of neuronsFirst layer: 11, Second layer: 15
Transfer functionFirst layer: tribas, Second layer: logsig
Backpropagation network training functiontrainscg
Backpropagation weight/bias learning functionlearnpn
Table 2. Hidden layers values of multi-layer perceptron neural network adjustable parameters.
ParameterValues
Number of layers2
Number of neuronsFirst layer: 19, Second layer: 13
Transfer functionFirst layer: radbas, Second layer: tansig
Backpropagation network training functiontraingda
Backpropagation weight/bias learning functionlearngd
Table 3. Optimal structure of multi-layer perceptron neural network hidden layers for estimating the amount of chlorophyll b. Adjustable parameters of this network are optimized by the cultural algorithm.
ParameterValues
Number of layers3
Number of neuronsFirst layer: 9, Second layer: 19, Third layer: 7
Transfer functionFirst layer: satlin, Second layer: purelin, Third layer: satlins
Backpropagation network training functiontraingdm
Backpropagation weight/bias learning functionlearncon
Table 4. Mean, standard deviation, and best performance of hybrid artificial neural network-cultural algorithm for 1000 repetitions on color data.
StatisticsMSERMSEMAESSER 2
Mean ± Standard Deviation0.051 ± 0.0540.209 ± 0.0860.144 ± 0.0550.665 ± 0.7020.882 0.047
The best result0.0020.0390.0310.0210.9931
Table 5. Optimal structure of the multilayer perceptron neural network hidden layers for estimating the amount of chlorophyll b. Adjustable parameters of this network are optimized by the biogeography-based optimization algorithm.
ParameterValues
Number of layers3
Number of neuronsFirst layer: 16, Second layer: 17, Third layer: 13
Transfer functionFirst layer: softmax, Second layer: poslin, Third layer: tansig
Backpropagation network training functiontraingbr
Backpropagation weight/bias learning functionlearnlv2
Table 6. Mean, standard deviation, and best performance of hybrid artificial neural network-biogeography-based algorithm for 1000 repetitions on spectral data.
StatisticsMSERMSEMAESSER 2
Mean ± Standard Deviation0.025 ± 0.0320.141 ± 0.0730.099 ± 0.0470.329 ± 0.4210.932 0.046
The best result0.0010.0310.0270.0130.9965
Table 7. Actual value, mean, and standard deviation of the predicted value of chlorophyll b content of 42 red delicious apple samples on the test data set using color data.
AppleMeasuredEstimatedAppleMeasuredEstimatedAppleMeasuredEstimated
NumberValueValueNumberValueValueNumberValueValue
13.733.56 ± 0.169153.713.54 ± 0.164293.603.36 ± 0.140
23.153.13 ± 0.077163.373.39 ± 0.128303.143.12 ± 0.074
33.063.08 ± 0.062173.753.59 ± 0.172313.443.40 ± 0.125
43.293.31 ± 0.102183.493.39 ± 0.117323.083.09 ± 0.077
54.063.87 ± 0.218194.863.51 ± 0.529333.593.42 ± 0.134
63.613.43 ± 0.125203.113.14 ± 0.074343.002.96 ± 0.150
73.283.32 ± 0.108213.022.99 ± 0.140353.863.87 ± 0.263
83.043.07 ± 0.068223.693.50 ± 0.157363.193.23 ± 0.093
93.073.08 ± 0.057233.133.12 ± 0.082373.093.10 ± 0.159
103.093.09 ± 0.065243.123.12 ± 0.092383.043.02 ± 0.191
113.813.59 ± 0.173253.423.43 ± 0.195393.633.45 ± 0.136
123.823.75 ± 0.227264.264.02 ± 0.241403.233.27 ± 0.110
133.693.53 ± 0.159273.043.05 ± 0.137413.833.87 ± 0.292
144.673.08 ± 0.179283.18316 ± 0.213423.063.07 ± 0.091
Table 8. Actual value, mean, and standard deviation of the predicted value of chlorophyll b content 42 red delicious apple samples on the test data set using spectral data.
AppleMeasuredEstimatedAppleMeasuredEstimatedAppleMeasuredEstimated
NumberValueValueNumberValueValueNumberValueValue
13.733.59 ± 0.167153.713.56 ± 0.188293.603.40 ± 0.119
23.153.21 ± 0.079163.373.28 ± 0.090303.143.16 ± 0.069
33.063.08 ± 0.049173.753.62 ± 0.181313.443.34 ± 0.107
43.293.28 ± 0.089183.493.33 ± 0.105323.083.09 ± 0.050
54.063.95 ± 0.249193.844.55 ± 0.328333.593.36 ± 0.121
63.613.55 ± 0.173203.113.10 ± 0.056343.002.96 ± 0.147
73.283.24 ± 0.083213.023.04 ± 0.085353.863.65 ± 0.241
83.043.07 ± 0.066223.693.56 ± 0.164363.193.22 ± 0.081
93.073.08 ± 0.069233.133.18 ± 0.228373.093.08 ± 0.058
103.093.09 ± 0.052243.123.12 ± 0.064383.043.05 ± 0.091
113.813.61 ± 0.176253.423.33 ± 0.098393.633.54 ± 0.159
123.823.66 ± 0.211264.264.06 ± 0.228403.233.28 ± 0.086
133.693.51 ± 0.154273.043.04 ± 0.089413.833.74 ± 0.239
144.674.03 ± 0.177283.18319 ± 0.069423.063.07 ± 0.079
Table 9. Effective wavelengths selected by the hybrid artificial neural network—differential evolution algorithm.
Number of Effective WavelengthsEffective Wavelengths
2687.152, 662.295
4664.006, 687.724, 673.425, 697.180
6669.428, 664.862, 680.571, 696.033, 683.431, 677.711
8683.431, 997.753, 666.287, 685.148, 674.568, 671.141, 672.283, 684.862
10662.866, 686.007, 671.997, 676.282, 696.033, 689.156, 690.015, 686.293, 693.453, 686.865
Table 10. Mean, standard deviation and best results of evaluation parameters of performance of the hybrid artificial neural network-biogeography-based algorithm on the data of selected effective wavelengths in 1000 replicates.
The Number
of Selected
Effective
Waveleghs
StatisticsMSERMSEMAESSER2
Mean ±
2Standard Deviation0.032 ± 0.0440.155 ± 0.0950.099 ± 0.0540.414 ± 0.57710.915 ± 0.106
The best result0.0060.0250.0190.0080.997
Mean ±
4Standard Deviation0.028 ± 0.1120.138 ± 0.0970.095 ± 0.0730.368 ± 0.4550.926 ± 0.087
The best result0.00070.0270.0220.0090.998
Mean ±
6Standard Deviation0.026 ± 0.0450.135 ± 0.0870.093 ± 0.0510.339 ± 0.5870.924 ± 0.094
The best result0.00070.0260.0200.0080.996
Mean ±
8Standard Deviation0.024 ± 0.0340.134 ± 0.0780.094 ± 0.0480.315 ± 0.4480.925 ± 0.090
The best result0.00100.0330.0220.0140.997
Mean ±
10Standard Deviation0.024 ± 0.0380.133 ± 0.0790.093 ± 0.0490.313 ± 0.4960.930 ± 0.08
The best result0.0010.0310.0270.0130.9965
Table 11. Comparison of the performance of proposed methods in this study with other methods in terms of non-destructive estimation of chlorophyll b content.
MethodType of FruitCoefficient of Determination
Propose method using spectral featuresApple0.998
Propose method using color featuresApple0.996
Ncama et al. [20]Grapefruit0.943
Adebayo et al. [44]Banana0.978
Betemps et al. [45]Apple0.934
Kuckenberg et al. [46]Apple0.927

