Article

Liming Positively Modulates Microbial Community Composition and Function of Sugarcane Fields

1
Key Laboratory of Sugarcane Biology and Genetic Breeding, Ministry of Agriculture, Fujian Agriculture and Forestry University, Fuzhou 350002, China
2
Province and Ministry Co-sponsored Collaborative Innovation Center of Sugar Industry, Guangxi University, Nanning 530000, China
3
College of Agricultural, Fujian Agriculture and Forestry University, Fuzhou 350002, China
*
Author to whom correspondence should be addressed.
Agronomy 2019, 9(12), 808; https://doi.org/10.3390/agronomy9120808
Submission received: 27 September 2019 / Revised: 15 November 2019 / Accepted: 18 November 2019 / Published: 26 November 2019
(This article belongs to the Section Soil and Plant Nutrition)

Abstract

:
Liming combined with an optimum quantity of inorganic fertilizer, as a soil amendment in intensive agriculture, is a viable agricultural practice in terms of improving soil nutrient status and productivity, as well as mitigating soil degradation. The chief benefits of this strategy are fundamentally dependent on soil microbial function. However, we have limited knowledge about lime’s effects on soil microbiomes and their functions, nor on its comprehensive influence on soil nutrient status and the productivity of sugarcane plantations. This study compares the impacts of lime application (1-year lime (L1), 2-year lime (L2), and no lime (CK) on microbial communities, their functions, soil nutrient status, and crop yield in a sugarcane cropping system. We employed Illumina sequencing and functional analysis (PICRUSt and FUNGuild) to decipher microbial communities and functions. In comparison with CK, lime application (L1 and L2) mitigated soil acidity, increased the level of base cations (Ca2+ and Mg2+), and improved soil nutrient status (especially through N and P) as well as soil microbial functions associated with nutrient cycling and that are beneficial to plants, thereby improving plant agronomic parameters and yield. Liming (L1 and L2) increased species richness and stimulated an abundance of Acidobacteria and Chloroflexi compared to CK. In comparison with CK, the two functional categories related to metabolism (amino acid and carbohydrate) increased in the L1 field, whereas cofactors and vitamin metabolites increased in the L2 field. Turning to fungi, compared to CK, liming enriched symbiotrophs (endophytes, ectomycorrhizae, and arbuscular mycorrhizae) and led to a reduction of saprotrophs (Zygomycota and wood saprotrophs) and pathotrophs. The observed benefits of liming were, in turn, ultimately reflected in improved sugarcane agronomic performance, such as increased stalk height and weight in the sugarcane planting system. However, the increase in the above-mentioned parameters was more prominent in the L2 field compared to the L1 field, suggesting consecutive liming could be a practical approach in terms of sustainable production of sugarcane.

1. Introduction

Sugarcane is an important commercial crop that is typically grown in tropical and subtropical regions. It has an annual global production of about 16 million tons and contributes to sugar and biofuel production [1,2,3]. In recent decades, sugarcane has accounted for 90% and 75% of the total sugar production of China and the world, respectively [4]. Fertilization is an essential agricultural practice in terms of improving nutrient storage of plants and causing simultaneous changes in soil properties and microbial communities [5,6]. Sugarcane planting systems that are based on extensive fertilization, especially nitrogen, have been adopted to increase sugarcane production to meet increasing sugar demand over the past few decades [7]. Although inorganic fertilizers have a positive impact on sugarcane yield [8], they may also have indirect adverse effects on the environment and soil quality, such as through soil acidification [9], an increase in soilborne pathogens [10], enhanced nitrification, and nitrate leaching [11]. That being so, the sugarcane planting systems based on lime supply represent a highly promising strategy in terms of mitigating soil acidification by increasing base cations (Ca2+ and Mg2+) and soil nutrient status [12,13,14], leading to higher sugarcane productivity [15]. Soil microbes not only recycle nutrients, degrade pollutants, and mineralize organic matter, but also maintain groundwater quality, thus improving ecosystem function [16,17]. Various studies on the response of soil microbial composition to lime in other planting systems have determined that limestone can increase soil biological activity and regulate soil microbial composition and function [18,19]. For example, Xun et al. [18] reported that short-term liming in a winter wheat and summer corn rotation systems can stimulate the abundance of Bacteroidetes and Alphaproteobacteria, while it can cause Actinobacteria and Betaproteobacteria to decrease. Concerning acidic soils, long-term liming helps to alleviate soil acidity, enhancing neutrophilic bacterial growth [20], microbial biomass, and soil respiration [21]. In addition, various crop systems, such as cucumber, watermelon [22], spinach [23], and tomato [24], have shown that liming effectively inhibits pathogen populations and incidence in these crops. Several studies have shown that the application of lime in sugarcane cropping systems can not only effectively alleviate soil acidification, but also improve soil nutrient status and crop productivity. Nevertheless, due to the limitations in the detection methods and the complexity of microbial metabolic pathways, information on the microbial functional properties in response to liming in sugarcane cultivation is limited. Based on high-throughput sequencing data, FUNGuild and PICRUSt have recently been developed as highly encouraging tools to predict functionality in fungal and bacterial communities [25,26]. PICRUSt has been used in the medical field to predict the consequences of diseases and drugs on human/animal bacterial metabolism [27,28]. Furthermore, this approach has been adopted to predict bacterial functional diversity in environmental ecosystems, such as soil and water [29,30]. Recently, FUNGuild was used to predict trophic modes of fungal communities in the soil ecosystem, and provided a new understanding of methods to control soil-borne pathogens through organic amendments [31]. With this in mind, these bioinformatics tools can also predict soil microbial functional diversity in response to lime application in farmland soils, thus providing an up-to-date understanding and references for future research. In this study, we employed high-throughput sequencing and functional analysis to analyze the impacts of lime fertilization on soil microbial community composition and function responses in a sugarcane planting systems. Additionally, we investigated the effects of lime addition on soil properties, microbial structure, and function, and its overall impact on crop productivity. Overall, the objective of the current study was to evaluate the effects of lime addition on soil microbial community composition and function using a multidisciplinary strategy. Assuming that lime application has an impact on soil acidification and nutrient status, we believe that (a) soil properties are considerably affected by lime, leading to shifts in soil microbial structure and diversity; and (b) these variations in microbial community composition can reflect shifts in microbial function. In addition, we hypothesized that (c) differences in microbial groups affected by lime led to shifts in plant benefits and quantities of harmful microbes, which in turn influence the sustainability and performance of agro-ecosystems.

2. Materials and Methods

2.1. Experimental Design and Sample Collection

A field experiment was conducted at the Warriors 8 Team Farm (20°49’ N, 110°27’ E) in Zhanjiang City, Guangdong Province, China. The average annual temperature and rainfall are 23.2 °C and 1500 mm, respectively. Before starting the experiment, soil pH (4.30), soil organic matter (37.62 g kg−1), total nitrogen (1.32 g kg−1), total phosphorus (0.39 g kg−1), and total potassium (0.88 g kg−1) were measured according to our previous research [5]. Sugarcane cultivar ROC22 was chosen as a test crop and was established in mid-March 2016, at a seed rate of approximately 96,000 double buds/hm2. Each treatment consisted of three replicates of an area of 24 m2 and were randomly selected at the test site. In 2016 and 2017, lime was applied in two years of sugarcane fields as follows: 1) control (CK): 0 kg/hm2 and 0 kg/hm2, respectively; 2) lime treatment 1 (L1): 0 kg/hm2 and 1500 kg/hm2, respectively; and 3) lime treatment 2 (L2): 1500 kg/hm2 and 1500 kg/hm2, respectively [32,33]. Recommended rates of urea, superphosphate, and potassium chloride were applied as sources of N, P, and K in the sugarcane fields (Table 1). Calcium superphosphate and lime were applied evenly once in base fertilizer, while urea and potassium chloride were applied in split doses (30% as a seedling stage and 70% at elongation stage of the sugarcane). On 27 December 2017 (during sugarcane maturity), for each plot, soil samples (diameter of 2.5 cm and depth of 0–20 cm) from five to seven randomly selected locations were pooled to obtain one biological replicate. All soil samples were placed individually in sterile plastic bags and delivered to the laboratory in an icebox. They were sieved through 2 mm mesh and divided into two portions. Then, one portion of each sample was air-dried to analyze soil physiochemical characteristics, and the remainder was kept at −80 °C for DNA extraction.

2.2. Measurement of Sucrose Content and Theoretical Yield

To measure the stalk height and diameter of the plants, thirty sugarcane plants were randomly selected in each field and measured with a measuring tape and Vernier caliper. An Extech Portable Sucrose Brix Refractometer (Mid-State Instruments, San Luis Obispo, CA, USA) was used to determine sucrose content, which was calculated using the formula: sucrose (%) = Brix (%) × 1.0825 − 7.703 [34]. Theoretical sugarcane production was estimated using the following equations [34]:
(a)
Single stalk weight (kg) = (stalk diameter (cm))2 × (stalk height (cm) − 30) × 1 (g/cm3) × 0.7854/1000.
(b)
Theoretical production (kg/hm2) = single stalk weight (kg) × productive stem numbers (hm2).

2.3. Measurement of Soil Chemical Properties

Soil suspension with water (1:2.5 WV−1) was prepared in order to estimate soil pH using a pH meter (PHS-3C, INESA Scientific Instrument Co., Ltd, Shanghai, China) [35]. Soil total nitrogen (TN) in the extracts was assessed using an Elemental Analyzer (Thermo Scientific™, Waltham, MA, USA). Soil available phosphorus (AP) was extracted with sodium bicarbonate and then measured using the molybdenum blue method [36]. The available nitrogen (AN) and available potassium (AK) were measured by the alkaline hydrolyzable diffusion method [37] and flame photometry method [38], respectively. Soil organic carbon content (SOC) was measured by redox titration with 0.8 mol L−1 K2Cr2O7. Exchangeable Ca2+ and Mg2+ were extracted with 1 mol L−1 NH4OAc and analyzed by atomic absorption spectrometry.

2.4. Soil DNA Extraction and PCR Amplification

For each soil sample, soil DNA was extracted using a Power Soil DNA Isolation Kit (MoBio Laboratories Inc., Carlsbad, USA) according to the manufacturer’s instructions. In order to estimate the quality and concentration of soil DNA, a NanoDrop 2000 spectrophotometer (Thermo Scientific, Waltham, MA, United States) was used. Primers 338F/806R [39,40] and SSU0817F/SSU1196R [41] were used in order to amplify 16S rRNA and 18S rRNA gene fragments, respectively. PCR conditions were 95 °C for 3 min, followed by 35 cycles of 95 °C for 30 s, 55 °C for 30 s, and 72 °C for 45 s, with a final extension at 72 °C for 10 min (GeneAmp 9700, ABI, California CA, USA). PCR reactions were carried out in triplicate in a 20 μL mixture containing 2 μL of 2.5 mM deoxyribonucleoside triphosphate (dNTPs), 4 μL of 5× Fast Pfu buffer, 0.4 μL of Fast Pfu polymerase, 0.4 μL of each primer (5 μM), and template DNA (10 ng).

2.5. Illumina MiSeq Sequencing

Extraction of amplicons was carried out using an AxyPrep DNA Gel Extraction Kit (Axygen Biosciences, Union City, CA, USA). Then, QuantiFluor™-ST (Promega, Madison, WI, USA) was used for quantification. Purified amplicons were pooled in equimolar and paired-end sequenced (2 × 250) on an Illumina MiSeq platform (Majorbio, Shanghai) according to the standard protocols.

2.6. Processing and Analyzing of Sequencing Data

QIIME (version 1.17) was utilized to refine the quality sequences and assign them to each sample following the standard protocol [42], as follows: (a) The 250 bp reads were truncated at any site that obtained an average quality score of <20 over a 50 bp sliding window. (b) Following exact barcode matching, reads containing ambiguous characters were removed. (c) Sequences with overlaps greater than 10 bp in size were assembled based on their overlapping sequences and the unassembled sequence reads were removed. Using UPARSE software (version 7.1), OTUs at 97% similarity cutoff were assembled, while chimeric sequences were removed and identified by UCHIME. For each OTU, representative sequences were selected and the Ribosomal Database Project classifier (RDP) [43] was used in order to annotate the taxonomic information for each representative sequence. The richness (ACE indices) [44,45], the number of observed OTUs, and diversity (Shannon indices) [46] were determined for estimating the diversity of microbial communities in every soil sample using the Mothur pipeline [47]. To determine beta diversity, an analysis of principal coordinates and a hierarchical tree of microbial communities (calculated using the Bray–Curtis measure) was carried out. Linear discriminant analysis effect size (LEfSe) was performed to identify significant differences in microbial taxa between groups. The Kruskal–Wallis (KW) sum-rank test was used in LEfSe analysis to detect the features with significantly different abundances between assigned classes, and then linear discriminant analysis (LDA) was performed to estimate the effect size of each feature [48]. Redundancy analysis (RDA) was performed in R (version 3.2.2) to examine the influence of soil physiochemical attributes on bacterial and fungal abundance at the phylum level. Spearman’s correlation coefficients among microbial taxa at phylum level and soil physiochemical attributes were assessed using SPSS (SPSS Inc., Chicago, IL USA). The fungal functional groups (guild) among different treatments were determined using FUNGuild v1.0 [49]. A bacterial metabolic function profile (KEGG) was generated using PICRUSt. STAMP differential analysis was performed on microbial functions (KEGG and FUNGuild) between different treatments [50].

3. Results

3.1. Sugarcane Agronomic Properties and Production

The results showed that the application of lime affected the sugarcane growth parameters (Table 2). Lime application in sugarcane fields (L1 and L2) not only improved the sucrose content and growth parameters (stalk height, diameter, and weight) of plants, but also enhanced theoretical production compared to the control field (CK). However, L1 and L2 fields had significantly increased stalk height and weight compared to CK. These results indicate that sugarcane planting systems based on lime application rather than chemical fertilization can improve plant physiological parameters and thereby increase sugarcane productivity.

3.2. Soil Physiochemical Properties

Soil physicochemical properties after harvesting in the control (CK) and lime-treated fields (L1 and L2) are shown in Figure 1. In comparison with CK, the L1 and L2 fields effectively alleviated soil acidity and increased the levels of soil nutrients, especially Ca2+, Mg2+, TN, TP, AN, and AK. Taken together, these soil physiochemical results show that a sugarcane cropping system based on lime application efficiently alleviates soil acidification and improves soil nutrient status.

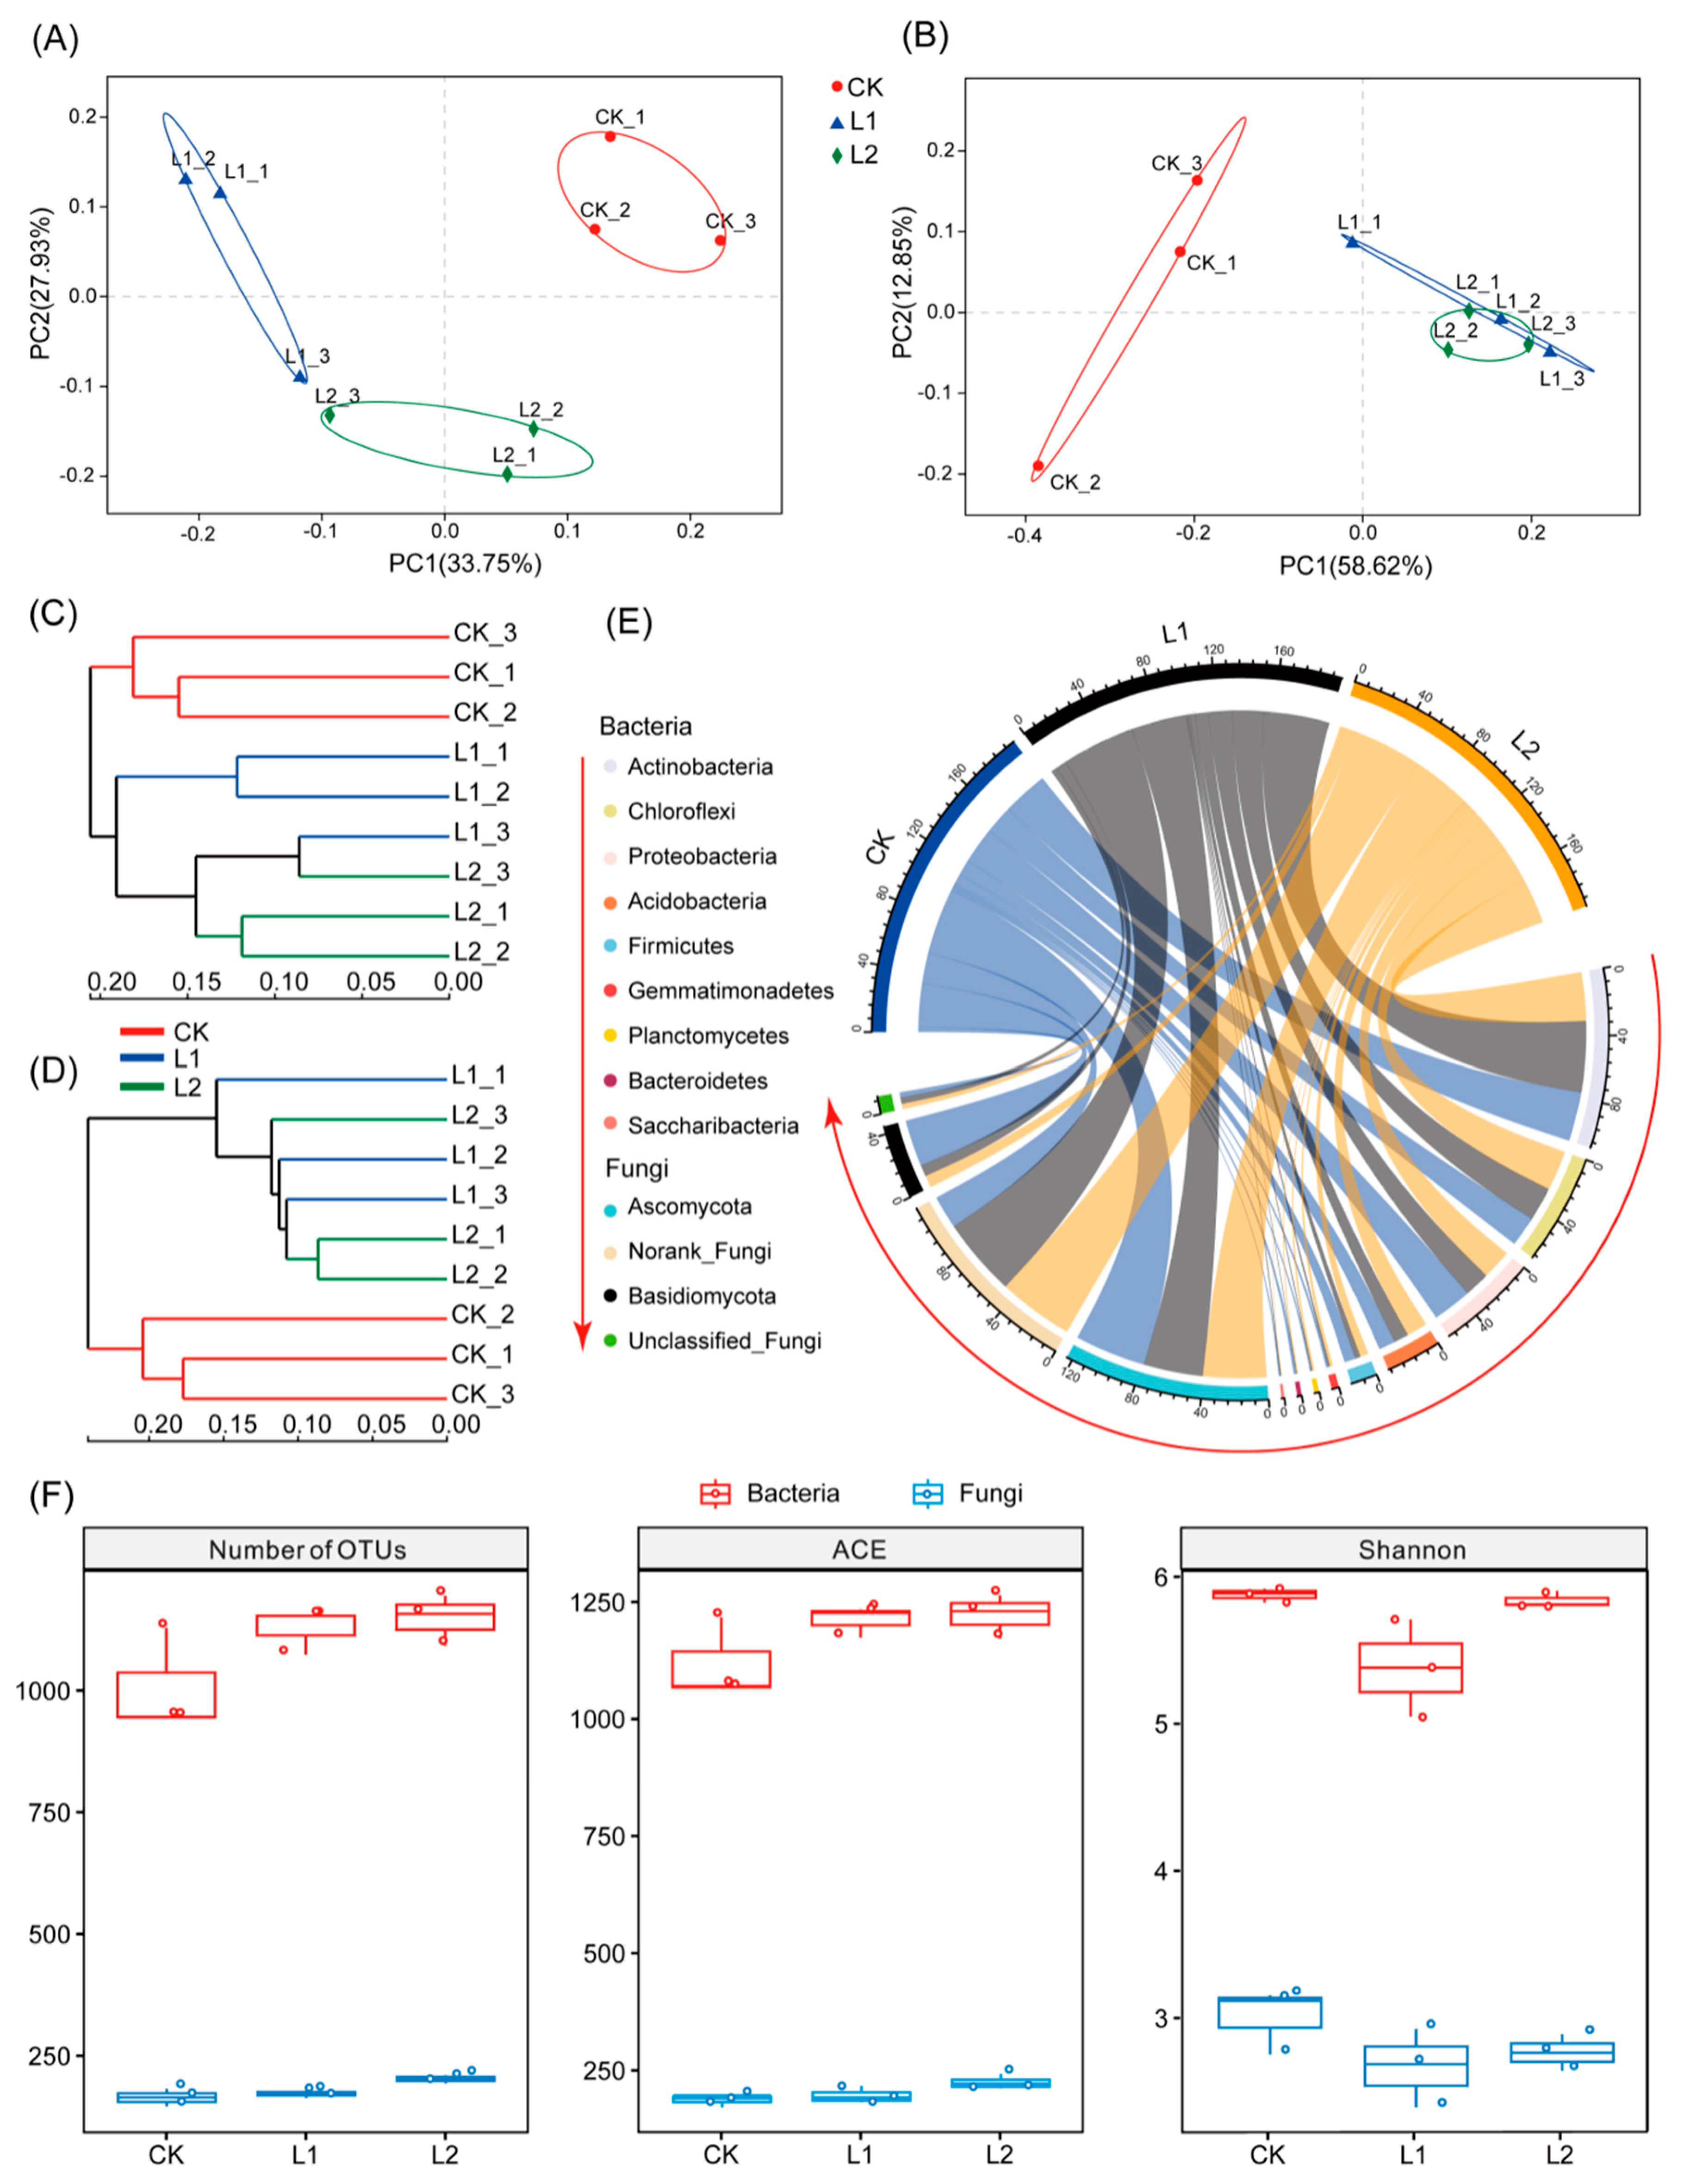
3.3. Microbial Alpha Diversity

Rarefaction analysis revealed that our population captured most microbiota members from each soil sample (Figure S1A,B). It can be seen that the curve tends to be smooth, which confirms that the sequencing depth was appropriate for determining soil microbial diversity and richness from the CK, L1, and L2 fields. In comparison with CK, the L1 and L2 fields increased microbial community richness (number of OTUs and ACE indices) and decreased microbial alpha diversity, as measured by the Shannon diversity index (Figure 2F). These results indicate that lime application not only increased microbial species richness but also reduced alpha diversity.

3.4. Microbial Beta Diversity

Principal coordinate analysis (PCoA) (of the Bray–Curtis measure) revealed different patterns in the fungal and bacterial communities of the three sugarcane fields (CK, L1 and L2), with the first two axes representing the complete alteration in fungal (71.47%) and bacterial (61.88%) data (Figure 2A,B). The linkage hierarchical clustering analysis (UPGMA, calculated for the Bray–Curtis measure) further confirmed that the microbial group patterns in L1 and L2 were separated from CK (Figure 2C,D), indicating that the lime regimes considerably shifted soil microbial community composition.

3.5. Microbial Community Composition

In the three sugarcane fields, the most dominant bacterial phyla were identified, especially Actinobacteria, followed by Proteobacteria, Chloroflexi, Acidobacteria, Firmicutes, Gemmatimonadetes, Planctomycetes, Bacteroidetes, and Saccharibacteria (Figure 2E). The dominant phyla in the microbial communities varied considerably between the different soil samples. Among them, the L2 field was significantly more enriched with Acidobacteria and Chloroflexi than compared with CK (Figure 3B and Figure S2B). However, compared to the CK field, Actinobacteria was significantly enriched in the L1 field (Figure 3A and Figure S2A). The top fungal phyla, such as Ascomycota, Norank_Fungi, and Basidiomycota, were found in CK, L1, and L2 fields. However, the L1 and L2 fields were more depleted of Ascomycota and Basidiomycota than the CK field (Figure 2E). At the bacterial genus level, the CK field was more greatly dominated by Bradyrhizobium, Burkholderia, Paraburkholderia, Sphingomonas, Acidibacter, Kitasatospora, and Variibacter than L1. However, Acidothermus, Acidibacter, Mizugakiibacter, Kitasatospora, and Sphingomonas were more dominant in CK than L2. Fungal genera, such as Boeremia and Scleroderma, were more enriched in L1 and L2 than CK, while some genera, such as Fusarium, Arthrobotrys, Galactomyces, and Cryptococcus, decreased (Figure 3C,D and Figure S2C,D).

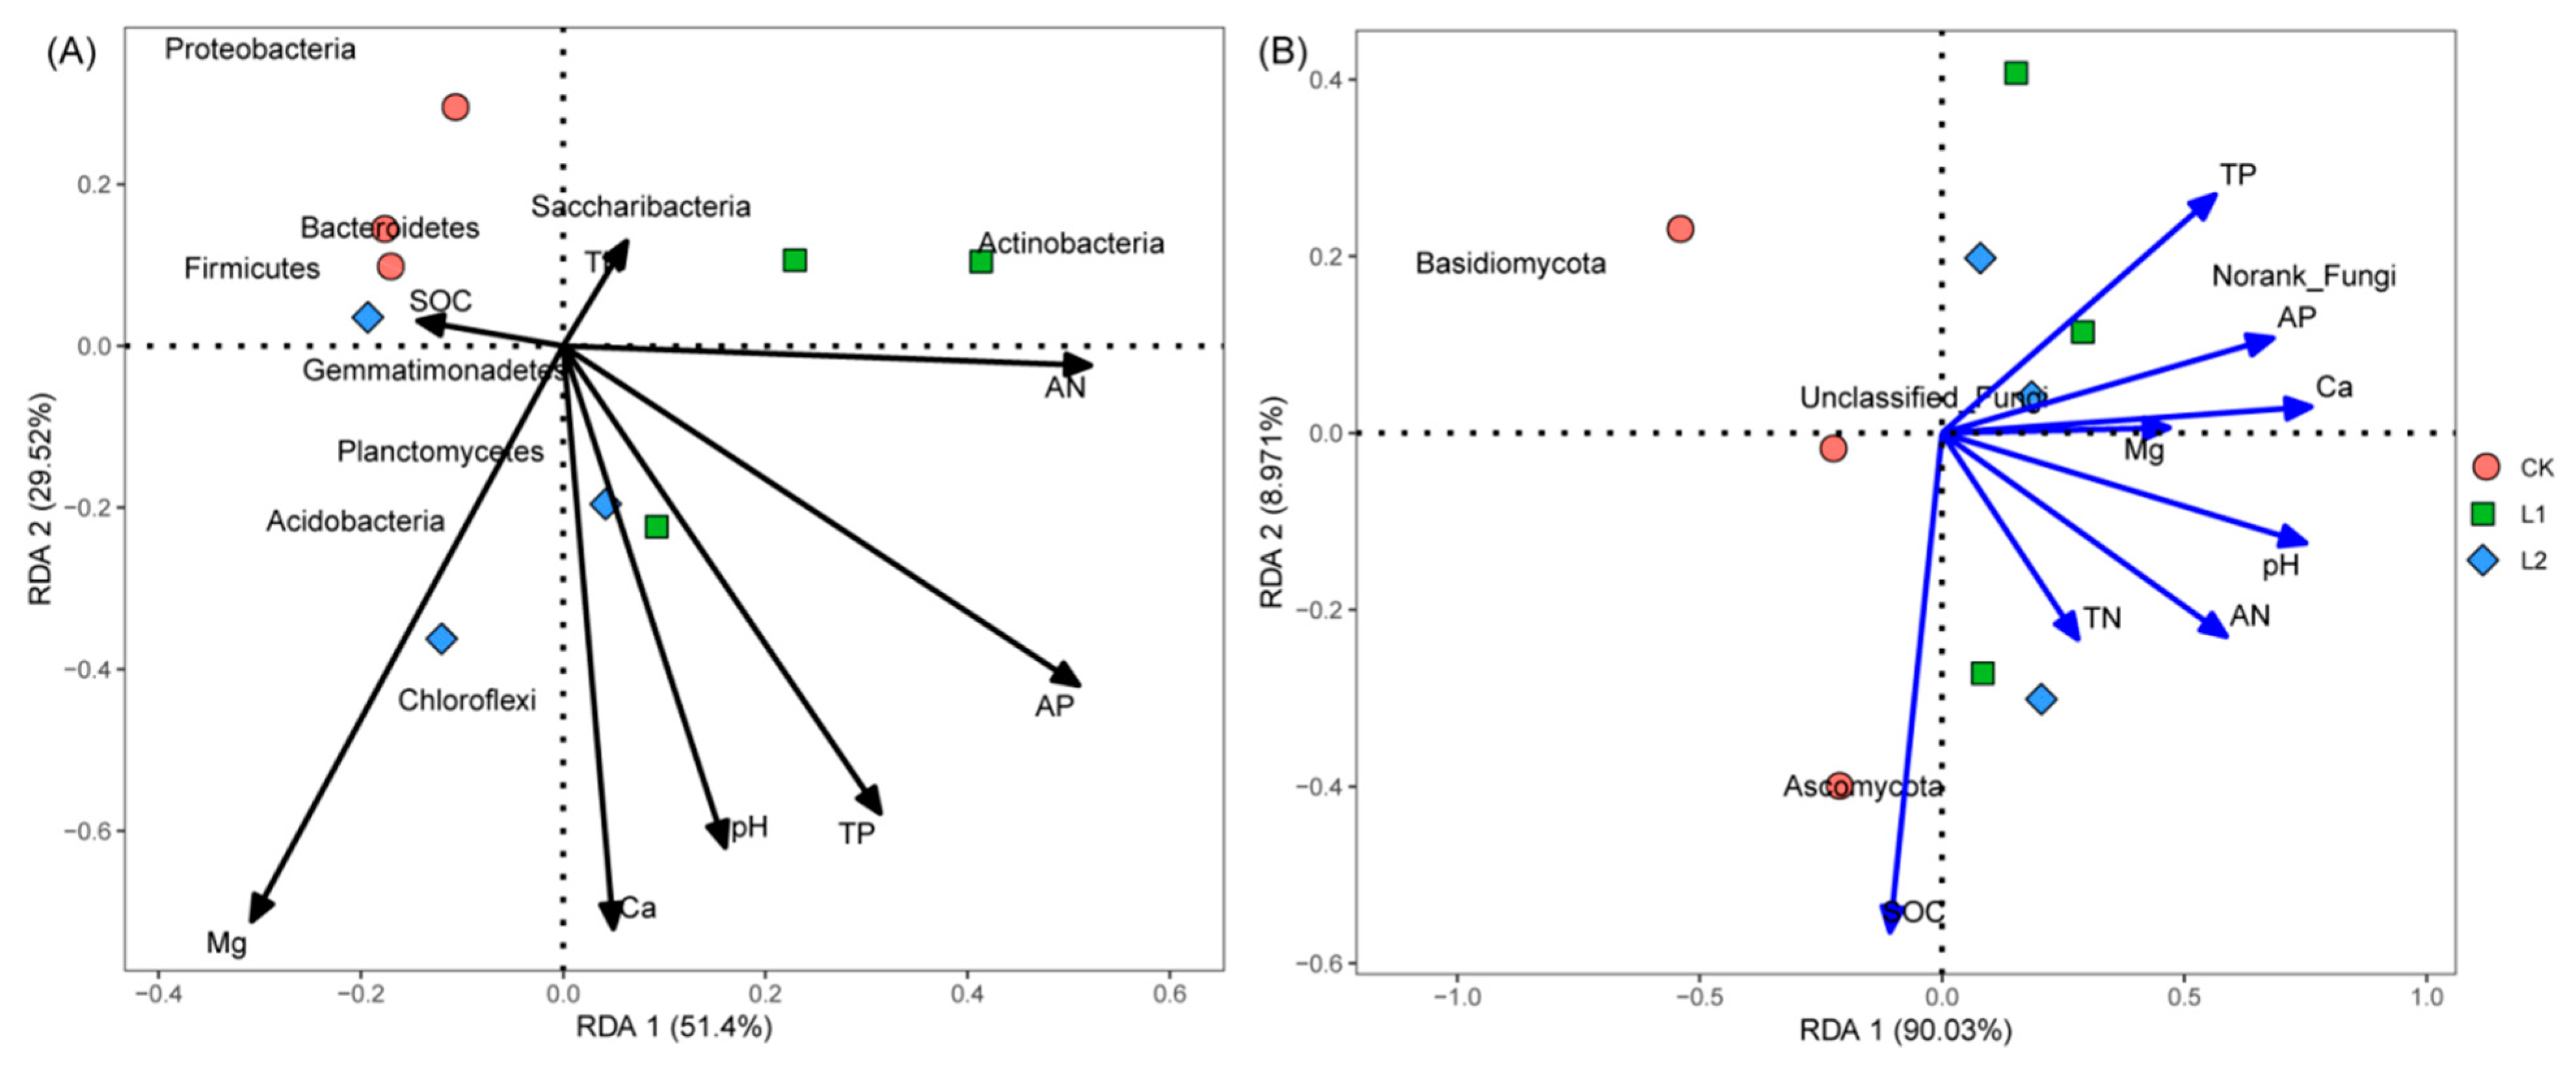
3.6. Correlation among Soil Chemical Properties and Microbial Community

Redundancy analysis (RDA) and Spearman correlation analysis were conducted to define the environmental factors influencing microbial structure. The RDA results suggested that soil pH, AN, AP, AK, Ca2+, Mg2+, SOC, TN, and TP explained 80.92% and 99.00% of the total shift in bacterial and fungal communities, respectively (Figure 4A,B). Furthermore, the L1 and L2 samples were completely separated from CK samples. For bacteria, Chloroflexi was significantly positively associated with pH, Ca2+, and Mg2+, while Actinobacteria, Gemmatimonadetes, and Planctomycetes were positively associated with Mg2+. On the other hand, Saccharibacteria was significantly negatively correlated with Ca2+ and Mg2+, while Bacteroides and Basidiomycota were significantly negatively associated with AN (Figure 4A and Figure S3A). For fungi, Ascomycota was positively associated with SOC and TN, while negatively associated with TP. Basidiomycota was positively associated with TK, while significantly negatively associated with AN (Figure 4B and Figure S3B).

3.7. Bacterial Function Analysis

By matching the sequence data with the KEGG enzyme nomenclature, unique protein genes (1007, 1127, and 1149) were identified from the bacterial metagenome in soil samples obtained from CK, L1, and L2. Most predicted protein sequences in soil samples were functionally associated with metabolism (52.75–53.27%), genetic information processing (14.92–15.31%), environmental information processing (13.91–14.42%), and cellular processes (3.35–3.57%), respectively (Figure S4). The results of the functional difference KEGG_L2 revealed that L1, L2, and CK have a difference of approximately 12 functional classifications in metabolism. For the L1 field, the two functional categories, namely, amino acid metabolism and carbohydrate metabolism, significantly (both p < 0.05) increased compared to for the CK field (Figure 5A). However, the functional category of L2 cofactors and vitamin metabolism significantly (p < 0.05) increased compared to CK (Figure 5B).

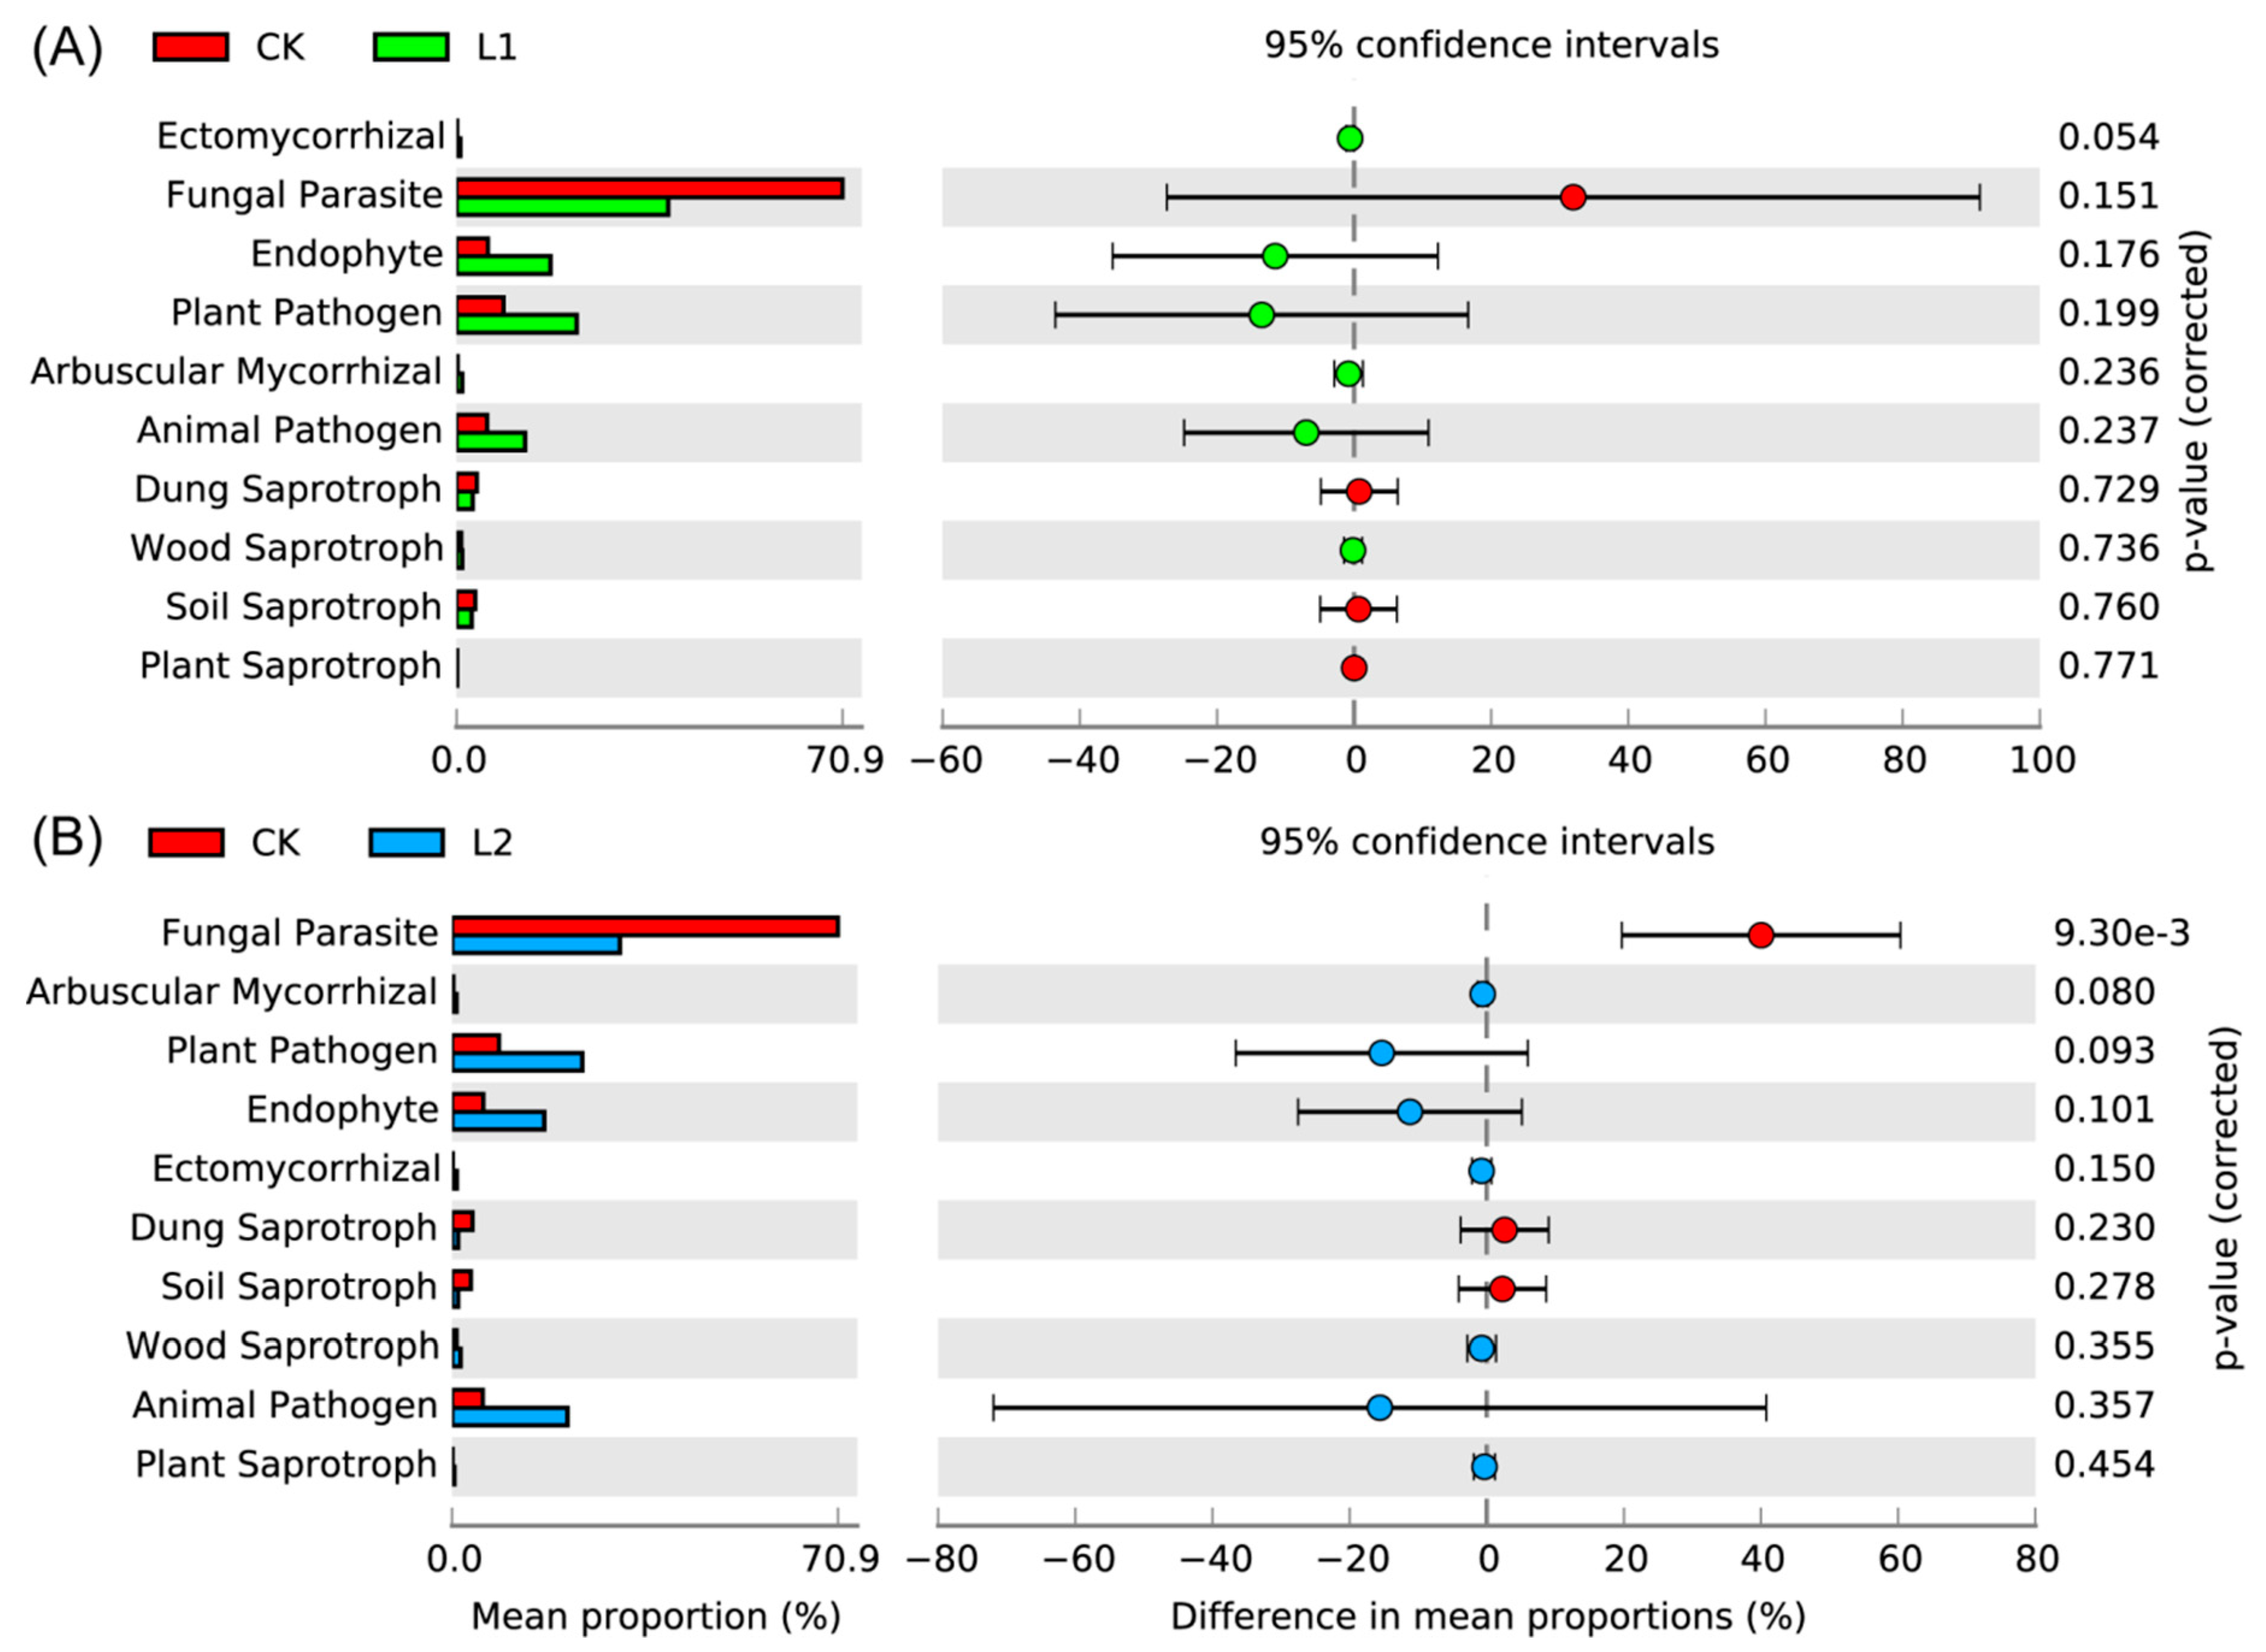
3.8. Fungal Functional Analysis

The OTUs obtained from CK, L1, and L2 were identified as trophic modes (the symbiotrophs, pathotrophs, and saprotrophs) and the remaining OTUs that did not match any taxon in the database were classified as “Others”. In comparison with the CK field, the L1 and L2 fields not only significantly enriched symbiotrophs, but also decreased saprotrophs and pathotrophs in terms of abundance (Figure S4). FUNGuild provided more comprehensive information on the trophic modes of fungal communities received from selected soils. In comparison with the CK field, the relative abundance of endophytes, ectomycorrhizas, arbuscular mycorrhizas, plant pathogens, animal pathogens, and wood saprotrophs increased in the L1 and L2 fields, while the L2 field significantly (p < 0.01) decreased fungal parasites compared to CK (Figure 6A,B). In addition, in our experiments, there was the interesting discovery that ectomycorrhizal fungi, which are usually only detected in trees, were also detected in sugarcane fields. Although their abundance was low, they were clearly detected. This is the first report of such an observation in a sugarcane field. After comparison with NCBI data, it was found that they belong to the Agaricomycetes class.

4. Discussion

Our understanding of the impacts of lime application on soil physiochemical properties, microbial composition, and productivity in the sugarcane planting system is limited. Therefore, our finding can help in understanding the impact of lime on soil acidification, fertility, and productivity, focusing on the response of soil microbial communities. Our results show that the application of lime not only improved sugarcane agronomic parameters, but also its yield (Table 2), which is consistent with previous findings that determined that liming can enhance yield and fruit quality of mango [51], sugarcane [15], and cassava [52]. In addition, liming assists in mitigating soil acidification, increasing base cations (Ca and Mg), and improving soil nutrient status (especially N and P) in a sugarcane cropping system [12,13,14,15]. In light of this, we can conclude from this study that alleviating soil acidification and improving soil nutrient status in lime-treated fields (Figure 1) may help in improving agronomic parameters and sugarcane production. In addition, soil acidity, soil nutrients (primarily N and P), and base cations (Ca and Mg) respond quickly to soil changes, so these are the most commonly used indicators for assessing soil quality [53,54,55]. Liming improved these soil quality indicators rather than soil in the control fields (Figure 1), by stimulating the growth of native soil microorganisms. This is further supported by the fact that liming increased the species richness of L1 and L2 fields compared to the CK field (Figure 2F). It appears likely that increased availability of nutrients, or a copiotrophic environment in response to lime application may lead to an increase in species richness by stimulating the copiotrophic microbial population. By contrast, the chemically fertilized field had a lower nutrient status and a higher level of soil acidification, which decreased species richness by reducing the size of the copiotrophic microbial community [56]. Similarly, multiple studies have validated that long-term lime application to acidic soils not only effectively alleviates soil acidification but also stimulates proliferation of the neutrophilic microbiome [20,21]. The positive impact of lime application on microbial biomass has been well documented in other agricultural systems [18,57]. In summary, mitigation of soil acidification and increased availability of nutrients (N and P), and accumulation of microbial biomass in soil treated with lime are expected to increase productivity. In fact, we observed that the agronomic parameters and sugarcane yield in the soil treated with lime improved compared to the control. Soil microbiota plays a crucial role in soil function and ecosystem sustainability [31,58]. Therefore, studying changes in soil microbial diversity in response to lime application can help to identify possible causes that may have a positive impact on sugarcane productivity. Changes in microbial diversity have been known as the most important indicators of ecosystem services in restoring or destroying soil functions (plant growth promotion or disease inhibition) [59,60,61]. In view of this, the application of lime could contribute to the recovery of soil function, in turn increasing sugarcane production. The application of lime in sugarcane planting systems has dramatically changed soil microbial communities (Figure 2A–D). Soil chemistry plays a vital function in structuring microbial communities [5,31]. Combined with the RDA and Spearman correlation results (Figure 4 and Figure S3), we believe that the structurally meaningful transformation of the soil microbial community can be attributed to variations in soil chemical attributes [31].
This study reveals that lime treatment has a significant influence on bacterial and fungal community composition. In comparison with CK, bacterial phyla, including Actinobacteria, Acidobacteria, Gemmatimonadetes, Planctomycetes, and Chloroflexi, were more plentiful in lime-managed fields (Figure 2E). Members associated with Acidobacteria are stimulated at higher soil pH and can contribute significantly to carbon cycling [62] and the elimination of Fusarium wilt diseases [63,64]. Taxa belonging to Chloroflexi are anoxygenic phototrophs [65] and help in the nitrification process [66]. Planctomycetes are anammox bacteria and play an essential role in the nitrogen and carbon cycle [67]. Members associated with Actinobacteria are potential biocontrol agents and can interact with plants and promote their growth [68]. Arafat et al. [58] have found that an increase in the pH value of the soil can increase the abundance of Chloroflexi and Actinobacteria. At the genus level, lime application increased beneficial microbial taxa, such as Massilia, Sphingomonas, and Pseudarthrobacter (Figure 3). Previous investigations have determined that Massilia was an efficient and environmentally friendly bioremediation material for polycyclic aromatic hydrocarbon degradation in soil [69]. Species of the Pseudarthrobacter genus can effectively degrade crude oil and multi-benzene compounds efficiently at low temperatures [70]. Similarly, the nitrogen-fixing abilities of Sphingomonas were confirmed by an acetylene reduction assay and nifH gene detection [71]. In comparison with CK, the two functional categories, namely amino acid metabolism and carbohydrate metabolism, increased in the L1 field (Figure 5A), whereas cofactors and vitamin metabolism increased significantly in the L2 field (Figure 5B), showing a clear impact on the soil nutrient cycle. Correspondingly, a recent study showed that carbohydrate and amino acid metabolism were pH-sensitive which, in turn, had a definitive impact on the nutrient cycle [72]. The L1 and L2 fields were depleted of Ascomycota and Basidiomycota compared to the CK field (Figure 2E), and corresponding results indicate that lime application in banana plantations has led to a reduction of these fungal phyla [57]. In addition, some members associated with Zygomycota are supposed to be saprotrophs [73]. This is further supported by the fact that liming decreased the relative abundance of saprotrophs in L1 and L2 fields compared to the CK field (Figure S5). The previous findings suggest that the lower abundance of Ascomycota is mainly due to inorganic fertilization, especially nitrogen [74], and could be a reason to enhance this fungal phylum in CK. Symbiotrophic fungi are beneficial for crop quality, health, and nutrition [75,76]. However, the results of FUNGuild analysis suggested that lime application not only stimulated symbiotrophs (endophytes, ectomycorrhizas, and arbuscular mycorrhizas), but also suppressed phototrophs (fungal parasites) (Figure 5A,B). These results suggest that liming stimulated the beneficial microbial taxa associated with the soil and plant, as well as microbial functions, which, in turn, can positively influence cane growth. Furthermore, these changes were ultimately reflected in improved sugarcane agronomic performance, such as increased stalk height and weight.

5. Conclusions

Overall, our findings indicate that lime application reduced soil acidity and increased base cations (Ca2+ and Mg2+) compared to a control field, enhancing species richness and elevating microbial taxa and functions associated with plant benefits. These changes, in turn, were eventually reflected in improved agronomic parameters under lime treatment compared to the control in a sugarcane planting system, especially stalk height and weight.

Supplementary Materials

The following are available online at https://www.mdpi.com/2073-4395/9/12/808/s1.

Author Contributions

All authors contributed to the intellectual input and provided assistance to this study and manuscript preparation; Z.Y. and Z.P. designed the research and conducted the experiments; Z.P. and M.T. analyzed the data and wrote the manuscript; C.K., C.H., Z.Z. and X.W. reviewed the manuscript; Z.Y. supervised the work and approved the manuscript for publication.

Funding

This research was funded by the Modern Agricultural Industry Technology System of China (CARS-170208), the Nature Science Foundation of Fujian Province (2017J01456), and the Special Foundation for Scientific and Technological Innovation of Fujian Agriculture and Forestry University (CXZX2016172, CXZX2017349) and the Nature Science Foundation of China (31771723).

Acknowledgments

We thank Yongxin Liu and Tao Wen for providing R code. We want to praise the donor agencies of China for supporting this project.

Conflicts of Interest

The authors declare no conflicts of interest.

References

  1. Khalil, F.; Yueyu, X.; Naiyan, X.; Di, L.; Tayyab, M.; Hengbo, W.; Islam, W.; Rauf, S.; Pinghua, C. Genome characterization of Sugarcane Yellow Leaf Virus with special reference to RNAi based molecular breeding. Microb. Pathog. 2018, 120, 187–197. [Google Scholar] [CrossRef] [PubMed]
  2. Eggleston, G.; Legendre, B.; Godshall, M.A. Sugar and Other Sweeteners. In Handbook of Industrial Chemistry and Biotechnology; Springer: Berlin, Germany, 2017; pp. 933–978. [Google Scholar]
  3. Chandel, A.K.; da Silva, S.S.; Carvalho, W.; Singh, O. V Sugarcane bagasse and leaves: Foreseeable biomass of biofuel and bio-products. J. Chem. Technol. Biotechnol. 2012, 87, 11–20. [Google Scholar] [CrossRef]
  4. Zhang, M.; Govindaraju, M. Sugarcane Production in China; IntechOpen: Rijeka, Croatia, 2018. [Google Scholar]
  5. Tayyab, M.; Islam, W.; Arafat, Y.; Pang, Z.; Zhang, C.; Lin, Y.; Waqas, M.; Lin, S.; Lin, W.; Zhang, H. Effect of Sugarcane Straw and Goat Manure on Soil Nutrient Transformation and Bacterial Communities. Sustainability 2018, 10, 2361. [Google Scholar] [CrossRef]
  6. Das, S.; Adhya, T.K. Effect of combine application of organic manure and inorganic fertilizer on methane and nitrous oxide emissions from a tropical flooded soil planted to rice. Geoderma 2014, 213, 185–192. [Google Scholar] [CrossRef]
  7. Thorburn, P.J.; Biggs, J.S.; Palmer, J.; Meier, E.A.; Verburg, K.; Skocaj, D.M. Prioritizing Crop Management to Increase Nitrogen Use Efficiency in Australian Sugarcane Crops. Front. Plant Sci. 2017, 8, 1504. [Google Scholar] [CrossRef] [PubMed]
  8. De Castro, S.G.Q.; Franco, H.C.J. N-Fertilization Adjustment in Sugarcane Crop Cultivated in Intensive Mechanization. In Nitrogen in Agricultural Systems; IntechOpen: Rijeka, Croatia, 2019. [Google Scholar]
  9. Hartemink, A.E.; Wood, A.W. Sustainable land management in the tropics: The case of sugarcane plantations. In Proceedings of the 16th World Congress of Soil Science, Montpellier, France, 20–26 August 1998; p. 7. [Google Scholar]
  10. Paungfoo-Lonhienne, C.; Yeoh, Y.K.; Kasinadhuni, N.R.P.; Lonhienne, T.G.A.; Robinson, N.; Hugenholtz, P.; Ragan, M.A.; Schmidt, S. Nitrogen fertilizer dose alters fungal communities in sugarcane soil and rhizosphere. Sci. Rep. 2015, 5, 8678. [Google Scholar] [CrossRef] [PubMed]
  11. Otto, R.; Castro, S.A.Q.; Mariano, E.; Castro, S.G.Q.; Franco, H.C.J.; Trivelin, P.C.O. Nitrogen Use Efficiency for Sugarcane-Biofuel Production: What Is Next? Bioenergy Res. 2016, 9, 1272–1289. [Google Scholar] [CrossRef]
  12. De Oliveira, M.W.; Macêdo, G.A.R.; Martins, J.A.; da Silva, V.S.G.; de Oliveira, A.B. Mineral nutrition and fertilization of sugarcane. In Sugarcane-Technology and Research; IntechOpen: Rijeka, Croatia, 2017. [Google Scholar]
  13. Liu, X.Y.; Rezaei Rashti, M.; Esfandbod, M.; Powell, B.; Chen, C.R. Liming improves soil microbial growth, but trash blanket placement increases labile carbon and nitrogen availability in a sugarcane soil of subtropical Australia. Soil Res. 2018, 56, 235–243. [Google Scholar] [CrossRef]
  14. Singha, D.D. Effect of liming on the sugarcane (Saccharum officinarum) yield, juice quality and available soil nutrients in acid soil. Indian J. Agric. Sci. 2006, 76, 203–204. [Google Scholar]
  15. Daniel, J.L.P.; Santos, M.C.; Zopollatto, M.; Huhtanen, P.; Nussio, L.G. A data-analysis of lime addition on the nutritive value of sugarcane in Brazil. Anim. Feed Sci. Technol. 2013, 184, 17–23. [Google Scholar] [CrossRef]
  16. Lourenço, K.S.; Suleiman, A.K.A.; Pijl, A.; van Veen, J.A.; Cantarella, H.; Kuramae, E.E. Resilience of the resident soil microbiome to organic and inorganic amendment disturbances and to temporary bacterial invasion. Microbiome 2018, 6, 142. [Google Scholar] [CrossRef] [PubMed]
  17. Altieri, M.A. The ecological role of biodiversity in agroecosystems. Agric. Ecosyst. Environ. 1999, 74, 19–31. [Google Scholar] [CrossRef]
  18. Xun, W.; Xiong, W.; Huang, T.; Ran, W.; Li, D.; Shen, Q.; Li, Q.; Zhang, R. Swine manure and quicklime have different impacts on chemical properties and composition of bacterial communities of an acidic soil. Appl. Soil Ecol. 2016, 100, 38–44. [Google Scholar] [CrossRef]
  19. Narendrula-Kotha, R.; Nkongolo, K.K. Microbial response to soil liming of damaged ecosystems revealed by pyrosequencing and phospholipid fatty acid analyses. PLoS ONE 2017, 12, e0168497. [Google Scholar] [CrossRef] [PubMed]
  20. Kennedy, N.; Brodie, E.; Connolly, J.; Clipson, N. Impact of lime, nitrogen and plant species on bacterial community structure in grassland microcosms. Environ. Microbiol. 2004, 6, 1070–1080. [Google Scholar] [CrossRef] [PubMed]
  21. Ahmad, W.; Singh, B.; Dijkstra, F.A.; Dalal, R.C. Inorganic and organic carbon dynamics in a limed acid soil are mediated by plants. Soil Biol. Biochem. 2013, 57, 549–555. [Google Scholar] [CrossRef]
  22. Jones, J.P.; Woltz, S.S.; Everett, P.H. Effect of liming and nitrogen source on Fusarium wilt of cucumber and watermelon. In Proceedings of the Florida State Horticultural Society; 1975; Volume 88, pp. 200–203. [Google Scholar]
  23. Gatch, E.W.; du Toit, L.J. Limestone-Mediated Suppression of Fusarium Wilt in Spinach Seed Crops. Plant Dis. 2017, 101, 81–94. [Google Scholar] [CrossRef]
  24. Jones, J.P.; Woltz, S.S. Effect of soil pH and micronutrient amendments on Verticillium and Fusarium wilt of tomato. Plant Dis. Report. 1972, 56, 151. [Google Scholar]
  25. Langille, M.G.; Zaneveld, J.; Caporaso, J.G.; McDonald, D.; Knights, D.; Reyes, J.A.; Clemente, J.C.; Burkepile, D.E.; Vega Thurber, R.L.; Knight, R.; et al. Predictive functional profiling of microbial communities using 16S rRNA marker gene sequences. Nat. Biotechnol. 2013, 31, 814–821. [Google Scholar] [CrossRef]
  26. Toju, H.; Kishida, O.; Katayama, N.; Takagi, K. Networks depicting the fine-scale co-occurrences of fungi in soil horizons. PLoS ONE 2016, 11, e0165987. [Google Scholar] [CrossRef]
  27. Glymenaki, M.; Barnes, A.; O’Hagan, S.; Warhurst, G.; McBain, A.J.; Wilson, I.D.; Kell, D.B.; Else, K.J.; Cruickshank, S.M. Stability in metabolic phenotypes and inferred metagenome profiles before the onset of colitis-induced inflammation. Sci. Rep. 2017, 7, 8836. [Google Scholar] [CrossRef] [PubMed]
  28. Kang, C.; Wang, B.; Kaliannan, K.; Wang, X.; Lang, H.; Hui, S.; Huang, L.; Zhang, Y.; Zhou, M.; Chen, M.; et al. Gut microbiota mediates the protective effects of dietary capsaicin against chronic low-grade inflammation and associated obesity induced by high-fat diet. MBio 2017, 8, e00417–e00470. [Google Scholar] [CrossRef] [PubMed]
  29. Shi, L.; Huang, Y.; Zhang, M.; Yu, Y.; Lu, Y.; Kong, F. Bacterial community dynamics and functional variation during the long-term decomposition of cyanobacterial blooms in-vitro. Sci. Total Environ. 2017, 598, 77–86. [Google Scholar] [CrossRef] [PubMed]
  30. Wang, J.; Gao, Q.; Zhang, H.; Bao, J. Inhibitor degradation and lipid accumulation potentials of oleaginous yeast Trichosporon cutaneum using lignocellulose feedstock. Bioresour. Technol. 2016, 218, 892–901. [Google Scholar] [CrossRef] [PubMed]
  31. Tayyab, M.; Islam, W.; Lee, C.; Pang, Z.; Khalil, F.; Lin, S.; Lin, W.; Zhang, H. Short-Term Effects of Different Organic Amendments on Soil Fungal Composition. Sustainability 2019, 11, 198. [Google Scholar] [CrossRef]
  32. Farid, R.; Khordadpour, G. The Effect of Lime on Controlling Manganese Toxicity, Tea Yield and Quality in Sprinkler Condition. 2008. Available online: http://agris.fao.org/agris-search/search.do?recordID=IR2012049013 (accessed on 26 November 2019).
  33. Zhang, Y.; He, X.; Liang, H.; Zhao, J.; Zhang, Y.; Xu, C.; Shi, X. Long-term tobacco plantation induces soil acidification and soil base cation loss. Environ. Sci. Pollut. Res. 2016, 23, 5442–5450. [Google Scholar] [CrossRef]
  34. Lin, W.; Wu, L.; Lin, S.; Zhang, A.; Zhou, M.; Lin, R.; Wang, H.; Chen, J.; Zhang, Z.; Lin, R. Metaproteomic analysis of ratoon sugarcane rhizospheric soil. BMC Microbiol. 2013, 13, 135. [Google Scholar] [CrossRef]
  35. Bao, S.D. Methods of Soil Agricultural Chemistry Analysis; Agriculture Public House: Beijing, China, 2000. (In Chinese) [Google Scholar]
  36. Olsen, S.R. Estimation of Available Phosphorus in Soils by Extraction with Sodium Bicarbonate; U.S. Department of Agriculture: Washington, DC, USA, 1954; Volume 939, pp. 1–19.
  37. Mulvaney, R.L.; Khan, S.A. Diffusion methods to determine different forms of nitrogen in soil hydrolysates. Soil Sci. Soc. Am. J. 2001, 65, 1284–1292. [Google Scholar] [CrossRef]
  38. Pansu, M.; Gautheyrou, J. Handbook of Soil Analysis: Mineralogical, Organic and Inorganic Methods; Springer Science & Business Media: New York, NY, USA, 2007; ISBN 3540312110. [Google Scholar]
  39. Chen, C.; Zhang, J.; Lu, M.; Qin, C.; Chen, Y.; Yang, L.; Huang, Q.; Wang, J.; Shen, Z.; Shen, Q. Microbial communities of an arable soil treated for 8 years with organic and inorganic fertilizers. Biol. Fertil. Soils 2016, 52, 455–467. [Google Scholar] [CrossRef]
  40. Peiffer, J.A.; Spor, A.; Koren, O.; Jin, Z.; Green, S.; Dangl, J.L. Diversity and heritability of the maize rhizosphere microbiome under field conditions. Proc. Natl. Acad. Sci. USA 2013, 110, 6548–6553. [Google Scholar] [CrossRef]
  41. Rousk, J.; Bååth, E.; Brookes, P.C.; Lauber, C.L.; Lozupone, C.; Caporaso, J.G.; Knight, R.; Fierer, N. Soil bacterial and fungal communities across a pH gradient in an arable soil. ISME J. 2010, 4, 1340–1351. [Google Scholar] [CrossRef] [PubMed]
  42. Jiang, J.; Song, Z.; Yang, X.; Mao, Z.; Nie, X.; Guo, H.; Peng, X. Microbial community analysis of apple rhizosphere around Bohai Gulf. Sci. Rep. 2017, 7, 8918. [Google Scholar] [CrossRef] [PubMed]
  43. Wang, Q.; Garrity, G.M.; Tiedje, J.M.; Cole, J.R. Naive Bayesian classifier for rapid assignment of rRNA\nsequences into the new bacterial taxonomy. Appl. Environ. Microbiol. 2007, 73, 5261–5267. [Google Scholar] [CrossRef] [PubMed] [Green Version]
  44. Chao, A. Non-parametric estimation of the number of classes in a population. Ann. Math. Stat. 1984, 20, 265–270. [Google Scholar]
  45. Chao, A.; Lee, S.M. Estimating the number of classes via sample coverage. J. Am. Stat. Assoc. 1992, 87, 210–217. [Google Scholar] [CrossRef]
  46. Keylock, C.J. Simpson diversity and the Shannon—Wiener index as special cases of a generalized entropy. Oikos 2005, 109, 203–207. [Google Scholar] [CrossRef]
  47. Schloss, P.D.; Westcott, S.L.; Ryabin, T.; Hall, J.R.; Hartmann, M.; Hollister, E.B.; Lesniewski, R.A.; Oakley, B.B.; Parks, D.H.; Robinson, C.J.; et al. Introducing mothur: Open-source, platform-independent, community-supported software for describing and comparing microbial communities. Appl. Environ. Microbiol. 2009, 75, 7537–7541. [Google Scholar] [CrossRef] [Green Version]
  48. Segata, N.; Izard, J.; Waldron, L.; Gevers, D.; Miropolsky, L.; Garrett, W.S.; Huttenhower, C. Metagenomic biomarker discovery and explanation. Genome Biol. 2011, 12, R60. [Google Scholar] [CrossRef] [Green Version]
  49. Nguyen, N.H.; Song, Z.; Bates, S.T.; Branco, S.; Tedersoo, L.; Menke, J.; Schilling, J.S.; Kennedy, P.G. FUNGuild: An open annotation tool for parsing fungal community datasets by ecological guild. Fungal Ecol. 2016, 20, 241–248. [Google Scholar] [CrossRef]
  50. Parks, D.H.; Tyson, G.W.; Hugenholtz, P.; Beiko, R.G. STAMP: Statistical analysis of taxonomic and functional profiles. Bioinformatics 2014, 30, 3123–3124. [Google Scholar] [CrossRef] [Green Version]
  51. Bal, S.C.; Nayak, R.K.; Sahu, S.K. Effect of major nutrients (NPK) and lime on growth, yield and quality of mango cv Latsundari grown in acid lateritc soil of Bhubaneswar, Orissa. Environ. Ecol. 2009, 27, 1175–1177. [Google Scholar]
  52. Njoku, B.O.; Enwezor, W.O. Differential response of four cassava cultivars (Manihot esculenta) to liming of two acid soils in pot and field experiments. Field Crop. Res. 1991, 28, 163–172. [Google Scholar] [CrossRef]
  53. Chan, K.Y.; Oates, A.; Liu, D.L.; Li, G.D.; Prangnell, R.; Poile, G.J.; Conyers, M.K. A Farmer’s Guide to Increasing Soil Organic Carbon under Pastures; Industry & Investment NSW: Narrabri, Australia, 2010. [Google Scholar]
  54. Pham, T.G.; Nguyen, H.T.; Kappas, M. Assessment of soil quality indicators under different agricultural land uses and topographic aspects in Central Vietnam. Int. Soil Water Conserv. Res. 2018, 6, 280–288. [Google Scholar] [CrossRef]
  55. Siles, J.A.; Margesin, R. Abundance and Diversity of Bacterial, Archaeal, and Fungal Communities Along an Altitudinal Gradient in Alpine Forest Soils: What Are the Driving Factors? Microb. Ecol. 2016, 72, 207–220. [Google Scholar] [CrossRef] [Green Version]
  56. Hartmann, M.; Frey, B.; Mayer, J.; Mäder, P.; Widmer, F.; Ma, P. Distinct soil microbial diversity under long-term organic and conventional farming. ISME J. 2015, 9, 1177–1194. [Google Scholar] [CrossRef] [Green Version]
  57. Zhang, J.; Bei, S.; Li, B.; Zhang, J.; Christie, P.; Li, X. Organic fertilizer, but not heavy liming, enhances banana biomass, increases soil organic carbon and modifies soil microbiota. Appl. Soil Ecol. 2019, 136, 67–79. [Google Scholar] [CrossRef]
  58. Arafat, Y.; Wei, X.; Jiang, Y.; Chen, T.; Saqib, H.S.A.; Lin, S.; Lin, W. Spatial distribution patterns of root-associated bacterial communities mediated by root exudates in different aged ratooning tea monoculture systems. Int. J. Mol. Sci. 2017, 18, 1727. [Google Scholar] [CrossRef] [Green Version]
  59. Van Der Heijden, M.G.A.; Bardgett, R.D.; Van Straalen, N.M. The unseen majority: Soil microbes as drivers of plant diversity and productivity in terrestrial ecosystems. Ecol. Lett. 2008, 11, 296–310. [Google Scholar] [CrossRef]
  60. Maron, P.A.; Sarr, A.; Kaisermann, A.; Lévêque, J.; Mathieu, O.; Guigue, J.; Karimi, B.; Bernard, L.; Dequiedt, S.; Terrat, S.; et al. High microbial diversity promotes soil ecosystem functioning. Appl. Environ. Microbiol. 2018, 84, e02717–e02738. [Google Scholar] [CrossRef] [Green Version]
  61. Singh, B.K.; Quince, C.; Macdonald, C.A.; Khachane, A.; Thomas, N.; Al-soud, W.A.; Sørensen, S.J.; He, Z.; White, D.; Sinclair, A.; et al. Loss of microbial diversity in soils is coincident with reductions in some specialized functions. Environ. Microbiol. 2014, 16, 2408–2420. [Google Scholar] [CrossRef]
  62. Ward, N.L.; Challacombe, J.F.; Janssen, P.H.; Henrissat, B.; Coutinho, P.M.; Wu, M.; Xie, G.; Haft, D.H.; Sait, M.; Badger, J.; et al. Three genomes from the phylum Acidobacteria provide insight into the lifestyles of these microorganisms in soils. Appl. Environ. Microbiol. 2009, 75, 2046–2056. [Google Scholar] [CrossRef] [PubMed] [Green Version]
  63. Wei, Z.; Hu, X.; Li, X.; Zhang, Y.; Jiang, L.; Li, J.; Guan, Z.; Cai, Y.; Liao, X. The rhizospheric microbial community structure and diversity of deciduous and evergreen forests in Taihu Lake area, China. PLoS ONE 2017, 12, e0174411. [Google Scholar] [CrossRef] [PubMed]
  64. Shen, Z.; Ruan, Y.; Xue, C.; Zhong, S.; Li, R.; Shen, Q. Soils naturally suppressive to banana Fusarium wilt disease harbor unique bacterial communities. Plant Soil 2015, 393, 21–33. [Google Scholar] [CrossRef]
  65. Bryant, D.A.; Frigaard, N.U. Prokaryotic photosynthesis and phototrophy illuminated. Trends Microbiol. 2006, 14, 488–496. [Google Scholar] [CrossRef] [PubMed]
  66. Sorokin, D.Y.; Lücker, S.; Vejmelkova, D.; Kostrikina, N.A.; Kleerebezem, R.; Rijpstra, W.I.C.; Sinninghe Damsté, J.S.; Le Paslier, D.; Muyzer, G.; Wagner, M.; et al. Nitrification expanded: Discovery, physiology and genomics of a nitrite-oxidizing bacterium from the phylum Chloroflexi. ISME J. 2012, 6, 2245. [Google Scholar] [CrossRef] [PubMed] [Green Version]
  67. Mori, K.; Kamagata, Y. The challenges of studying the anaerobic microbial world. Microbes Environ. 2014, 29, 335–337. [Google Scholar] [CrossRef] [PubMed] [Green Version]
  68. Palaniyandi, S.A.; Yang, S.H.; Zhang, L.; Suh, J.W. Effects of actinobacteria on plant disease suppression and growth promotion. Appl. Microbiol. Biotechnol. 2013, 97, 9621–9636. [Google Scholar] [CrossRef] [PubMed]
  69. Lou, J.; Gu, H.; Wang, H.; An, Q.; Xu, J. Complete genome sequence of Massilia sp. WG5, an efficient phenanthrene-degrading bacterium from soil. J. Biotechnol. 2016, 218, 49–50. [Google Scholar] [CrossRef]
  70. Zhang, H.; Sun, H.; Yang, R.; Li, S.; Zhou, M.; Gao, T.; An, L.; Chen, X.; Dyson, P. Complete genome sequence of a psychotrophic Pseudarthrobacter sulfonivorans strain Ar51 (CGMCC 4.7316), a novel crude oil and multi benzene compounds degradation strain. J. Biotechnol. 2016, 231, 81–82. [Google Scholar] [CrossRef] [Green Version]
  71. Xie, C.H.; Yokota, A. Sphingomonas azotifigens sp. nov., a nitrogen-fixing bacterium isolated from the roots of Oryza sativa. Int. J. Syst. Evol. Microbiol. 2006, 56, 889–893. [Google Scholar] [CrossRef]
  72. Lewis, R.; Barth, V.; Coffey, T.; McFarland, C.; Huggins, D.; Sullivan, T. Altered Bacterial Communities in Long-Term No-Till Soils Associated with Stratification of Soluble Aluminum and Soil pH. Soil Syst. 2018, 2, 7. [Google Scholar] [CrossRef] [Green Version]
  73. Wang, J.; Song, Y.; Ma, T.; Raza, W.; Li, J.; Howland, J.G.; Huang, Q.; Shen, Q. Impacts of inorganic and organic fertilization treatments on bacterial and fungal communities in a paddy soil. Appl. Soil Ecol. 2017, 112, 42–50. [Google Scholar] [CrossRef]
  74. Nemergut, D.R.; Townsend, A.R.; Sattin, S.R.; Freeman, K.R.; Fierer, N.; Neff, J.C.; Bowman, W.D.; Schadt, C.W.; Weintraub, M.N.; Schmidt, S.K. The effects of chronic nitrogen fertilization on alpine tundra soil microbial communities: Implications for carbon and nitrogen cycling. Environ. Microbiol. 2008, 10, 3093–3105. [Google Scholar] [CrossRef] [PubMed]
  75. Igiehon, N.O.; Babalola, O.O. Biofertilizers and sustainable agriculture: Exploring arbuscular mycorrhizal fungi. Appl. Microbiol. Biotechnol. 2017, 101, 4871–4881. [Google Scholar] [CrossRef]
  76. Rouphael, Y.; Franken, P.; Schneider, C.; Schwarz, D.; Giovannetti, M.; Agnolucci, M.; De Pascale, S.; Bonini, P.; Colla, G. Arbuscular mycorrhizal fungi act as biostimulants in horticultural crops. Sci. Hortic. 2015, 196, 91–108. [Google Scholar] [CrossRef]
Figure 1. Effect of lime application on basic soil properties and nutrient contents. Boxes with the same lowercase letters indicate no significant difference between treatments based on the LSD test (p < 0.05). (A) pH, potential of Hydrogen; (B) AN, available nitrogen; (C) AP, available phosphorus; (D) AK, available potassium; (E) ACa, available calcium; (F) AMg, available magnesium; (G) SOC, organic carbon; (H) TN, total nitrogen; (I) TP, total phosphorus. CK: N, P, and K fertilization; L1: N, P, and K fertilization plus lime for 1 year; L2: N, P, and K fertilization plus lime for 2 years.
Agronomy 09 00808 g001
Figure 2. Analysis of principal coordinates and a hierarchical tree of bacterial (A,C) and fungal communities (B,D) of the Bray–Curtis measure. The Circos diagram represents the microbial composition of top phyla in three sugarcane fields (E). Values are means (n = 3). Box plots represent alpha diversity indices, including microbial community richness (observed species and ACE) and diversity (Shannon) in three sugarcane fields (F). CK: N, P, and K fertilization; L1: N, P, and K fertilization plus lime for 1 year; L2: N, P, and K fertilization plus lime for 2 years.
Agronomy 09 00808 g002
Figure 3. Cladogram indicating the phylogenetic distribution of bacterial (A,B) and fungal (C,D) lineages under different lime application years. Lineages with LDA values higher than 3.5 are displayed. Circles represent phylogenetic levels from phylum to genus from the inside outwards. Each circle’s diameter is proportional to the given taxon’s relative abundance. Differences are represented in the color of the most abundant taxa (red indicates CK, green indicates L1, blue indicates L2, and yellow are not significant).
Agronomy 09 00808 g003
Figure 4. Redundancy analysis (RDA) identified eight selected ecological variables for shaping bacterial (A) and fungal (B) communities. AN, available nitrogen; AP, available phosphorus; AK, available potassium; ACa, available calcium; AMg, available magnesium; SOC, organic carbon; TN, total nitrogen; TP, total phosphorus. CK: N, P, and K fertilization; L1: N, P, and K fertilization plus lime for 1 year; L2: N, P, and K fertilization plus lime for 2 years.
Agronomy 09 00808 g004
Figure 5. Extended error bar plots displaying significantly different predicted functional categories at level 2 detected in bacterial soil communities (p < 0.05, mean proportion, n = 3). The points explain differences within the CK, L1, and L2 fields (red, green, and blue bars, respectively); the values on the right-hand side display the p-values derived from the Welch t-test CK: N, P, and K fertilization; (A): L1: N, P, and K fertilization plus lime for 1 year; (B): L2: N, P, and K fertilization plus lime for 2 years.
Agronomy 09 00808 g005
Figure 6. Extended error bar graphs showing the significant difference of fungal functional guilds at level 2 within three sugarcane fields (p < 0.05, average proportion, n = 3). The points explain differences among the CK vs. L1 (A) and CK vs. L2 (B) fields (red, green, and blue bars, respectively); the values on the right-hand side display the p-values derived from the Welch t-test. CK: N, P, and K fertilization; L1: N, P, and K fertilization plus lime for 1 year; L2: N, P, and K fertilization plus lime for 2 years.
Agronomy 09 00808 g006
Table 1. Treatments applied to the sugarcane field in two years of the experiment (kg/hm2).
Treatment20162017
UreaCalcium SuperphosphatePotassium ChlorideQuicklimeUreaCalcium SuperphosphatePotassium ChlorideQuicklime
CK6751500525067515005250
L16751500525067515005251500
L26751500525150067515005251500
CK: N, P, and K fertilization; L1: N, P, and K fertilization plus lime for 1 year; L2: N, P, and K fertilization plus lime for 2 years.
Table 2. Impact of lime application on sucrose content, growth parameters, and yield of sugarcane.
TreatmentSucrose Content (%)Available Stalk Number (hm−2)Stalk Height (cm)Stalk Diameter (cm)Single Stalk Weight (kg)Theoretical Production (kg/hm2)
CK12.03 ± 0.54 a52,778 ± 1604 a300.7 ± 6.2 b2.56 ± 0.03 a1.40 ± 0.06 b73,716 ± 2916 a
L112.23 ± 0.38 a50,926 ± 2450 a321.0 ± 4.6 a2.61 ± 0.02 a1.55 ± 0.04 ab78,974 ± 2755 a
L212.48 ± 0.23 a51,852 ± 4036 a329.0 ± 2.3 a2.61 ± 0.03 a1.60 ± 0.03 a83,269 ± 7198 a
Different letters indicate a significant difference among treatments based on the LSD test (p < 0.05). CK: N, P, and K fertilization; L1: N, P, and K fertilization plus lime for 1 year; L2: N, P, and K fertilization plus lime for 2 years.

