Article

Water Deficit Effects on Soybean Root Morphology and Early-Season Vigor

1
Department of Plant and Soil Sciences, Mississippi State University, Mississippi State, MS 39762, USA
2
Mississippi Water Resources Research Institute, Box 9547, Mississippi State University, Mississippi State, MS 39762, USA
3
Delta Research and Extension Center, Box 197, Stoneville, MS 38776, USA
*
Author to whom correspondence should be addressed.
Agronomy 2019, 9(12), 836; https://doi.org/10.3390/agronomy9120836
Submission received: 20 August 2019 / Revised: 29 October 2019 / Accepted: 30 November 2019 / Published: 3 December 2019
(This article belongs to the Section Water Use and Irrigation)

Abstract

:
This study was conducted to determine if root, shoot, and gas exchange traits of determinate and indeterminate soybean cultivars respond differently to soil water deficit. The effect of soil water deficit imposed 4 and 10 days after sowing on growth and development parameters of determinate and indeterminate soybeans was evaluated for 18 and 30 days in experiment I and II, respectively. At both 18 and 30 days after seeding, nearly all root, shoot, and physiological parameters were inversely correlated with the soil moisture level, and the adverse effects of drought stress were more evident in Progeny P5333RY than in Asgrow AG5332. For both cultivars, the effect of soil water deficit on net photosynthesis was mainly due to stomatal limitations. The developed algorithms for the plant processes based on the environmental productivity index were not different between the cultivars, suggesting that soybean plants respond in a similar way irrespective of their growth habits, probably due to the shorter period of water stress.

1. Introduction

Drought hinders the global production of soybean (Glycine max L. (Merr.)), which provides for 71% and 29% of the world’s protein and oil consumption, respectively. Climate change is anticipated to increase the intensity and duration of drought in major soybean production regions, which could cause crop failures and food shortages, particularly as the global population continues to rise [1,2]. Therefore, the effects of drought stress on soybean performance must be elucidated to reduce the threat of climate change on global food security.
The effects of drought stress on soybean germination [3], canopy development [4,5], physiological processes [6], flowering [7], seed development [7,8,9], yield [10], and seed quality [11,12] abound in the literature. However, few have reported on the effects of drought stress on root morphology [13]. Since roots are the first portion of the plant to sense and respond to changes in soil moisture, screening root traits may help identify varieties with enhanced drought tolerance [14,15,16,17]. The response of soybean roots to drought stress varies among cultivars and is dependent on soil bio-physiochemical properties and the timing of the drought stress about growth stage [18,19]. Drought stress affects the root architecture of soybean, i.e., branching density, root angle and depth, and biomass partitioning [14]. In a study of soybean root phenotyping under field conditions, Fenta et al. [14] reported differences in root angle in drought-sensitive, drought-escaping, and intermediate drought-tolerant cultivars. The root angle was <40° in a drought-sensitive cultivar with a shallow root type, while drought-escaping cultivar had a deep root system with a root angle of >60° [14]. The effects of drought stress on root architecture is typically evaluated in environments such as agar plates, hydroponic solutions, or soil cores that are not conducive to phenotyping finer morphological details such as root surface area, lateral branching, volume, diameter, tips, forks, and crossings, [20,21,22]. A simple, fast, and accurate root imagining technique that provides descriptive root morphological data is needed to explain the effects of soil water deficit on soybean root architecture.
Some studies have provided strong evidence that roots tend to have higher lateral root system with an increased diameter and surface area under drought conditions [14] to facilitate maximum water and nutrient absorption from deep soil layers and maintain photosynthesis [23,24]. Since early vigor depends not only on assimilating source, but also on the sink established by structural growth [15], a comprehensive study of root morphological parameters, aboveground shoot development, and physiological and gas exchange traits is required to understand the overall performance of the plant. Shoot morphology characteristics such as leaf area, leaf flagging, and rolling are frequently used in evaluating drought tolerance [25,26,27]. However, physiological traits have not extensively been used because they are considered time-consuming, expensive, and difficult to utilize [14]. To our understanding, phenotyping of shoot and root characteristics, along with physiological traits have not been widely used to understand plant performance under drought stress at the early canopy developmental stages in soybean.
Quantifying plant, vigor, and physiological responses to drought are significant for developing simulation models that could be used to predict crop responses to varying environmental conditions. There has been a growing concern in modeling soybean growth to predict overall crop performance and to understand the timing of developmental stages. Currently, different types of soybean model simulations are available such as APSIM [28], DSSAT [29,30], SOYSIM [31], GLYCIM [32], and MONICA [33] to identify tolerant traits and to predict yield under a wide range of environments. However, numerous studies are still essential to improve accuracy, forecasting, and validate model predictions. Information on root growth and development is difficult to quantify for many crops including soybean. Quantifying various growth and developmental characteristics of soybean and integrating those functions into crop simulation models are essential to predict the growth responses and yields under current and future climates scenario. Thus, the objective of this study was to evaluate the effects of several intensities of soil water deficit treatments on soybean root morphology, phenology, vegetative growth, and physiology of two cultivars with determinate and indeterminate growth habits during early season canopy developmental period.

2. Materials and Methods

2.1. Experimental Condition and Plant Culture

Indeterminate type-Asgrow AG5332 and determinate type-Progeny P5333RY from the same Maturity Group V were used in the study. Four soybean seeds were seeded in PVC (polyvinylchloride) pots (15.2 cm diameter by 30.5 cm high) filled with sandy loam (3:1 ratio of sand: topsoil) medium (87% sand, 2% clay, and 11% silt) and four days after emergence the plants were thinned to one per pot. All the plants were fertigated three times a day with full-strength Hoagland’s nutrient solution through an automated drip irrigation system.
Two experiments were conducted in sunlit, growth chambers known as SPAR units (Soil-Plant-Atmosphere-Research) located at Mississippi State University, MS. More details of the control and operation of the SPAR chambers have previously been described by Reddy et al [34]. One experiment was conducted from April to May and terminated 18 days after sowing. The second experiment was conducted repeating the first experiment from May to June time frame; however, it was terminated at 30 days by extending the soil water deficit treatment little longer compared to the first experiment. Pots were arranged in six rows with three pots per row with 9 replications per cultivar in a completely randomized design. In total, 90 pots were used in each experiment for the five soil water deficit treatments.
Day/night temperatures of 29°C/21°C and CO2 concentration of 400 µmol mol−1 were maintained for both the experiments throughout the treatment period. The vapor pressure deficit (VPD) was estimated as Murray [35], and the relative humidity was examined with a humidity sensor (HMV 70Y, Vaisala Inc., San Jose, CA, USA). The seasonal data for mean temperature, VPD, and CO2 concentration for the two experiments are presented in Table 1.

2.2. Treatments

Five soil water deficit treatments of 100%, 80%, 60%, 40%, and 20% of ET of the control (100% ET) were manipulated 4 days after sowing in experiment I and 10 d after sowing in experiment II. Measurement of evapotranspiration was performed according to the procedure that has been described in previous studies [36,37]. Soil moisture content was monitored at a 10 s basis using soil moisture probes (Decagon Devices Inc., Pullman, WA, USA), inserted at the 15-cm soil depth in every five random pots in each treatment. Season-long average ET values and respective average soil moisture readings for each treatment are provided in Table 1.

2.3. Plant Growth, Developmental, and Physiological Measurements

2.3.1. Phenology and Growth

At harvest, plant height, the number of nodes, and leaf area were measured. Plant height was measured using a meter ruler, and the total leaf area was measured using the LI-COR 3100 leaf area meter (LI-COR, Inc., Lincoln, NE, USA). Plant component (stem, leaf, and root) dry weight was measured after oven drying at 80 °C for 5 consecutive days.

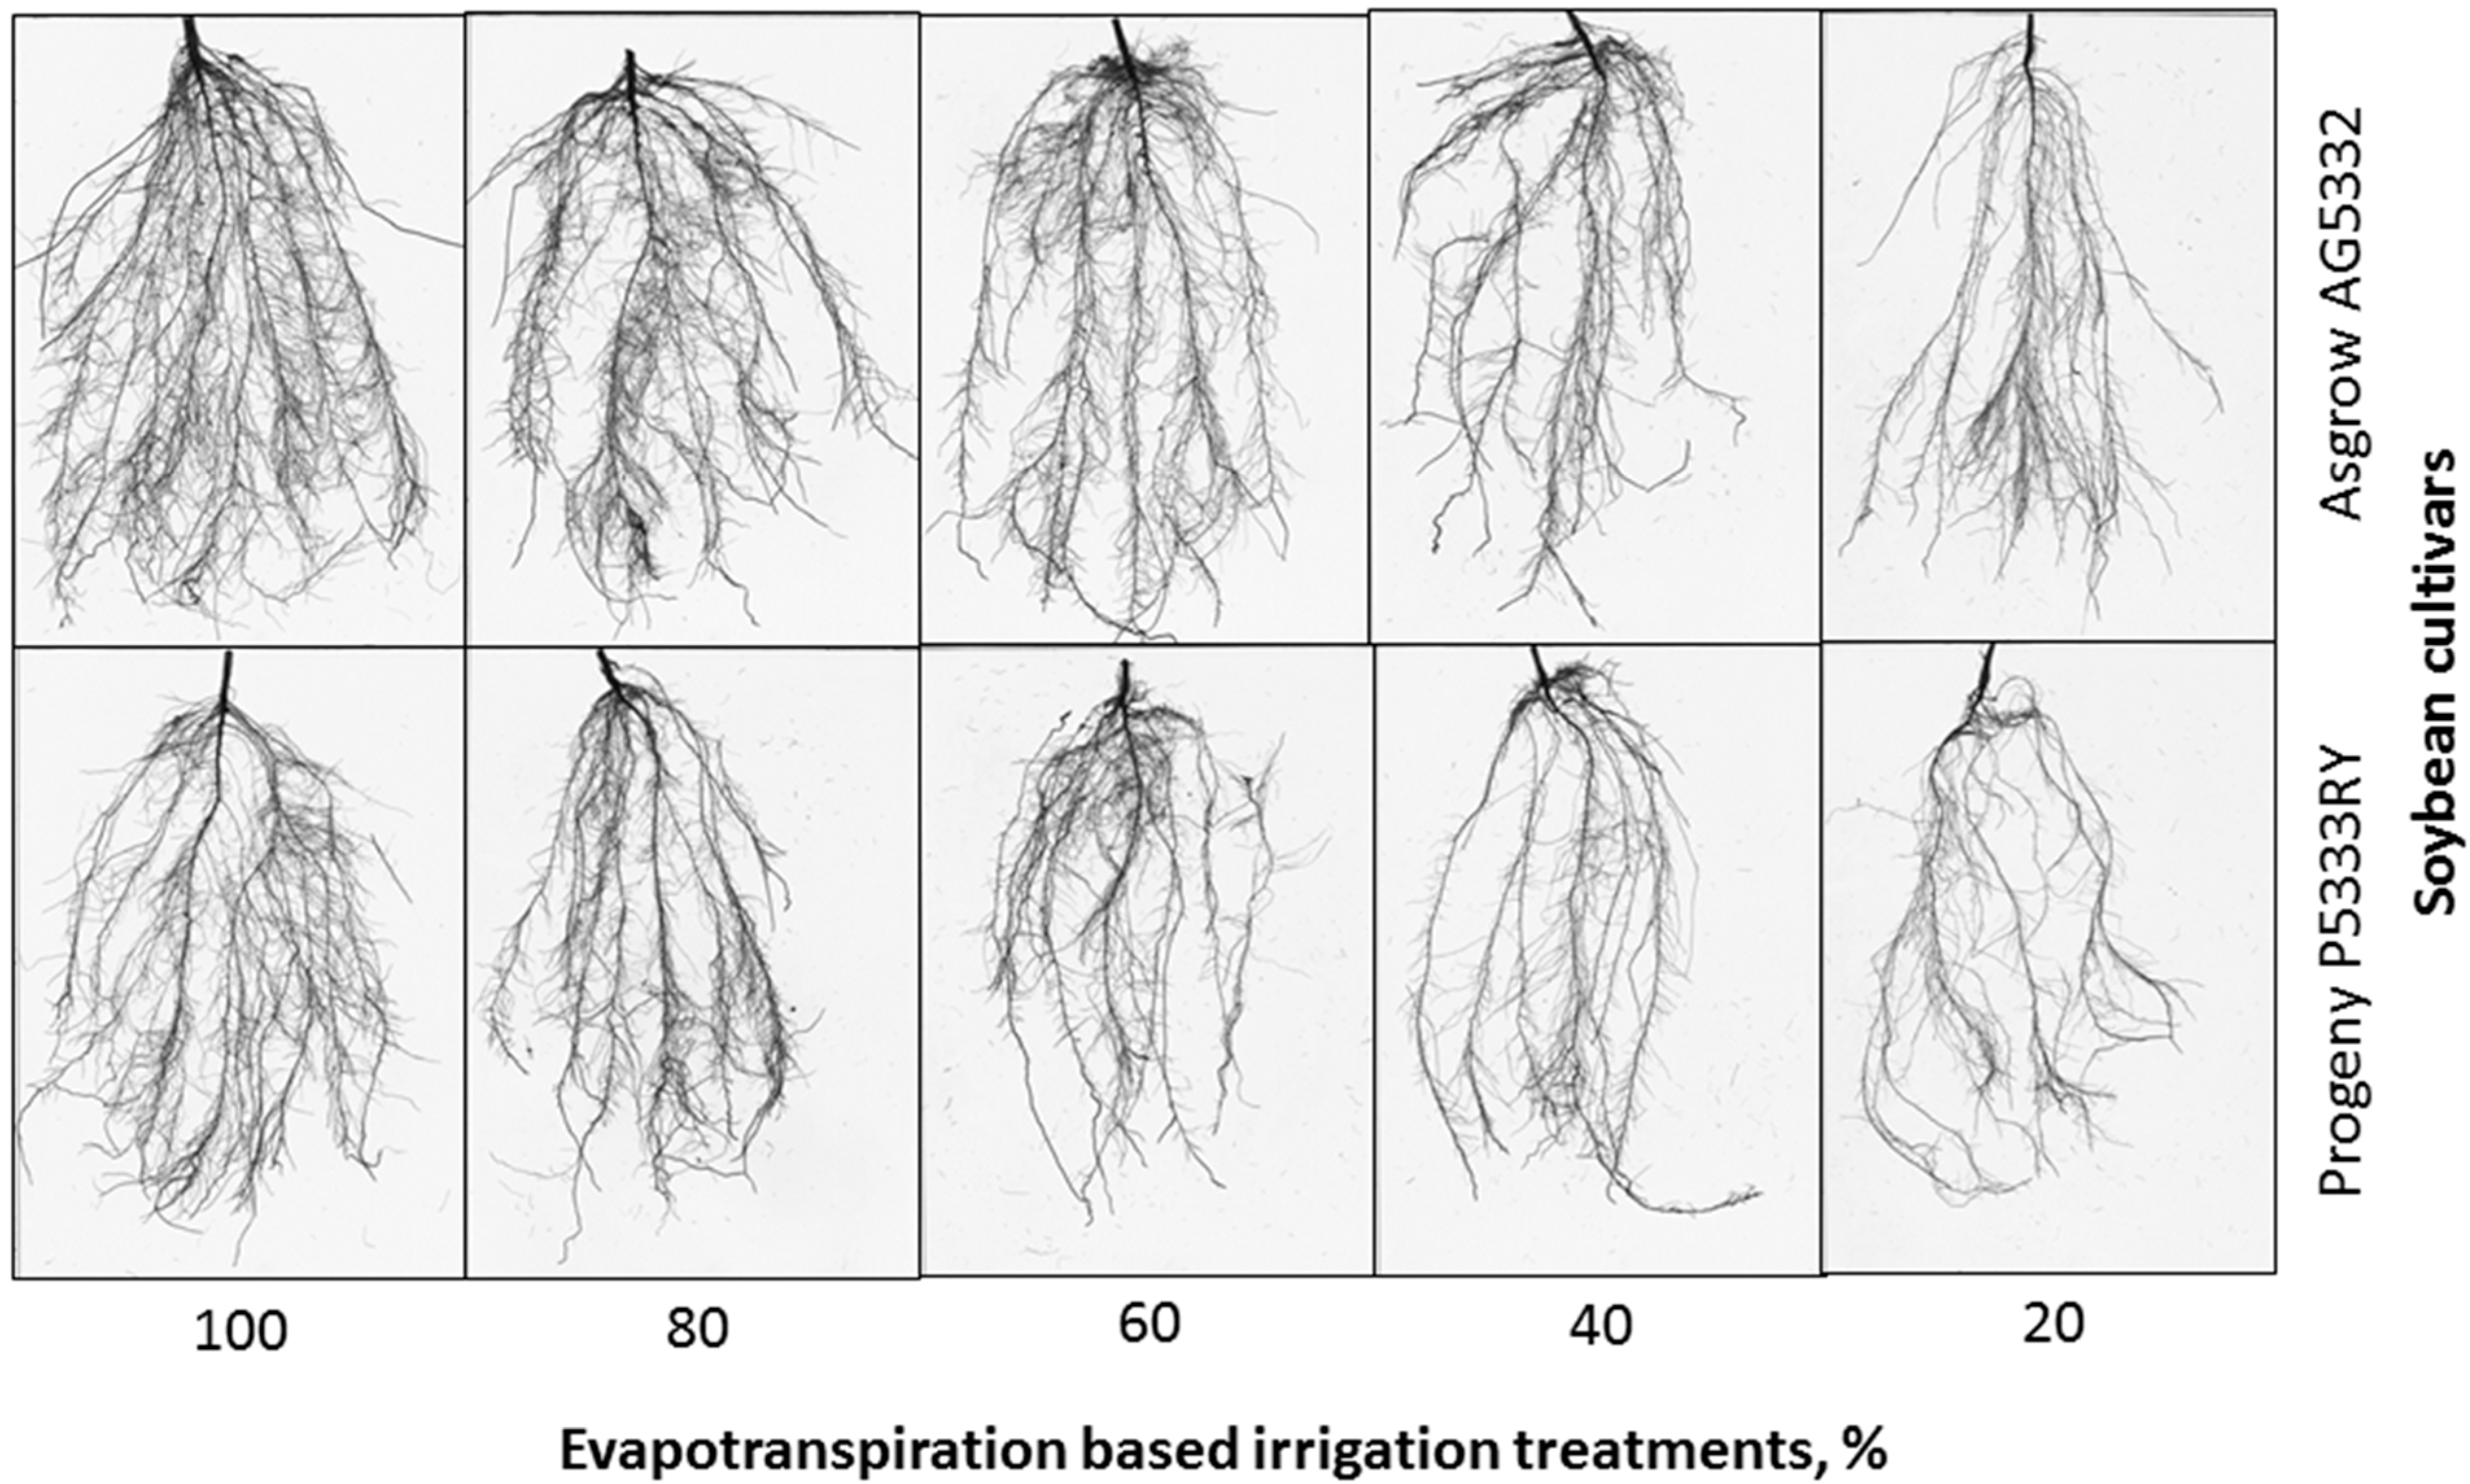
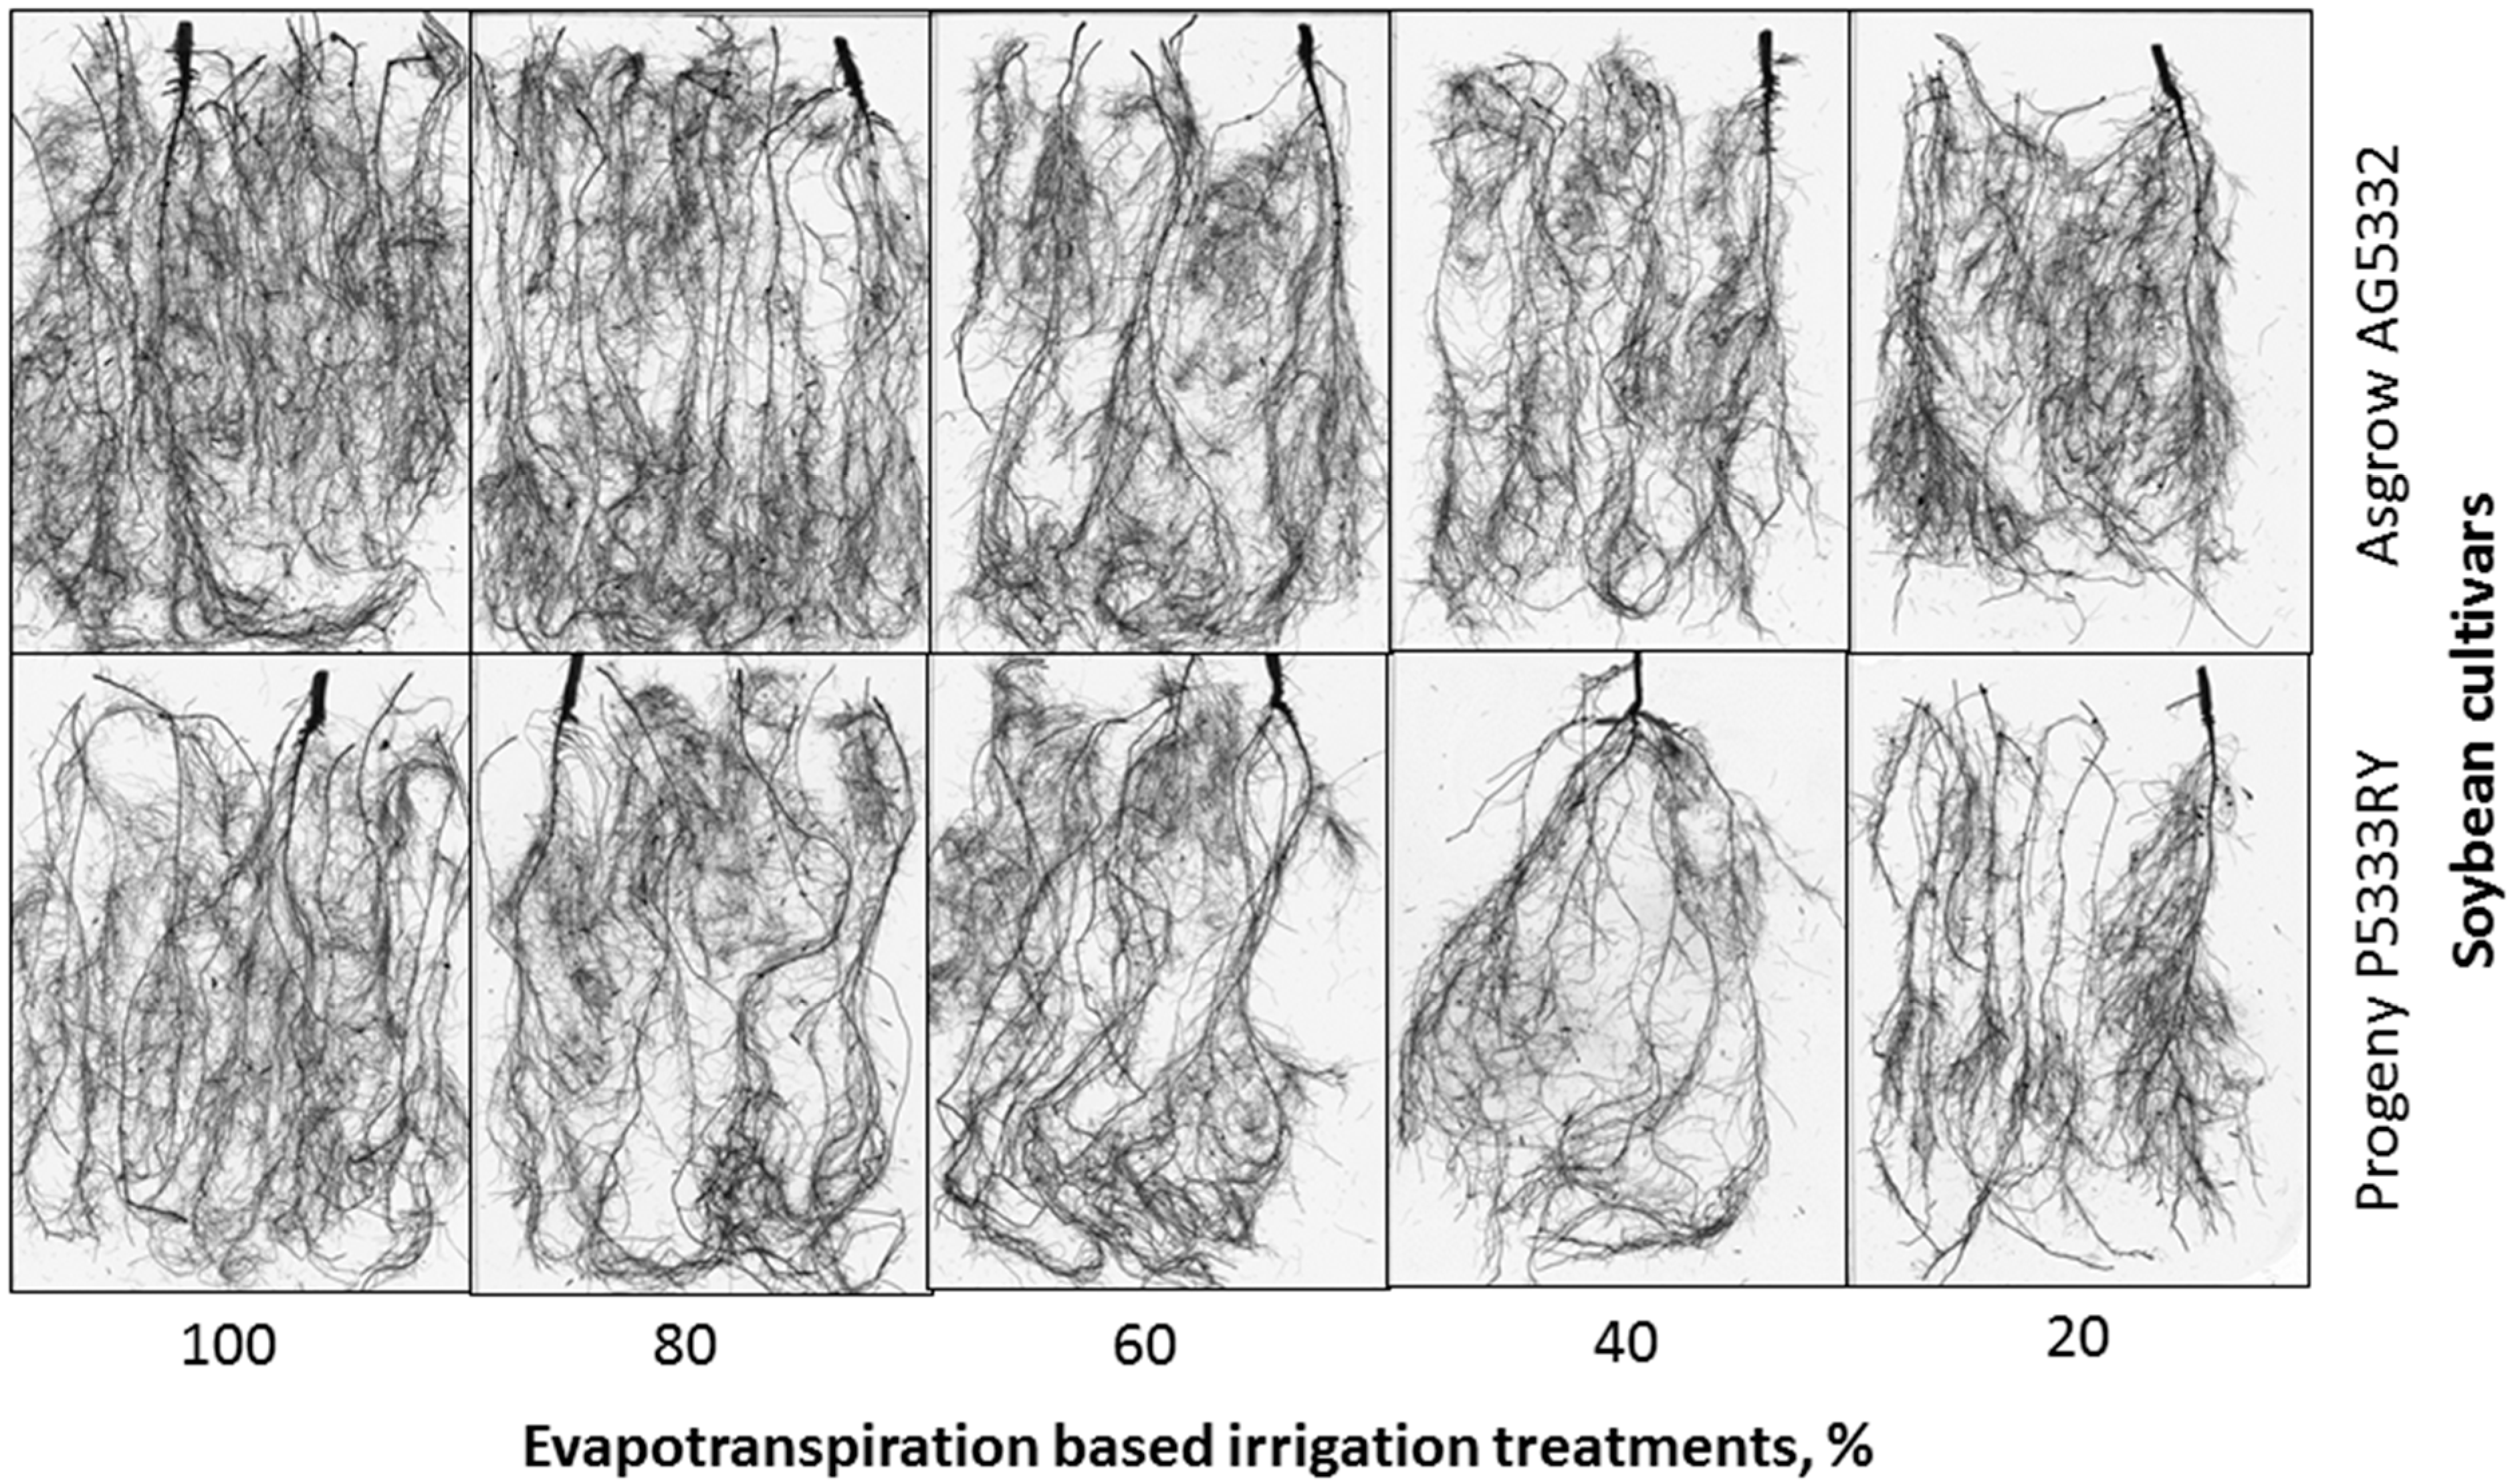
2.3.2. Root Morphology

Roots were separated from the stems and cleaned thoroughly according to the procedure described in previous studies [15,16,38]. Roots were floated in 5 mm of water in a 0.4 by 0.3 m Plexiglas tray and used a plastic paintbrush to untangle and separate the root system to minimize any root overlap. Roots were then scanned, and images were analyzed using WinRhizo Pro software (Regent Instruments, Inc., Québec, QC, Canada). The largrer root systems were split into two or three before scanning and the results obtained were combinted to generate values on plant basis.

2.3.3. Physiological and Gas-exchange Measurements

Photosynthesis (Pn), stomatal conductance (gs), transpiration (Trans), electron transport rate (ETR), and fluorescence yield of opened photosystem II (PS II) (Fv’/Fm’) were measured using the Li-COR 6400 photosynthesis system (LI-COR, Inc., Lincoln, NE, USA). The ratios of internal (Ci) to external (Ca) CO2 concentration and water use efficiency were calculated as the ratio of Ci/Ca and Pn/Trans. More specifics on setting up the instrument and procedure of taking gas exchange measurements have been discussed in detail previously [17,27].

2.4. Data Analysis

The experimental setup was split-plot in a completely randomized design, considering soil moisture treatment as the main plot and cultivar as the subplot. Data were analyzed accordingly using SAS 9.2 (SAS Institute 2011, Cary, NC, USA) at p = 0.05 significance level. Sigma Plot 13.0 (Systat Software Inc., San Jose, CA, USA) was used for graphical analysis.

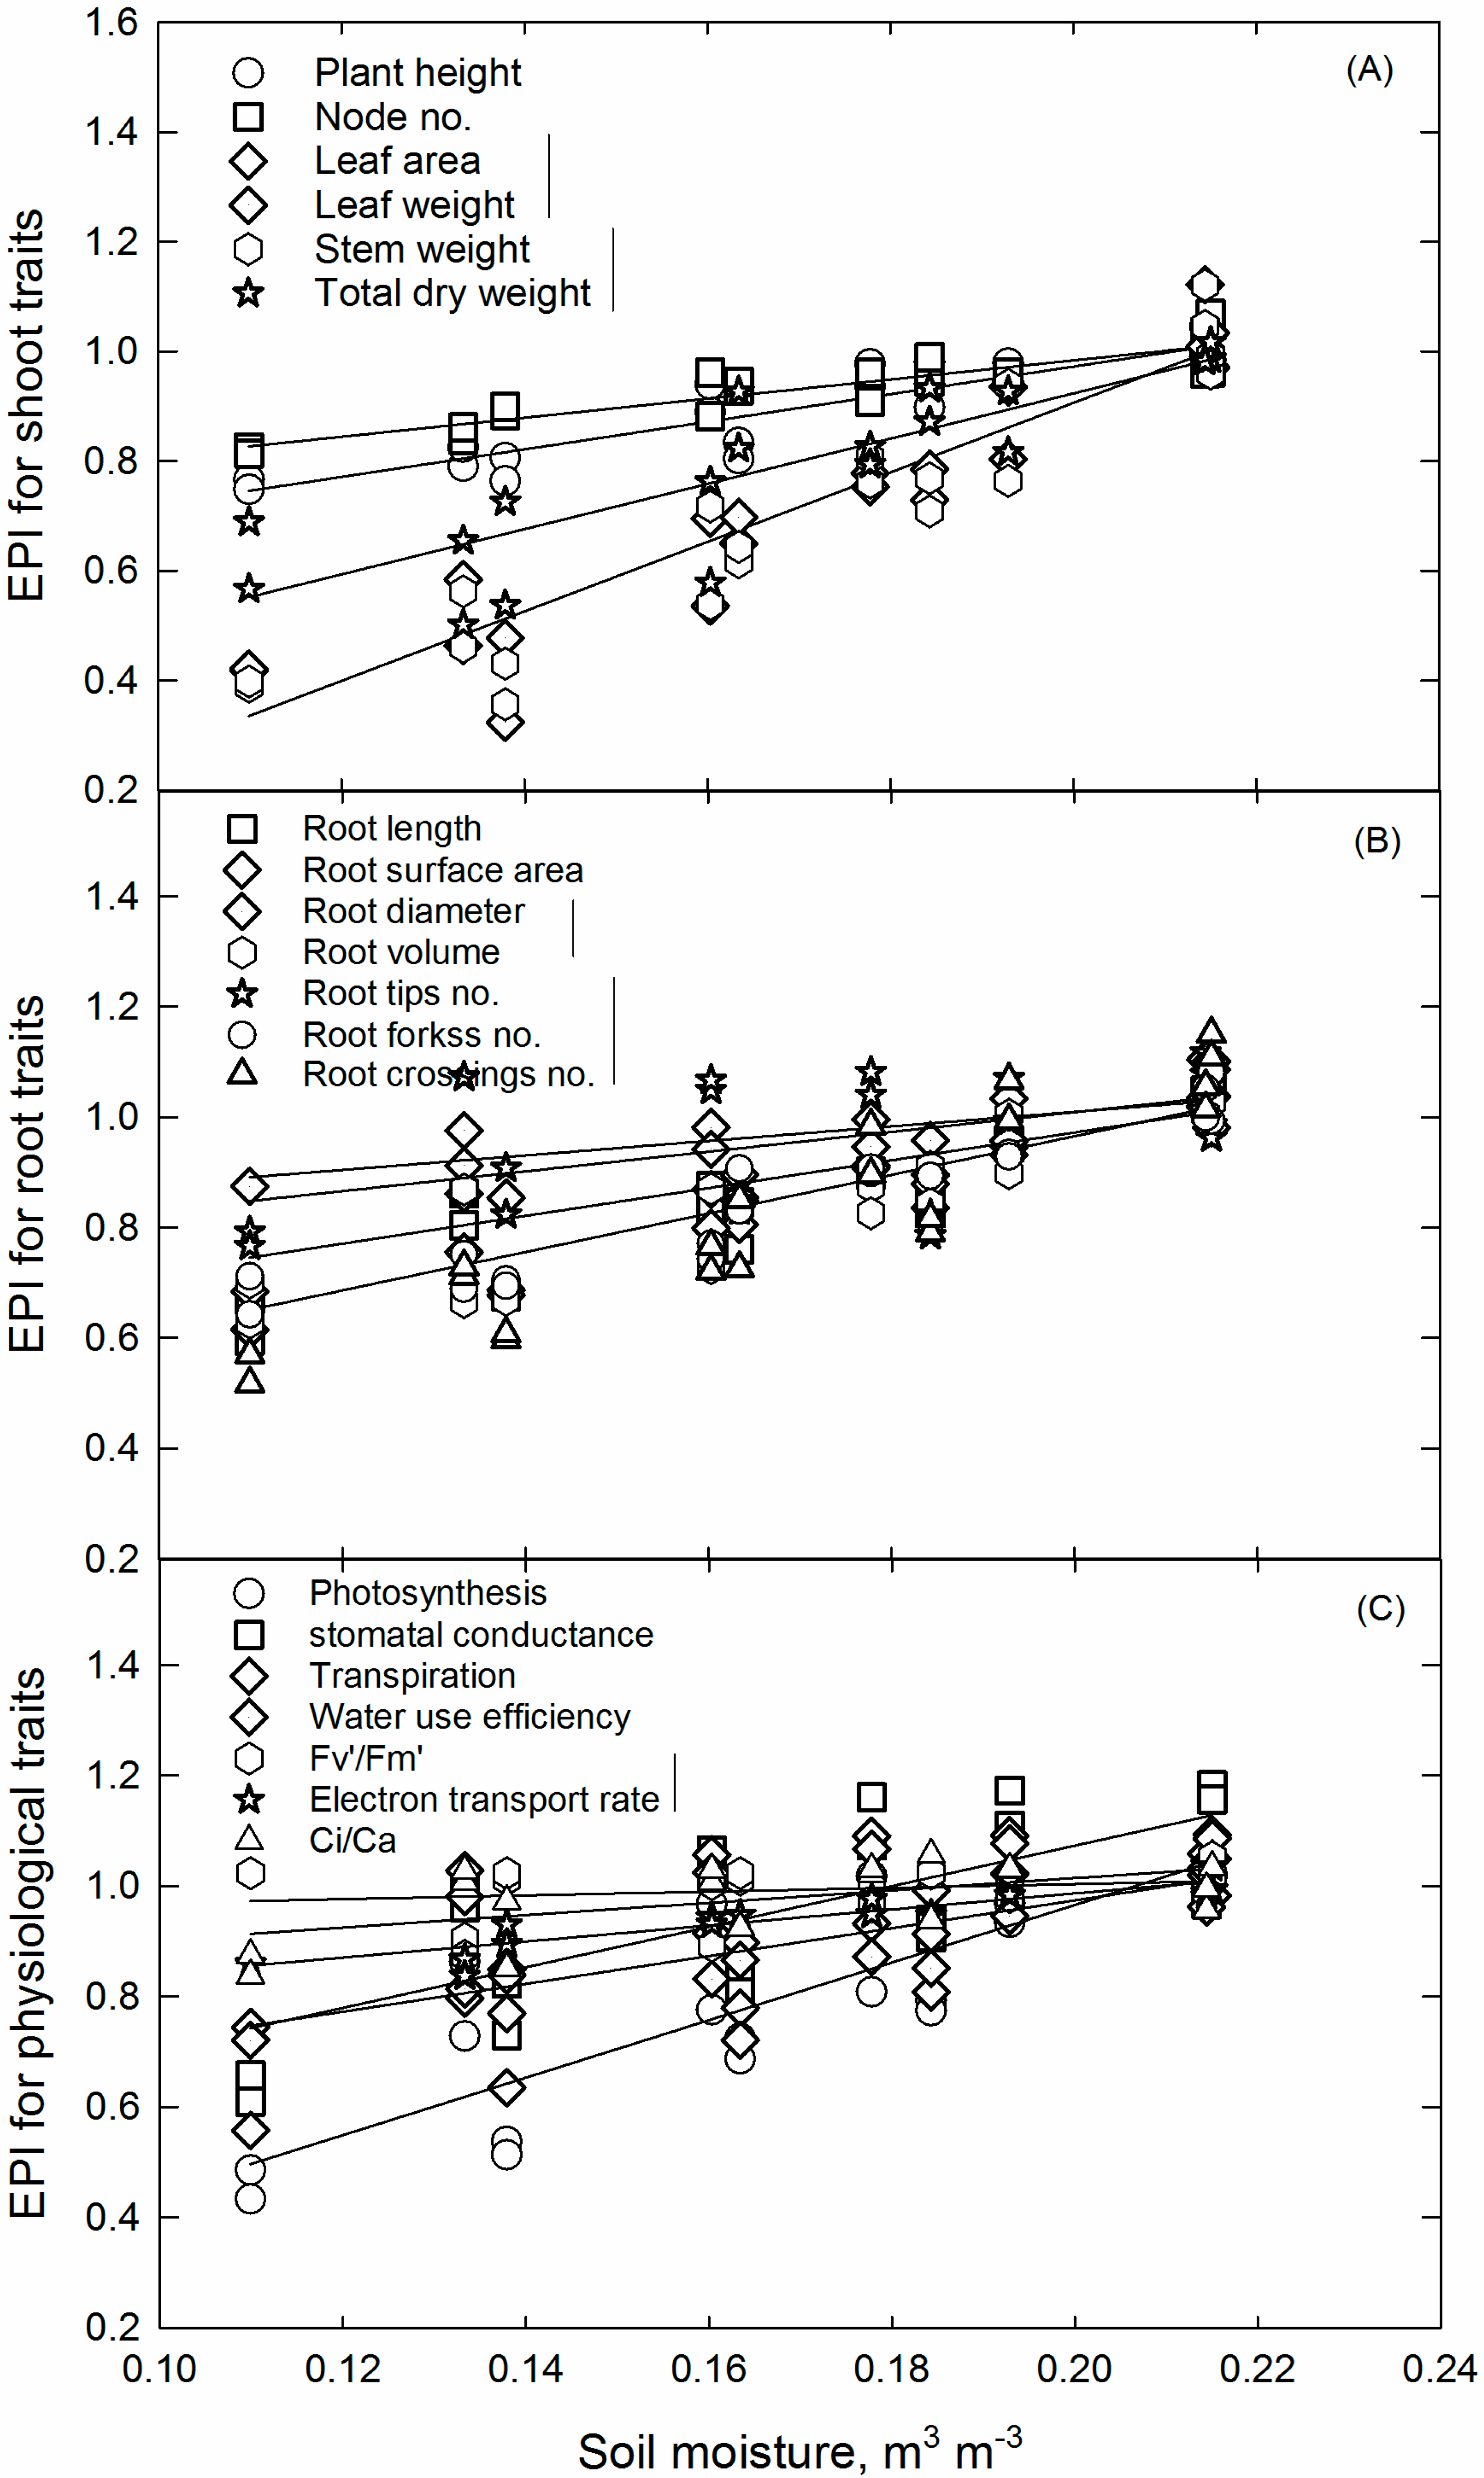
Environment Productivity Index Concept and Critical Soil Moisture Limits

The Environmental Productivity Index (EPI), a concept that has been used to describe environmental limitations on crop productivity and to develop crop simulation models, was exploited to understand the soil water deficit effects on soybean growth, developmental, and physiological processes [39,40,41]. The measured growth and developmental parameters were normalized by calculating water deficit indices, which ranged from 0 to 1, where 0 indicates severe water stress, and 1 indicates optimum moisture level. The regression analyses were performed on the relationship between derived values and the soil moisture between cultivars. The soil water deficit treatment period was different for the two experiments; hence, there were differences between cultivars and their absolute responses. However, the two cultivars exhibited similar responses to the derived values against soil moisture for both the treatment periods. Therefore, one linear regression best described the response of each trait to soil moisture content. Critical limits for various growth and developmental processes were calculated and given as 90% of the control moisture level.

3. Results

3.1. Management of Soil Water Deficit Treatments

The measured soil moistures contents in both the experiments (18 and 30 days) by decagon soil moisture sensors were different (p < 0.001) among the soil water deficit treatments and represent that a crop could face a wide range of conditions spatially and temporally across the soybean growing area (Table 1). The semi-automated ET-based irrigation enabled us to control soil moisture regimes at the desired levels in different treatments throughout the experiment. The measured soil moisture content controlled through ET-based irrigation showed 0.214 and 0.212 m3 m−3 for the control treatments of 18 and 30 days of experiments, correspondingly (Table 1). At 4–18 days treatment period, soil moisture contents for 80, 60, 40, and 20% ET treatments showed 14% (0.184 m3 m−3), 24% (0.163 m3 m−3), 35% (0.139 m3 m−3), and 49% (0.109 m3 m−3) lower than the control (0.214 m3 m−3), whereas, at 10–30 days treatment period, those values were 9% (0.192 m3 m−3), 17% (0.177 m3 m−3), 25% (0.160 m3 m−3), and 37% (0.133 m3 m−3) less than its control (100% ET) treatment (0.212 m3 m−3), respectively. Measured ET values also varied among the soil moisture treatments (Table 1). Evapotranspiration of soybean with deficit irrigation (20% ET) was 64% less than the well-irrigated plants (100% ET) in both 18 and 30 days of experiments. However, day and night average CO2, temperature, and vapor pressure deficit (VPD) were not different (p > 0.05) among the treatments and cultivars (Table 1).

3.2. Growth and Shoot Pparameters

Soil water deficit decreased the plant height of two soybean cultivars (p < 0.001) at 30 days of the experimental period, however, the treatment difference was not significant (p > 0.05) at very early seedling stage (18 DAS) probably due to the shorter period of water stress (Table 2). But the plant height was different (p < 0.001) between the cultivars in both the experiments (Figure S1). Under the well-watered condition, Progeny P5333RY showed the maximum plant height (7 cm at 18 DAS and 22 cm at 30 DAS), whereas Asgrow AG5332 exhibited 5 cm and 16 cm at 18 and 30 DAS, respectively (Figure S1A,B). Under severe soil water deficit condition (20% ET), plants were shorter by 20% and 9% for Asgrow AG5332 and Progeny P5333RY at 18 DAS (Figure S1A) and 23% and 28% for the same cultivars at 30 DAS (Figure S1B).
Leaf numbers were not different (p > 0.05) between the cultivars in both the experiments (Table 2). Under soil water deficit conditions (40% and 20% ET) at 18 DAS, Asgrow AG5332 had larger leaf area compared to Progeny P5333RY, but under a well-watered condition at 18 DAS and in all five soil water deficit treatments at 30 DAS, Asgrow AG5332 showed comparatively lower leaf area (Figure S1E). At 18 and 30 DAS, percent reduction of leaf area varied from 49% to 69% and 59% to 71% for Asgrow AG5332 and Progeny P5333RY, respectively (Figure S1E,F), when soil moisture changed from control (100% ET) to severe water deficit (20% ET).
Leaf and stem dry weights were different (p < 0.001) among the five different soil water deficit treatments for both the experiments (Table 2). Soybean plants were grown under moderate (40% ET), and severe soil water deficit (20% ET) conditions produced a lower amount of leaf and stem biomass per plant (Figure S2). At 30 DAS, 20% ET level showed 59% and 62% reduction in leaf dry weight for Asgrow AG5332 (Figure S2A) and Progeny P5333RY (Figure S2B), correspondingly. Irrigation deficit during 30 days of the experiment of soybean (Figure S2H) resulted in a marked loss of biomass production (54% and 58% reduction over the control) for Asgrow AG5332 and Progeny P5333RY compared to the deficit during 18 days of the treatment period (Figure S2G).

3.3. Root Parameters

Soil water deficit decreased soybean root morphological traits significantly (p < 0.001) in the present study (Table 2). A significant cultivar effect (p < 0.01) was also observed for root length, surface area, volume, and diameter (Figure S3). Root length decreased under severe soil water deficit (20% ET) by 20% and 41% in cultivar Asgrow AG5332 and 21% and 33% in cultivar Progeny P5333RY at 18 and 30 DAS (Figure S3A), respectively. Under severe water deficit conditions, soybean roots showed less root crossing and forking close to the surface layer and elongated tap root system towards the deeper layers of soil at 18 DAS (Figure 1) and 30 DAS (Figure 2). At 30 DAS, soybean cultivar Asgrow AG5332 showed 41%, 21%, and 38% reduction in root surface area, diameter, and volume, respectively, whereas Progeny P5333RY exhibited 33%, 14%, and 30% reduction correspondingly compared to the control treatment. Overall, Asgrow AG5332 had densely branched, thicker, and more extended root systems compared to Progeny P5333RY under both 18 DAS (Figure 1) and 30 DAS (Figure 2). Soil water deficit increased root tips by 5% and 18% for Asgrow AG5332 and Progeny P5333RY, respectively, at 18 DAS (Figure S4A); however, at 30 DAS, it decreased by 29% for both the cultivars (Figure S4B). Root forks and crossings were different (p < 0.001) among the treatments and between the cultivars and at 30 DAS, those decreased by 39% and 51% for Asgrow AG5332 and 23% and 44% for Progeny P5333RY, correspondingly.

3.4. Photosynthesis and Fluorescence Parameters

In our study, a significant (p < 0.001) treatment difference was observed for net photosynthesis (Pn) both at 18 DAS and 30 DAS (Table 2). However, the cultivar effect and the interaction between two soybean cultivars and water stress treatments were not significant (p > 0.05). The soybean cultivar Progeny P5332RY showed the lower Pn compared with Asgrow AG5332. Soil water deficit-induced reductions in Pn were 19% and 17% at 18 DAS (Figure S5A) and 17% and 15% at 30 DAS (Figure S5B) for Asgrow AG5333 and Progeny P5333RY, respectively. Similar to Pn, transpiration rate (E) and stomatal conductance (gs) was also reduced with the soil water deficit. At 18 DAS (Figure S5C), the decrease in gs was 16% under both 80% and 20% ET for Asgrow AG5332, whereas at 30 DAS (Figure S5D), gs further reduced to 27% and 32%, respectively, for the same treatment conditions compared to the control (100% ET).
The internal to the external CO2 ratio (Ci/Ca) did not show any difference from the control treatment at both 18 (Figure S5E) and 30 DAS (Figure S5F). At 30 days of soil water deficit, the transpiration rate declined by 28% and 25% for Asgrow AG5333 and Progeny P5333RY, correspondingly (Figure S5H). Photosynthetic electron transport rate (ETR) and fluorescence (Fv′/Fm′) decreased by 18% and 13% for Asgrow AG5333 and 16% and 13% for Progeny P5333RY, respectively (Figure S6).

3.5. Soil Water Deficit Response for Soybean Growth, Developmental, and Physiological Pprocesses and CriticalLlimits

The measured parameters exhibited linear relationships under sub-optimal moisture conditions. The parameters, leaf area, plant component dry weight, root diameter, and root volume, tips, forks, and crossings, and Fv′/Fm′ and ETR from the two experiments showed similar linear trends for both the cultivars (Figure 3). Therefore, one linear regression was fitted for those parameters under both treatment periods for the two soybean cultivars. The corresponding regression parameters, coefficients, and estimated critical limits as defined by the 90% of the control for the measured parameters are given in Table 3.

4. Discussion

Soybean crop responses to soil moisture deficit is a highly dynamic trait involving several morpho-physiological, genotypic, and biochemical mechanisms [42]. At the early seedling stage, understanding crop performance to soil water deficit is vital because it affects all processes in developing a uniform and healthy canopy. In the present study, shoot, root, and physiological markers and their relationships to soil water deficit under varying moisture conditions were explored in two contrasting growth habit soybean cultivars. Further, functional relationships between plant processes and soil water deficit will be useful to improve the functionality of soybean crop models for field applications. Also, to the best of our knowledge, this is the first study to address the soil water deficit effects on soybean root system architecture and seedling growth and development under a wide range of soil moisture levels. Therefore, the data obtained in this study will help in the better understanding of root traits and soybean plant responses to soil water deficit at the early seedling stages to manage soybean crop during the early-season.
To cope with water stress, plants possess numerous morphological adaptations and responses. Among them, plant height, number of nodes, length of internode, and leaf area index are proposed as indicators of drought stress in soybean [5,43,44]. In general, plant height and leaf development are considered as underlying phenomena of growth and shoot morphogenesis during canopy developmental stages in crops. In our study, we observed a difference in plant height between the cultivars in both the experiments. The difference in plant height reduction between the cultivars could be due to genotypic differences. Khan et al. [5] also reported a decrease in plant height in soybean under water stress, which may be due to shorter internodes as leaf addition rates.
Leaves are the organs in plants for effective photosynthetically active radiation (PAR) capture and interception. Soil water deficit reduced the number of leaves in soybean plants, possibly due to the decreased node emergence rate and accelerated leaf senescence [43]. Similar to the plant height, Progeny P5333RY showed the highest reduction in leaf area, signifying its susceptibility to soil water deficit compared to Asgrow AG5332. Tolerant cultivars possess the benefit of having a larger leaf area at limited water conditions because it is linked with the greater extent of decrease in stomatal conductance (gs) [44] and a lesser extent of decline in photosynthetic rate (Pn). Therefore, the tolerant cultivar Asgrow AG5332 may benefit from the reduction of water loss while minimizing the cost of reduction of photosynthesis [44]. Reduction in leaf area is an appropriate morphological parameter for measuring soil water deficit experienced by the plant. Many studies have also stated a decrease in leaf area due to reduced leaf growth, cessation of cell division, and accelerated leaf senescence [5,45]. The reduction in the leaf area might also be due to dehydration of protoplasm and a decline in relative turgidity, which is accompanied by a loss of turgor [46] and decreased cell division.
Deficit soil moisture adversely affected total dry weight at both treatment periods. The decrease in leaf number and area by the water stress could be the reason for lower total dry weight under limited water conditions. In both the experiments, Progeny P5333RY showed a higher percent reduction in total dry weight compared to Asgrow AG5332. This means that Asgrow AG5332 had better sustainability in producing taller plants and more leaf area to maintain a higher shoot dry weight that contributes to increased biomass under limited water condition.
The plant root system comprises different kinds of roots that change in morphology and functions. Root architecture is determined by the distribution and spatial arrangement of these roots in the soil by positioning its foraging activity to regulate water and nutrient absorption [47]. Among the primary traits that influence plant resource acquisition, root length, surface area, volume, and diameter are the key traits that determine root morphology while branching pattern, lateral roots, tips, forks, and crossings control root system architecture [48]. In the present study, compared to the percent reduction for above-ground traits, Progeny P5333RY exhibited a lower percent reduction for root traits. However, regardless of the soil moisture availability, soybean cultivar Asgrow AG5332 showed higher root length, surface area, diameter, and volume compared to Progeny P5333RY. This implies that the root system of Progeny P5333RY cultivar is more sustainable under soil water deficit over the Asgrow AG5332 with inherited increased phenotypic performance. Overall, Asgrow AG5332 had a thicker, longer, and more densely branched root system compared to Progeny P5333RY under both 18 DAS and 30 DAS, suggesting the presence of cultivar variability and tolerance for soil moisture. Uptake of nutrients by roots has a substantial impact on growth and development of shoot, especially during the early vegetative growth stage. Thu et al. [49] also reported a decrease in root length in different soybean accessions under drought conditions. As reported in the previous studies, higher tap root length in deep soil improves the yield by increasing water uptake under drought [14,50,51]. Moreover, plants with deeper root systems would generally more drought avoidant due to the larger soil volume explored by the extensive root system [52,53]. A larger root surface area and diameter are beneficial for relatively high total uptake of nutrients and moisture to maintain photosynthesis [23,51]. Root tips, forks, and crossings, which determine root system architecture, not only extend the absorptive surface of roots, but also are capable of growing into small pores and soil particles enabling the plant to intercept and mine mobile or immobile nutrients such as P and Fe that are bound to soil particles [54].
In our study, photosynthesis (Pn) and stomatal conductance (gs) reduced with the soil water deficit. The soybean cultivar Progeny P5332RY showed lower Pn and gs, compared with Asgrow AG5332. By adjusting the stomatal aperture, plants control their diurnal water status at a favorable level. To survive over an extended soil water deficit condition, it is necessary for the soybean leaves to adjust its gs to prevent excessive water loss. Stomatal closure contributes to maintaining high leaf water content; however, it governs to a reduction in leaf photosynthesis and intercellular CO2 concentration, which in turn reduces CO2 assimilation. This photosynthesis limitation causes an imbalance in electron necessity for photosynthesis and leads to photodamage in photosystem II (PS II). Stolf-Moreira et al. [55] also reported one of the drought-sensitive soybean varieties MG/BR46 exhibited a 65% reduction in gs after 30 days of water stress when compared to the drought-tolerant cultivar BR16 which showed 50% reduction. Another 15 more days of extended water stress, sensitive cultivar showed a 79% reduction while the decline was no longer detectable in the tolerant cultivar. As reported in many other studies stomatal limitation is the key factor which is responsible for the net photosynthesis reduction compared to non-stomatal limitation such as diminishing of Rubisco, reduction in the chemical and enzymatic reactions, and decrease in energy consumption. The internal to external CO2 ratio (Ci/Ca) did not show any difference from the control treatment at both 18 DAS and 30 DAS. Therefore, this finding suggests that the reduction of Pn was mostly due to decrease in gs under water-limited conditions. Many studies had reported that stomatal factors inhibited more than non-stomatal factors when the plants were under stress [55,56,57,58]. Under limited water condition, the transpiration rate also declined for Asgrow AG5332 and Progeny P5333RY. The decline in E could be an adaptive response of water-stressed soybean plants by stomatal closure to maintain a high-water potential under water stress. Photosynthetic electron transport rate (ETR) and fluorescence (Fv′/Fm′) also decreased for both the cultivars in the present study. This suggests that with the inhibition of Pn and gs, the leaf photochemistry was changed, affecting the ETR chain under water stress condition. In contrast to our finding, some studies have suggested that PS II photochemistry was resistant to mild water stress [57]; however, under severe water deficit, PS II activity was strongly reduced [59].
Quantitative relationships between soybean root, shoot, and physiological parameters of the early vegetative stage are less available for developing models to study the effects of soil moisture in current and future climates. One way to quantify the impact of soil water deficit on soybean is to establish environmental productivity indices as described in previous studies for other crops [41,56]. Potential shoot and root growth and development and gas exchange traits are defined as the estimated individual process that takes place under optimum environmental conditions. Then, by accounting for soil water deficit induced specific reduction indices, the effects of soil water deficit on soybean can be quantified and modeled. These indices represent the fractional limitation due to soil water deficit and range from 0 to 1 where 1 is when the soil moisture does not limit a particular development, and 0, when it does limit that parameter. From this method, the soil moisture deficit effects on soybean shoot, root, and physiological growth could be estimated in a dynamic soil moisture environment without the other variables such as temperature. In the present study, all the parameters exhibited linear decreasing trends under moderate and severe water-stressed conditions for both the cultivars. Based on the critical assessed limits, among the shoot traits, plant height was lower than the critical limits of leaf area, leaf weight, and total dry weight, indicating that plant height is less sensitive to soil water deficit than leaf area and dry weight. Among the root traits, root length and surface area and root tips, forks, and crossings were more sensitive to soil water deficit than the critical limits of root diameter and volume. The critical limits of photochemical parameters Fv′/Fm′ and ETR were less susceptible to soil water deficit suggesting that leaf photochemistry in soybean is resistant to water stress. The critical limit of Pn was the most sensitive trait to soil water deficit than all the other parameters. The decrease in Pn was accompanied by a corresponding reduction in gs and E, indicating the effect of stomatal closure and transpiration on canopy photosynthesis. Moreover, the decrease in Pn escorted with a decrease in total dry weight suggesting the dependence of total dry matter production on net photosynthesis. Overall, root morphological and architectural parameters were more sensitive to soil water deficit than vegetative and physiological traits. Although there were little differences in the absolute values of the derived traits, the crop responses were similar, suggesting that the suitability of developed response indices for crop modeling under projected future climatic conditions. However, the screening outcomes need to be validated under field conditions, as crop performance is highly influenced by other cofactors such as soil type and temperature. Moreover, there is a need to quantify soybean crop responses under different water stress using multiple soybean cultivars from different maturity groups and with different growth habits to provide more precise predictions under water limiting conditions. Additionally, specific experiments considering different growth stages such as physiological maturity and reproductive stages would be more informative to fully understand the differences among the two soybean cultivars examined in the present study.

5. Conclusions

Modeling of the responses of shoot, root, and physiological traits to soil water deficit through phenotyping is essential to understand the less exploited and under-explored traits and to develop crops to different production systems. In this study, the two studied soybean cultivars with different growth habits showed considerable variability in their absolute responses to soil moisture for all the traits measured during early-season. Progeny P5333RY showed the highest reduction in plant height, leaf area, and total dry weight signifying its susceptibility to soil water deficit compared to Asgrow AG5332. Under severe water deficit conditions, both the cultivars showed less lateral branching of roots in the top layers of the soil and deeper tap root systems. Asgrow AG5332 had denser, branched, and more extended root system compared to Progeny P5333RY. However, root traits of Progeny P5333RY cultivar showed less reduction under moderate to severe soil water deficit conditions. Root morphological and architectural parameters were more sensitive to soil water deficit than vegetative and physiological traits.
Similarly, the decline in photosynthesis seems to be related to mainly stomatal closure. The plant processes, when expressed cultivar specific maximum values under optimum conditions, were not different between the cultivars. Therefore, the identified soil water deficit induced shoot, root, and physiological parameters should be useful for modeling and could improve the functionality of soybean models for field and climate change scenario applications.

Supplementary Materials

The following are available online at https://www.mdpi.com/2073-4395/9/12/836/s1, Figure S1: Relationships between soil moisture and vegetative growth components measured at 18 and 30DAS. (A and B) plant height, (C and D) node numbers, (E and F) leaf area, Figure S2: Relationships between soil moisture and biomass components measured at 18 and 30DAS. (A and B) leaf weight, (C and D) stem weight, (E and F) root weight, (G and H) total weight, Figure S3: Relationships between soil moisture and root growth parameters measured at 18 and 30DAS. (A and B) root length, (C and D) root surface area, (E and F) root diameter, (G and H) root volume, Figure S4: Relationships between soil moisture and root developmental parameters measured at 18 and 30DAS. (A and B) root tips, (C and D) root forks, (E and F) root crossings, Figure S5: Relationships between soil moisture and photosynthetic parameters measured at 18 and 30DAS. (A and B) photosynthesis, (C and D) stomatal conductance, (E and F) internal to external CO2 concentration, and (G and H) transpiration, Figure S6: Relationships between soil moisture and gas exchange parameters measured at 18 and 30DAS. (A and B) water use efficiency, (C and D) electron transport rate, and (E and F) chlorophyll fluorescence.

Author Contributions

Conceptualization, K.R.R.; Methodology, K.R.R., C.W., F.A.A.; Software and formal analysis, C.W.; Investigation, K.R.R. C.W.; Resources, K.R.R.; Data curation, K.R.R. and C.W.; Writing-original draft preparation, C.W.; Writing-review & editing, L.J.K., W.B.H., B.R.G., and K.R.R.; Supervision, K.R.R.; Project administration, K.R.R.; Funding aquisition, K.R.R., J.T.I, L.J.K.,B.R.G.

Funding

This research was funded by the Mississippi Soybean Promotion Board and the National Institute of Food and Agriculture, 2016-34263-25763 and MIS 171720.

Acknowledgments

We thank David Brand for technical assistance and graduate students of the Environmental Plant Physiology Lab at Mississippi State University for their support during data collection. This article is a contribution from the Department of Plant and Soil Sciences, Mississippi State University, Mississippi Agricultural, and Forestry Experiment Station.

Conflicts of Interest

The authors declare no conflict of interest.

Abbreviations

DASdays after seeding
ETevapotranspiration
SPARsoil-plant-atmosphere-research
gsstomatal conductance
Ci/Cainternal to external CO2 ratio
Etranspiration
WUEwater use efficiency
ETRelectron transport rate
Fv′/Fm′chlorophyll fluorescence.

References

  1. Dai, A. Increasing drought under global warming in observations and models. Nat. Clim. Chang. 2013, 3, 52–58. [Google Scholar] [CrossRef]
  2. Zhao, J.; Fu, J.; Liao, H.; Nian, H.; Hu, Y.; Qiu, L.; Dong, Y.; Yan, X. Characterization of root architecture in an applied core collection for phosphorus efficiency of soybean germplasm. Chin. Sci. Bull. 2017, 49, 1611–1620. [Google Scholar] [CrossRef]
  3. Kosturkova, G.; Todorova, R.; Tasheva, K.; Dimitrova, M. Screening of soybean against water stress mediated through polyethylene glycol. Turk. J. Agric. Nat. Sci. 2014, 1, 895–899. [Google Scholar]
  4. Frederick, J.R.; Camp, C.R.; Bauer, P.J. Drought stress effects on branch and mainstem seed yield and yield components of determinate soybean. Crop Sci. 2001, 41, 759–763. [Google Scholar] [CrossRef]
  5. Khan, M.S.A.; Karim, M.A.; Haque, M.M. Genotypic differences in growth and ions accumulation in soybean under NaCl salinity and water stress conditions. Bangladesh Agron. J. 2014, 18, 267–288. [Google Scholar] [CrossRef]
  6. Farooq, M.; Wahid, A.; Kobayashi, N.; Fujita, D.; Basra, S.M.A. Plant drought stress: Effects, mechanisms, and management. Agron. Sustain. Dev. 2009, 29, 185–212. [Google Scholar] [CrossRef] [Green Version]
  7. Brevedan, R.; Egli, D.B. Short periods of water stress during seed filling, leaf senescence, and yield of soybean. Crop Sci. 2003, 43, 2083–2088. [Google Scholar] [CrossRef]
  8. Board, J.E. Yield components related to seed yield in determinate soybean. Crop Sci. 1987, 27, 1296–1297. [Google Scholar] [CrossRef]
  9. Dornbos, D.L.; Mullen, R.E.; Shibles, R.E. Drought stress effects during seed fill on soybean seed germination and vigor. Crop Sci. 1989, 29, 476–480. [Google Scholar] [CrossRef]
  10. Wijewardana, C.; Reddy, K.R.; Alsajri, F.A.; Irby, T.; Krutz, J.; Golden, B. Quantifying soil moisture deficit effects on soybean yield and yield component distribution patterns. Irrig. Sci. 2018, 36, 241–255. [Google Scholar] [CrossRef]
  11. Bellaloui, N.; Mengistu, A.; Fisher, D.K.; Abel, C.A. Soybean seed composition constituents as affected by drought and phomopsisin phomopsis susceptible and resistant genotypes. J. Crop Improv. 2012, 26, 428–453. [Google Scholar] [CrossRef]
  12. Wijewardana, C.; Reddy, K.R.; Bellaloui, N. Soybean seed physiology, quality, and chemical composition under soil moisture stress. J. Food Chem. 2019, 278, 92–100. [Google Scholar] [CrossRef] [PubMed]
  13. Pantalone, V.R.; Rebetzke, G.L.; Burton, J.W.; Carter, T.E. Phenotypic evaluation of root traits in soybean and applicability to plant breeding. Crop Sci. 1996, 36, 456–459. [Google Scholar] [CrossRef]
  14. Fenta, B.A.; Beebe, S.E.; Kunert, K.J.; Burridge, J.D.; Barlow, K.M.; Lynch, P.J.; Foyer, C. Field phenotyping of soybean roots for drought stress tolerance. Agronomy 2014, 4, 418–435. [Google Scholar] [CrossRef] [Green Version]
  15. Reddy, K.R.; Brand, D.; Wijewardana, C.; Gao, W. Temperature effects on cotton seedling emergence, growth, and development. Agron. J. 2017, 109, 1379–1387. [Google Scholar] [CrossRef]
  16. Brand, D.; Wijewardana, C.; Gao, W.; Reddy, K.R. Interactive effects of carbon dioxide, low temperature, and ultraviolet-B radiation on cotton seedling root and shoot morphology and growth. Front. Earth Sci. 2016, 10, 607–620. [Google Scholar] [CrossRef]
  17. Singh, K.; Wijewardana, C.; Gajanayake, B.; Lokhande, S.; Wallace, T.; Jones, D. Genotypic variability among cotton cultivars for heat and drought tolerance using reproductive and physiological traits. Euphytica 2018, 214, 57. [Google Scholar] [CrossRef]
  18. Bengough, A.G.; Mckenzie, B.M.; Hallett, P.D.; Valentine, T.A. Root elongation, water stress, and mechanical impedance: A review of limiting stresses and beneficial root tip traits. J. Exp. Bot. 2011, 62, 59–68. [Google Scholar] [CrossRef] [Green Version]
  19. Benjamin, J.G.; Nielsen, D.C. Water deficit effects on root distribution of soybean, field pea, and chickpea. Field Crops Res. 2006, 97, 248–253. [Google Scholar] [CrossRef]
  20. Manavalan, L.P.; Guttikonda, S.K.; Nguyen, V.T.; Shannon, J.G.; Nguyen, H.T. Evaluation of diverse soybean germplasm for root growth and architecture. Plant Soil 2010, 330, 503–514. [Google Scholar] [CrossRef]
  21. Ao, J.; Fu, J.; Tian, J.; Yan, X.; Liao, H. Genetic variability for root morph-architecture traits and root growth dynamics as related to phosphorus efficiency in soybean. Funct. Plant Biol. 2010, 37, 304–312. [Google Scholar] [CrossRef]
  22. Zhao, J.; Fu, J.; Liao, H.; He, Y.; Nian, H.; Hu, Y.; Qui, L.; Dong, Y.; Yan, X. Comparative proteomic analysis of drought response in roots of two soybean genotypes. Crop Pasture Sci. 2004, 68, 609–619. [Google Scholar]
  23. Comas, L.H.; Becker, S.R.; Cruz, V.M.V.; Byne, P.F.; Dierig, D.A. Root traits are contributing to plant productivity under drought. Front. Plant Sci. 2013, 4, 442. [Google Scholar] [CrossRef] [PubMed] [Green Version]
  24. Serraj, R.; Bona, S.; Purcell, L.C.; Sinclair, T.R. Nitrogen accumulation and nodule activity of field grown ‘Jackson’ soybean in response to water deficits. Field Crops Res. 1997, 52, 109–116. [Google Scholar] [CrossRef]
  25. Beebe, S.E.; Rao, I.M.; Blair, M.W.; Acosta-Gallegos, J.A. Phenotyping common beans for adaptation to drought. Front. Physiol. 2013, 4, 35. [Google Scholar] [CrossRef] [Green Version]
  26. Manavalan, L.P.; Guttikonda, S.K.; Phan, T.L.S.; Nguyen, H.T. Physiological and molecular approaches to improve drought resistance in soybean. Plant Cell Physiol. 2009, 50, 1260–1276. [Google Scholar] [CrossRef] [Green Version]
  27. Wijewardana, C.; Henry, W.B.; Reddy, K.R. Evaluation of drought tolerant maize germplasm to induced drought stress. Miss. Acad. Sci. 2017, 62, 316–329. [Google Scholar]
  28. Keating, B.A.; Carberry, P.S.; Hammer, G.L.; Probert, M.E.; Robertson, M.J.; Holzworth, D.; Huth, N.I.; Hargreaves, J.N.G.; Meinke, H.; Hochman, Z.; et al. An overview of APSIM, a model designed for farming systems simulation. Eur. J. Agron. 2003, 17, 47–58. [Google Scholar] [CrossRef] [Green Version]
  29. Boote, K.J.; Jones, J.W.; Batchelor, W.D.; Nafziger, E.D.; Myers, O. Genetic coefficients in the CROPGRO-soybean model: Links to field performance and genomics. Agron. J. 2003, 95, 32–51. [Google Scholar] [CrossRef]
  30. Jones, J.W.; Hoogenboom, G.; Porter, C.H.; Boote, K.J.; Batchelor, W.D.; Hunt, L.A.; Wilkens, P.W.; Singh, U.; Gijsman, A.J.; Ritchie, J.T. The DSSAT cropping system model. Eur. J. Agron. 2003, 18, 235–265. [Google Scholar] [CrossRef]
  31. Setiyono, T.D.; Cassman, K.G.; Specht, J.E.; Dobermann, A.; Weiss, A.; Yang, H.; Conley, S.P.; Robinson, A.P.; Pedersen, P.; De Bruin, J.L. Simulation of soybean growth and yield in near-optimal growth conditions. Field Crops Res. 2010, 119, 161–174. [Google Scholar] [CrossRef]
  32. Acock, B.; Reddy, V.R.; Whisler, E.D.; Baker, D.N.; Hodges, H.F.; Boote, K.J. The Soybean Crop Simulator GLYCIM. Model Documentation; PB85171163/AS; U.S. Department of Agriculture: Washington, DC, USA, 1982.
  33. Nendel, C.; Berg, M.; Kersebaum, K.C.; Mirschel, W.; Specka, X.; Wegehenkel, M.; Wenkel, K.O.; Wieland, R. The MONICA model: Testing predictability for crop growth, soil moisture and nitrogen dynamics. Ecol. Model. 2011, 222, 1614–1625. [Google Scholar] [CrossRef]
  34. Reddy, K.R.; Hodges, H.F.; Read, J.J.; McKinion, J.M.; Baker, J.T.; Tarpley, L.; Reddy, V.R. Soil-Plant-Atmosphere-Research (SPAR) facility: A tool for plant research and modeling. Biotronics 2001, 30, 27–50. [Google Scholar]
  35. Murray, F.W. On the computation of saturation vapor pressure. J. Appl. Meteorol. 1967, 6, 203–204. [Google Scholar] [CrossRef]
  36. McKinion, J.M.; Hodges, H.F. Automated system for measurement of evapotranspiration from closed environmental growth chambers. Trans. Am. Soc. Agric. Eng. 1985, 28, 1825–1828. [Google Scholar] [CrossRef]
  37. Timlin, D.; Fleisher, D.; Kim, S.H.; Reddy, V.; Baker, J. Evapotranspiration measurements in controlled environment chambers. Agron. J. 2007, 99, 166–173. [Google Scholar] [CrossRef]
  38. Wijewardana, C.; Reddy, K.R.; Shankle, M.W.; Meyers, S.; Gao, W. Low and high temperature effects on sweetpotato storage root initiation and early transplant establishment. Sci. Hortic. 2018, 240, 38–48. [Google Scholar] [CrossRef]
  39. Nobel, P.S. Environmental productivity indices and productivity for Opuntia ficus indica under current and elevated atmospheric CO2 levels. Plant Cell Environ. 1991, 14, 637–646. [Google Scholar] [CrossRef]
  40. Reddy, K.R.; Hodges, H.F.; McKinion, J.M. Crop modeling and application: A cotton example. Adv. Agron. 1997, 59, 225–290. [Google Scholar]
  41. Reddy, K.R.; Kakani, V.G.; Hodges, H.F. Exploring the Use of Environmental Productivity Index Concept for Crop Production and Modeling. In Response of Crops to Limited Water: Understanding and Modeling of Water Stress Effects on Plant Growth Processes; Ahuja, L.R., Reddy, V., Saseendran, S.A., Yu, Q., Eds.; ASA, CSSA, and SSSA: Madison, WI, USA, 2008; pp. 387–410. [Google Scholar]
  42. Guimarães-Dias, F.; Neves-Borges, A.C.; Viana, A.A.; Mesquita, R.O.; Romano, E.; de Fátima Grossi-de-Sá, M.F.; Nepomuceno, A.L.; Loureiro, M.E.; Alves-Ferreira, M. Expression analysis in response to drought stress in soybean: Shedding light on the regulation of metabolic pathway genes. Genet. Mol. Biol. 2012, 35, 222–232. [Google Scholar] [CrossRef]
  43. Desclaux, D.; Huynh, T.T.; Roumet, P. Identification of soybean plant characteristics that indicate the timing of drought stress. Crop Sci. 2000, 40, 716–727. [Google Scholar] [CrossRef]
  44. Ku, Y.; Wan-Kin, A.; Yung, Y.; Li, M.; Wen, C.; Liu, X.; Lam, H. Drought stress and tolerance in soybean. InTech 2013. [Google Scholar] [CrossRef] [Green Version]
  45. Ludlow, M.M.; Muchow, R.C. A critical evaluation of traits for improved crop yields in water limited environments. Adv. Agron. 1990, 43, 107–153. [Google Scholar]
  46. Arnon, I. Crop Production in Dry Regions, Background, and Principles; Polunin, N., Ed.; Leonard Hill Book: London, UK, 1972; pp. 203–211. [Google Scholar]
  47. Lynch, J.P.; Nielsen, K.L. Simulation of root system architecture. In Plant Roots: The Hidden Half, 2nd ed.; Waisel, Y., Eshel, A., Kafkafi, U., Eds.; Marcel Dekker Inc.: New York, NY, USA, 1996; pp. 247–257. [Google Scholar]
  48. Yamauchi, A.; Pardales, J.R.; Kono, Y. Root system structure and its relation to stress tolerance. In Dyanamics of Roots and Nitrogen in Cropping Systems of the Semi-Arid Tropics; Ito, O., Johansen, C., Adu-Gyamfi, J.J., Katayama, K., Kumar, J.V.D.K., Rego, T.J., Eds.; Japan International Research Center for Ag Sciences: Tsukuba, Japan, 1996; pp. 211–233. [Google Scholar]
  49. Thu, N.B.; Nguyen, Q.T.; Hoang, X.L.; Thao, N.P.; Trans, L.S. Evaluation of drought tolerance of the Vietnamese soybean cultivars provides potential resources for soybean production and engineering. BioMed Res. Int. 2014, 2014, 809736. [Google Scholar] [CrossRef] [Green Version]
  50. Kunert, K.J.; Vorster, B.; Fenta, B.A.; Kibido, T.; Dionisio, G.; Foyer, C.H. Drought stress responses in soybean roots and nodules. Front. Plant Sci. 2016, 7, 1015. [Google Scholar] [CrossRef] [Green Version]
  51. Lopes, M.S.; Araus, J.L.; van Heerden, P.D.R.; Foyer, C.H. Enhancing drought tolerance in C4 crops. J. Exp. Bot. 2011, 62, 3135–3153. [Google Scholar] [CrossRef]
  52. Taylor, H.M. Modifying root systems of cotton and soybean. In Adaptation of Plants to Water and High Temperature Stress; Turner, N.C., Kramer, P.J., Eds.; Wiley-Interscience: New York, NY, USA, 1980; pp. 75–84. [Google Scholar]
  53. Taylor, H.M.; Klepper, B. Rooting density and water extraction patterns for com (Zea mays L.). Agron. J. 1973, 65, 965–968. [Google Scholar] [CrossRef]
  54. Wang, H.; Inukai, Y.; Yamauchi, A. Root development and nutrient uptake. Crit. Rev. Plant Sci. 2006, 25, 279–301. [Google Scholar] [CrossRef]
  55. Stolf-Moreira, R.; Medri, M.E.; Neumaier, N.; Lemos, N.G.; Pimenta, J.A.; Tobita, S.; Brogin, R.L.; Marcelino-Guimarães, F.C.; Oliveira, M.C.; Farias, J.R.; et al. Soybean physiology and gene expression during drought. Genet. Mol. Res. 2010, 9, 1946–1956. [Google Scholar] [CrossRef]
  56. Lokhande, S.; Reddy, K.R. Reproductive and fiber quality responses of upland cotton to moisture deficiency. Agron. J. 2014, 106, 1060–1069. [Google Scholar] [CrossRef]
  57. Ohashi, Y.; Nakayama, N.; Saneoka, H.; Fujita, K. Effects of drought stress on photosynthetic gas exchange, chlorophyll fluorescence and stem diameter of soybean plants. Biol. Plant. 2006, 50, 138–141. [Google Scholar] [CrossRef]
  58. Siddique, M.R.B.; Hamid, A.; Islam, M.S. Drought stress effects on photosynthetic rate and leaf gas exchange of wheat. Bot. Bull. Acad. Sin. 1999, 40, 141–145. [Google Scholar]
  59. Genty, B.; Briantais, J.M.; Silva, J.B.V. Effects of drought on primary photosynthetic processes of cotton leaves. Plant Physiol. 1987, 83, 360–364. [Google Scholar] [CrossRef] [PubMed] [Green Version]
Figure 1. Effect of soil moisture stress on the root system architecture of the soybean plants harvested 18 days after sowing.
Agronomy 09 00836 g001
Figure 2. Effect of soil moisture stress on the root system architecture of the soybean plants harvested 30 days after sowing. The images were taken before splitting the root systems for scanning to show the treatment effects.
Agronomy 09 00836 g002
Figure 3. Environmental productivity indices (EPI) for soybean shoot, root, and physiological parameters. The soil moisture dependent indices were expressed as a fraction between 0 to 1 and estimated by dividing the measured value by its estimated maximum value at a desirable moisture level (100%).
Agronomy 09 00836 g003
Table 1. Soil moisture stress treatments based on the percentage of daily evapotranspiration (ET) imposed at 4 and 10 days after sowing, average soil moisture, mean day/night temperature, mean day/night chamber CO2 concentration, mean day/night vapor pressure deficit (VPD), and mean day/night evapotranspiration (ET) during the experimental periods of 18 and 30 days for each treatment.
Treatments TemperatureCO2VPDET
Soil moistureDay/nightDay/nightDay/nightDay/night
m3 m−3°CppmkPaL m−2d−1
18 days of the experiment (treatment period 4–18 days)
1000.214a25.01a432.50a5.28a2.36a
800.184b25.13a431.33a5.34a2.22a
600.163c24.99a431.42a5.28a1.98b
400.139d25.18a428.47a5.32a1.62c
200.109e25.13a430.30a5.32a0.85d
30 days of the experiment (treatment period 10–30 days)
1000.212a24.33a429.37a5.75a2.79a
800.192b24.53a428.17a5.65a1.97b
600.177c24.49a428.86a5.55a1.90b
400.160d24.58a428.03a5.13a1.75c
200.133e24.30a431.13a5.22a0.99d
Soil moisture values are averaged for each treatment from 4 to 18 and 10 to 30 days after sowing. Values within a column with a different letter are significantly different at p < 0.05.
Table 2. Analysis of variance significance levels for the cultivars (Cul), treatments (Trt), and their interaction (Cul × Trt) on different growth, physiological, and developmental traits measured at 18 and 30 days after sowing (DAS); stomatal conductance (gs), transpiration (E), water use efficiency (WUE), the ratio of internal to external CO2 concentration (Ci/Ca), electron transport rate (ETR), fluorescence (Fv’/Fm’).
18 DAS30 DAS
ParametersSourceSource
TrtCulTrt × CulTrtCulTrt × Cul
Plant height, cmNS***NS******NS
Node no., plant−1NSNSNS***NSNS
Leaf area, cm2*****NS******NS
Leaf weight, g plant−1*****NS***NSNS
Stem weight, g plant−1****NS***NSNS
Total dry matter, g plant−1****NS*****NS
Root weight, g plant−1******NS***NSNS
Root length, cm******NS*****NS
Root surface area, cm2******NS*****NS
Average diameter, mm***NSNS***NSNS
Root volume, mm3***NSNS*****NS
Root tips no., plant−1***NS***NS
Root forks no., plant−1******NS******NS
Root crossings no., plant−1******NS******NS
Photosynthesis, µmol CO2 m−2 s−1**NSNS***NSNS
gs, mol H2O m−2 s−1**NS****NS
E, mmol H2O m−2 s−1***NSNS***NSNS
WUE, mmol CO2mol−1 H2O**NSNS**NSNS
Ci/CaNSNSNSNSNSNS
Fv’/Fm’NSNSNSNSNSNS
ETR, µmol m−2 s−1**NS**NS
*, **, *** represent Significance levels at p ≤ 0.05, p ≤ 0.01, and p ≤ 0.001. NS represents p > 0.05.
Table 3. Regression parameters (a and b) and regression coefficient (r2) of shoot, root, and gas exchange traits of soybean to estimate EPI as a function of soil water deficit (Y = a + bX, where Y = respective soil water deficit index for the plant parameter and X = soil moisture content in m3 m−3). The estimated critical limits defined as the 90% of the optimum or control for each growth process are also given. Stomatal conductance, gs; electron transport rate, ETR; the ratio of internal to external CO2 concentration, Ci/Ca; water use efficiency, WUE; fluorescence, Fv’/Fm’.
Plant ParameterRegression Parametersp ValueCoefficient of Determination (r2)Critical Soil Moisture Content, m3 m−3
ab
Plant height0.472.510.9550.830.167
Node no.0.641.740.8310.790.130
Leaf area−0.366.330.6620.890.196
Leaf weight
Stem weight−0.396.460.5620.890.197
Total dry weight
Root length0.233.730.2810.830.200
Root surface area0.273.490.3500.850.203
Root diameter0.651.790.7510.600.159
Root volume
Root tips no.0.243.60.9180.870.203
Root forks no.
Root crossings no.
Photosynthesis−0.085.210.2740.710.196
gs0.343.670.0300.530.175
Transpiration0.343.470.3280.450.185
WUE0.472.520.9760.830.188
Fv’/Fm’0.701.450.6250.840.133
ETR
Ci/Ca0.791.120.2840.330.124

