Abstract
Grain number and weight within a spikelet are major yield components which determine the grain yield in wheat. The objective of this study was to explore genetic gains in grain performance within wheat spikelets at the individual grain level and its effect on grain yield and evaluate genetic progress in stem internode length and other yield-related traits. We conducted field experiments across three growing seasons in the western Yellow and Huai Valley of China; incorporating 17 bread wheat cultivars released from 1948 to 2012. Yields were significantly correlated with year of release. Yield gains equated to 3.95 g m−2 yr−1 in response to increases in total grain weight per m2 (GW) in proximal (G1 and G2) and distal (G3 and G4) grains, despite a decline in the proportional contribution of proximal grains to yield and increase in the proportional contribution of distal grains to yield with year of release. Grain number per m2 (GN), thousand-grain weight (TGW), and harvest index (HI) increased with year of release, but plant height decreased. Both grain number per spikelet of proximal and distal grain contributed to the increase in total GN. However, the contribution ratio of GN in proximal grains to total GN declined, and the proportion in distal grains increased. Average single grain weight (SGW) increased linearly at G1, G2, G3, and G4 with year of release and contributed to the increase in TGW. The G3 and G4 grain positions had much lower individual grain weights but increased at a faster rate than G1 and G2. At G1, G2, and G3 grain positions, from bottom to top spikelets, the newly released cultivars had the heaviest grains and the old cultivars had the lightest grains. New cultivars had more spikelets than old cultivars and the number of grains (proximal and distal grains) in the apical spike increased with year of release. The length of five internodes decreased significantly with year of release, more so in the upper than lower internodes, all of which contributed to the decline in plant height. In summary, increasing the number and weight of distal grains could increase grain yield, TGW, and GN.
1. Introduction
Wheat (Triticum aestivum L.) is one of the world’s major food crops, and China is the largest wheat producer and consumer in the world [1]. The increasing population, deteriorating dryland ecological environment, and gradual reduction in cultivatable area are putting increasing pressure on worldwide food security [2]. Increasing crop yields by developing new cultivars with higher yield potential and better adaptation to stressful environments [3,4] is an important goal for wheat cultivation and breeding [5].
Wheat grain yield is largely determined by grain number and potential grain weight [5]. A spikelet produces proximal and distal grains [6], and when comparing between and within spikelets, the degree and rate of grain filling can vary depending on spikelet position on the spike [7,8,9]. Distal grains have a poor grain-filling rate compared to proximal grains [10]. Within the spikelet, proximal grains dominate assimilate distribution [11] and surpass distal grains in single grain weight [8,12,13]. Cultivation and breeding measures can affect grain development. The effect of grain position within the spikelet on grain number and thousand-grain weight (TGW) differs between old and new wheat cultivars [14]. Yet, most genetic improvement studies have not addressed the effect of proximal and distal grains on TGW, Grain number per m2 (GN), or yield in China.
Wheat breeding has led to many changes in yield-related traits, including harvest index (HI) [15,16,17,18]. A reduction in plant height can increase HI [18,19,20], but it is not clear how stem internode lengths of wheat cultivar have changed with year of release in China. In addition, the photosynthetic capacity of wheat and assimilate transfer are a focus of breeding; improvement in these traits are conducive to increasing yield [18,21,22]. For example, genetic improvements in assimilate accumulation and translocation in wheat were mainly reflected in improvements in post-anthesis dry matter accumulation (PostDM) and translocation of dry matter accumulation (TDMa) of pre-anthesis dry matter assimilates (PreDM) [18].
The Yellow and Huai Valley is an important wheat area in China [23], which is mostly under irrigation management. The impact of changes in agronomic and physiological traits on yield needs to be investigated to identify new strategies for yield improvement. We conducted field trials for three consecutive years to investigate the impact of grain position within the spikelet on TGW, GN, and yield to explore new strategies for wheat breeding, and evaluate genetic progress in internode length, stem number per m2 at different growth stages, and other yield-related traits in the Yellow and Huai Valley from 1948 to 2012.
2. Materials and Methods
2.1. Experimental Design
The experiments were conducted across three growing seasons (2014–2015, 2015–2016, and 2016–2017) in the same field at Doukou Experimental Station (Jingyang, Shaanxi Province, China; 34° 36ʹ N, 108° 52ʹ E; altitude 427.4 m). Summer rainfall in north China accounts for 65%—75% of the annual precipitation and the precipitation in each growing season is shown in Figure 1. The 2014–2015 growing season had 204.2 mm precipitation, the 2015–2016 growing season had 132.9 mm, and the 2016–2017 growing season had 142.7 mm (Figure 1). Seventeen wheat cultivars released from the 1940s to 2010s and grown in the region were selected for this study (Table 1). Each trial was sub-structured into three major blocks, one for each replicate. Each 5 m2 plot consisted of 10 rows (2 m long × 0.25 m wide). The experiments were sown on 15 October 2014, 2015, and 2016 at 230 grains m−2 and harvested on 4 June 2015, 7 June 2016, and 6 June 2017, respectively. Maize (Zea mays L.) was the previous crop. Furrow irrigation (1500 t ha−1) was applied at the tillering stage (GS25) according to local cultivation practices. Insects and diseases were prevented or controlled by spraying with recommended fungicides and insecticides. Weeds were removed by hand when sighted during the growing seasons. Bamboo sticks (2 m high) and plastic ropes tied to the sticks were used to prevent tall plants from lodging so that the maximum yield potential could be reached.
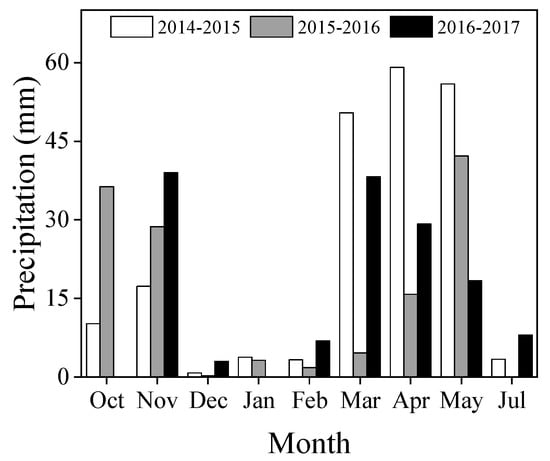
Figure 1.
Monthly precipitation in the 2014–2015, 2015–2016, and 2016–2017 winter wheat growing seasons at Doukou Experimental Station, Shaanxi Province, China.

Table 1.
Representative cultivars of winter wheat in the western Yellow and Huai Valley from 1948–2012.
2.2. Plant Sampling and Measurements
2.2.1. Shoot Trait Measurements
Using the method of fixed-point observation, a 0.5 m section of a row within each plot was selected at the three-leaf stage, and the number of stems recorded at tillering (before winter, GS21), regreening (GS30), jointing (GS31), anthesis (GS64), grain filling (GS73), and maturity (GS92) [24] and converted to number of stems per m2.
At maturity, 10 plants were randomly selected to determine plant height—The height from the ground to the tip of the spike (excluding the awn)—which was recorded in the field. Ten randomly selected main stems were used to measure the length between neighboring nodes. The stem internode under the spike was numbered as the 1st, followed by the 2nd, 3rd, 4th, and 5th internodes from top to bottom and their lengths measured accordingly. Each internode length was measured from the mid-point of their sub-tending nodes.
Chlorophyll content (SPAD) in 20 flag leaves (using SPAD–502) and leaf area index (LAI) were measured at anthesis (GS64) and 20 days after anthesis (GS73).
2.2.2. Accumulation and Transformation of Dry Matter
At anthesis and maturity, plants in a representative 0.5 m of a row within each plot were harvested at ground level. After drying in an oven at 80 °C for 24 h to constant weight, the samples were weighed; the mature samples were manually threshed to remove seeds for weighing.
The dry weight at anthesis is the amount of dry matter accumulated up to anthesis. We assumed that all assimilates accumulated after anthesis are transported to grain, and the rest is supplemented by pre-anthesis assimilates without taking respiration into account. The accumulation and translocation characteristics of the dry matter before and after anthesis and their contribution to grain were calculated as follows:
where TDMa is translocation of dry matter accumulation of pre-anthesis dry matter assimilates, PostDM is post-anthesis assimilate accumulation, PreDM is aboveground biomass dry weight at anthesis, AGBM is aboveground biomass dry weight at maturity, and DWG is dry weight of grain.
AGBM = PreDM + PostDM
PreDM = TDMa − (DWG − AGBM)
PostDM = DWG – TDMa
2.2.3. Yield and Yield-Related Traits
Two central rows (each 1 m long) from each plot were harvested at maturity (GS92). GN was calculated from the samples. Grain yield and TGW were evaluated after being dried for 24 h at 80 °C. Harvest index (HI) was calculated as grain yield/aboveground biomass at maturity (GS92). To determine the dry weight of individual grains at different positions within a spike, 30 spikes were harvested from each plot at maturity (GS92). Each spikelet and its grains were weighed separately after being dried for 24 h at 80 °C. Grains within spikelets from the most proximal to the most distal positions are indicated as G1, G2, G3, and G4 in Appendix A. The number of grains per spikelet for G1, G2, G3, and G4 was counted; G1 and G2 were proximal grains, and G3 and G4 were distal grains [8].
2.3. Statistical Analysis
Analysis of variance was undertaken for data, using the General Linear Model in SAS [25]. The data for three years was treated as replication, the effects of growth seasons and interaction effects between cultivar and growth season were not studied. Path analysis was performed on the effect of TGW and GN on yield and the effects of PreDM, PostDM, and TDMa on yield. Multiple comparisons between cultivars used the Least Significant Difference test (LSD 0.05).
The absolute (grain yield gains in t ha−1 per year) genetic gains of grain yield and related traits were estimated as follows:
where yi represents an average value of grain yield or yield-related traits of cultivar i, and xi is year of cultivar release. The slope b is absolute genetic gain of grain yield or related traits, and a and u are the intercept and residual error [26].
To compare grain weights at different grain positions within a spikelet, we grouped the cultivars according to age (year of release): Old (1940–1960s), Middle (1970–1990s), and New (2000–2010s) (Table 1).
3. Results
3.1. Yield and Related Traits
Yield, TGW, GN, and HI increased significantly with year of release (p < 0.01, R2 = 0.87, 0.87, 0.78, and 0.93, respectively) by 3.96 g m−2 yr−1, 0.17 g yr−1, 68.11 yr−1, and 0.22% yr−1, respectively. TGW and GN increased significantly as yields increased over time (p < 0.01) (Figure 2).
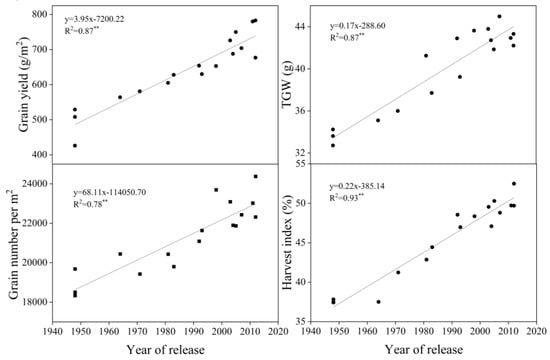
Figure 2.
Linear regressions of grain yield, thousand-grain weight (TGW), grain number per m2, and harvest index (HI) over years of cultivar release. ** Correlation significant at 0.01 level (two-tailed). The fitted data are means across three years for cultivars released from 1948 to 2012.
3.2. Accumulation and Transformation of Dry Matter
PreDM and AGBM did not change significantly with year of release but PostDM and TDMa increased significantly (p < 0.05 and p < 0.01, respectively), with TDMa increasing from 1.17 t ha−1 (Bima4, 1948) to 2.83 t ha−1 (Luomai18, 2012) (Table 2).
Table 2.
Changes in aboveground biomass, related traits of assimilate accumulation, and transportation over years of cultivar release.
The direct effects of PostDM and TDMa contributed significantly to yield with year of release (p < 0.01), with TDMa > PostDM > PreDM (Table 3). PreDM had no significant effects on yield and was not correlated with yield. The direct effect of PostDM contributed significantly to yield (p < 0.01) and had a significant correlation with yield; the indirect effect of PostDM through TDMa (0.37) on yield was also significant. The direct effect of TDMa had the greatest contribution to yield (0.82), but the indirect effect on yield was lower through PostDM and PreDM (Table 3).
Table 3.
Path analyses of 17 wheat cultivars released from 1948 to 2012 and grown in the 2014–2015, 2015–2016, and 2016–2017 winter wheat growing seasons: (1) TGW and grain number per m2 on yield, and (2) PreDM, PostDM, and TDMa on yield.
3.3. Shoot Traits at Different Growth Stages
The number of stems per m2 showed a downward trend from tillering to maturity and decreased with year of release at regreening, jointing, anthesis, and grain filling (20 days after anthesis) (p < 0.01), except at tillering and maturity (Figure 3).
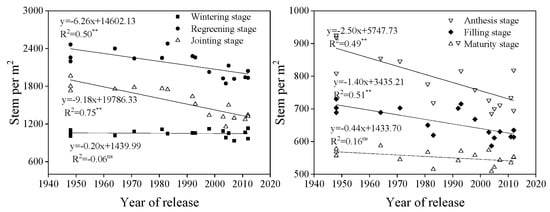
Figure 3.
Linear regressions of stem number per m2 over years of cultivar release at different growth stages. ** Correlation significant at 0.01 level (two-tailed). The fitted data are means across three years for cultivars released from 1948 to 2012.
With year of release, chlorophyll (SPAD) values of flag leaves at anthesis and grain filling increased significantly and had a significant positive correlation with year of release (p < 0.01). At grain filling (20 days after anthesis), LAI increased with a significant positive correlation with year of release (p < 0.01, R2 = 0.86), but no such relationship was found at anthesis (Figure 4).
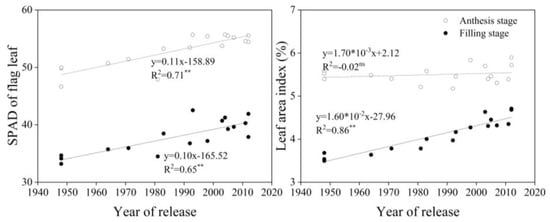
Figure 4.
Linear regressions of chlorophyll (SPAD) and leaf area index at anthesis and grain filling over years of cultivar release. ** Correlation significant at 0.01 level (two-tailed). ns indicates that the value was not significant. The fitted data are means across three years for cultivars released from 1948 to 2012.
Plant height decreased at a rate of 0.90 cm yr−1 and had a significant correlation with year of release (p < 0.01, R2 = 0.91). The rate of decline in the length of the five measured internodes on the stem was significantly correlated with year of release (p < 0.01) (Figure 5).

Figure 5.
Linear regressions of plant height (left) and internode length (right) over years of cultivar release. ** Correction significant at 0.01 level (two-tailed). The fitted data are means across three years for cultivars released from 1948 to 2012.
3.4. Change in Related Traits for G1, G2, G3, and G4
GW, grain number per spike, GN, and average single grain weight (SGW) for G1, G2, G3, and G4 increased linearly with year of release, with G4 > G3 > G2 and G1 from 1950 to 2012 (Figure 6, Figure 7 and Figure 8).
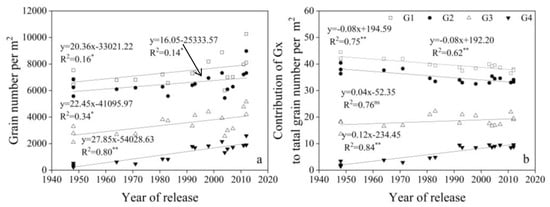
Figure 6.
Linear regressions of (a) grain number per m2 (GN) for G1, G2, G3, and G4 and (b) the contribution of GN for each of G1, G2, G3, and G4 to total grain number per m2 over years of cultivar release. ** Correlation significant at 0.01 level (two-tailed). ns indicates that the value was not significant. The fitted data are means across three years for cultivars released from 1948 to 2012.
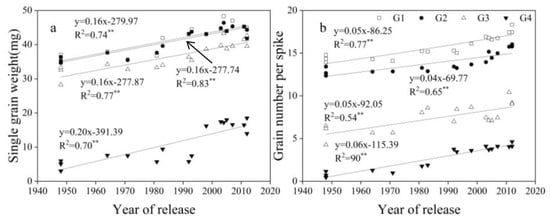
Figure 7.
Linear regressions of (a) average single grain weight (SGW) and (b) grain number per spike at G1, G2, G3, and G4 over years of cultivar release. ** Correlation significant at 0.01 level (two-tailed). The fitted data are means across three years for cultivars released from 1948 to 2012.
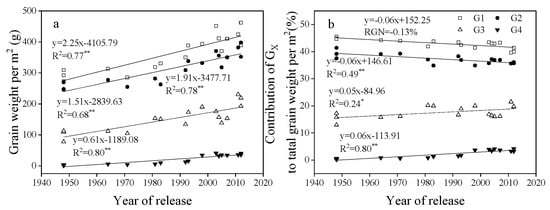
Figure 8.
Linear regressions of (a) grain weight per m2 (GW) for G1, G2, G3, and G4 and (b) the contribution of GW for each of G1, G2, G3, and G4 to total grain weight per m2 over years of cultivar release. * Correlation significant at 0.05 level (two-tailed). ** Correlation significant at 0.01 level (two-tailed). The fitted data are means across three years for cultivars released from 1948 to 2012.
From 1948 to 2012, the contribution rate of G1 and G2 to GN decreased significantly with year of release, but the rate of G4 increased significantly, and G3 did not change (Figure 6). The contribution rate of G1 and G2 to GW was always higher than G3 and G4, and the rate of G1 and G2 to GW decreased significantly, while G3 and G4 ratio increased significantly from 1948 to 2012 (Figure 8).
3.5. Correlation Between the Performance of G1, G2, G3, and G4 and Yield, TGW, GN Per m2
Grain yield had a positive relationship with GW and GN at G1, G2, G3, and G4. Average SGW at G1 and G4 had a significant positive correlation with grain yield, but not at G2 and G3 (Table 4). GW, average SGW at all grain positions, and GN at G3 and G4 had positive correlations with TGW (Table 4). GW and GN at G1, G2, G3, and G4 had positive correlations with total GN, but average SGW from G1 to G4 was not correlated with GN (Table 4).
Table 4.
Pearson correlation between grain weight per m2, average single grain weight (SGW), grain number per m2 in proximal grains (G1 and G2) and distal grains (G3 and G4), and grain yield, TGW, and total grain number per m2 (GPM) in the 2014–2015, 2015–2016, and 2016–2017 winter wheat growing seasons.
3.6. Grain Number and Weight in Spikelet
From the bottom to the top of the spike, grains at G1 had 100% seed setting rate, so the mean grain number at G1 remained the highest (100%) from spikelet 1 to 10 (Appendix A), and then began to decline; the mean grain number at G2 remained highest from spikelet 4 to 8, and began to decrease from spikelet 9 to the top spikelet; grains at G3 had lower seed setting rate, the mean grain number at G3 increased first then decreased from the bottom to the top spikelet, and never reached 1 (Figure 9). Grains at G4 had lowest seed setting rate (less than 50%), and new cultivars had more grains at G1, G2, G3, and G4 in the apical spike (Figure 9). Mean SGW at G1, G2, G3, and G4 increased first and then decreased from the top to bottom spikelet (Figure 10). New cultivars had greater mean SGW at G1, G2, and G3 in all spikelets of the spike than old cultivars. However, mean SGW at G4 had no clear difference between new, middle, and old cultivars (Figure 10).
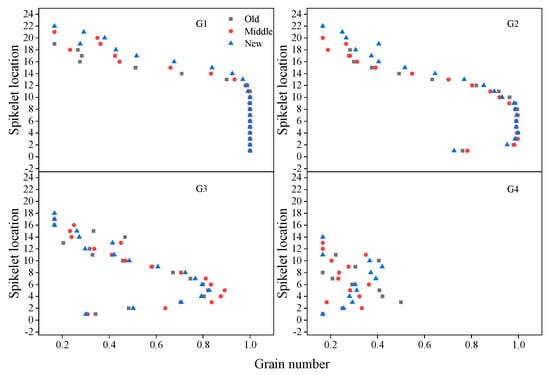
Figure 9.
Mean grain numbers at G1, G2, G3, and G4 in different spikelets in a spike for old, middle, and new cultivars (maximum 1) across three years; old cultivars were released from the 1940s to 1960s, middle cultivars from the 1970s to 1990s, and new cultivars from the 2000s to 2010s.
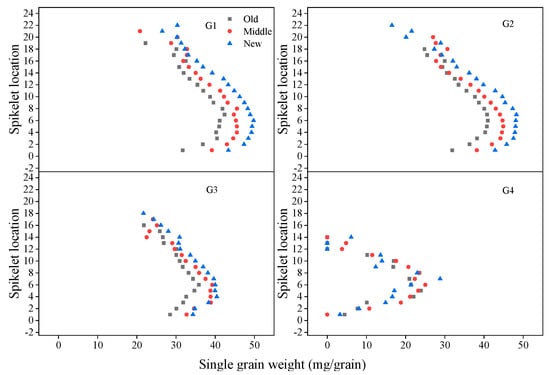
Figure 10.
Average SGW at G1, G2, G3, and G4 in different spikelets in a spike for old, middle, and new cultivars across three years; old cultivars were released from the 1940s to 1960s, middle cultivars from the 1970s to 1990s, and new cultivars from the 2000s to 2010s.
4. Discussion
4.1. Evolution of Yield and Yield-Related Traits
Yields of winter wheat in the western Yellow and Huai Valley increased by 3.95g m−2 yr−1 from 1948 to 2012, more than that in Nanjing (14 kg ha−1 yr−1), similar to that in Chengdu (41 kg ha−1 yr−1) in southern China [27], and less than the 60 kg ha−1 yr−1 in the northern wheat region of China [20], 62 kg ha−1 yr−1 in Shandong Province [22], 57.5 kg ha−1 yr−1 in the southern Yellow and Huai Valley [28], and 51.30 and 70 kg ha−1 yr−1 reported in Henan Province [18,29,30]. Some researchers believe that increases in yield are directly related to TGW or grain number per spike [18,31,32]; this study found that TGW contributed more to yield increases than GN (Table 3). Important yield-related traits, such as SGW and grain number, are often negatively correlated with yield [33]; our results showed that TGW and GN increased significantly with increasing yield (Figure 4, Table 4), and the concurrent increase was attributed to higher photosynthetic capacity (Figure 3).
4.2. Accumulation and Translocation of Dry Matter and Photosynthesis During Grain Filling Contribute to Yield
Nonstructural dry matter produced by photosynthesis is a source of grain biomass [34,35]. Wheat grain yield is translocated from all of the PostDM and some of the PreDM. Aboveground biomass at anthesis plays an important role in grain weight accumulation [36]; the accumulation and translocation of dry matter in wheat cultivars are closely related to grain yield [37]. This study found that although the biomass of different cultivars at anthesis did not change significantly with year of release, the contribution of TDMa to yield gradually increased with year of release (Table 2). PostDM has been shown to significantly contribute to winter wheat grain yield [38]. In our study, PostDM gradually increased during grain filling with year of release and contributed more to yield than PreDM. Several studies have reported that new cultivars have higher Pn in the flag leaf [3,21], especially after anthesis than older cultivars [30]. Our study found that the SPAD of flag leaves increased gradually during anthesis and grain filling. While there was no significant change in LAI at anthesis, SPAD increased significantly with year of release during grain filling. This suggests that group photosynthetic capacity during grain filling is promoted with year of release, which agrees with the findings of Parry et al. (2010) and the higher contribution of PostDM to grain yield [39].
4.3. Plant Height and Internode Length
Since the Green Revolution, the introduction of dwarfing genes has reduced plant heights and increased lodging resistance, both of which have played a significant role in increasing wheat yields [22,28,32,40,41]. Our results showed that plant height decreased with year of release; indeed, the length of five internodes decreased significantly with year of release, which contributed to the decline in plant height. Dwarfing genes significantly reduced internode length, but the effect of dwarfing genes on the lengths of individual internodes was different [42]; in this study, both middle and new cultivars had similar dwarfing genes to old cultivars (Table 1), but the length of upper internodes had decreased faster than lower internodes with year of release (Figure 5), suggesting that dwarfing genes had more effects on upper internodes. However, any further reductions in plant height will limit aboveground biomass. We found no significant increase in aboveground biomass at maturity with year of release, which is consistent with other studies [17,27,43]. In future, higher yields will require breeder commitment to increasing aboveground biomass [28], which can be supported by increasing the resistance of different internodes to lodging without reducing plant height.
4.4. Relationship Between Stem Numbers, Spike Number Per Area, and Yield
Yield components are frequently reported as a snapshot of the final composition of yield; the final number of spikes per m2 is a consequence of a dynamics process of stems (tillers) per unit area [44]. Tiller composition is directly related to spikes per m2 and grain yield [45]. Wheat plants develop many tillers before the jointing stage, some of which are initiated late in the growing season without sufficient developmental time to produce spikes, flowers, and mature seed [46]. In this study, stem number per unit area did not significantly differ between cultivars at tillering (before winter, GS21), but breeding has changed the survival rate of tillers—stem number per unit area has declined significantly with year of release at the regreening, jointing and anthesis stages; in other words, the old cultivars produced more tillers than new cultivars. However, most of tillers were not productive in old cultivars, but wasted more assimilate in the unproductive tillers than new cultivars. From the above results, the rational population structure of new cultivars during growth contributed to more effective resource use and higher wheat yields than old cultivars.
4.5. Contribution and Influence of Proximal and Distal Grains to Yield, TGW, and GN
The spikelet has proximal and distal grains [6]. Our study found that total GW at G1, G2, G3, and G4 increased significantly in a linear fashion with year of release, suggesting that both proximal and distal grains contributed to yield increases from 1948 to 2012 in the western Yellow and Huai Valley. Previous studies showed that improvements in distal (G3, G4) grains can improve grain yield [14]. In this study, the contribution rate of G1 and G2 to grain yield per area decreased with year of release, but the proportion of G3 and G4 increased with year of release (Figure 8), suggesting that distal grains contribute more to the breeding process.
Compared with old cultivars, GN is the main driving force for increasing grain yield in new cultivars [47]. GN at each of the four grain positions contributed to the increased of total grain number per area. GN at G1 and G2 was much higher than that at G3 and G4. However, the contribution ratio of GN at G1 and G2 to GN at all grain positions has declined, and the proportion at G3 and G4 has increased, indicating that the proportion of distal grains to GN at all grain positions is increasing. Many studies have shown that an increase in TGW is important for yield [21,30]. This study found that the average SGW at G1, G2, G3, and G4 increased linearly with year of release, and contributed to the increase in TGW. The grain weight of distal grains is significantly lower than that of proximal grains [48,49]. In this study, G3 and G4 had much lower SGW than G1 and G2, but G3 and G4 increased at a faster rate (Figure 7). Future increases in TGW can be achieved by increasing grain weight at G3 and G4. Within the spikelet, individual grain weight and fruiting efficiency vary due to uneven development [8,50]. Grain number and grain weight vary between and within spikelets [51,52]. With year of release, new cultivars had higher SGW at G1, G2, and G3 in all spikelets than the middle and old cultivars, and G4 had no clear regularity among new, middle, and old cultivars. Increasing the number of small flowers per spike can increase yield, which is one of the goals for breeding selection [53]. In our study, new cultivars had more grains at G1 and G2 in the apical spike than the middle and old cultivars. In addition, new cultivars had more spikelets than old cultivars, and more spikelets at G1, G2, G3, and G4 than old cultivars. On the whole, SGW and GN in positions 3 and 4 are still poorer than positions 1 and 2, plant hormones are related to grain set and filling of distal grains, the regulation mechanism of floret degeneration needs further study, and then engineered breeding methods could be used to promote development distal grains in the future.
5. Conclusions
Wheat yields in the western Yellow and Huai Valley have gradually increased with year of release since 1948. TDMa and the contribution of PostDM to grain yield have increased significantly. Different grain positions within the spikelet have significant effects on yield, TGW, and GN. GW, GN, and average SGW at G1, G2, G3, and G4 have significantly increased. The contribution ratio of distal grains to GN and yield is increasing, and the individual grain weights of distal grains have increased with year of release faster than those of proximal grains. Wheat breeders should—While paying attention to PostDM—consider the translocation ability of PreDM and increase TGW and GN by increasing grain numbers and weights at the G3 and G4 positions.
Author Contributions
Data curation, F.F., P.D., X.P., X.Q., X.W., Y.C. and K.H.M.S.; formal analysis, P.D.; funding acquisition, X.Q.; investigation, F.F., P.D. and X.P.; methodology, K.H.M.S.; project administration, X.Q.; supervision, X.Q., X.W., Y.C. and K.H.M.S.; writing—original draft, F.F. and P.D.; writing—review & editing, F.F., P.D., X.P., X.Q., X.W., Y.C. and K.H.M.S.
Funding
National Key R&D Program of China: 2018YFD0200103. National Natural Science Foundation of China: 31701384.
Acknowledgments
This research was funded by the National Key R&D Program of China (2018YFD0200403), National Natural Science Foundation of China (31701384), the 111 Project (No. B12007).
Conflicts of Interest
The authors declare no conflict of interest.
Appendix A

Figure A1.
Schematic diagram indicating grain positions in different spikelets (Spikelet 1 is the lowest). Adapted from Acreche [54] and Feng [14].
Figure A1.
Schematic diagram indicating grain positions in different spikelets (Spikelet 1 is the lowest). Adapted from Acreche [54] and Feng [14].

References
- Ghose, B. Food security and food self-sufficiency in China: From past to 2050. Food Energy Secur. 2014, 3, 86–95. [Google Scholar] [CrossRef]
- Lal, R.; Uphoff, N.; Hansen, D.O. Food Security and Environmental Quality in the Developing World; CRC Press: Boca Raton, FL, USA, 2016. [Google Scholar]
- Reynolds, M.; Foulkes, M.J.; Slafer, G.A.; Berry, P.; Parry, M.A.; Snape, J.W.; Angus, W.J. Raising yield potential in wheat. J. Exp. Botany 2009, 60, 1899–1918. [Google Scholar] [CrossRef]
- Tyczewska, A.E.; Woźniak, J.; Gracz, J.; Kuczyński, J.; Twardowski, T. Towards food security: Current state and future prospects of agrobiotechnology. Trends Biotechnol. 2018, 36, 1219–1229. [Google Scholar] [CrossRef]
- Qin, X.; Zhang, F.; Liu, C.; Yu, H.; Cao, B.; Tian, S.; Liao, Y.; Siddique, K.H. Wheat yield improvements in China: Past trends and future directions. Field Crops Res. 2015, 177, 117–124. [Google Scholar] [CrossRef]
- Langer, R.H.M.; Hanif, M. A study of floret development in wheat (Triticum aestivum L.). Ann. Botany 1973, 37, 743–751. [Google Scholar] [CrossRef]
- Yang, J.; Zhang, J.; Liu, K.; Wang, Z.; Liu, L. Abscisic acid and ethylene interact in wheat grains in response to soil drying during grain filling. New Phytol. 2006, 171, 293–303. [Google Scholar] [CrossRef]
- Ferrante, A.; Savin, R.; Slafer, G.A. Relationship between fruiting efficiency and grain weight in durum wheat. Field Crops Res. 2015, 177, 109–116. [Google Scholar] [CrossRef]
- Slafer, G.A.; Elia, M.; Savin, R.; García, G.A.; Terrile, I.I.; Ferrante, A.; Miralles, D.J.; González, F.G. Fruiting efficiency: An alternative trait to further rise wheat yield. Food Energy Secur. 2015, 4, 92–109. [Google Scholar] [CrossRef]
- Baillot, N.; Girousse, C.; Allard, V.; Piquet-Pissaloux, A.; Le Gouis, J. Different grain-filling rates explain grain-weight differences along the wheat ear. PLoS ONE 2018, 13, e0209597. [Google Scholar] [CrossRef]
- Ravi, I.; Ghildiyal, M.C. Translocation of 14C-sucrose within ear in durum and aestivum wheat varieties. J. Agron. Crop Sci. 2001, 189, 9–13. [Google Scholar] [CrossRef]
- Calderini, D.F.; Ortiz-Monasterio, I. Crop physiology & metabolism: Grain position affects grain macronutrient and micronutrient concentrations in wheat. Crop Sci. 2003, 43, 141–151. [Google Scholar]
- Rajala, A.; Hakala, K.; Mäkelä, P.; Muurinen, S.; Peltonen-Sainio, P. Spring wheat response to timing of water deficit through sink and grain filling capacity. Field Crops Res. 2009, 114, 263–271. [Google Scholar] [CrossRef]
- Feng, F.; Han, Y.; Wang, S.; Yin, Z.; Peng, M.; Zhou, M.; Gao, W.; Wen, X.; Qin, X.; Siddique, K.H.M. The effect of grain position on genetic improvement of grain number and thousand grain weight in winter wheat in North China. Front. Plant Sci. 2018, 9, 129. [Google Scholar] [CrossRef]
- Siddique, K.H.M.; Kirby, E.J.M.; Perry, M.W. Ear:stem ratio in old and modern wheat varieties; relationship with improvement in number of grains per ear and yield. Field Crop Res. 1989, 21, 59–78. [Google Scholar] [CrossRef]
- Siddique, K.H.M.; Belford, R.K.; Perry, M.W.; Tennant, D. Growth, development and light interception of old and modern wheat cultivars in a Mediterranean-type environment. Austral. J. Agric. Res. 1989, 40, 473–487. [Google Scholar]
- Royo, C.; Alvaro, F.; Martos, V.; Ramdani, A.; Isidro, J.; Villegas, D.; Del Moral, L.F.G. Genetic changes in durum wheat yield components and associated traits in Italian and Spanish varieties during the 20th century. Euphytica 2007, 155, 259–270. [Google Scholar] [CrossRef]
- Zhang, Y.; Xu, W.; Wang, H.; Dong, H.; Qi, X.; Zhao, M.; Fang, Y.; Gao, C.; Hu, L. Progress in genetic improvement of grain yield and related physiological traits of Chinese wheat in Henan Province. Field Crops Res. 2016, 199, 117–128. [Google Scholar] [CrossRef]
- Flohr, B.M.; Hunt, J.R.; Kirkegaard, J.A.; Evans, J.R.; Swan, A.; Rheinheimer, B. Genetic gains in NSW wheat cultivars from 1901 to 2014 as revealed from synchronous flowering during the optimum period. Eur. J. Agron. 2018, 98, 1–13. [Google Scholar] [CrossRef]
- Zhou, Y.; He, Z.; Sui, X.; Xia, X.; Zhang, X.; Zhang, G. Genetic improvement of grain yield and associated traits in the northern China winter wheat region from 1960 to 2000. Crop Sci. 2007, 47, 245–253. [Google Scholar] [CrossRef]
- Tian, Z.; Jing, Q.; Dai, T.; Jiang, D.; Cao, W. Effects of genetic improvements on grain yield and agronomic traits of winter wheat in the Yangtze River Basin of China. Field Crops Res. 2011, 124, 417–425. [Google Scholar] [CrossRef]
- Xiao, Y.; Qian, Z.; Wu, K.; Liu, J.; Xia, X.; Ji, W.; He, Z. Genetic gains in grain yield and physiological traits of winter wheat in Shandong Province, China, from 1969 to 2006. Crop Sci. 2012, 52, 44–56. [Google Scholar] [CrossRef]
- Qin, X.; Feng, F.; Wen, X.; Siddique, K.H.; Liao, Y. Historical genetic responses of yield and root traits in winter wheat in the Yellow-Huai-Hai River Valley Region of China due to modern breeding (1948–2012). Plant and Soil. 2019, 439, 7–18. [Google Scholar] [CrossRef]
- Zadoks, J.C.; Chang, T.T.; Konzak, C.F. A decimal code for the growth stage of cereals. Weed Res. 1974, 14, 415–421. [Google Scholar] [CrossRef]
- SAS Institute. SAS Version 9.1.2, 2003; SAS Institute Inc.: Cary, NC, USA, 2002–2003. [Google Scholar]
- Ortiz-Monasterio, R.; Sayre, K.; Rajaram, S.; McMahon, M. Genetic progress in wheat yield and nitrogen use efficiency under four nitrogen rates. Crop Sci. 1997, 37, 898–904. [Google Scholar] [CrossRef]
- Zhou, Y.; Zhu, H.; Cai, S.; He, Z.; Zhang, X.; Xia, X.; Zhang, G. Genetic improvement of grain yield and associated traits in the southern China winter wheat region: 1949 to 2000. Euphytica 2007, 157, 465–473. [Google Scholar] [CrossRef]
- Gao, F.; Ma, D.; Yin, G.; Rasheed, A.; Yan, D.; Xiao, Y.; Wu, X.; Xia, X.; He, Z. Genetic progress in grain yield and physiological traits in Chinese wheat cultivars of Southern Yellow and Huai valley winter wheat zone since 1950. Crop Sci. 2017, 57, 760–773. [Google Scholar] [CrossRef]
- Zhang, Y.; Xu, W.; Wang, H.; Fang, Y.; Dong, H.; Qi, X. Progress in improving stem lodging resistance of Chinese wheat cultivars. Euphytica 2016, 212, 275–286. [Google Scholar] [CrossRef]
- Zheng, T.C.; Zhang, X.K.; Yin, G.H.; Wang, L.N.; Han, Y.L.; Chen, L.; Huang, F.; Tang, J.W.; Xia, X.C.; He, Z.H. Genetic gains in grain yield, net photosynthesis and stomatal conductance achieved in Henan Province of China between 1981 and 2008. Field Crops Res. 2011, 122, 225–233. [Google Scholar] [CrossRef]
- Beche, E.; Benin, G.; da Silva, C.L.; Munaro, L.B.; Marchese, J.A. Genetic gain in yield and changes associated with physiological traits in Brazilian wheat during the 20th century. Eur. J. Agron. 2014, 61, 49–59. [Google Scholar] [CrossRef]
- Keser, M.; Gummadov, N.; Akin, B.; Belen, S.; Mert, Z.; Taner, S.; Topal, A.; Yazar, S.; Morgounov, A.; Sharma, R.C. Genetic gains in wheat in Turkey: Winter wheat for dryland conditions. Crop J. 2017, 5, 533–540. [Google Scholar] [CrossRef]
- Gegas, V.C.; Nazari, A.; Griffiths, S.; Simmonds, J.; Fish, L.; Orford, S.; Sayers, L.; Doonan, J.H.; Snape, J.W. A genetic framework for grain size and shape variation in wheat. Plant Cell 2010, 22, 1046–1056. [Google Scholar] [CrossRef]
- Pheloung, P.; Siddique, K.H. Contribution of stem dry matter to grain yield in wheat cultivars. Funct. Plant Biol. 1991, 18, 53–64. [Google Scholar] [CrossRef]
- Liang, W.; Zhang, Z.; Wen, X.; Liao, Y.; Liu, Y. Effect of non-structural carbohydrate accumulation in the stem pre-anthesis on grain filling of wheat inferior grain. Field Crops Res. 2017, 211, 66–76. [Google Scholar] [CrossRef]
- Tang, Y.; Rosewarne, G.M.; Li, C.; Wu, X.; Yang, W.; Wu, C. Physiological factors underpinning grain yield improvements of synthetic-derived wheat in Southwestern China. Crop Sci. 2015, 55, 98–112. [Google Scholar] [CrossRef]
- Aggarwal, P.; Fischer, R.; Liboon, S. Source–sink relations and effects of post-anthesis canopy defoliation in wheat at low latitudes. J. Agric. Sci. 1990, 114, 93–99. [Google Scholar] [CrossRef]
- Slafer, G.A.; Savin, R. Source–sink relationships and grain mass at different positions within the spike in wheat. Field Crops Res. 1994, 37, 39–49. [Google Scholar] [CrossRef]
- Parry, M.A.; Reynolds, M.; Salvucci, M.E.; Raines, C.; Andralojc, P.J.; Zhu, X.-G.; Price, G.D.; Condon, A.G.; Furbank, R.T. Raising yield potential of wheat. II. Increasing photosynthetic capacity and efficiency. J. Exp. Botany 2010, 62, 453–467. [Google Scholar]
- Chairi, F.; Vergara-Diaz, O.; Vatter, T.; Aparicio, N.; Nieto-Taladriz, M.T.; Kefauver, S.C.; Bort, J.; Serret, M.D.; Araus, J.L. Post-green revolution genetic advance in durum wheat: The case of Spain. Field Crops Res. 2018, 228, 158–169. [Google Scholar] [CrossRef]
- Moghaddam, M.E.; Jalal Kamali, M.R.; Soda, N.; Sadre Jahani, S.; Ghodsi, M. Temporal variation in phonological and agronomic traits of some irrigated facultative/winter bread wheat, Triticum aestivum L., cultivars released between 1943 and 2011 in Iran. Crop Breeding J. 2016, 6, 9–16. [Google Scholar]
- Wang, Y.S.; Chen, L.; Du, Y.Y.; Yang, Z.Y.; Condon, A.G.; Hu, Y.G. Genetic effectof dwarfing gene Rht13 compared with Rht-D1b on plant height and someagronomic traits in common wheat, Triticum aestivum L. Field Crops Res. 2014, 162, 39–47. [Google Scholar] [CrossRef]
- Joudi, M.; Ahmadi, A.; Mohammadi, V.; Abbasi, A.; Mohammadi, H. Genetic changes in agronomic and phenologic traits of Iranian wheat cultivars grown in different environmental conditions. Euphytica 2014, 196, 237–249. [Google Scholar] [CrossRef]
- Slafer, G.A.; Savin, R.; Sadras, V.O. Coarse and fine regulation of wheat yield components in response to genotype and environment. Field Crops Res. 2014, 157, 71–83. [Google Scholar] [CrossRef]
- Cai, T.; Xu, H.; Peng, D.; Yin, Y.; Yang, W.; Ni, Y.; Chen, X.; Xu, C.; Yang, D.; Cui, Z.; et al. Exogenous hormonal application improves grain yield of wheat by optimizing tiller productivity. Field Crops Res. 2014, 155, 172–183. [Google Scholar] [CrossRef]
- Qin, X.; Weiner, J.; Qi, L.; Xiong, Y.; Li, F. Allometric analysis of the effects of density on reproductive allocation and Harvest Index in 6 varieties of wheat, Triticum. Field Crops Res. 2013, 144, 162–166. [Google Scholar] [CrossRef]
- Foulkes, M.J.; Reynolds, M.P.; Sylvester-Bradley, R. Genetic improvement of grain crops: Yield potential. In Crop Physiology Applications for Genetic Improvement and Agronomy; Sadras, V.O., Calderini, D.F., Eds.; Academic Press: Amsterdam, The Netherlands, 2009; pp. 355–386. [Google Scholar]
- Hoang, K.; Li, X.; Bo, Y.; Zhou, Q.; Cai, J.; Wang, X.; Cai, H.; Dai, T.; Cao, W.; Jiang, D. Accumulation of high-molecular-weight glutenin subunits in superior and inferior grains of a winter wheat, Yangmai 158. Cereal Chem. 2017, 94, 508–512. [Google Scholar] [CrossRef]
- Wang, L.; Yu, X.; Yang, Y.; Chen, X.; Wang, Q.; Zhang, X.; Ran, L.; Xiong, F. Morphology and Physicochemical Properties of Starch in Wheat Superior and Inferior Grains. Starch-Stärke 2018, 70, 1700177. [Google Scholar] [CrossRef]
- Guo, Z.; Schnurbusch, T. Variation of floret fertility in hexaploid wheat revealed by tiller removal. J. Exp. Bot. 2015, 66, 5945–5958. [Google Scholar] [CrossRef]
- Li, Y.; Cui, Z.; Ni, Y.; Zheng, M.; Yang, D.; Jin, M.; Chen, J.; Wang, Z.; Yin, Y. Plant density effect on grain number and weight of two winter wheat cultivars at different spikelet and grain positions. PLoS ONE 2016, 11, e0155351. [Google Scholar] [CrossRef]
- Miralles, D.J.; Slafer, G.A. Individual grain weight responses to genetic reduction in culm length in wheat as affected by source-sink manipulations. Field Crops Res. 1995, 43, 55–66. [Google Scholar] [CrossRef]
- Slafer, G.A.; Andrade, F.H. Physiological attributes related to the generation of grain yield in bread wheat cultivars released at different eras. Field Crops Res. 1993, 31, 351–367. [Google Scholar] [CrossRef]
- Acreche, M.M.; Slafer, G.A. Grain weight response to increases in number of grains in wheat in a Mediterranean area. Field Crops Res. 2006, 98, 52–59. [Google Scholar] [CrossRef]


© 2019 by the authors. Licensee MDPI, Basel, Switzerland. This article is an open access article distributed under the terms and conditions of the Creative Commons Attribution (CC BY) license (http://creativecommons.org/licenses/by/4.0/).