Abstract
Soil pH is a key factor affecting the growth of blueberries. Understanding the response mechanism of blueberries to different pH values and selecting suitable evaluation indexes are the basis of breeding new blueberry cultivars with high pH tolerances. The effects of different soil pH treatments for 17 months on the plant growth, fruit yield, photosynthetic characteristics, and leaf microelement concentration of Vaccinium ashei Reade ‘Climax’ and V. corymbosum hybrid ‘Chaoyue No. 1′ were studied. Plant height, main stem diameter, branch number per plant, leaf dry weight, stem dry weight, root dry weight, and total dry weight decreased with increasing soil pH. With an increase in soil pH, the first flowering date, 50% flowering date, first ripening date, and 50% ripening date of the two cultivars were postponed, and the flower bud numbers per plant, the floret numbers per bud, and yield per plant showed a downward trend. Moreover, the fruit quality decreased, which was reflected in the increase in the titratable acid content (TA) and the decrease in the total soluble solids content (TSS) and the TSS:TA ratio in the high pH treatment. With increasing soil pH, the chlorophyll content index (CCI), maximal photochemical efficiency of the PSII (Fv/Fm), quantum photosynthetic yield of the PSII (Y(II)) and net photosynthetic rate (Pn) of the two cultivars showed a downward trend, and some microelement concentrations in the leaves were imbalanced. Under high pH treatment, ‘Chaoyue No. 1′ had a relatively higher plant biomass and fruit yield, so it had a stronger tolerance to high pH than ‘Climax’ did. More strongly acidified rhizosphere soil capacity, as well as higher CCI, Fv/Fm, Y(II), and Pn values were the main reasons for the high pH tolerance of ‘Chaoyue No. 1′. Compared with destructive biomass indicators such as plant weight, nondestructive indicators such as CCI, Fv/Fm, and Y(II) can be more valuable indicators for fast and accurate evaluation of blueberry tolerance to high pH at early stages of treatment.
1. Introduction
Blueberry is a perennial shrub belonging to the genus Vaccinium in the Ericaceae family. It is popular worldwide because of the high nutritional value of its fruit and its strong antioxidant capacity [1,2]. Blueberry is an acid-loving plant [3], and a suitable soil pH for its optimal growth is approximately 4.0–5.0 [4,5]. Some studies have shown that elevated pH in the rhizosphere for blueberry will lead to nutritional imbalance, leaf iron deficiency chlorosis, and a decrease in photosynthesis, thereby inhibiting plant growth and reducing yield [6,7]. However, most of the soil pH in the field cannot meet this requirement, and a relatively high soil pH value is one of the main limiting factors affecting blueberry growth. In production, soil pH is usually reduced by the application of acidifying soil amendments [8]. However, the cost of acidifying soil is expensive and may not be a long-term solution for blueberry production in high-pH soils [4].
Breeding blueberry cultivars with a high pH tolerance is one of the appropriate ways to solve this problem. Different species and cultivars of Vaccinium have different abilities to tolerate high pH values [4,9,10], so new cultivars of blueberry with more tolerance to high-pH soil can be bred through a breeding program. However, new blueberry germplasms created by crossing or other breeding methods usually take several years to bloom and bear fruit. As fruit yield is the production target of blueberry, the time required to evaluate this metric is too long for use in tolerance breeding. Therefore, fruit yield is not a convenient evaluation index for blueberry high pH tolerance breeding. Plant biomass is a kind of widely used index, but it is destructive. The chlorophyll fluorescence is an important and easily measured parameter for plant stress evaluation [11], but its relationship with blueberry fruit yield under unsuited pH environment is not clear. The selection of indexes closely related to plant biomass and fruit yield, especially nondestructive indexes, is of great benefit to the early evaluation of high pH tolerance for new blueberry germplasms [4].
In China, blueberries have been introduced from America and Europe and evaluated for their adaptability since the 1980s, and some blueberry cultivars adapted to local conditions have been cultivated [12]. After entering the 21st century, the blueberry industry began developing rapidly. From 2006 to 2015, the planting area and yield of blueberries increased from 681 ha and 342 t to 31,210 ha and 4234 t, respectively, and eating the fresh fruit is one of the main modes of blueberry fruit consumption in China [13]. Three types of blueberries, mainly introduced from abroad, are commonly cultivated in China: rabbiteye blueberry (V. ashei), highbush blueberry (V. corymbosum), and lowbush blueberry (V. angustifolium) [12]. Because of the lower chilling requirement of rabbiteye blueberry and southern highbush blueberry [14], they have been widely used in southern China. Excessive rainfall at the fruit ripening stage (from mid-June to early July) of the rabbiteye blueberry causes poor fruit coloration, low sugar content, fruit leakage or splitting, and short storage life [15]. This significantly reduces the quality of the fruit, increases the difficulty of harvesting the fruit, and inhibits purchasing and consumption of the fresh fruit. The fruiting period of southern highbush blueberry is often 1 month earlier than that of the rabbiteye blueberry, which may avoid exposure to the rainy season, resulting in a higher fruit quality and greater fresh consumption than that of the rabbiteye blueberry.
However, the adaptability of southern highbush blueberry to unfavorable conditions, such as unsuitably high soil pH values and low organic matter content, is worse than that of the rabbiteye blueberry [12,16,17]; unfavorable conditions can easily lead to leaf yellowing, poor growth, and fruit yield decline in southern highbush blueberry and limits its application in southern China [12]. So, rabbiteye blueberry is mainly planted, and there is a lack of southern highbush blueberry cultivars adapted to local soil conditions, such as low organic matter content and inappropriate pH. In recent years, some blueberry breeding programs, with the objective of attaining high adaptability to local soil conditions, have been carried out in China. Zhang et al. [18] reported that progeny from a southern highbush blueberry cultivar ‘Southmoon’, generated by open pollination, were evaluated for adaptability under field conditions after several years, and some new lines with strong adaptability and high yield were obtained. Wang et al. [19] and Jiang et al. [20] bred new highbush blueberry cultivars ‘Yunlan’ and ‘Xinxin 1′, respectively, with high adaptability in southern China. In this experiment, the effects of long-term soil pH treatments on vegetative growth, fruit characteristics, photosynthetic characteristics, and microelement concentrations in leaves of the rabbiteye blueberry ‘Climax’, a cultivar introduced from USA and widely used in southern China, and the southern highbush blueberry ‘Chaoyue No. 1′, an open-pollinated progeny from ‘Southmoon’ with excellent local adaptability [7,18], were studied, and nondestructive evaluation indexes related to growth and yield are discussed.
2. Materials and Methods
2.1. Plant Materials
The one-year-old rooting cutting of rabbiteye blueberry ‘Climax’ and southern highbush blueberry ‘Chaoyue No. 1′, formerly called A119 [7], were tested in this experiment.
2.2. Plant Cultivation and Treatment
On 15 April 2017, cuttings with similar heights (about 30 cm) and basal shoot diameters (about 0.5 cm) were selected and planted in plastic pots 20 cm in diameter and 20 cm in height. One cutting was planted per pot as a replicate. The cultivation medium was made up of red soil (OrthicAcrisol), peat, and perlite at a volume ratio of 2:2:1. Fifteen liters of medium, mixed with NH4NO3 (8.10 g), Ca (H2PO4)2∙H2O (5.06 g), and K2SO4 (5.25 g), was added to each pot. By adding different amounts of CaCO3 in the culture medium, the pH was adjusted to 4.5, 5.3, or 6.0. The maximum field water holding capacity of soils was 53%. After planting, the soil water content was maintained at approximately 65–75% of the maximum field water holding capacity. Ammonium sulfate (76 kg N ha−1) was applied once at bud break in the second year. During the entire experiment, tap water was used as an irrigation water source, and the water pH was approximately 8. The experiment was carried out in the blueberry nurse with plastic rain-prevent canopy (without wall) of the Institute of Botany, Jiangsu province and the Chinese academy of sciences. The temperature changes during the experiment are shown in Figure 1. At the end of the treatment in mid-September 2018, various indexes were determined, except flowing and fruit characteristics, which were evaluated at flowering and fruiting stages. Two blueberry cultivars were pollinated openly with other southern highbush blueberry cultivars ‘Sharpblue’ and ‘Misty’, and rabbiteye blueberry cultivars ‘Powderblue’ and ‘Brightwell’ as pollinators were planted around them in the nurse.
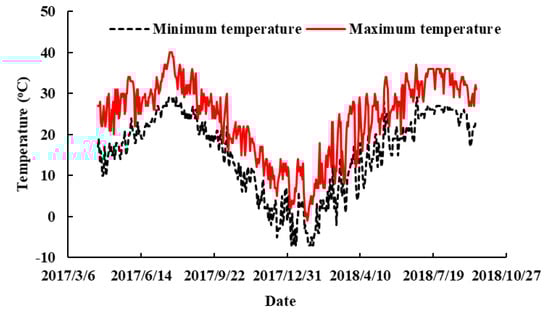
Figure 1.
Daily maximum and minimum temperatures in the nurse during the experiment.
2.3. Data Collection
2.3.1. Growth Parameter Determination
The plant height (distance from the ground to the highest leaf) and the diameter of the main stem (diameter of the base of the main stem measured with Vernier calipers) were measured, and the number of branches on the main stem was recorded before the plant was harvested. The plants were then removed from the pot and divided into three parts: roots, stems, and leaves. The plants were washed with distilled deionized water (DD water) and then dried at 75 °C for constant weight. The dry weights of roots, stems, and leaves were determined. The total plant dry weight (root dry weight + stem dry weight + leaf dry weight) was calculated.
2.3.2. Determination of Flowing and Fruit Characteristics
The flower bud number per plant was recorded before flowering and the floret number per bud was observed at the flowering period in spring 2018. The first flowering date (first flower opening), 50% flowering date, first ripening date (first fruit ripening), and 50% ripening date were observed at the flowering and fruit ripening periods. When 50% of the fruits were ripe, about 20 ripe fruits were randomly taken from each plant to determine the single berry weight, and then the total soluble solids content (TSS) was determined by a handheld refractometer (WYT, Chengdu Optical Factory, China). The titratable acid content (TA) was determined by the method outlined in Ehret et al. [21], and the TSS:TA ratio was calculated. The fruit yield per plant was calculated through measuring the cumulative weight of all the mature fruit harvested.
2.3.3. Determination of Photosynthetic Characteristics
Gas exchange parameters, chlorophyll content index (CCI), and chlorophyll fluorescence parameters were measured before harvest in the morning (8:00 to 11:00 h). Gas exchange parameters such as net photosynthetic rate (Pn), stomatal conductance (Gs), intercellular CO2 concentration (Ci), and transpiration rate (Tr) were measured by a gas exchange system (LI-6400XT, LI-COR, Lincoln, NE, USA). The light intensity of the built-in red and blue LED light source (670 nm and 465 nm, 6400-02B, LI-COR, Lincoln, NE, USA) was 1200 μmol·m−2·s−1, the concentration of CO2 was 400 μmol·mol−1, and the temperature was maintained at 25 °C and a relative humidity of 50%–60% during the measurements in the leaf chamber. The CCI of the leaves was determined with a chlorophyll meter (CCM-200, Opti-Sciences, Tyngsboro, MA, USA). Chlorophyll fluorescence parameters, maximal photochemical efficiency of PSII (Fv/Fm), and quantum photosynthetic yield of PSII (Y(II)) were determined with a pulse-modulated fluorometer (OS1p, Opti-Sciences, Hudson, NH, USA). The top third or fourth leaves were selected for the determination of the above indexes, and three independent samples were measured from each plant. The three determinations from the same plant were averaged for advanced statistical analysis.
2.3.4. Determination of Leaf Microelements
The top third to fifth leaves of each plant were collected, washed with DD water, dried at 75 °C, and ground into powder. Leaf samples (0.2500 g) were accurately weighed and digested completely with HNO3:HClO4 (4:1) mixed acid in an automatic digestion device. The extract was re-dissolved in 10 mL of 5% nitric acid, and the concentrations of Cu, Zn, Fe, and Mn were determined by inductively coupled plasma optical emission spectroscopy (Optima 2100DV, Perkin Elmer, Waltham, MA, USA).
2.3.5. Determination of the pH Value of the Rhizosphere Soil
Each plant was removed from its pot and the soil closely associated with the root system was collected. The soil was dried by air, ground to a powder, and passed through a 2 mm sieve hole. A 10.00 g soil sample was weighed, 25 mL deionized water was added without carbon dioxide, stirred vigorously for 1–2 min, and left to stand for 30 min. Then, the pH was measured with a pH meter.
2.4. Experimental Design and Statistical Analysis
The experiment was performed in a completely random design with four replicates per treatment (each pot was a replicate). Data were subjected to analysis of variance (ANOVA) and Duncan’s multiple range test using SPSS 13.0 software (SPSS Institute, Chicago, IL, USA).
3. Results
3.1. Effects of Different pH Treatments on Rhizosphere Soil pH
After 17 months of treatment, the rhizosphere soil pH of the two blueberries changed, resulting in final soil pH values that were higher than the initial pH. The pH of ‘Chaoyue No. 1′ was lower than that of ‘Climax’ in the all treatments but only significantly lower in the 5.3 treatment (Table 1).

Table 1.
Rhizosphere soil pH change after planted blueberries for 17 months.
3.2. Effects of Different pH Treatments on Vegetative Organ Growth
Plant growths of the two blueberry cultivars were affected under high soil pH (Table 2, Figure S1). Under the soil pH 5.3 treatment, the main stem diameter, root dry weight, stem dry weight, and total plant dry weight, respectively, decreased to 81.2%, 86.9%, 69.7%, and 77.8% of the corresponding values obtained with the soil pH 4.5 treatment for ‘Climax’ and the plant height, main stem diameter, root dry weight, stem dry weight, leaf dry weight, and total plant dry weight, respectively, decreased to 83.6%, 77.5%, 79.9%, 75.3%, 83.8%, and 78.4% of the corresponding values obtained with the soil pH 4.5 treatment for ‘Chaoyue No. 1′. The plant height, branch number, and leaf dry weight for ‘Climax’ and branch number for ‘Chaoyue No. 1′ were not significantly decreased in the pH 5.3 treatment compared with those of the pH 4.5 treatment. Under the pH 6.0 treatment, the plant height, main stem diameter, branch number, root dry weight, stem dry weight, leaf dry weight, and total plant dry weight significantly, respectively, decreased to 42.63%, 35.5%, 52.6%, 7.6%, 5.7%, 21.7%, and 9.8% of the corresponding values obtained with the soil pH 4.5 treatment for ‘Climax’ and to 37.1%, 42.7%, 58.8%, 15.2%, 9.7%, 13.9%, and 12.4% of the corresponding values obtained with the soil pH 4.5 treatment for ‘Chaoyue No. 1′. The results indicated that the inhibition degree of plant growth for ‘Chaoyue No. 1′ was lower than that for ‘Climax’ under the high pH treatment, except for plant height and leaf dry weight.
Table 2.
Effect of different pH treatments on the plant growth of two blueberries.
3.3. Effects of Different pH Treatments on the Flowering and Ripening Times and the Fruit Production and Quality
With the increase in soil pH, the first flowering date, 50% flowering date, first ripening date, and 50% ripening date of the two blueberry cultivars were changed (Table 3). Compared with the soil pH 4.5 treatment, the soil pH 5.3 treatment significantly delayed the 50% flowering date and first ripening date in ‘Climax’ by 2 day and 1 day, respectively; in ‘Chaoyue No. 1′, the first flowering date and 50% flowering date were significantly delayed by 2 day and 4 day, respectively. The first flowering date and 50% ripening date of ‘Climax’, and first ripening date and 50% ripening date of ‘Climax’ and ‘Chaoyue No. 1′ at pH 5.3 treatment had no significant difference compared to those at pH 4.5 treatment. The first flowering date, 50% flowering date, first ripening date, and 50% ripening date of ‘Climax’ and ‘Chaoyue No. 1′ at pH 6 treatment were significantly delayed by 2 day and 2 day, 3 day and 5 day, 8 day and 5 day, and 7 day and 6 day, respectively, compared to those dates resulting from the pH 4.5 treatment. The first flowering date and 50% flowering date of ‘Chaoyue No. 1′ were about a week ahead of ‘Climax’, but the first ripening date and 50% ripening date were approximately one month ahead of ‘Climax’.
Table 3.
Effect of different pH treatments on the flowering and fruit phenological period of two blueberries.
Compared with the soil pH 4.5 treatment, the soil pH 5.3 treatment had no significant effect on the flower bud number per plant and the floret number per bud of the two blueberry cultivars; however, the soil pH 5.3 treatment significantly decreased single fruit weight and yield per plant (Table 4). The soil pH 6.0 treatment significantly reduced the flower bud number per plant, the floret number per bud, single fruit weight, and yield per plant of the two blueberry cultivars; however, the floret number per bud of ‘Chaoyue No. 1′ did not differ between the pH 6.0 and pH 4.5 soil treatments. The flower bud number per plant and yield per plant of ‘Chaoyue No. 1′ under soil pH 6.0 treatment were 50.57% and 23.90% lower, respectively, than those values in the soil pH 4.5 treatment; furthermore, the relative flower bud number per plant and yield per plant of ‘Chaoyue No. 1′ under soil pH 6.0 were significantly higher than those of ‘Climax’ (5.62% and 8.55% lower, respectively, than those values in the soil pH 4.5 treatment). However, the decreased degree of single fruit weight in both blueberries was the same (approximately 68%). These results indicated that ‘Chaoyue No. 1′ had a higher yield than ‘Climax’ in the high-pH environment because of its relatively higher flower bud number per plant and floret number per bud. Compared with the soil pH 4.5 treatment, the soil pH 5.3 treatment had no significant effect on the TSS and TA of ‘Climax’ and ‘Chaoyue No. 1′, but significantly reduced the TSS:TA ratio (Table 4). However, the soil pH 6.0 treatment significantly reduced the TSS and TSS:TA ratio and significantly increased the TA of the two blueberry cultivars.
Table 4.
Effect of different pH treatments on the fruit yield and quality of two blueberries.
3.4. Effects of Different pH Treatments on Leaf Fe, Mn, Cu, and Zn Concentration
Different soil pH treatments had different degrees of effect on the concentrations of Fe, Mn, Cu, and Zn in the leaves of the two blueberry cultivars (Table 5). Soil pH treatment had no significant effect on leaf Fe concentration of two blueberries, except for the treatment of pH 6.0 in ‘Climax’, which significantly increased Fe concentration compared with the treatment of pH 4.5. Compared with the pH 4.5 treatment, the pH 5.3 and 6.0 treatments significantly reduced the Mn and Cu concentrations in the leaves of the two blueberries, except for the Cu concentration in ‘Climax’. The Zn concentration increased significantly in ‘Climax’ under pH 6.0 treatment compared to pH 4.5 and 5.3 treatments, but the Zn levels were not significantly different among the pH treatments in ‘Chaoyue No. 1′.
Table 5.
Effect of different pH treatments on the leaf Fe, Mn, Cu, and Zn concentration of two blueberries.
3.5. Effects of Different pH Treatments on Photosynthetic Characteristics
The CCI, Fv/Fm, and Y(II) decreased gradually with increasing soil pH (Table 6). Under the pH 5.3 treatment, the CCI and Y(II) were, respectively, 64.14% and 92.82% for ‘Climax’ and 85.31% and 86.11% for ‘Chaoyue No. 1′ compared with that of the values obtained with the pH 4.5 treatment. The Fv/Fm of pH 5.3 treatment showed no significant difference in ‘Climax’ than that of pH 4.5 treatment, but it significantly decreased in ‘Chaoyue No. 1′. The CCI, Fv/Fm, and Y(II) of the ‘Climax’ and ‘Chaoyue No. 1′ were, respectively, were 23.97% and 59.33%, 83.74%, and 96.65%, and 67.45% and 72.06% were that of the values obtained with the pH 4.5 treatment for the pH 6.0 treatment. In general, ‘Chaoyue No. 1′ was able to maintain relatively higher CCI, Fv/Fm, and Y(II) values in high soil pH conditions.
Table 6.
Effect of different pH treatments on chlorophyll content index (CCI), the maximal photochemical efficiency of PSII (Fv/Fm), quantum photosynthetic yield of PSII (Y(II)), and gas exchange parameters in leaves of two blueberries.
Different soil pH treatments had different effects on the photosynthetic characteristics of the two blueberry cultivars (Table 6). With the increase in soil pH, the Pn of the two cultivars showed a significant decreasing trend, except for the difference between the pH 5.3 treatment and the pH 4.5 treatment for ‘Climax’; however, the ‘Chaoyue No. 1′ maintained a higher Pn at the pH 6.0 treatment. The Pn under the pH 6.0 treatment was 46.52% that of the value obtained at the pH 4.5 treatment for ‘Chaoyue No. 1′ and 28.53% that of the value obtained at the pH 4.5 treatment for ‘Climax’. The Gs and Tr of ‘Climax’ at pH 5.3 had no significant difference compared with those values obtained with the pH 4.5 treatment, and they decreased significantly at pH 6.0; however, the Gs and Tr significantly decreased with the increase in soil pH for ‘Chaoyue No. 1′. The Ci under the pH 4.5 treatment was significantly lower than that under the pH 6.0 treatment for ‘Climax’; however, there was no different significance between that of the pH 5.3 or 6.0 treatment for ‘Chaoyue No. 1′.
4. Discussion
Soil pH is an important factor affecting the growth of blueberries. Haynes and Swift [22] believed that the growth of highbush blueberry under pH 4.5 was better than that under pH 6.5 in both peat and soil substrates. Austin and Bondari [23] also found that the maximum growth of rabbiteye blueberry ‘Tifblue’ occurred at a pH of 4.3 to 4.4. The results showed that the biomass of the two blueberry cultivars was the highest under the pH 4.5 treatment among the three pH levels. Some growth parameters decreased to a certain extent under the pH 5.3 treatment, while all growth parameters were severely inhibited under the pH 6.0 treatment. This result is generally consistent with previous studies [22,23].
Different blueberry species and cultivars usually have different resistances to high pH levels. Tsuda et al. [10] found that the interspecific hybrids of highbush blueberry ‘Spartan’ and V. bracteatum had higher survival and rooting rates than their parents, of the ‘Spartan’ variety, did, at a pH level of 8.0; moreover, there were significant differences among the different hybrids. Finn et al. [4,9] found that the survival or germination rates and biomasses of different highbush blueberries, lowbush blueberries, and their hybrid offspring were different under high pH conditions, and the resistance of some lowbush blueberry offspring could be improved through a hybrid method. Miyashita and Ishikawa [16] found that the interspecific hybrids of rabbiteye blueberry and highbush blueberry had the same vigor and high pH adaptability as that of the rabbiteye blueberry and had a higher tolerance than the highbush blueberry under high pH conditions. The above studies show that different blueberry populations have different tolerances to high pH, and this tolerance can be inherited by the offspring. The selected cultivar ‘Chaoyue No. 1′ in this study was derived from the open-pollinated progenies of the southern highbush blueberry variety ‘Southmoon’. Previous studies found that many traits, including adaptability to low organic matter content and high pH in soil, of the open-pollinated progenies from ‘Southmoon’ were significantly separated [18]. Although rabbiteye blueberry is generally more adaptable to high pH than southern highbush blueberry [16,17], the results of this study show that the southern highbush blueberry cultivar ‘Chaoyue No. 1′ had a higher relative biomass than the rabbiteye blueberry cultivar ‘Climax’, indicating that it had a stronger tolerance to high pH. At the same time, the results also indicated that highbush blueberry cultivars with a higher tolerance to high pH could be obtained by breeding.
Blueberries suffer long-term stress processes when they grow in high-pH environments in the field. Using the same cultivars and treatment methods, the relative biomass of the two blueberry cultivars grown at high pH for 17 months was lower than that of plants grown at high pH for 6 months [7], which indicated that the prolonged high-pH stress caused more damage to blueberries.
Flower bud differentiation and the flowering phenology of blueberry are mainly affected by genotype and climatic conditions, such as temperature and photoperiod [24,25]. The fruit ripening date of southern highbush blueberry ‘Chaoyue No. 1′ were approximately one month ahead of rabbiteye blueberry ‘Climax’, which could avoid exposure to the rainy season in southern China. The phenological period is sometimes affected by cultivation management, such as gibberellin treatment, which delays flowering and maturation [26]. Togano et al. [27] evaluated how soil texture and pH affected the flowering and harvesting period of blueberry, but the trends varied with treatments and cultivars. Here, we found that the flowering and fruit phenology of the two blueberries were affected by the increase in soil pH, which delayed flowering and fruit ripening.
Soil pH not only affects the growth of blueberry vegetative organs but also affects fruit yield. When the soil pH value increased from 4.5 to 7.0, the fruit yield of ‘Tifblue’ decreased gradually [28]. Austin and Bondari [6] also showed that when the soil pH was lower than 5.0, the total yields of two rabbiteye blueberry cultivars, ‘Delite’ and ‘Tifblue’, were the highest. The results showed here agreed with these by Austin and Bondari [6] and Cummings et al. [28], but the yield of ‘Chaoyue No. 1′ was higher than that of ‘Climax’ under high pH treatment. The fruit yield of blueberry is mainly driven by the flower bud number per plant, the floret number per bud, fruit setting rate, and single fruit weight. Austin and Bondari [6] confirmed that single fruit weight tended to decrease with increasing soil pH or was not significantly affected by soil pH, depending on cultivars and experimental years. This study found that some indexes were affected not only by the genetic differences in the cultivars but also by the rhizosphere pH conditions. In the high-pH environment, the reduction in blueberry yield was due to the reduction in flower bud number per plant, the floret number per bud, and single fruit weight, especially the flower bud number per plant. ‘Climax’ had a greater decline of the number of flower buds than ‘Chaoyue No. 1′ did under high pH treatment, which was the main reason why the production of ‘Climax’ was lower.
The TSS, TA, and TSS:TA ratio are commonly used indicators reflecting blueberry fruit quality that are influenced by cultivars [29] and cultivation management [21]. Togano et al. [27] found that the TSSs of the fruit in ‘Tifblue’ and ‘Rancocas’ blueberry plants cultivated in clay soil were higher than those of ‘Andosol’. Our results showed that high soil pH reduced the TSS and TSS:TA ratio and significantly increased the TA of blueberry, resulting in changes in fruit quality, which may lead to a decline in fruit taste when fresh fruits are consumed.
Changes in soil pH can cause changes in the solubility of various nutrient elements in soil. When plants grow at a nonoptimal pH, their uptake and utilization of nutrient elements will be imbalanced; this seriously affects the growth and development of plants [30]. When the soil pH is higher than the optimum pH for blueberry growth, the leaves of blueberry are prone to interveinal chlorosis. This phenomenon is considered as an iron deficiency chlorosis [31]. However, compared with green leaves, the Fe concentration of yellowed leaves decreased [7], did not change significantly [32], or increased [33], depending on the results of different studies. The results showed that the two blueberry cultivars had typical iron deficiency chlorosis under high pH treatment for 17 months, and the chlorosis degree of the tolerant cultivar ‘Chaoyue No. 1′ was lower (higher chlorophyll content). There was no significant difference in the Fe concentration in the leaves of ‘Chaoyue No. 1′ between the pH 6.0 treatment and the pH 4.5 treatment. However, the Fe concentration in the leaves of ‘Climax’, which was more sensitive to high pH, was significantly higher in the pH 6.0 treatment than in the pH 4.5 treatment. Therefore, the symptoms of iron deficiency chlorosis in leaves may not be due to low iron concentration in leaves but instead due to the inability of leaves to use iron. Mn deficiency also causes chlorosis, similar to iron deficiency. This study, and previous studies, found that the Mn concentration of blueberry leaves decreased under high pH [32]. Some studies have shown that Mn deficiency in blueberries at high pH is also a cause of leaf chlorosis [34], although studies have shown that there was no significant correlation between leaf Mn concentration and chlorosis degree [35]. So, the relationship between Mn deficiency and blueberry leaf chlorosis needs further study under a nonoptimal soil pH. The changes in Cu and Zn concentrations in leaves of different blueberry cultivars were not significantly correlated with their tolerance to increased pH levels. In addition, some studies have found that the nutrient concentration of blueberry leaves in high-pH environments is affected not only by genetic factors but also by antagonism with other nutritional elements in the environment [22]. Therefore, the concentration of Fe and other nutrients in leaves cannot be used to judge the tolerance of blueberries to a high-pH environment.
Photosynthesis can fix energy and produce carbohydrates in plants. The intensity of photosynthesis directly affects plant growth, and chlorophyll content will affect the intensity of photosynthesis. In this study, with the increase in pH, the leaves of the two blueberry cultivars also partially yellowed, the chlorophyll content decreased, and the photosynthetic efficiency also showed a downward trend. Petridis et al. [36] found that photosynthesis limitation in the northern European environment was a major factor affecting the yield of highbush blueberries. Xu et al. [37] found that high-pH-tolerant V. bracteatum could maintain higher chlorophyll content and photosynthetic capacity and have a higher biomass under high pH treatments compared with the low-tolerant highbush blueberry ‘Sharpblue’. The relatively higher chlorophyll content and net photosynthetic rate under high pH treatment found in ‘Chaoyue No. 1′ might contribute to its higher biomass and fruit yield.
In this study, the chlorophyll fluorescence indexes, Fv/Fm, and Y(II) of the two blueberry cultivars under different pH treatments were determined by an OS1p chlorophyll fluorometer. Fv/Fm is the maximum photochemical efficiency of the PS II, which is an important and easily measured parameter for studying the physiological status of the photosynthetic structure. The Fv/Fm value decreases significantly under stressful environments and is often used to measure the potential activity of PSII. Y(II) is the quantum photosynthetic yield of PSII, which can reflect the efficiency of carbon fixation. By measuring these chlorophyll fluorescence indexes, we can quickly and nondestructively study the photosynthetic physiological status of plants. These represent new measurement and diagnosis technology in vivo [11,38]. The fluorescence parameters of the stress-tolerant cultivars of blueberry were higher or more stable than those of the sensitive cultivars under stressful environments, such as high temperature [39], aluminum exposure [40], ultraviolet radiation [41], and high pH [7]. In this study, the Fv/Fm and Y(II) values of the two blueberry cultivars showed a downward trend with increasing soil pH, indicating that the activity of PSII and the carbon fixation ability decreased. Moreover, the degree of decline of the high-pH-tolerant cultivar ‘Chaoyue No. 1′ was lower than that of ‘Climax’, which was consistent with the trend in chlorophyll content and photosynthetic efficiency parameters, indicating that the decline in photosynthetic system activity was the main reason for the decline in photosynthetic capacity of the blueberry plants under the high pH treatment. Compared plants exposed to 6 months of high pH treatment, the same blueberry cultivars had the same trend of chlorophyll fluorescence parameters under long-term (17 months) high pH stress [7]. Moreover, the Fv/Fm and Y(II) values were lower after long-term high pH treatment, which was consistent with the result of the lower relative biomass under long-term pH treatment [7], indicating that the plants were under more severe stress at this time.
Fruit yield, a critical production target of blueberry, is not an early-stage evaluation index in blueberry high pH tolerance breeding program for its long growth period from seedling stage to fruiting stage. Biomass index is a destructive index, although it is suitable for evaluating the high pH tolerance of blueberries. The relationship between microelement concentration and high pH tolerance has different conclusions in different studies. The determination of photosynthetic efficiency index is susceptible to the influence of light intensity in a day, and the measurement is relatively time-consuming, which is not suitable for the evaluation of large-scale resources in breeding programs. Therefore, chlorophyll fluorescence index and CCI, which are highly correlated with biomass, fruit yield, and photosynthetic efficiency, are suitable for rapid and nondestructive evaluation of high pH tolerance of large-scale blueberry breeding resources in early stages.
To adapt to a high-pH environment, plants usually acidify the rhizosphere environment by secreting acid substances (such as protons) from their roots to improve the nutrient uptake efficiency by roots and maintain plant growth [42]. Brown and Draper [43] found that the rhizosphere acidification ability of blueberry was negatively correlated with the chlorosis degree of leaves; that is, the stronger the acidification ability, the lower the chlorosis degree. However, Nunez et al. [3] proved that rhizosphere acidification is not part of the strategy I iron deficiency response of V. arboreum and the southern highbush blueberry grew in nutrient solution (initial pH 5.5) or agarose gels (initial pH 6.0) with nitrate as a nitrogen source. This study agreed with Brown and Draper [43], that ‘Chaoyue No. 1′ maintained a lower rhizosphere pH and a higher chlorophyll content than ‘Climax’ did under different pH treatments, indicating that ‘Chaoyue No. 1′ had a stronger rhizosphere acidification ability, which was conducive to maintaining a higher chlorophyll content, photosynthetic efficiency, and plant growth at high pH.
5. Conclusions
In conclusion, this study compared the tolerance of two blueberry cultivars to long-term high pH treatment. According to the relative biomass and yield changes, it was concluded that the southern highbush blueberry cultivar ‘Chaoyue No. 1′ had a higher tolerance to a high-pH environment than the rabbiteye blueberry cultivar ‘Climax’ did; the higher tolerance of ‘Chaoyue No. 1′ was related to a stronger ability to acidify the rhizosphere and a higher chlorophyll content, chlorophyll fluorescence index, and photosynthetic ability. In addition, long-term high pH treatment caused more serious damage to blueberries than short-term pH treatment did. Compared with indicators requiring plant destruction (such as plant weight) or long-term treatment (such as fruit yield), nondestructive indicators (such as relative chlorophyll content and chlorophyll fluorescence parameters) can be quickly and quantitatively determined to evaluate the adaptability of different blueberry genotypes to high pH. Although the concentration of microelements in blueberry leaves was imbalanced under a high pH treatment, there were many factors that affected the concentration. The correlation between the concentration of microelements and the high pH tolerance of blueberry plants was not significant, so these parameters were not suitable for use as the evaluation indexes of high pH tolerance in blueberry. ‘Chaoyue No. 1′ has higher pH adaptability and an earlier harvest time, which can allow it to avoid the local rainy season and improve fruit quality, indicating that ‘Chaoyue No. 1′ has higher utilization value in this blueberry production region.
Supplementary Materials
The following are available online at https://www.mdpi.com/2073-4395/9/7/357/s1, Figure S1. Different soil pH treatment on the growth of two blueberries, ‘Chaoyue No. 1’ (A) and ‘Climax’ (B).
Author Contributions
Conceptualization, Y.J. and H.Y.; Methodology, Y.J., Q.Z., and H.Y.; Formal analysis, Y.J., Q.Z., and J.W.; Investigation, Y.J., Q.Z., J.W., J.J., Y.L., J.C., and H.Y.; Resources, H.Y.; Writing—original draft preparation, Y.J., Q.Z., and J.W.; Writing—review and editing, H.Y.; Supervision, Y.J. and H.Y.; Project administration, Y.J. and H.Y.; Funding acquisition, Y.J. and H.Y.
Funding
This work was supported by the National Natural Science Foundation of China (31301838; 31601709), the Natural Science Foundation of Jiangsu Province, China (BK20170615), the Modern Agricultural Projects of Jiangsu Province (BE2017373), and the Opening Fund of Jiangsu Province Key Laboratory for Plant Ex-situ Conservation (QD201303).
Conflicts of Interest
The authors declare no conflict of interest.
References
- Scalzo, J.; Stanley, J.; Alspach, P.; Mezzetti, B. Preliminary evaluation of fruit traits and phytochemicals in a highbush blueberry seedling population. J. Berry Res. 2013, 3, 103–111. [Google Scholar]
- Cappai, F.; Benevenuto, J.; Ferrão, L.F.V.; Munoz, P. Molecular and genetic bases of fruit firmness variation in blueberry—A review. Agronomy 2018, 8, 174. [Google Scholar] [CrossRef]
- Nunez, G.H.; Olmstead, J.W.; Darnell, R.L. Rhizosphere acidification is not part of the strategy I iron deficiency response of Vaccinium arboreum and the southern highbush blueberry. HortScience 2015, 50, 1064–1069. [Google Scholar] [CrossRef]
- Finn, C.E.; Luby, J.J.; Rosen, C.J.; Ascher, P.D. Blueberry germplasm screening at several soil pH regimes. I. Plant survival and growth. J. Am. Soc. Hortic. Sci. 1993, 118, 377–382. [Google Scholar] [CrossRef]
- Gallegos-Cedillo, V.M.; Alvaro, J.E.; Capatos, T.; Hachmann, T.L.; Carrasco, G.; Urrestarazu, M. Effect of pH and silicon in the fertigation solution on vegetative growth of blueberry plants in organic agriculture. HortScience 2018, 53, 1423–1428. [Google Scholar] [CrossRef]
- Austin, M.E.; Bondari, K. Soil pH effects on yield and fruit size of two rabbiteye blueberry cultivars. J. Hortic. Sci. 1992, 67, 779–785. [Google Scholar] [CrossRef]
- Jiang, Y.; Li, Y.; Zeng, Q.; Wei, J.; Yu, H. The effect of soil pH on plant growth, leaf chlorophyll fluorescence and mineral element content of two blueberries. Acta Hortic. 2017, 1180, 269–276. [Google Scholar] [CrossRef]
- Almutairi, K.F.; Machado, R.M.A.; Bryla, D.R.; Strik, B.C. Chemigation with micronized sulfur rapidly reduces soil pH in a new planting of northern highbush blueberry. HortScience 2017, 52, 1413–1418. [Google Scholar] [CrossRef]
- Finn, C.E.; Luby, J.J.; Rosen, C.J.; Ascher, P.D. Evaluation in vitro of blueberry germplasm for higher pH tolerance. J. Am. Soc. Hortic. Sci. 1991, 116, 312–316. [Google Scholar] [CrossRef]
- Tsuda, H.; Kunitake, H.; Aoki, Y.; Oyama, A.; Tetsumura, T.; Komatsu, H.; Yoshioka, K. Efficient in vitro screening for higher soil pH adaptability of intersectional hybrids in blueberry. HortScience 2014, 49, 141–144. [Google Scholar] [CrossRef]
- Baker, N.R. Chlorophyll fluorescence: A probe of photosynthesis in vivo. Annu. Rev. Plant Biol. 2008, 59, 89–113. [Google Scholar] [CrossRef] [PubMed]
- He, S.; Yu, H.; Gu, Y. Prospects and problems of blueberry growing in China. Acta Hortic. 2009, 810, 61–64. [Google Scholar]
- Li, Y.; Sun, H.; Chen, L. The blueberry industry of China: The past 10 years and the future. Acta Hortic. 2017, 1180, 531–536. [Google Scholar] [CrossRef]
- Hancock, J.F.; Lyrene, P.; Finn, C.E.; Vorsa, N.; Lobos, G.A. Blueberries and cranberries. In Temperate Fruit Crop Breeding; Hancock, J.F., Ed.; Springer Verlag: Berlin, Germany, 2008; pp. 115–149. [Google Scholar]
- Li, Y.; Hong, Y. The current status and future of the blueberry industry in China. Acta Hortic. 2009, 810, 445–456. [Google Scholar]
- Miyashita, C.; Ishikawa, S. Higher Soil pH Adaptability of Interspecific Hybrids between Highbush Blueberry and Rabbiteye Blueberry; Bulletin of Tokyo Metropolitan Agriculture and Forestry Ressearch Center: Tokyo, Japan, 2008; pp. 57–65. [Google Scholar]
- Katakura, Y.; Yokomizo, H. Effects of nutrient solution pH on the growth nutrient uptake of highbush and rabbiteye blueberries. Jpn. J. Soil Sci. Plant Nutr. 1995, 66, 513–519. [Google Scholar]
- Zhang, D.; Yu, H.; Jiang, Y.; Wang, C. Seedling selection of ‘Southmoon’ blueberry. Acta Hortic. 2009, 810, 65–70. [Google Scholar] [CrossRef]
- Wang, L.; Li, X.; Liang, M.; Gao, Z.; Xu, G.; Liu, J.; Chen, P.; Wan, H.; Jin, Y.; Liu, J.; et al. A new blueberry cultivar ‘Yunlan’. Acta Hortic. Sin. 2015, 42, 2843–2844. [Google Scholar]
- Jiang, Y.; Wei, J.; Zeng, Q.; Yu, H. A new cultivar of southern highbush blueberry ‘Xinxin 1’. Acta Hortic. Sin. 2015, 42, 2845–2846. [Google Scholar]
- Ehret, D.L.; Frey, B.; Forge, T.; Helmer, T.; Bryla, D.R. Effects of drip irrigation configuration and rate on yield and fruit quality of young highbush blueberry plants. HortScience 2012, 47, 414–421. [Google Scholar] [CrossRef]
- Haynes, R.J.; Swift, R.S. The effects of pH and of form and rate of applied iron on micronutrient availability and nutrient uptake by highbush blueberry plants grown in peat or soil. J. Hortic. Sci. 1986, 61, 287–294. [Google Scholar] [CrossRef]
- Austin, M.E.; Bondari, K. Response of ‘Tifblue’ and ‘Delite’ rabbiteye blueberry plants to varying soil pH. J. Small Fruit Viticul. 1995, 3, 25–37. [Google Scholar] [CrossRef]
- Kovaleski, A.P.; Williamson, J.G.; Olmstead, J.W.; Darnell, R.L. Inflorescence bud initiation, development, and bloom in two southern highbush blueberry cultivars. J. Am. Soc. Hortic. Sci. 2015, 140, 38–44. [Google Scholar] [CrossRef]
- Spann, T.M.; Williamson, J.G.; Darnell, R.L. Photoperiod and temperature effects on growth and carbohydrate storage in southern highbush blueberry interspecific hybrid. J. Am. Soc. Hortic. Sci. 2004, 129, 294–298. [Google Scholar] [CrossRef]
- Zang, Y.; Chun, I.; Zhang, L.; Hong, S.; Zheng, W.; Xu, K. Effect of gibberellic acid application on plant growth attributes, return bloom, and fruit quality of rabbiteye blueberry. Sci. Hortic. 2016, 200, 13–18. [Google Scholar] [CrossRef]
- Togano, Y.; Fujimoto, J.; Azukizawa, H. Effect of different soils on young tree growth and fruit quality of blueberry cultivars. Jpn. Soc. Agric. Technol. Manag. 2004, 11, 69–73. [Google Scholar]
- Cummings, G.A.; Mainland, C.M.; Lilly, J.P. Influence of soil pH, sulfur, and sawdust on rabbiteye blueberry survival, growth, and yield. J. Am. Soc. Hortic. Sci. 1981, 106, 783–785. [Google Scholar]
- Gündüz, K.; Serçe, S.; Hancock, J.F. Variation among highbush and rabbiteye cultivars of blueberry for fruit quality and phytochemical characteristics. J. Food Compos. Anal. 2015, 38, 69–79. [Google Scholar] [CrossRef]
- Calvo-Polanco, M.; Zhang, W.; Macdonald, S.E.; Señorans, J.; Zwiazek, J.J. Boreal forest plant species responses to pH: Ecological interpretation and application to reclamation. Plant Soil 2017, 420, 195–208. [Google Scholar] [CrossRef]
- Bailey, J.S. A chlorosis of cultivated blueberries. Proc. Am. Soc. Hortic. Sci. 1936, 34, 395–396. [Google Scholar]
- Finn, C.E.; Rosen, C.J.; Luby, J.J.; Ascher, P.D. Blueberry germplasm screening at several soil pH regimes. II. Plant nutrient composition. J. Am. Soc. Hortic. Sci. 1993, 118, 383–387. [Google Scholar] [CrossRef]
- Cain, J.C. Blueberry leaf chlorosis in relation to leaf pH and mineral composition. Proc. Am. Soc. Hortic. Sci. 1954, 64, 61–70. [Google Scholar]
- Fujumoto, J.; Togano, Y.; Ito, N. Cause and countermeasure of chlorosis in younger leaves on shoot in blueberry. Jpn. Soc. Agric. Technnol. Manag. 2004, 11, 27–31. [Google Scholar]
- Gupton, C.L.; Spiers, J.M. Inheritance of tolerance to mineral element-induced chlorosis in rabbiteye blueberry. HortScience 1992, 27, 148–151. [Google Scholar] [CrossRef]
- Petridis, A.; van der Kaay, J.; Chrysanthou, E.; McCallum, S.; Graham, J.; Hancock, R.D. Photosynthetic limitation as a factor influencing yield in highbush blueberries (Vaccinium corymbosum) grown in a northern European environment. J. Exp. Bot. 2018, 69, 3069–3080. [Google Scholar] [CrossRef] [PubMed]
- Xu, C.; Ma, Y.; Guo, F. Effect of soil pH on the growth, photosynthesis and mineral element content in own-rooted saplings and grafted saplings of blueberry. Asian Agric. Res. 2017, 9, 75–81. [Google Scholar]
- Kalaji, H.M.; Bąba, W.; Gediga, K.; Goltsev, V.; Samborska, I.A.; Cetner, M.D.; Dimitrova, S.; Piszcz, U.; Bielecki, K.; Karmowska, K.; et al. Chlorophyll fluorescence as a tool for nutrient status identification in rapeseed plants. Photosynth. Res. 2018, 136, 329–343. [Google Scholar] [CrossRef] [PubMed]
- Chen, W.; Cen, W.; Chen, L.; Di, L.; Li, Y.; Guo, W. Differential sensitivity of four highbush blueberry (Vaccinium corymbosum L.) cultivars to heat stress. Pak. J. Bot. 2012, 44, 853–860. [Google Scholar]
- Reyes-Diaz, M.; Alberdi, M.; de la Luz Mora, M. Short-term aluminum stress differentially affects the photochemical efficiency of photosystem II in highbush blueberry genotypes. J. Am. Soc. Hortic. Sci. 2009, 134, 14–21. [Google Scholar] [CrossRef]
- Inostroza-Blancheteau, C.; Acevedo, P.; Loyola, R.; Arce-Johnson, P.; Alberdi, M.; Reyes-Diaz, M. Short-term UV-B radiation affects photosynthetic performance and antioxidant gene expression in highbush blueberry leaves. Plant Physiol. Biochem. 2016, 107, 301–309. [Google Scholar] [CrossRef]
- Xu, W.; Jia, L.; Baluška, F.; Ding, G.; Shi, W.; Ye, N.; Zhang, J. PIN2 is required for the adaptation of Arabidopsis roots to alkaline stress by modulating proton secretion. J. Exp. Bot. 2012, 63, 6105–6114. [Google Scholar] [CrossRef]
- Brown, J.C.; Draper, A.D. Differential response of blueberry (Vaccinium) progenies to pH and subsequent use of iron. J. Am. Soc. Hortic. Sci. 1980, 105, 20–24. [Google Scholar]

© 2019 by the authors. Licensee MDPI, Basel, Switzerland. This article is an open access article distributed under the terms and conditions of the Creative Commons Attribution (CC BY) license (http://creativecommons.org/licenses/by/4.0/).