Abstract
Assessing and prescribing fertilizer use is critical to profitable and sustainable coffee production, and this is becoming a priority concern for the Robusta coffee industry. In this study, annual survey data of 798 farms across selected Robusta coffee-producing provinces in Vietnam and Indonesia between 2008 and 2017 were used to comparatively assess the fertilizer management strategies in these countries. Specifically, we aimed to characterize fertilizer use patterns in the key coffee-growing provinces and discuss the potential for improving nutrient management practices. Four types of chemical (NPK, super phosphate, potassium chloride and urea) and two of natural (compost and lime) fertilizers were routinely used in Vietnam. In Indonesia, NPK and urea were supplemented only with compost. Farmers in Vietnam applied unbalanced quantities of chemical fertilizers (i.e., higher rates than recommended) and at a constant rate between years whereas Indonesian farmers applied well below the recommended rates because of poor accessibility and financial support. The overuse of chemical fertilizers in Vietnam threatens the sustainability of Robusta coffee farming. Nevertheless, there is a potential for improvement in both countries in terms of nutrient management and sustainability of Robusta coffee production by adopting the best local fertilizer management practices.
1. Introduction
Coffee is one of the top-traded agricultural commodities worldwide [1,2]. It is cultivated in over 50 countries and covers more than 11 million ha around the world [3]. Coffee plays a crucial role in the economies of producing countries (e.g., the gross domestic product largely depends on coffee export revenues with the sector employing an important proportion of the rural population [3,4]. The two economically important coffee species—Arabica (Coffea arabica L.) and Robusta (C. canephora Pierre ex A. Froehner)—account for about 99% of world coffee production [3,5,6] with Arabica representing roughly 60%.
Producing healthy coffee plants throughout the growth cycle, particularly during sensitive phenological stages (flowering, cherry development, and bean filling) requires sufficient levels of mineral nutrients such as nitrogen (N), phosphorus (P) and potassium (K) in the soil to avoid any nutrient stress [7,8]. This pre-supposes suitable environmental conditions (air temperature, water availability, intensity of sunshine, soil type, wind and land topography) and other management practices (such as pest and disease control and pruning) [5,9]. In perennial crops like coffee, fertilizers are applied to replace the nutrients removed during the harvest and address the nutrient need during the following growth cycle. Coffee is harvested as cherry; this includes pulp and parchment which are often not returned to the field and so are lost to the system [10]. It has been estimated that the major nutrients removed in one ton of coffee green beans may be 33–63 kg N, 2–11 kg P2O5 and 47–67 kg K2O depending on soil type and fertilizer application [7,8,10,11,12]. In the Central Highlands of Vietnam, the nutrient removal from Robusta coffee farms has been estimated to average 33 kg N, 1 kg P2O5 and 30 kg K2O for each ton per hectare of green beans harvested (ignoring nutrient losses from leaching and erosion) [13].
In the coffee industry, sustainability has become a paramount concern over the past several years. Developing sustainable agricultural production systems involves dealing with various and interrelated aspects including water management, land capability and use, biodiversity, energy, soil quality, agricultural production and productivity, and socio-economic aspects [14,15]. Of particular interest for coffee is the implementation of environmentally-friendly and sustainable production practices [4]. The coffee industry’s growth in the major producing countries is expected to be fuelled over the next years given an increased activity at both consumer and trade levels from both domestic and foreign players. Given its economic importance and the environmental risks and vulnerabilities that its production could pose or face, the coffee industry requires special attention.
The main purpose of this study was to provide a detailed characterization of one of the most important management practices in coffee production—fertilizer application—for the top coffee-producing countries in South-East (SE) Asia, namely Vietnam and Indonesia. Assessing and prescribing fertilizer use is critical to ensure profitable and sustainable coffee production systems.
Vietnamese coffee production averaged 1.46 million metric tons during 2014–2017 for about 597,000 hectares harvested [16] while Indonesian production averaged 553,000 metric tons for about 1 million hectares harvested over the same period [17,18]. Coffee production in both countries is dominated by Robusta coffee—95% in Vietnam and about 85% in Indonesia [16,17,19]. The total production of both Vietnam and Indonesia represents about 60% of global Robusta coffee production [20,21], and the two countries rank respectively second and fourth worldwide [20].
In Vietnam, a combination of factors including local institutional reforms in the 1980s, state-sponsored migration, suitable land for production and infrastructure investment in irrigation, have accelerated the expansion of coffee farms and led to an increase in coffee production over the 1990s and 2000s. The total coffee area has risen from around 22,000 ha in 1980 to around 665,000 ha by 2017 [16,22]. Although the total Vietnamese coffee area has increased by only 33% over the last 14 years (2004–2017) [16], the trend is likely to be on expanding producing areas, but with the potential effect of imbalanced fertilizer application [13,19]. Similar future prospects could be noted for Indonesian coffee sector [23,24].
Using annual survey data of 798 farms across selected Robusta coffee-producing provinces in Vietnam and Indonesia during the 2008–2017 period (with a total of 7980 observations), the main objective of this study was to comparatively assess fertilizer management strategies in the two major SE coffee-producing countries. Specifically, the paper aimed to address the following questions: (1) what fertilizers (chemical and organic) were used in Robusta coffee farms in Vietnam and Indonesia over the last ten years? (2) were there different fertilizer management practices between provinces in each of the countries? (3) what are the potentials for improved sustainable fertilizer application in Robusta coffee farms in Vietnam and Indonesia? Few papers or published reports have dealt with such topic in both countries. As such, our findings will provide further insight into the fertilizer management in Robusta coffee farms in these countries and could help in adopting environmentally-friendly coffee management practices.
2. Materials and methods
2.1. Study Areas
2.1.1. Vietnam
The study areas in Vietnam were located in four provinces of the Central Highlands region—Dak Lak, Dak Nong, Gia Lai and Lam Dong (Figure 1A). These are the main provinces producing Vietnamese Robusta coffee, accounting for more than 90% of the national production [16]. Robusta coffee is typically grown as an unshaded and clean-weeded monocrop in Central Highlands [25].
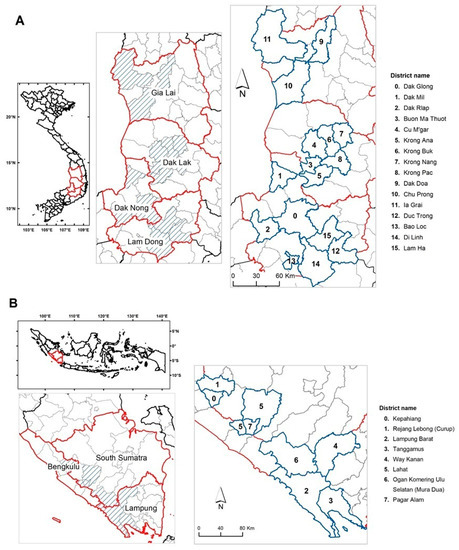
Figure 1.
Location of the study areas in Vietnam (A) and Indonesia (B). The boundaries of the study provinces (red line) and districts (blue line) are shown. Source: GADM database of Global administrative areas (https://gadm.org/).
The Central Highlands region is dominated by a humid tropical climate. Climate data over 30 years (1985–2014) showed that the total annual rainfall ranged from 1800 to 3000 mm across the four study provinces (Figure S1A). Maximum temperatures were normally above 24 °C, and the average monthly solar radiation ranged from 428 to 698 MJ m−2. Two main soils in the Central Highlands region are reddish-yellow acrisols and reddish-brown ferrosols, with coffee trees are cultivated mostly on the latter [13,26].
2.1.2. Indonesia
Robusta coffee is grown predominantly in Southern Sumatra provinces in Indonesia, namely in Lampung, South Sumatra and Bengkulu provinces (Figure 1B). These provinces account for about 60% of the national total coffee area and about 75% of the national Robusta production [17,24].
The total annual rainfall across the coffee-growing areas during 1985–2014 ranged from 3000 to 3249 mm (Figure S1B). Maximum and minimum temperatures are typically above 27 °C and 23 °C, respectively. The dominant soils in coffee-growing provinces in Indonesia are rhodic ferrosols and orthic acrisols [27].
2.2. Study Design: Annual Monitoring of Fertilization Management–Farmers Survey
Data were collected within the Sustainable Management Services (SMS) programme implemented by ECOM Agroindustrial Corporation since 2005 across coffee-producing countries in the Asia Pacific region including Vietnam and Indonesia. The main objective of the SMS programme is to promote more sustainable coffee production and to strengthen traceability and transparency throughout the coffee supply chain. Through the SMS programme, coffee farmers are regularly trained on various aspects of farm management practices (such as balanced fertilization and soil nutrition improvement, tree stock management, pest and disease control, irrigation, farm bookkeeping, farm diversification and farm certification).
Coffee farm activities are monitored throughout every crop season, with three to four farm surveys each year with farm data collected using designed questionnaires. Questionnaires were translated into the local languages and local agronomists who speak these languages conducted the interviews. Data were managed through the SMS database within ECOM. Farmers also keep their data using farm books, given such information is also valuable in certification programmes.
Within the SMS programme, more than 5000 coffee farmers are enrolled in Vietnam and more than 2000 in Indonesia (as of 2018). For this study, a representative random sampling was performed to compile the data from the SMS database over the 2008–2017 period. The selection was based on differences in climate, proportion of coffee areas, water resources and farm sizes. A total of 558 farmers were selected across 18 districts in the four provinces in Vietnam; and 240 farmers were selected across eight districts of the three main coffee-producing provinces in Indonesia (Table 1). Data of the 2008–2017 period were collected during the last quarterly farms survey in 2017 from 798 farms (7980 observations in total). All farm data were cross-checked with those of the SMS database to verify their consistency.

Table 1.
Sampling design: numbers of districts and participant farmers in Vietnam and Indonesia.
The data collected consisted of farm characteristics (i.e., altitude, farm area, age of trees, plant density, and yield) and the type and proportion of fertilizers applied. In Vietnam the differences in management practices related to the irrigation methods, which were either manual or sprinkler. The sampling was carried out in such a way that it represented both irrigation methods. In Indonesia Robusta coffee is grown under rainfed conditions (i.e., without irrigation). All the data were anonymised before any analysis was performed in this study.
2.3. Data Analyses
The rates of chemical fertilizers were expressed in total rate of each of the major nutrients nitrogen (N), phosphate (P2O5) and potassium (K2O) in order to have a common basis for comparisons. The recommended fertilizer rates for Robusta coffee in Vietnam and Indonesia were from the Western Highlands Agriculture and Forestry Science Institute (WASI) [26,28,29,30], and the Indonesia Coffee and Cocoa Research Institute [31], respectively. Although sulphur (S) and magnesium (Mg) are important nutrients for Robusta coffee, few farmers reported these nutrients during the surveys. These nutrients were therefore discarded in our analyses.
We assessed first the year-to-year variability of fertilizer application at the selected provinces over the 10-year period for each country. Then, the differences in fertilizer application within province and between provinces were compared using a one-way ANOVA (significance level = 0.05). The analyses were done according to the farm size. Two groups of farm size were defined for Vietnamese and Indonesian Robusta coffee farms: ‘small-scale’ and ‘large-scale’ farms corresponding to farms with area ≤1 ha, and area >1 ha, respectively. These thresholds were based on those adopted by [30,32] when classifying coffee smallholders.
Further, we assessed the potential for improved fertilization management strategies, i.e., reducing nutrient rates while maintaining the current levels of Robusta coffee yields. Based on the ranges of observed coffee yields and recommended nutrient rates, the surveys data were analysed under three scenarios of nutrient rates in all provinces.
All the data and statistical analyses were carried out using the R Language and Environment for Statistical Computing [33] and Microsoft® Office Excel (Redmond, WA, USA).
3. Results
3.1. Background Information from the Survey
3.1.1. Vietnam
Overall the area of coffee farms ranged from 0.1 to 11.2 ha, with 60% being of size >1 ha (Table 2). The planting density ranged from 1000 to 1100 plants ha−1. The farms surveyed were predominantly (67%) located between 500 and 900 m A.M.S.L. with only 18% of the farms below 500 m A.M.S.L. and 15% above 900 m A.M.S.L. (Table 2). The age of coffee farms varied between 3 and 29 years in 2008 (start year of the study period), with 89% of the farms being under 20 years old. Fertilizers were applied four times throughout the crop season. The first application occurred during the blossoming/setting (March–April); the second at the onset of the monsoon (generally in June); the third application occurred during the cherry development stage (August–September); and the last round of application taking place during the bean filling and bud wood development stage (October–November).
Table 2.
Characteristics of coffee farms surveyed during the 2008–2017 period in selected provinces in Vietnam and Indonesia. The total number of monitored farms per year was 558 in Vietnam and 240 in Indonesia.
Four types of chemical (urea, blended NPK, super phosphate, and potassium chloride) and two types of natural (compost and lime) fertilizers were recorded during the 10-year period across the four study provinces in Vietnam (Table 2). Most farmers applied all the four chemical fertilizers: 79% for blended NPK, 98% for super phosphate and potassium chloride, and 100% for urea. The common nutrient content N–P2O5–K2O for blended NPK fertilizer during the survey was 16–8–16 (Table 3).
Table 3.
Fertilizer types recorded in surveyed Robusta coffee farms in Vietnam and Indonesia and their nutrient contents. The recommended nutrient rates for two targeted yield levels in Vietnam [26,28,29,30] and mature trees (i.e., bearing fruits) in Indonesia [31] are provided.
3.1.2. Indonesia
Coffee farms in Indonesia were predominantly small-scale (55%; Table 2) but densely planted with 2000–2500 plants ha−1. In terms of elevation, 45% of the coffee farms were located between 500 and 900 A.M.S.L. with 28% below 500 m and 27% above 900 m. Regarding the age of coffee trees, 44% were young as ≤10 years in 2008, 37% aged between 10 and 20 years; the remaining 20% were older than 20 years (Table 2). Fertilizers were applied in two rounds throughout the crop season; the first application during initial cherry development stage (October–November) and the second during cherry development and bean filling stage (February–March).
The farmers surveyed across the study provinces in Indonesia during 2008–2017 used three chemical fertilizer types (urea, blended NPK and triple super phosphate), with the proportions of users being 80%, 68% and 5%, respectively. The common nutrient content N–P2O5–K2O for blended NPK fertilizer during the survey was 15–15–15 (Table 3). Compost was the only organic fertilizer type recorded in the farms surveyed, with 96% of farmers using it (Table 2).
3.2. Year-To-Year Variability of Fertilizer Use in Robusta Coffee Farms in Vietnam and Indonesia
The spatial distributions of the 10-year average of the chemical fertilizers as applied during 2008–2017 in Vietnam (urea, blended NPK, super phosphate, and potassium chloride) and Indonesia (urea, NPK and triple super phosphate) are provided in Figures S2 and S3. For comparison purposes the observed rates of chemical fertilizers were expressed in total rate of each of the major nutrients nitrogen (N), phosphate (P2O5) and potassium (K2O) using the values provided in Table 3.
3.2.1. N, P2O5 and K2O Uses in Vietnam During 2008–2017
In Vietnam, urea and blended NPK, which contributed to total N rates, were included in fertilizer management strategies of most of the surveyed farmers every year (Table 2), with their respective rates varying between 1000 to 1400 kg ha−1 and 400 to 800 kg ha−1 (Figure S2). The dominant nutrients provided through the chemical fertilizers during 2008–2017 in all provinces were N and K2O, regardless of the farm size (Figure 2). For example in Dak Nong, the amounts of K2O were among the highest compared to the three remaining provinces Dak Lak, Gia Lai and Lam Dong. For all nutrients and in all provinces, 2014 was the year with lower rates applied (Table 4 and Table S1).
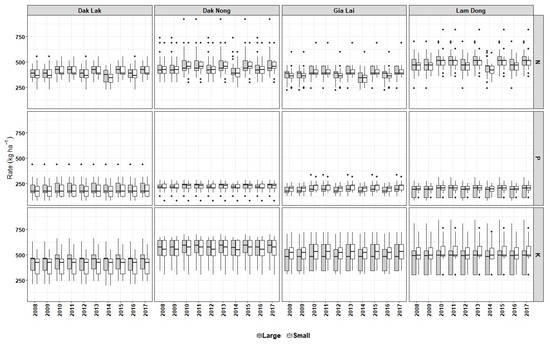
Figure 2.
Year-to-year variations of nutrient rates in large- and small-scale Robusta coffee farms for each of the study provinces in Vietnam during the 2008–2017 period. The rates of nitrogen (N), phosphate (P2O5, referred to as P) and potassium (K2O, referred to as K) were calculated based of the nutrient contents of each the chemical fertilizers recorded (see Table 2 and Table 3). In the boxplot, upper and lower borders of the box represent the 3rd and 1st quartiles, respectively. The line within the box represents the median value. Bars extend to the minimum and maximum values. Outliers are represented by black circles. Small-scale farms have area ≤1 ha; large-scale farms have area >1 ha.
Table 4.
Comparison of nitrogen rates (N kg ha−1) between years according to the farm size in Vietnamese Robusta coffee-producing provinces. Number with similar letter in a given row are not statistically different (p > 0.05). SF: small-scale farms; LF: large-scale farms.
Comparing the average rates of each nutrient N, P2O5 and K2O within a given province over the 10-year survey, our analyses revealed that there was no statistical difference between the rates of P2O5 and K2O applied every year, irrespective of the province and farm size (Table S1). With regard to the average rates of N, small-scale farmers in each of the provinces applied similar N rates (i.e., not statistically different, p > 0.05) in the majority of the study years, except in 2014 (Table 4), though there seemed an alternate use of low and high N rates from year to year after 2011. This alternate trend was also found in large-scale farms across all provinces. Large-scale farmers in Lam Dong were among those applying different (statistically significant, p < 0.05) N rates from year to year. In the remaining provinces Dak Lak, Dak Nong or Gia Lai, similarities between years with lower N rates or between years with higher N rates were found (Table 4).
3.2.2. N, P2O5 and K2O Uses in Indonesia During 2008–2017
In Indonesia, farmers across Lampung applied more urea and blended NPK than those in South Sumatra and Bengkulu (Figure S3). Very little triple super phosphate fertilizer was used, averaging from 50 to 100 kg ha−1 yr−1 over the 10-year period (Figure S3). Thus, the rates of N, P2O5 and K2O during 2008–2017 (Figure 3) were lower compared to those observed in Vietnam over the same period. P2O5 and K2O rates were on average <50 kg ha−1 yr−1, irrespective of the farm size (Figure 3).
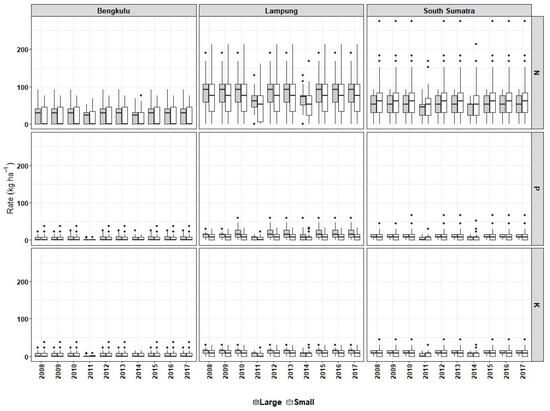
Figure 3.
Year-to-year variations of nutrient rates in large- and small-scale Robusta coffee farms for each of the study provinces in Indonesia during the 2008–2017 period. The rates of nitrogen (N), phosphate (P2O5, referred to as P) and potassium (K2O, referred to as K) were calculated based of the nutrient contents of each of the chemical fertilizers recorded (see Table 2 and Table 3). In the boxplot, upper and lower borders of the box represent the 3rd and 1st quartiles, respectively. The line within the box represents the median value. Bars extend to the minimum and maximum values. Outliers are represented by black circles. Small-scale farms have area ≤1 ha; large-scale farms have area >1 ha.
The comparisons of the average rates of each nutrient N, P2O5 and K2O within a given province over the 10-year survey showed that these rates were not statistically significant (p > 0.05) from year to year in Bengkulu and South Sumatra, regardless of the farm size (Table S2). In Lampung, such similarity was found for K2O rates in both small- and large-scale Robusta coffee farms, and for P2O5 in small-scale farms. For N rates, small-scale farmers applied relatively high and similar annual rates (on average 93 kg ha−1) in the majority of years, except in 2011 and 2014 where lower rates (on average 66–68 kg ha−1) were applied. In large-scale farms, lower and statistically different (p < 0.05) N rates were applied in only 2011 (Table S2).
3.3. Comparisons of Fertilizer Use in Robusta Coffee Farms Between Provinces
3.3.1. Vietnam
Generally, small-scale farm holders in Dak Lak and Gia Lai applied similar N rates during the study period (p > 0.05; Table 5). The average rates ranged from 369 to 403 kg ha−1, and were lower and statistically different from those applied in Dak Nong and Lam Dong. Across these latter provinces, homogenous patterns of N rates were observed (i.e., not statistically different, p > 0.05; Table 5), with average values ranging from 408 to 504 kg ha−1. Likewise, in large-scale farms in Dak Lak and Gia Lai, similar N management strategies were adopted. A difference was found in large-scale farms between Dak Nong and Lam Dong was observed, with those in the Lam Dong applying higher N rates (438–511 kg ha−1) (Table 5).
Table 5.
Comparison of fertilizer use between provinces in small- and large-scale farms in Vietnam during 2008–2017. For a given farm size group, numbers with similar letter in a given row are not statistically different (p > 0.05).
Regarding P2O5 and K2O, small-scale farmers in Dak Lak behaved differently from those in Dak Nong, Gia Lai and Lam Dong. Lesser rates of P2O5 and K2O were applied, with average values ranging from 177 to 195 kg ha−1, and 400 to 418 kg ha−1, respectively (Table 5). The respective rates of P2O5 and K2O in the other provinces ranged from 190 to 224 kg ha−1, and from 496 to 558 kg ha−1, on average. In large-scale farms, P2O5 and K2O management strategies were similar across Gia Lai and Lam Dong in all years, i.e., no statistically different rates applied (p > 0.05; Table 5). The common pattern between these provinces and Dak Lak was only found for P2O5 management. In Dak Nong, large-scale farmers behaved differently from their counterparts in the three other provinces, applying higher rates of P2O5 and K2O in all years.
3.3.2. Indonesia
Overall, there was no statistical difference (p > 0.05) in P2O5 and K2O uses on small-scale Robusta coffee farms between Bengkulu, South Sumatra and Lampung during 2008–2017 (Table 6). For N use, a clear statistical difference (p < 0.05) was found between Bengkulu (lower N rates applied) and Lampung (higher N rates applied) in small-scale farms. For large-scale farms, N use was found to be similar between Bengkulu and South Sumatra, but clearly different from that of Lampung. Regarding P2O5 and K2O, the difference in nutrient use between Lampung and South Sumatra was statistically significant (p < 0.05) in the majority of years, except 2011 (for P2O5) and 2011 and 2014 (for K2O) (Table 6).
Table 6.
Comparison of fertilizer use between provinces in small- and large-scale farms in Indonesia during 2008–2017. For a given farm size group, numbers with similar letter in a given row are not statistically different (p > 0.05).
3.4. Organic Fertilizers Use in Robusta Coffee Farms in Vietnam and Indonesia
In Vietnam, compost and lime were the natural fertilizers used in the surveyed farms. Compost was prepared from coffee husks, cuttings from orchards and fields and animal manure. These materials were composted using microbial solutions and were applied once decomposed. Given the lack of adequate materials, and its time-consuming preparation, farmers used to divide their farms in two and applied compost in alternate years. All Robusta coffee farmers surveyed in Dak Lak were applying compost in the same years (Table S3) at between 8 and 20 ton ha−1, higher rates than applied in the other provinces (Figure S4). In Dak Nong and Lam Dong, most of the farmers followed the same pattern while applying compost in alternate years. The lowest average compost rates were recorded at Lam Dong (~10 ton ha−1). Lime was applied at 1–2 ton ha−1 across the four provinces with the lowest rates observed in Lam Dong (Figure S4).
In Indonesia, compost was the only organic fertilizer used in Robusta coffee farms. It was made of animal manure and dried leaves and branch cuttings. Unlike in Vietnam, compost was applied every crop season and to all trees on the farm once all the materials were decomposed. The total rates varied between 0.5 and 2 ton ha−1 (Figure S4), with highest rates in Bengkulu, then in South Sumatra and Lampung.
3.5. Potential for Reducing Nutrient Rates in Robusta Coffee Farms
Since the nutrients applied in Robusta coffee farms in Indonesia during the study period were low and less than recommended (see Table 3 for recommended N, P2O5 and K2O rates), we limited this analysis to Vietnam. Different yield levels (<2.5 ton ha−1, between 2.5 and 3 ton ha−1, and >3 ton ha−1) were analysed under three different rates for each of the nutrients N, P2O5 and K2O. With the aim of investigating as to whether those nutrient rates can be reduced while maintaining current yield levels, the recommended rates of N, P2O5 and K2O for attaining 2.5–3 ton ha−1 (recommendation #1 in Table 3) were chosen to define the different categories of nutrient rates used in our analysis (Table 7 and Table 8).
Table 7.
Variations of Robusta coffee yields under different categories of N, P2O5 and K2O rates in small-scale farms for each of the study provinces in Vietnam. Pct. sample: sample distribution from all the 2008–2017 dataset (expressed in %); Avg. yield: average coffee yield (ton ha−1).
Table 8.
Variations of Robusta coffee yields under different categories of N, P2O5 and K2O rates in large-scale farms for each of the study provinces in Vietnam. Pct. sample: sample distribution from all the 2008–2017 dataset (expressed in %); Avg. yield: average coffee yield (ton ha−1).
Small-farmers in Dak Nong and Lam Dong applied predominantly >384 kg ha−1 of N, with corresponding yields up to 2.95 ton ha−1 (Table 7, blocks B and D). In Dak Lak and Gia Lai the majority applied between 192 and 384 kg ha−1, with corresponding yield up to 2.89 ton ha−1 (Table 7, blocks A and C). In those provinces, there were small-scale farmers who applied >384 kg ha−1 of N, while achieving similar yield levels than those applying up to 50% less, suggesting that a reduction of N rates in these farms is possible. In large-scale farms across all provinces, however, the majority of farmers applied >384 kg ha−1 N, with varying yield levels achieved depending on the province (Table 8). Although there were large-scale farmers applying between 192–384 kg ha−1, only a very limited number achieved yields >2.5 ton ha−1.
In P2O5 management, there are opportunities to reduce the current rates and maintain the current coffee yield levels for small-scale farmers in provinces like Gia Lai and Lam Dong. In three out of four provinces most small-holders farmers applied >176 kg ha−1: 85%, 74%, 77% of farmers in Dak Nong, Gia Lai and Lam Dong, respectively (Table 7, blocks B1, C1 and D1), with corresponding respective yields up to 2.87, 2.89 and 2.95 ton ha−1. In Gia Lai and Lam Dong, particularly, similar yield levels were reported for P2O5 rates varying between 88 and 176 kg ha−1, suggesting a potential for reducing P2O5 rates. In large-scale farms such potentials existed in Dak Lak and Gia Lai. In these provinces, although the majority of large-scale farmers applied between 88–176 kg ha−1, with corresponding yields up to 3.3 ton ha−1 (Table 8, blocks A and C), farmers who were applying >176 kg ha−1 and were achieving in some instance <2.5 ton ha−1, could have improved their management strategies and achieved better yield levels while reducing P2O5 rates.
Regarding K2O management, K2O was predominantly applied between 261 and 522 kg ha−1 in both small and large-scale Robusta coffee farms across Dak Lak, Gia Lai and Lam Dong (Table 7 and Table 8). In Dak Nong the dominant category was >522 kg ha−1 (62% and 63% for small- and large-scale farms, respectively) with corresponding coffee yields of up to 3.45 ton ha−1 on average (Table 7 and Table 8, blocks B1–2). For this latter province, some farmers 12% and 20% of the sample in small-and large-scale farms, respectively—reported similar yield levels (up to 3.29 ton ha−1) while applying 261 to 522 kg ha−1, suggesting the potential for reducing K2O rates. However, for the remaining three provinces, no conclusive indication can be drawn from our dataset regarding the potential of reducing K2O rates while achieving satisfactory yield levels.
4. Discussion
4.1. Were Coffee Farmers Following the Fertilizer Recommendations in Both Countries?
In Indonesia, the recommended nutrient rates for N, P2O5 and K2O were 135, 35 and 145 kg ha−1 yr−1, respectively [31]. Thus Indonesian farmers across the surveyed provinces were applying less nutrients than recommended, irrespective of the province and farm size group (Figure 3 and Table 6).
Various factors can explain this. Traditional farming practice does not depend on the use of external inputs such chemical fertilizers and pesticides. Indonesian coffee farmers apply fewer agri-chemical inputs than other major coffee producers such as Columbia, Brazil and indeed Vietnam. Also the price of fertilizers (which are imported) is regulated by the Indonesian government. For example, the price of blended NPK fertilizer has followed the same trend as green coffee prices over the last 10 years (Figure 4B), and farmers therefore may not be keen to increase the input of fertilizers. Also, the importance of coffee in Indonesia’s agricultural commodities exports has decreased over the last decade (5.1% in 2005 to 3.8% in 2015) whereas exports of commodities such as palm oil or tobacco have more than tripled [24]. Low use of fertilizers in Robusta coffee farms could be because farmers are increasingly turning towards Arabica coffee where possible, given its relatively higher price on the global market.
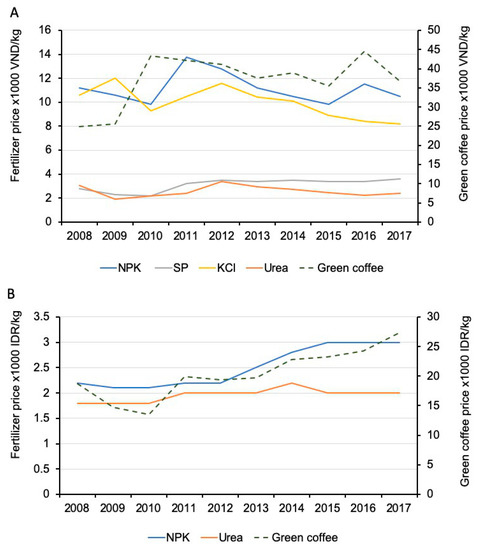
Figure 4.
Average prices of the top three fertilizers and green Robusta coffee in Vietnam (A) and Indonesia (B) during the 2008–2017 period. Coffee prices were sourced from the International Coffee Organization (http://www.ico.org/new_historical.asp). VND: Vietnam Dong. IRD: Indonesia Rupiah. NPK: blended NPK; SP: super phosphate; KCl: potassium chloride.
In Vietnam the recommended rates of N, P2O5 and K2O in Robusta coffee farms vary according to the targeted yield (Table 3). Unlike farmers in Indonesia, the rates of nutrients applied in Robusta coffee farms in Vietnam during the 10-year survey were generally higher than those recommended. Compared to countries such as Thailand, or Philippines [32], coffee farmers in Vietnam are applying noticeably higher rates of fertilizers. The general trend of overusing fertilizers found in this study was in line with the conclusions from previous studies [13,19,26,32,34], although in these studies only one or two provinces were involved.
One of the findings of this study by assessing all the major coffee-producing provinces in Vietnam indicates that farmers were generally following similar practices in terms of the rates of fertilizers applied across those provinces. The monitoring also revealed that Vietnamese Robusta coffee farmers tended to follow an “aggressive” approach while applying fertilizers—“the more fertilizers you can apply, the better your plants stay nutrient-stress free throughout the growth cycle and increase your capacity to maintain the same yield performance from year to year”. However, the relationships between the coffee yields and fertilizer rates showed no strong correlation between the yield and fertilizer rate (Figure S5). The high use of fertilizers in Vietnam could also be explained, in part, by the affordability of fertilizers to most coffee farmers through governmental subsidies [35,36,37]. In addition, the price of coffee beans has been satisfactory to farmers over the last decade (despite its volatility) (Figure 4A).
In Indonesia, the recommended rate for compost was 5 ton ha−1 year−1 [31], but, as with chemical fertilizers, the recommended rate of organic fertilizer was not reached on most Robusta coffee farms throughout the monitoring years. In Vietnam, the recommended rates of lime and compost were 1 ton ha−1 year−1 and 5–8 ton ha−1 year−1, respectively (depending on the targeted yield of 2.5–4.0 ton ha−1) [29]. The rates recorded were generally greater than those recommended, but given the alternate application might not be sufficient to meet the requirement each season. It was not clear whether the alternations of low and high applications of N, P2O5 and K2O observed, at least between 2012 and 2017, could be related to the alternate use of organic fertilizers during these particular years. It was out of the scope of this study to determine the N, P2O5 and K2O concentrations in compost in the surveyed farms. Further investigations across the study areas on the combined use of chemical and organic fertilizers, and on the farmers’ perceptions about such uses, would provide valuable guides in the best fertilizer management practices in Vietnam and Indonesia.
4.2. Challenges for a Sustainable Management of Fertilizers in Vietnam and Indonesia
Robusta coffee farmers in Vietnam were applying high rates of chemical fertilizers at constant rates from year to year whereas Indonesian farmers applied well below the recommended rates. More chemical fertilizers are being used in coffee production than in other crops in Vietnam [38,39]. Although intensive fertilizer use in Robusta coffee farms has led to increased yields during the previous decades [40,41], the dependence on chemical fertilizers may not be sustainable in the long term. Such intensive use of chemical fertilizer can reduce soil fertility through increased soil acidity, reduction of beneficial microorganisms, increased unstable aggregates leading to erosion and degradation [22,42]. Intensive use of fertilizer can also impact water quality, thereby leading to sustainability issues. Chemical fertilizers such blended NPK when applied intensively over long periods could also cause the depletion, or accumulation, of other plant nutrients in the soil [43]. This could lead to reduced yields and production [13,44,45].
Investigating the potential for reducing nutrient rates in coffee farms in Vietnam based on our dataset showed that there are opportunities for reducing the higher rates observed during the study period by up to 50% in some instances, depending on the nutrient and farm size, while achieving current yield levels (Table 7 and Table 8). However, for nutrients like K2O, no conclusive indication can be drawn from our dataset regarding the potential of reducing the current rates while achieving satisfactory yield levels. This is because there were few or no reports in the majority of the selected provinces of such patterns. An optimum management of fertilizers involving lower rates than those recorded during the survey could still maintain satisfactory yields. For example, Bruno et al. [46] reported that a routine nitrogen fertilizer rate of 600 kg ha−1 could be reduced by one-third without decreasing the production of coffee beans in commercial Arabica coffee farms in Brazil. Similar conclusions were drawn in Costa Rica [47]. Further research is therefore needed to investigate fertilizer use efficiencies in farm conditions, especially in Vietnam, and improve current fertilizer management practices for a sustainable production.
The optimal combined use of chemical and organic fertilizers to ensure satisfactory bean yields is of great interest for Robusta coffee farms in Vietnam and Indonesia. The use of organic fertilizers, such as compost, in coffee farms has been shown to improve soil texture, provide a better environment for beneficial microorganisms and to increase water-holding capacity and efficient nutrient use [7,38]. Our survey noticed a lack of understanding about nutrient requirements and the role of a balanced nutrient supply for coffee plants in the study provinces in Vietnam and Indonesia. In Vietnam, particularly, a large proportion of N–P2O5–K2O fertilizers are blended locally by state-owned enterprises, creating vested interests in the status quo [48]. Such challenges could be addressed by means such as:
(1) capacity-building and training to shift farmers’ practices and raise their awareness on the potential damages of fertilizer overuse to the environment;
(2) establishing demonstration farms to increase the confidence of farmers for adopting best management practices;
(3) introducing policies and incentives encouraging farm diversification (such as agroforestry) to help farmers not to rely solely on coffee for farm profit.
5. Conclusions
We documented the management of fertilizers (chemical and organic) in Robusta coffee farms across selected provinces in Vietnam and Indonesia during the 2008–2017 period. Four types of chemical (urea, blended NPK, super phosphate and potassium chloride) and two types of natural fertilizer (organic compost and lime) were used routinely in Vietnam. In Indonesia, only compost was used as organic fertilizer in addition to urea and blended NPK as chemical fertilizers. Because achieving high yields and maintaining such levels are among the key drivers of fertilizer application in Robusta coffee farms in Vietnam, chemical fertilizers were generally applied in unbalanced proportions, posing threats to the sustainability of such farming activities, the environment and, more broadly, to the economies of this country. In the studied provinces in Indonesia, Robusta coffee trees could not attain their potential since the lower fertilizer rates might have restricted the soil nutrient balance. Our findings showed that there is a potential for improvement in both countries in terms of fertilizer management and sustainability of Robusta coffee production. Adopting integrated fertility management practices, increasing the awareness of farmers regarding sustainable practices, and introducing policies to encourage farm diversification are among the options to improve the profitability of coffee farming while ensuring environmentally-friendly crop management practices in these two coffee-producing countries.
Supplementary Materials
The following are available online at https://www.mdpi.com/2073-4395/9/9/499/s1, Table S1: Average rates of phosphate (P2O5) and potassium (K2O) according to farm size in Vietnamese Robusta coffee-producing provinces, Table S2: Comparison of nitrogen (N), phosphate (P2O5) and potassium (K2O) rates according to farm size in Indonesian Robusta coffee-producing provinces, Table S3: Percentages of farmers applying organic fertilizers during 2008–2017 in the study provinces in Vietnam; Figure S1: Total annual rainfall at the study provinces in (A) Vietnam (Dak Lak, Gia Lai, Dak Nong, and Lam Dong) and (B) Indonesia (Lampung, South Sumatra and Bengkulu) during the period 2008–2017, Figure S2: 10-year average (2008–2017) of the fertilizer rates applied across the surveyed districts in Vietnam. (A) blended NPK; (B) super phosphate, SP; (C) potassium chloride, KCl; and (D) Urea. The averages are expressed in kg ha−1, Figure S3: 10-year average (2008–2017) of the fertilizer rates applied across the surveyed districts in Indonesia. (A) Urea; (B) blended NPK; and (C) triple super phosphate, TSP. The averages are expressed in kg ha−1, Figure S4: Year-to-year variations of natural fertilizers compost and lime in surveyed Robusta coffee farms in Vietnamese (Dak Lak, Dak Nong, Gia Lai and Lam Dong) and Indonesian (Bengkulu, Lampung and South Sumatra) coffee-producing provinces during 2008–2017 (Note differences on the y-axis.); Figure S5: Scatterplots of Robusta coffee bean yields versus annual total rates of nitrogen (N), phosphate (P2O5, referred to as P) and potassium chloride (K2O, referred to as K) in the study provinces in Vietnam (A–C) and Indonesia (D–F) during 2008–2017. All data of the 10-year period are presented according to the farm size group (small- and large-scale farms). Source: Survey data 2008–2017.
Author Contributions
Conceptualization, V.B. and L.K.; formal analysis, V.B.; writing—original draft preparation, V.B.; writing—review and editing; V.B., L.K., S.M. and R.S. All authors have read and approved the final manuscript.
Funding
The first author is supported by the University of Southern Queensland’s International Fees Research and Research Training Program Stipend Scholarships. We also acknowledge the funding received from the German Federal Ministry for the Environment, Nature Conservation, Building and Nuclear Safety (BMUB) and the World Meteorological Organisation (WMO) through the DeRISK project.
Acknowledgments
We gratefully acknowledge the valuable support of ECOM’s field surveys team in collecting and processing field data, as well as all the Robusta coffee farmers in Vietnam and Indonesia who participated in the interviews and generously provided information about their production systems. We thank the anonymous reviewers for their constructive comments.
Conflicts of Interest
The authors declare no conflict of interest.
References
- De Beenhouwer, M.; Muleta, D.; Peeters, B.; Van Geel, M.; Lievens, B.; Honnay, O. DNA pyrosequencing evidence for large diversity differences between natural and managed coffee mycorrhizal fungal communities. Agron. Sustain. Dev. 2015, 35, 241–249. [Google Scholar] [CrossRef]
- Capa, D.; Pérez-Esteban, J.; Masaguer, A. Unsustainability of recommended fertilization rates for coffee monoculture due to high N2O emissions. Agron. Sustain. Dev. 2015, 35, 1551–1559. [Google Scholar] [CrossRef]
- International Coffee Organization. Historical Data on the Global Coffee Trade. 2016. Available online: http://www.ico.org/new_historical.asp (accessed on 10 June 2019).
- Krishnan, S. Sustainable Coffee Production; Oxford University Press: Oxford, UK, 2017. [Google Scholar]
- DaMatta, F.M.; Ronchi, C.P.; Maestri, M.; Barros, R.S. Ecophysiology of coffee growth and production. Braz. J. Plant Physiol. 2007, 19, 485–510. [Google Scholar]
- Kamala Bai, S. Response of Young Coffees (Coffea Spp.) to Different Levels, Sources of Fertilizers and Microbial Inoculants on Growth and Development; University of Agricultural Sciences GKVK: Bangalore, India, 2011. [Google Scholar]
- Central Coffee Research Institute. Coffee Guide; Central Coffee Research Institute, Coffee Research Station: Chikmagalur District, Chikmagalur, India, 2014. [Google Scholar]
- Snoeck, J.; Lambot, C. Fertilization. In Coffee: Growing, Processing, Sustainable Production: A Guidebook for Growers, Processors, Traders, and Researchers; Wintgens, J.N., Ed.; WILEY-VCH Verlag GmbH & Co. KGaA: Weinheim, Germany, 2008; pp. 246–269. [Google Scholar]
- Descroix, F.; Snoeck, J. Environmental factors suitable for coffee cultivation. In Coffee: Growing, Processing, Sustainable Production: A Guidebook for Growers, Processors, Traders, and Researchers; Wintgens, J.N., Ed.; WILEY-VCH Verlag GmbH & Co. KGaA: Weinheim, Germany, 2008; pp. 164–177. [Google Scholar]
- Willson, C. Mineral nutrition and fertiliser needs. In Coffee: Botany, Biochemistry and Production of Beans and Beverage; Clifford, M.N., Willson, K.C., Eds.; Springer US: Boston, MA, USA, 1985; pp. 135–156. [Google Scholar]
- Jessy, M.D. Potassium management in plantation crops with special reference to tea, coffee and rubber. Karnataka J. Agric. Sci. 2011, 24, 67–74. [Google Scholar]
- Descroix, F.; Wintgens, J.N. Establishing a coffee plantation. In Coffee: Growing, Processing, Sustainable Production: A Guidebook for Growers, Processors, Traders, and Researchers; Wintgens, J.N., Ed.; WILEY-VCH Verlag GmbH & Co. KGaA: Weinheim, Germany, 2008; pp. 178–245. [Google Scholar]
- Tiemann, T.; Aye, T.M.; Dung, N.D.; Tien, T.M.; Fisher, M.; de Paulo, E.N.; Oberthür, T. Crop nutrition for Vietnamese Robusta coffee. Better Crop. Plant Food 2018, 102, 20–23. [Google Scholar] [CrossRef]
- Kouadio, L.; Newlands, N. Building capacity for assessing spatial-based sustainability metrics in agriculture. Decis. Anal. 2015, 2, 2. [Google Scholar] [CrossRef]
- Pretty, J. Agricultural sustainability: Concepts, principles and evidence. Philos. Trans. R. Soc. B Biol. Sci. 2008, 363, 447–465. [Google Scholar] [CrossRef] [PubMed]
- GSOV. Statistical Yearbook of Vietnam 2017; Statistical Documentation and Service Centre, General Statistics Office of Vietnam (GSOV): Hanoi, Vietnam, 2017. Available online: https://www.gso.gov.vn/default_en.aspx?tabid=515&idmid=5&ItemID=18941 (accessed on 10 June 2019).
- USDA. Indonesia: Coffee Annual. Indonesia Coffee Annual Report 2017. United States Department of Agriculture (USDA) Foreign Agricultural Service, Gobal Agricultural Information Network Report Number: ID1710, Date: 15 May 2017. Available online: https://gain.fas.usda.gov/Recent%20GAIN%20Publications/Coffee%20Annual_Jakarta_Indonesia_5-15-2017.pdf (accessed on 11 March 2019).
- USDA. Indonesia: Coffee Annual. Indonesia Coffee Annual Report 2016. United States Department of Agriculture (USDA) Foreign Agricultural Service, Gobal Agricultural Information Network Report Number: ID1616, Date: 12 May 2016. Available online: https://gain.fas.usda.gov/Recent%20GAIN%20Publications/Coffee%20Annual_Jakarta_Indonesia_5-12-2016.pdf (accessed on 24 July 2019).
- D’haeze, D.; Deckers, J.; Raes, D.; Phong, T.A.; Loi, H.V. Environmental and socio-economic impacts of institutional reforms on the agricultural sector of Vietnam: Land suitability assessment for Robusta coffee in the Dak Gan region. Agric. Ecosyst. Environ. 2005, 105, 59–76. [Google Scholar] [CrossRef]
- Food and Agriculture Organization of the United Nations. FAOSTAT, Crops National Production; FAO: Rome, Italy, 2016. [Google Scholar]
- Amarasinghe, U.A.; Hoanh, C.T.; D’haeze, D.; Hung, T.Q. Toward sustainable coffee production in Vietnam: More coffee with less water. Agric. Syst. 2015, 136, 96–105. [Google Scholar] [CrossRef]
- Dung, P.T.; H’dok, Y.K.N.; Tul, E. Microbial organic fertilizer application for safe coffee production at Daklak, Vietnam. J. Int. Soc. Southeast Asian Agric. Sci. 2009, 15, 22–31. [Google Scholar]
- Indonesia Investments. Coffee. 2017. Available online: https://www.indonesia-investments.com/business/commodities/coffee/item186? (accessed on 10 June 2019).
- The Conference Board of Canada. An Analysis of the Global Value Chain for Indonesian Coffee Exports. The Canada-Indonesia Trade and Private Sector Assistance Project (TPSA). Report January 2018. 37 pages. Available online: http://www.tpsaproject.com/wp-content/uploads/2018-01-30-Report-1211.03c.pdf (accessed on 12 June 2019).
- D’haeze, D.; Baker, P.; Van Tan, P. Vietnam’s central highlands’ upland agriculture under pressure because of the looming effects of climate change—Focus on Robusta coffee. In Proceedings of the Conference: Buon Ma Thout coffee festival, Buon Ma Thout, Vietnam, 9–16 March 2017. [Google Scholar]
- Tien, T.M. Effects of annual potassium dosage on the yield and quality of Coffea robusta in Vietnam. Res. Find. E-ifc 2015, 41, 13–20. [Google Scholar]
- FAO. Fertilizer Use by Crop in Indonesia. Land and Plant Nutrition Management Service–Land and Water Development Division; Food and Agriculture Organization of the United Nations: Rome, Italy, 2005; Available online: http://www.fao.org/tempref/agl/agll/docs/fertuseindonesia.pdf (accessed on 20 July 2019).
- MARD. Manual for Good Agricultural Practices for Robusta Coffee Gproduction; Ministry of Agriculture and Rural Development (MARD), National Agricultural Extension Center of the Socialist Republic of Vietnam: Hanoi, Vietnam, 2003.
- WASI. Western Highlands Agriculture and Forestry Science Institute (WASI), Scientific and Technical Activities; WASI: Buon Ma Thout, Vietnam, 2015; Available online: http://wasi.org.vn/en/.
- World Bank. The Socialist Republic of Vietnam—Coffee Sector Report; Report No. 29358-VN, June 2004; The International Bank for Reconstruction and Development Agriculture & Rural Development Department, World Bank: Washington, DC, USA, 2004; Available online: https://openknowledge.worldbank.org/bitstream/handle/10986/14405/293580VN0Coffe1ver0P08262901Public1.pdf?sequence=1 (accessed on 11 March 2019).
- Indonesian Coffee and Cocoa Research Institute (ICCRI). Training Coffee Cultivation. 2016. Available online: http://tc.iccri.net/2016/04/22/pelatihan-teknik-budidaya-dan-pengolahan-kopi/ (accessed on 11 March 2019).
- Marsh, A. Diversification by Smallholder Farmers: Viet Nam Robusta Coffee; Agricultural Management, Marketing and Finance Working Document 19; FAO: Rome, Italy, 2007; p. 9. [Google Scholar]
- R Core Team. R: A Language and Environment for Statistical Computing; R Foundation for Statistical Computing: Vienna, Austria, 2018; Available online: https://www.R-project.org/.
- D’haeze, D. Characterization, Evaluation and Diagnosis of Small-holder Coffee Based Farming Systems under Irrigation in Dac Lac Province, Vietnam. Ph.D. Thesis, KU Leuven University, Leuven, Belgium, 1999. [Google Scholar]
- Minot, N. Competitiveness of Food Processing in Vietnam: A Study of the Rice, Coffee, Seafood, and Fruits and Vegetables Subsectors Ministry of Planning and Investment Vietnam and United Nations Industrial Development Organization Vietnam. 1998. Available online: http://agro.gov.vn/images/2007/04/food.pdf (accessed on 10 June 2019).
- The Voice of Vietnam. Vietnam Ascending to World’s Largest Coffee Exporter. The Voice of Vietnam. 2014. Available online: http://english.vov.vn/Economy/Trade/Vietnam-ascending-to-worlds-largest-coffee-exporter/279633.vov (accessed on 12 June 2019).
- Thang, T.C.; Phuc, V.H. Vietnam’s Coffee Policy Review. Food and Fertilizer Technology Center for the Asian Pacific Region (FFTC) Agricultural Ploicy Platform. 2016. Available online: http://ap.fftc.agnet.org/ap_db.php?id=657 (accessed on 10 June 2019).
- Dzung, N.A.; Khanh, V.T.P.; Dzung, T.T. Research on impact of chitosan oligomers on biophysical characteristics, growth, development and drought resistance of coffee. Carbohydr. Polym. 2011, 84, 751–755. [Google Scholar] [CrossRef]
- Kuit, M.; van Rijn, F.; Tu, V.T.M.; Van Anh, P. The Sustainable Coffee Conundrum: A Study into the Effects, Cost and Benefits of Implementation Modalities of Sustainable Coffee Production in Vietnam; 9082134608; KUIT Consultancy/Wageningen UR: Wageningen, The Netherland, 2013. [Google Scholar]
- Scherr, S.; Mankad, K.; Jaffee, S.; Negra, C. Steps toward Green: Policy Responses to the Environmental Footprint of Commodity Agriculture in East and Southeast Asia; EcoAgriculture Partners and World Bank: Washington, DC, USA, 2015. [Google Scholar]
- Minh, H.T.; Trang, D.T.N.; Chen, J.C. Input factors to sustainable development of coffee production in the Dak Lak province. Open Access Libr. J. 2016, 3, e3187. [Google Scholar] [CrossRef]
- Kouadio, L.; Deo, R.C.; Byrareddy, V.; Adamowski, J.F.; Mushtaq, S.; Nguyen, V.P. Artificial intelligence approach for the prediction of Robusta coffee yield using soil fertility properties. Comput. Electron. Agric. 2018, 155, 324–338. [Google Scholar] [CrossRef]
- Kebede, T.; Mikru, Z. The Nutrient Status of Long Term Fertilized Soils of Coffee Plantation in Southwestern Ethiopia; Jimma Agricultural Research Center: Jimma, Ethiopia, 2005. [Google Scholar]
- Nyalemegbe, K.K.; Oteng, J.W.; Asuming-Brempong, S. Integrated organic-inorganic fertilizer management for rice production on the Vertisols of the Accra Plains of Ghana. West Afr. J. Appl. Ecol. 2010, 16, 23–33. [Google Scholar] [CrossRef][Green Version]
- Nguyen, G.N.T.; Sarker, T. Sustainable coffee supply chain management: A case study in Buon Me Thuot City, Daklak, Vietnam. Int. J. Corp. Soc. Responsib. 2018, 3, 1. [Google Scholar] [CrossRef]
- Bruno, I.P.; Unkovich, M.J.; Bortolotto, R.P.; Bacchi, O.O.S.; Dourado-Neto, D.; Reichardt, K. Fertilizer nitrogen in fertigated coffee crop: Absorption changes in plant compartments over time. Field Crop. Res. 2011, 124, 369–377. [Google Scholar] [CrossRef]
- Hergoualc’h, K.; Skiba, U.; Harmand, J.-M.; Hénault, C. Fluxes of greenhouse gases from Andosols under coffee in monoculture or shaded by Inga densiflora in Costa Rica. Biogeochemistry 2008, 89, 329. [Google Scholar] [CrossRef]
- IDH. Vietnam—A Business Case for Sustainable Coffee Production. An industry Study by TechnoServe for the Sustainable Coffee Program. The Sustainable Trade Initiative (IDH). 2013. Available online: http://exchange.growasia.org/vietnam-business-case-sustainable-coffee-production (accessed on 12 June 2019).


© 2019 by the authors. Licensee MDPI, Basel, Switzerland. This article is an open access article distributed under the terms and conditions of the Creative Commons Attribution (CC BY) license (http://creativecommons.org/licenses/by/4.0/).