Article

Identification, Structural, and Expression Analyses of SPX Genes in Giant Duckweed (Spirodela polyrhiza) Reveals Its Role in Response to Low Phosphorus and Nitrogen Stresses

1
The State Key Laboratory of Freshwater Ecology and Biotechnology, The Key Laboratory of Aquatic Biodiversity and Conservation of Chinese Academy of Sciences, Institute of Hydrobiology, Chinese Academy of Sciences, Wuhan 430072, China
2
University of Chinese Academy of Sciences, Beijing 100049, China
3
Henan Key Laboratory of Ecological Security for Water Source Region of Mid-line of South-to-North Diversion Project of Henan Province, Nanyang 473061, China
4
Collaborative Innovation Center of Water Security for Water Source Region of Mid-line of South-to-North Diversion Project of Henan Province, Nanyang Normal University, Nanyang 473061, China
*
Author to whom correspondence should be addressed.
Cells 2022, 11(7), 1167; https://doi.org/10.3390/cells11071167
Submission received: 17 January 2022 / Revised: 22 March 2022 / Accepted: 24 March 2022 / Published: 30 March 2022

Abstract

:
SPX genes play important roles in the coordinated utilization of nitrogen (N) and phosphorus (P) in plants. However, a genome-wide analysis of the SPX family is still lacking. In this study, the gene structure and phylogenetic relationship of 160 SPX genes were systematically analyzed at the genome-wide level. Results revealed that SPX genes were highly conserved in plants. All SPX genes contained the conserved SPX domain containing motifs 2, 3, 4, and 8. The 160 SPX genes were divided into five clades and the SPX genes within the same clade shared a similar motif composition. P1BS cis–elements showed a high frequency in the promoter region of SPXs, indicating that SPX genes could interact with the P signal center regulatory gene Phosphate Starvation Response1 (PHR1) in response to low P stress. Other cis–elements were also involved in plant development and biotic/abiotic stress, suggesting the functional diversity of SPXs. Further studies were conducted on the interaction network of three SpSPXs, revealing that these genes could interact with important components of the P signaling network. The expression profiles showed that SpSPXs responded sensitively to N and P deficiency stresses, thus playing a key regulatory function in P and N metabolism. Furthermore, the expression of SpSPXs under P and N deficiency stresses could be affected by environmental factors such as ABA treatment, osmotic, and LT stresses. Our study suggested that SpSPXs could be good candidates for enhancing the uptake ability of Spirodela polyrhiza for P nutrients in wastewater. These findings could broaden the understanding of the evolution and biological function of the SPX family and offer a foundation to further investigate this family in plants.

1. Introduction

Phosphorus (P) is one of the most important nutrients for plant growth and development. It is a component of biofilms, nucleic acids, and ATP, and it participates in many physiological and biochemical processes, such as energy metabolism, signal transduction and photosynthesis [1]. Plants prefer to absorb inorganic phosphate (Pi) to meet their needs for growth [2]. However, the level of Pi accessible to plants is generally low because of their low solubility and mobility in soil [2]. Therefore, low P stress is one of the most important limiting factors for crop yields in addition to nitrogen (N). The application of P fertilizer continues to increase in modern agriculture to achieve high agricultural productivity and meet the demand of the global population for food, leading not only to the eutrophication of water bodies but also the waste and depletion of P [3]. Thus, revealing the mechanism of plant adaptation to a low P environment is of great importance to improve the absorption and utilization of P in plants.
Plants have evolved many adaptive responses to low P stress, such as “Pi starvation responses” (PSRs), to increase the absorption and utilization of P, including the remodeling of root system architecture, synthesis, and secretion of organic acids and phosphatase to promote the release of insoluble Pi in soil, Pi transport and remobilization, reduction in photosynthesis, and starch and anthocyanin biosynthesis in leaves [4]. An MYB transcription factor (TF) called Phosphate Starvation Response1 (PHR1) is the central regulator in the PSRs regulatory system in plants via the transcriptional regulation of P starvation-induced (PSI) genes involved in the above physiological and biochemical responses. PHR1 could directly bind to the cis-element P1BS (PHR binding sequence, GNATATNC) [5], which is located in the promoter regions of many PSI genes, including Pi transporters (PT), Phosphate transporter traffic facilitator 1 (PHF1), Phosphate 1 (PHO1), miRNA399, miRNA827, and IPS1 (INDUCED BY PHOSPHATE STARVATION1) [6]. Under low P stress, PHR1 promotes an increase in Pi uptake by directly inducing the transport of PT and PHF1 from the endoplasmic reticulum to the plasma membrane [7]. Furthermore, PHR1 indirectly inhibits Phosphate 2 (PHO2) (Target of miR399) and Nitrogen limitation adaptation (NLA) (Target of miR827), which mediate post-translational negative control of PT and PHO1 through the ubiquitin-mediated protein degradation pathway, thus increasing the Pi content of the aboveground parts of plants [8,9]. IPS1 competitively binds to miR399 to inhibit the degradation of PHO2 [8].
Although PHR1 could initiate the expression of a series of PSI genes under low P conditions, the expression of PHR1 is barely modulated by external Pi status [10]. Recent studies have reported that SPX proteins harboring only the well-conserved N-terminal hydrophilic SPX domain (Pfam PF03105) are negative regulators that substantially suppress PHR1 activity or translocation. However, as Pi itself does not bind to the SPX domain, the inositol pyrophosphate InsP8 is the intracellular Pi signaling molecule serving as the ligand of SPX1 for controlling Pi homeostasis in plants, with levels positively correlated with cellular Pi concentration [11].The SPX domain was named after the SYG1 (suppressor of yeast gpa1), the PHO81 (yeast cyclin-dependent kinase inhibitor), and the XPR1 (human xenotropic and polytropic retrovirus receptor 1), which was first identified in the yeast Saccharomyces cerevisiae [12]. In plants, the SPX domain-containing proteins are classified into four subfamilies depending on the nature of the C-terminal extra domains, including SPX, SPX–EXS (named after the yeast ERD1, human XPR1 and Yeast SYG1 proteins), SPX–Major Facility Superfamily (SPX–MFS), and SPX–Really Interesting New Gene (SPX–RING) subfamilies [12]. Many SPX domain–containing proteins, such as PHT5 (SPX–MFS) [13], PHO1 (SPX–EXS) [14], and AtNLA (SPX–RING) [9] have been proven to be widely involved in Pi signaling and Pi balance.
In Arabidopsis (Arabidopsis thaliana) and rice (Oryza sativa), four (AtSPX14) and six members (OsSPX16) of SPX genes have been identified, respectively. Except for SPX4, the expression of AtSPX13, OsSPX13, and OsSPX56 is induced by low P stress with distinct dynamic patterns. AtSPX1/2 are located in the nucleus, and they bind to AtPHR1, forming a stable protein complex when the P content is sufficient, thus preventing the binding of AtPHR1 to P1BS elements of PSI genes [15,16]. Under low P conditions, the expression of AtSPX1/2 in Arabidopsis leaves and roots is strongly and continuously induced. AtPHR1 is released by AtSPX1/2 and then binds to PSI genes, thus inducing low P responses [15,16]. OsSPX1/2 regulate OsPHR2 through a similar pathway as AtSPX1/2 in response to low P stress [17,18]. OsSPX3/5 are expressed in leaves and roots induced by low P, and they negatively regulate the transport of P from underground to aboveground parts [19]. OsSPX4/6 are located in the nucleus and cytoplasm. OsSPX4/6 interact with OsPHR2 in the cytoplasm and partially inhibit the transfer of OsPHR2 into the nucleus, thereby inhibiting P signaling. When P is sufficient, OsSPX4 maintains a high abundance and mainly inhibits OsPHR2. Under low P stress, the expression of OsSPX6 is significantly enhanced at the transcriptional level; however, at the protein level, OsSPX4/6 are degraded by the ubiquitination–26S proteasome pathway; thus, OsPHR2 is released and activates low Pi responses [18,20]. Recent studies have found that OsSPX4 participates in the regulation pathway of N and P signals centered at OsNLP3 (NIN–like protein) and OsPHR2 to promote the synergistic absorption and utilization of N and P in rice [21].
Duckweeds are aquatic monocotyledonous plants belonging to the family Lemnaceae, which contains five genera (Spirodela, Landoltia, Lemna, Wolffiella, and Wolffia) and 36 species in total, and they are widely distributed in various fresh habits around the world [22]. Interest in duckweeds has steadily increased over the past decade, driven by the growing need for duckweeds as an alternative for traditional agricultural crops that can help tackle urgent societal challenges, such as climate change and rapid population expansion [23]. Duckweeds have traditionally been used as human food source, animal feed, feedstocks for biofuel and biogas production, and the production of proteins products [23]. Among them, the giant duckweed (Spirodela polyrhiza) is the biggest species with the smallest genome size of approximately 158 Mbp [24]. At present, the genomic and transcriptome data of S. polyrhiza are abundant [24]. Moreover, a stable and efficient genetic transformation system has been established; therefore, S. polyrhiza plants are regarded as a model for duckweed plants [25]. S. polyrhiza plants could easily cultivate and propagate new buds rapidly, doubling the biomass by 1.34–4.54 days [26]. S. polyrhiza plants had a very high uptake ability for Pi nutrients in wastewater and could adapt to a Pi concentration range of 0.1–46.5 mg/L [27]. Their rapid growth quickly converts the absorbed nutrients into starch biomass [26]. Therefore, S. polyrhiza plants are the most studied and applied aquatic plants in wastewater treatment [28]. However, the Pi content in most eutrophic water is 0.05–0.09 mg/L, far lower than the demand of duckweed plants [27]. This fact limits the application of S. polyrhiza plants in the treatment of eutrophic water. Therefore, developing S. polyrhiza plants adapting to a wider range of P concentrations based on their own mechanism of adaptation to low P stress is of great significance.
The functions of SPX genes have been comprehensively analyzed in the model of Arabidopsis plants [15] and rice [29,30], and in some important crops, including soyabean (Glycine max) [31], rapeseed (Brassica napus) [32], and wheat (Triticum aestivum) [33], which revealed that SPX genes are key regulators in the P signal regulatory network [34]. SPX genes may be valuable targets for improving the absorption and utilization of P and enhancing tolerance to low P stress in plants. In the present paper, a genome-wide identification and characterization analysis of SPX members in yeast, algae, ferns, moss, and some important monocot and dicot plants was conducted. The chromosomal localization, gene duplication, molecular interaction networks, homology modeling, and expression profiles of SPX genes in giant duckweed (S. polyrhiza) were further analyzed to reveal its role in response to low P stress. This study provides a solid foundation for further functional characterization of SPX genes in a wide range of plant species, especially in duckweeds.

2. Materials and Methods

2.1. Identification of SPX Genes

Genome databases of A. thaliana, Amborella trichopoda, Brachypodium distachyon, B. napus, Carica papaya, Chlamydomonas reinhardtii, Citrus clementine, Eucalyptus grandis, G. max, Gossypium hirsutum, Ipomoea triloba, Nelumbo nucifera, O. sativa, Physcomitrella patens, Populus trichocarpa, Prunus persica, Ricinus communis, S. cerevisiae, Salvinia cucullata, Selaginella moellendorffii, Setaria italic, Solanum lycopersicum, S. polyrhiza, T. aestivum, Wolffia australiana, Zea mays, and Zostera marina were downloaded from NCBI database (https://www.ncbi.nlm.nih.gov/, accessed on 8 January 2021), Phytozome database (https://phytozome.jgi.doe.gov/pz/, accessed on 11 February 2021) and Ensembl plant database (https://plants.ensembl.org/index.html, accessed on 20 February 2021). The genome database of Azolla filiculoides was downloaded from Fernbase (https://www.fernbase.org/, accessed on 12 February 2021).
The Hidden Markov Model (HMM) profile of the SPX domain (PF03105) was downloaded from the Pfam database (http://pfam.xfam.org/, accessed on 15 March 2021). All the non-redundant SPX genes sequences of A. thaliana, O. sativa, and G. max were downloaded from the NCBI website and used as query sequences to search for SPX genes in the other 23 species by BLASTP with a threshold of 1e < −10. The SPX genes of B. napus and T. aestivum have been published elsewhere [32,33] The HMMER v 3.3.2 program (http://hmmer.org/, accessed on 20 March 2021) was also used to identify SPX genes [35]. Putative SPX genes were further confirmed by the SMART database (http://smart.embl-heidelberg.de/, accessed on 6 April 2021), NCBI Conserved Domain database (http://www.ncbi.nlm.nih.gov/Structure/cdd/wrpsb.cgi, accessed on 6 April 2021), and Pfam database.

2.2. Physiochemical Properties, Subcellular Localization and SSRs (Simple Sequence Repeats) Identification

The number of amino acids, molecular weight (MW), and isoelectric point (PI) of the SPX proteins were calculated using the online ExPASy-ProtParam (http://web.expasy.org/protparam/, accessed on 21 April 2021) [36]. The transmembrane helices (TMHs) of the SPX proteins were predicted using the online TMHMM Server v.2.0 (http://www.cbs.dtu.dk/services/TMHMM/, accessed on 28 April 2021) [37]. The subcellular localization of all SPX proteins was predicted by Cello v2.5 software (http://cello.life.nctu.edu.tw/, accessed on 28 April 2021) [38], PSORT (https://psort.hgc.jp/, accessed on 28 April 2021) [39], and BUSCA (http://busca.biocomp.unibo.it, accessed on 28 April 2021) [40]. The SSRs in 160 SPX genes were identified by MISA software (https://webblast.ipk-gatersleben.de/misa/, accessed on 5 March 2022) [41]. The minimum number of repetitions was set as five for mononucleotide SSR detection, three for dinucleotide SSRs, and two for trinucleotide to decanucleotide. The maximum length of sequence between two SSRs was set at 100, which was registered as compound SSR.

2.3. Phylogenetic Classification, Gene Structures, and Motif Analysis

All the identified 160 SPX genes were aligned by ClustalW [42]. A maximum likelihood phylogenetic tree was constructed by MEGA 7.0 with 1000 bootstrap replications [43] and then visualized by iTOl (https://itol.embl.de/, accessed on 26 February 2021) [44]. The Gene Structure Display Server 2.0 online program (GSDS 2.0, http://gsds.gao–lab.org/, accessed on 20 March 2021) was used to analyze the exon–intron structure information of all SPX genes [45]. The MEME online program was used to identify the conserved motifs in SPX proteins (https://meme-suite.org/meme/tools/meme, accessed on 28 March 2021) with the following parameters: any number of repetitions; maximum number of motifs, 10; and optimum motif length, 6–50 [46].

2.4. Cis-Acting Elements, Chromosomal Localization, Gene Duplication, and Synteny Analysis

The 2000 bp DNA sequence upstream (promoter sequence) of the start codon of all SPX genes was extracted by TBtools software (V1.9832.0.0) [47]. The cis-acting elements of the promoter sequence were analyzed by the New Place online program (https://www.dna.affrc.go.jp/PLACE/?action=newplace, accessed on 22 April 2021) and visualized using TBtools. Synteny and gene duplication were analyzed by MCScanX and MCScanX–transposed [48,49]. The chromosomal localization of SPX genes on S. polyrhiza was determined by TBtools on the basis of genome annotation gff3 file. The syntenic relationships among nine species, including A. thaliana, B. distachyon, G. max, O. sativa, P. trichocarpa, S. italic, S. lycopersicum, S. polyrhiza, and Z. mays, were identified by MCScanX and visualized by Tbtools [48,50].

2.5. Molecular Interaction Networks and Protein Structure Prediction for SpSPX Proteins

The STITCH v5.0 server (http://stitch.embl.de/, accessed on 3 May 2021) was used to construct an interaction network between SpSPX proteins and other proteins on the basis of the Arabidopsis genome [51]. The 3D structures of three SpSPX proteins were predicted by the trRosetta (transform-restrained Rosetta) server, a new web-based platform for fast and accurate protein structure prediction, powered by deep learning (https://robetta.bakerlab.org/, accessed on 15 March 2022) [52,53,54]. Deep learning is now becoming an indispensable component for improving the accuracy of protein structure prediction, rather than the homology modeling method on the basis of the resolved structure of homologous proteins [52,53,54].

2.6. Expression Profiles of SpSPX Genes under Low P/N Stress

2.6.1. Expression Analysis of SpSPX Genes by RNA-Seq Data

First, RNA-seq was used to explore the expression profiles of SpSPX genes under low P/N stress (Bio–Project PRJNA724886). S. polyrhiza 7498 plants were cultured in liquid half-strength (1/2) MS medium at pH 5.8 and under 25 ± 1 °C, an irradiance of 85 μmol photons PAR m−2 s−1, and a 16 h photoperiod [55]. Then, Spirodela plants were cultured with 1/2 MS medium [+P/+N, the control group (CK)], 1/2 MS medium with N deficiency (+P/−N, N deficiency group), 1/2 MS medium with P deficiency (−P/+N, P deficiency group), 1/2 MS medium without N and P (−P/−N, N–P deficiency group), and H2O (nutrient deficiency group) for 7 day. All the plants in different treatments were harvested at 7 day and immediately frozen in liquid N and then stored at −80 °C for RNA isolation. Experiments were performed in triplicate to allow statistical analyses of the results. The expression profile data of SpSPX genes in different tissues/organs (leaves, roots, and stipule; Bio–Project PRJNA557001) and under different concentrations of salt stress (Bio–Project PRJNA563960) were also obtained from the NCBI website. The data was statistically analyzed using SPSS 22.0 software. One-way analysis of variance (ANOVA) and the Duncan test were applied to determine the significance of differences among different groups at the p < 0.05 level. All the Sequence Read Archive accession numbers are displayed in Table S1.

2.6.2. Expression Analysis of SpSPX Genes by qRT–PCR (Quantitative Real-Time PCR)

qRT–PCR was used to further analyze the expression of SpSPX genes under low P/N stress. S. polyrhiza 7498 plants were first pre-cultured in liquid 1/2 MS medium at pH 5.8, under 25 ± 1 °C, an irradiance of 85 μmol photons PAR m−2 s−1, and a 16-h photoperiod (CK) [55]. Then, they were treated with 1/2 MS medium with P deficiency (−P) and N deficiency (−N) and supplemented with 1 μM KH2PO4 and NH4NO3 for 10 day. The treated plants were harvested at set time points (0 [CK], 1, 2, 3, 4, 5, 6, 7, and 10 day) and immediately frozen in liquid N and then stored at −80 °C for RNA isolation with three biological replicates.
To investigate whether the expression of SpSPX genes was regulated by abiotic stresses, we analyzed the expression of SpSPX genes in some abiotic stress conditions including abscisic acid (ABA) treatment (1 µM), osmotic stress (200 mM mannitol), and low temperature (LT, 10 °C) stress under low P/N conditions. The S. polyrhiza 7498 plants were cultured in liquid 1/2 MS medium (1/2 MS), 1/2 MS medium with P (-P) or N (-N) deficiency containing 1 µM ABA or 200 mM mannitol at pH 5.8, and under 25 ± 1 °C, an irradiance of 85 μmol photons PAR m−2 s−1, and a 16-h photoperiod. Similarly, for LT treatment, S. polyrhiza 7498 plants were cultured in liquid 1/2 MS medium (1/2 MS), 1/2 MS medium with P (-P) or N (-N) deficiency at pH 5.8, and under 10 ± 1 °C, an irradiance of 85 μmol photons PAR m−2 s−1, and a 16-h photoperiod. To investigate whether the expression of SpSPX genes was correlated with some transcription factors (TFs), we further analyzed the expression of SpWRKY75 and MYB-domain TF SpNIGT1.1 (NITRATE-INDUCIBLE GARP-TYPE TRANSCRIPTIONAL REPRESSOR 1.1) under LT and low P/N stress conditions. The WRKY75 was the first member of the WRKY TF family reported to be involved in regulating P starvation response [56]. The NIGT1.1 protein has been reported to modulate P starvation signalling via transcriptional regulation of SPX genes [57]. The treated plants were harvested at set time points (0 [CK], 1, 3, 5, and 7 day) and immediately frozen in liquid N and then stored at −80 °C for RNA isolation with three biological replicates.
The total RNA of S. polyrhiza 7498 plants was extracted using a commercial RNA extraction kit (CW2598S, CWBIO, Beijing, China). First-strand cDNA was synthesized using a PrimeScript™ RT Reagent Kit (TaKaRa, Dalian, China). TB Green® Premix Ex Taq™ (TaKaRa, Dalian, China) was used to perform qRT−PCR with the Bio–Rad CFX96 Touch Real time PCR System (Bio-Rad, Hercules, CA, USA). The qRT–PCR program was as follows: 10 min at 95 °C, 40 cycles of 95 °C for 15 s, 60 °C for 30 s, and 72 °C for 30 s; a melting process at 60–95 °C was carried out to generate the melting curve. The 18s gene was used as an internal control. Each reaction was analyzed in triplicate, and the 2−ΔΔCT method was used to analyze the data [58]. The qRT–PCR results were statistically analyzed according to methods mentioned in Chapter 2.6.1. The oligonucleotide primers of three SpSPXs, SpWRKY75, and SpNIGT1.1 are shown in Table S2.

3. Results

3.1. Identification and Phylogenetic Analysis of SPX Genes in 28 Species

First, HMMER and BLASTP were used for the identification of SPX genes from 28 species. Then, the genes were further confirmed by Pfam and CDD online websites. Ultimately, 160 SPX genes with only SPX domains were identified in the 28 species (Table 1). These SPX genes were named in accordance with the order of their gene locations in chromosomes or scaffolds. The SPX genes of A. thaliana, O. sativa, and G. max have been named in previous studies. Only one SPX gene was identified in yeast while algae S. cerevisiae had nine SPX genes. The ancient moss plant P. patens had seven SPX genes. However, no SPX gene was found in the moss Marchantia polymorpha. The fern plants A. filiculoides and S. cucullata had four SPX genes. The fern plant S. moellendorffii had six SPX genes. The number of SPX genes among the monocot species ranged from 2 to 15. Compared with monocot species, the dicot species had 3 to 12 SPX genes. The maximum number of 15 SPX genes was identified in the monocot species T. aestivum, followed by the dicot species G. hirsutum (12 in total), B. napus (11 in total), and G. max (nine in total). The amino acid length of 160 SPX genes ranged from 184 to 491; correspondingly, the molecular weight ranged from 3.4654 KDa to 54.712 KDa, the isoelectric point (PI) ranged from 4.68 to 10.28, and the number of exons between 1 and 16. However, none of the 160 SPX proteins had TMHs (Table S3). Most of the SPX proteins were located in the nucleus and cytoplasm, while some were located in the chloroplast, mitochondrion, and plasma membrane (Table S3). We identified a total of 7018 SSRs in 160 SPX genes (Table 2). In 10 types of SSR, mononucleotide, dinucleotide, and tetranucleotide SSRs are dominant with cumulative percentages of 35.95%, 23.25%, and 17.63%, respectively, whereas hept- to hexanucleotide SSRs are rare with 0.07–0.94%. Almost all the SPX genes contained mononucleotide to pentanucleotide SSRs, while only NnSPX2, NnSPX3, GhSPX6, OsSPX1, and SlSPX6 contained decanucleotide. The (A/T)n, (AG/CT)n (AG/CT)n, (AAG/CTT)n, and (AAAG/CTTT)n were the most frequent motifs in mononucleotide, dinucleotide, trinucleotide, and tetranucleotide SSRs. The number of compound SSRs ranged from 3 (TaSPX10) to 246 (NnSPX2) in 160 SPX genes. The detailed numbers of SSRs in 160 SPX genes were shown in Table S4.
The genes were classified by phylogenetic analyses on the basis of the maximum likelihood method to understand the evolutionary relationships of the SPX genes. The 160 SPX genes were divided into five clades (A–E), as shown in Figure 1. The member proportion of each clade was different. Clade E (46.25%) had the most genes, followed by clade D (38.125%), clade B (10%), and clade C (5%). The SlSPX4 of S. lycopersicum formed a single clade away from other clades. Almost all the genes in moss and yeast were clustered in clade B. The SPX genes of fern plants were distributed in four clades (B, C, D, E). The SPX genes of algae, which were closely related to ZmaySPXs, were only distributed in clades D and E. Furthermore, clades D and E contained the most dicot and monocot plant species. The ScuSPX4, AfSPX4, and some SPX genes of dicot species were clustered in the second small clade C.

3.2. Gene Structure and Conserved Motifs of SPX Genes

The GSDS online server was used to determine the gene structures of all SPX genes. As shown in Figure 2, most genes on the same branch of the phylogenetic tree had similar numbers of introns and exons. NnSPX2 had the largest length (approximately 20 kb), with only three exons and two introns. ZmaySPX1 had a minimum length (755 bp), and it contained one coding region. Clade A (SlSPX4) had seven exons and six introns, while it was three exons for other SlSPX genes. The genes in clade B had 3–7 exons and 2–6 introns. However, all the genes in clade C contained only three exons and two introns. Most genes in clades D and E also had three exons and two introns. The schematic structures of all SPX genes were constructed using the MEME analysis tool. The obtained sequence and length information of the conserved motif are shown in Figure 2 and Table S5. All SPX genes contained the conserved SPX domain containing motifs 2, 3, 4, and 8. The SPX genes within the same clade shared a similar motif composition but showed distinct differences in motif composition among different clades. For example, the genes in clade C contained motifs 1, 2, 3, 4, 6, and 8. In clade D, these genes contained almost all 10 motifs, while most genes in clade E lacked motifs 7 and 10. The genes in clade B contained motifs 8, 4, 3, 6, 1, 2, and 5, and clade A only consisted of motifs 1, 3, and 4. In total, the similar gene structures and conserved motif compositions of the SPX genes within the same clade strongly supported the reliability of the phylogenetic analysis results.

3.3. Cis-Regulatory Element Analysis of SPX Genes

The 2 kb upstream regions of SPX genes of 28 species were extracted to analyze the cis–acting elements using the online software NEWPLACE to investigate the potential function and regulatory mechanisms of SPX genes (Figure 3). Most of the SPX genes contained 2, 4, 6, or 8 P1BS cis–elements, consistent with the previous reports [32,33,59]. This finding suggested that these SPX genes could be bound by PHR transcription factors involved in response to low P stress. In Arabidopsis and rice, PHR1 acted on many PSI genes by preferentially binding to cis–element P1BS in the promoters of these genes to activate the low P response and promote Pi uptake [5,20,60]. Other cis–elements were also found to be involved in development (DOFCOREZM, ROOTMOTIFTAPOX1), tissue-specific expression (EBOXBNNAPA, L1BOXATPDF1), dehydration responses (DRECRTCOREAT), low–temperature responses (TRECOREATCOR15), plant hormone responses (ABRELATERD1, ERELEE4, ARR1AT), light responses (CIACADIANLELHC, REALPHALGLHCB21, EVENINGAT), copper ion-induced expression elements (CURECORE–CR), injury response elements (WBOXNTERF3), and other kinds of biotic/abiotic stress. Some cis-elements usually bound by MYB, MYC, and WRKY TFs, such as MYBCORE, MYCCONSENSUSAT, and WRKY71OS, were also identified, indicating that the expression of SPX genes might be regulated by various MYB, MYC, and WRKY TFs when the external Pi concentration changes. Among these cis–elements, the DOFCOREZM and ROOTMOTIFTAPOX1 elements were the most abundant, followed by the ARR1AT, EBOXBNNAPA, MYCCONSENSUSAT, and CURECORECR elements.

3.4. Chromosomal Localization, Gene Duplication and Synteny Analysis of SPX Genes in S. polyrhiza

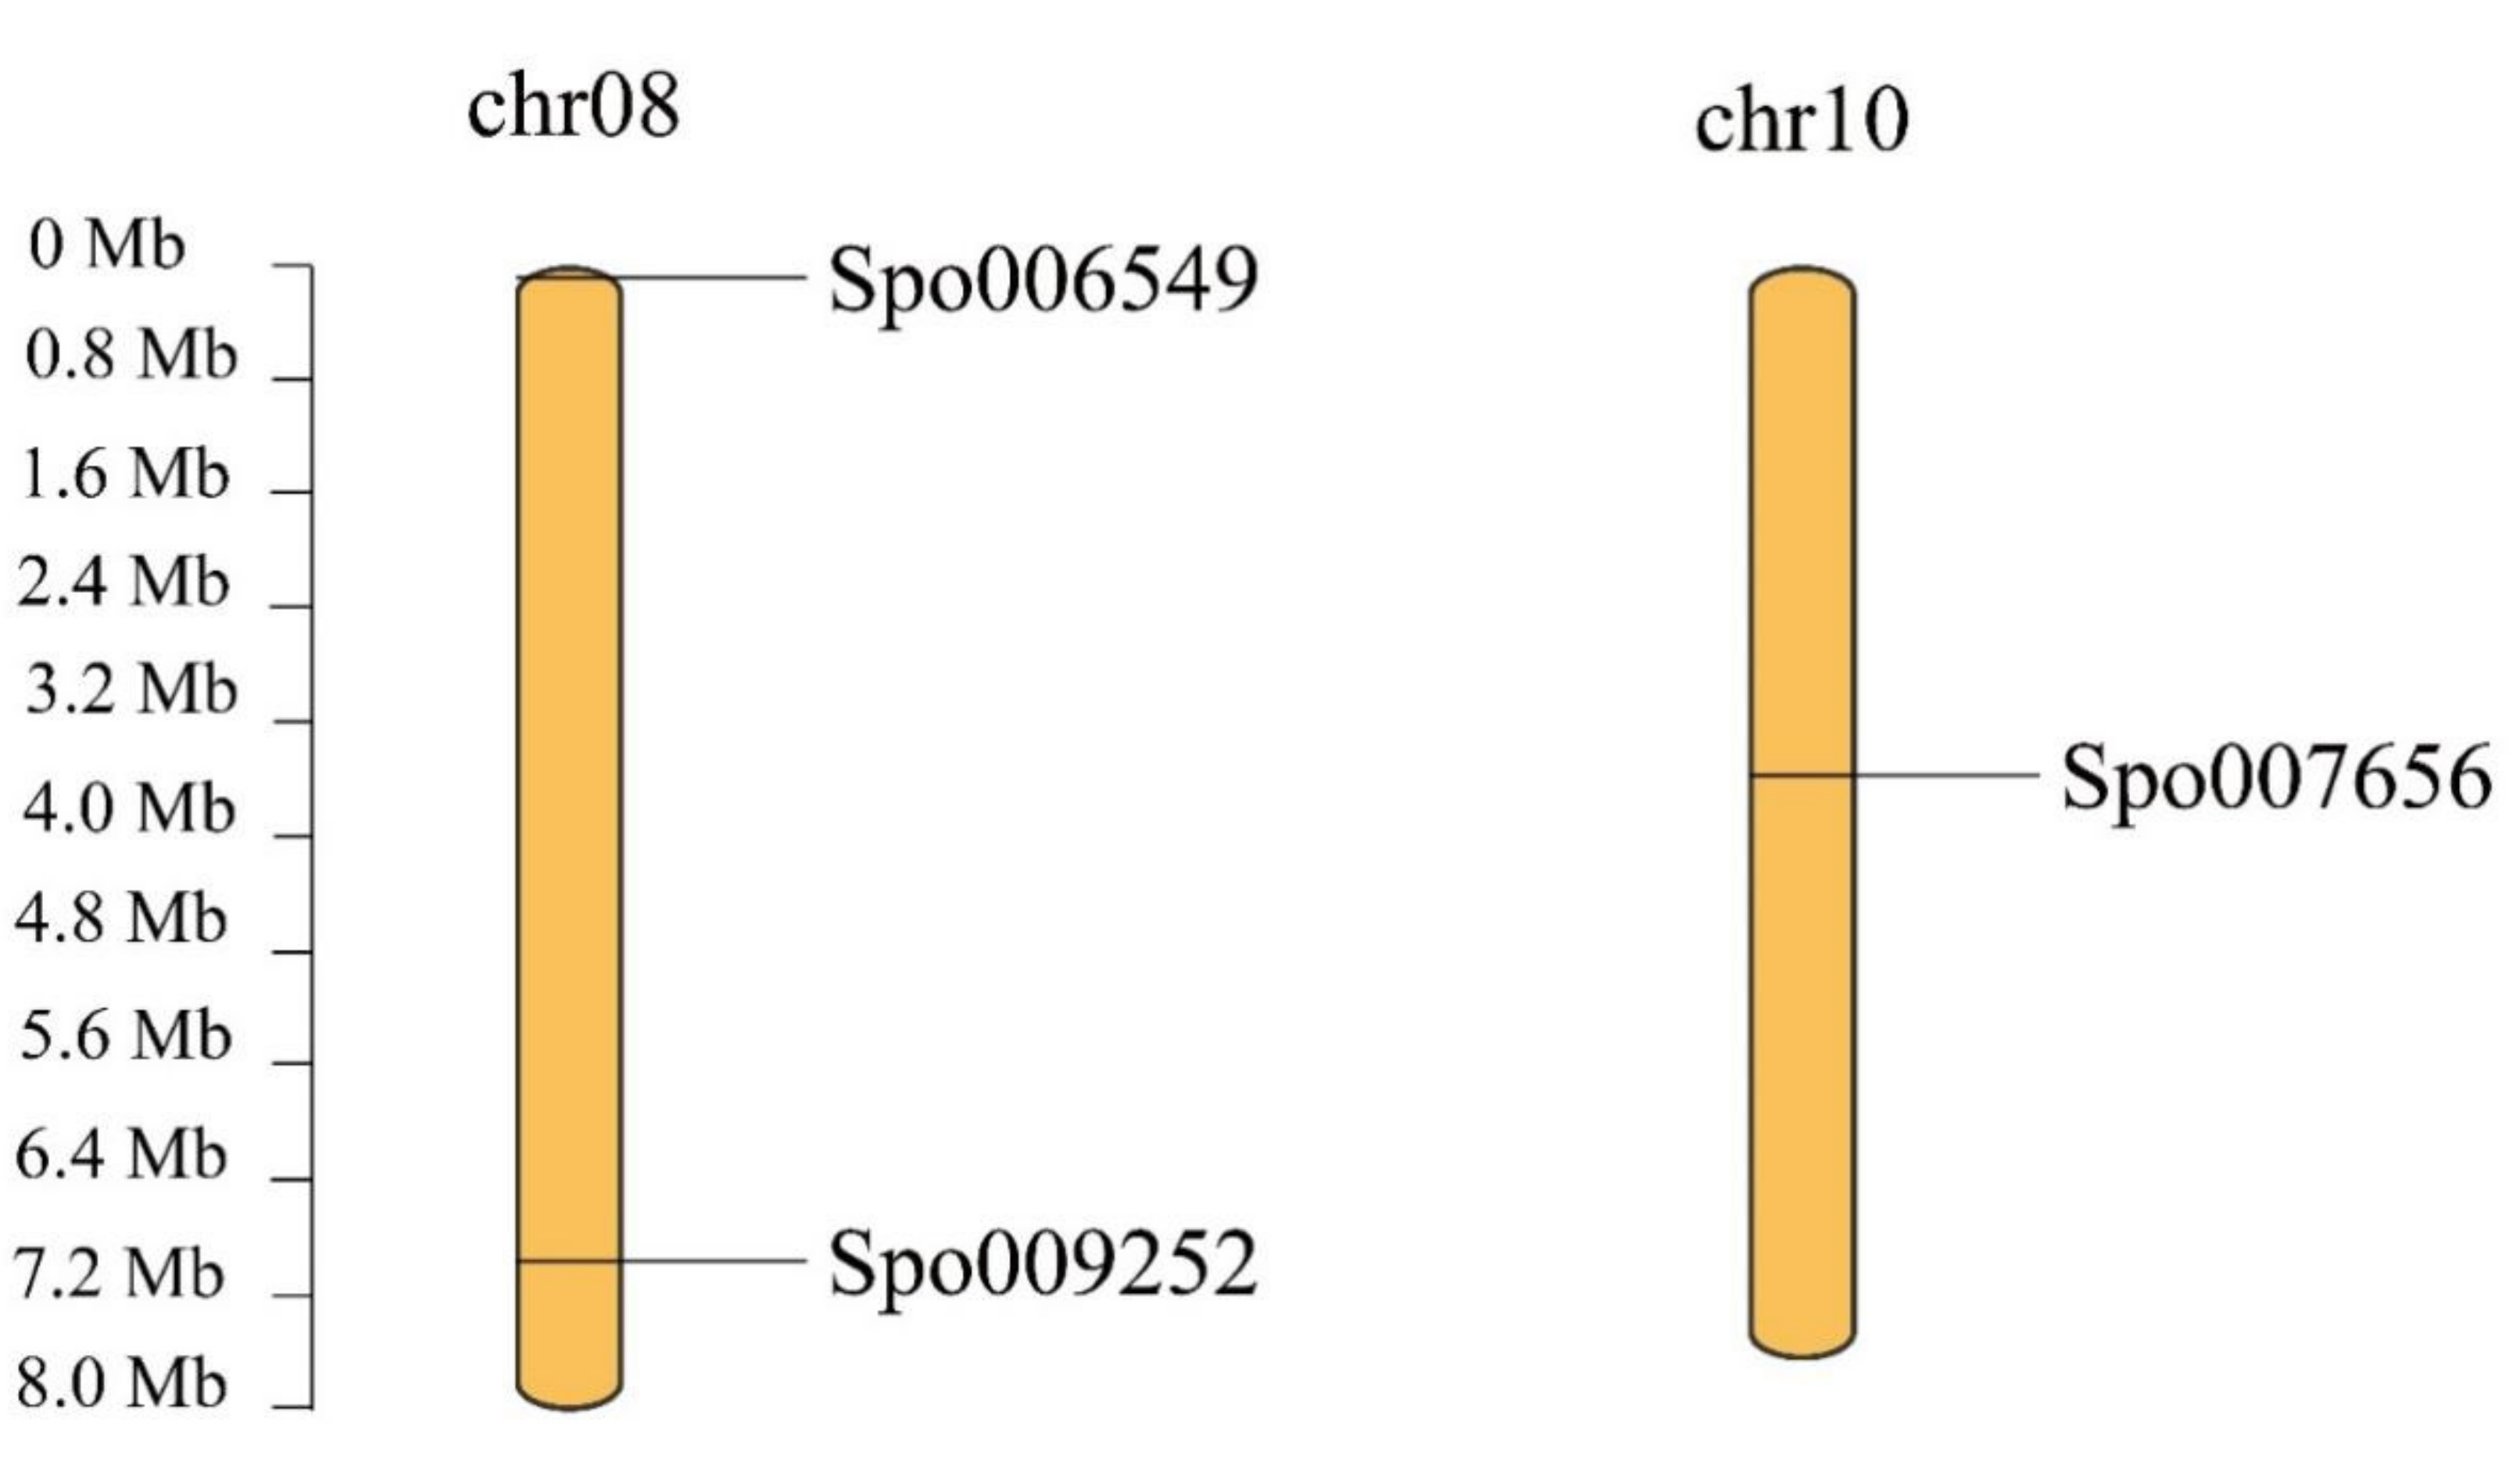
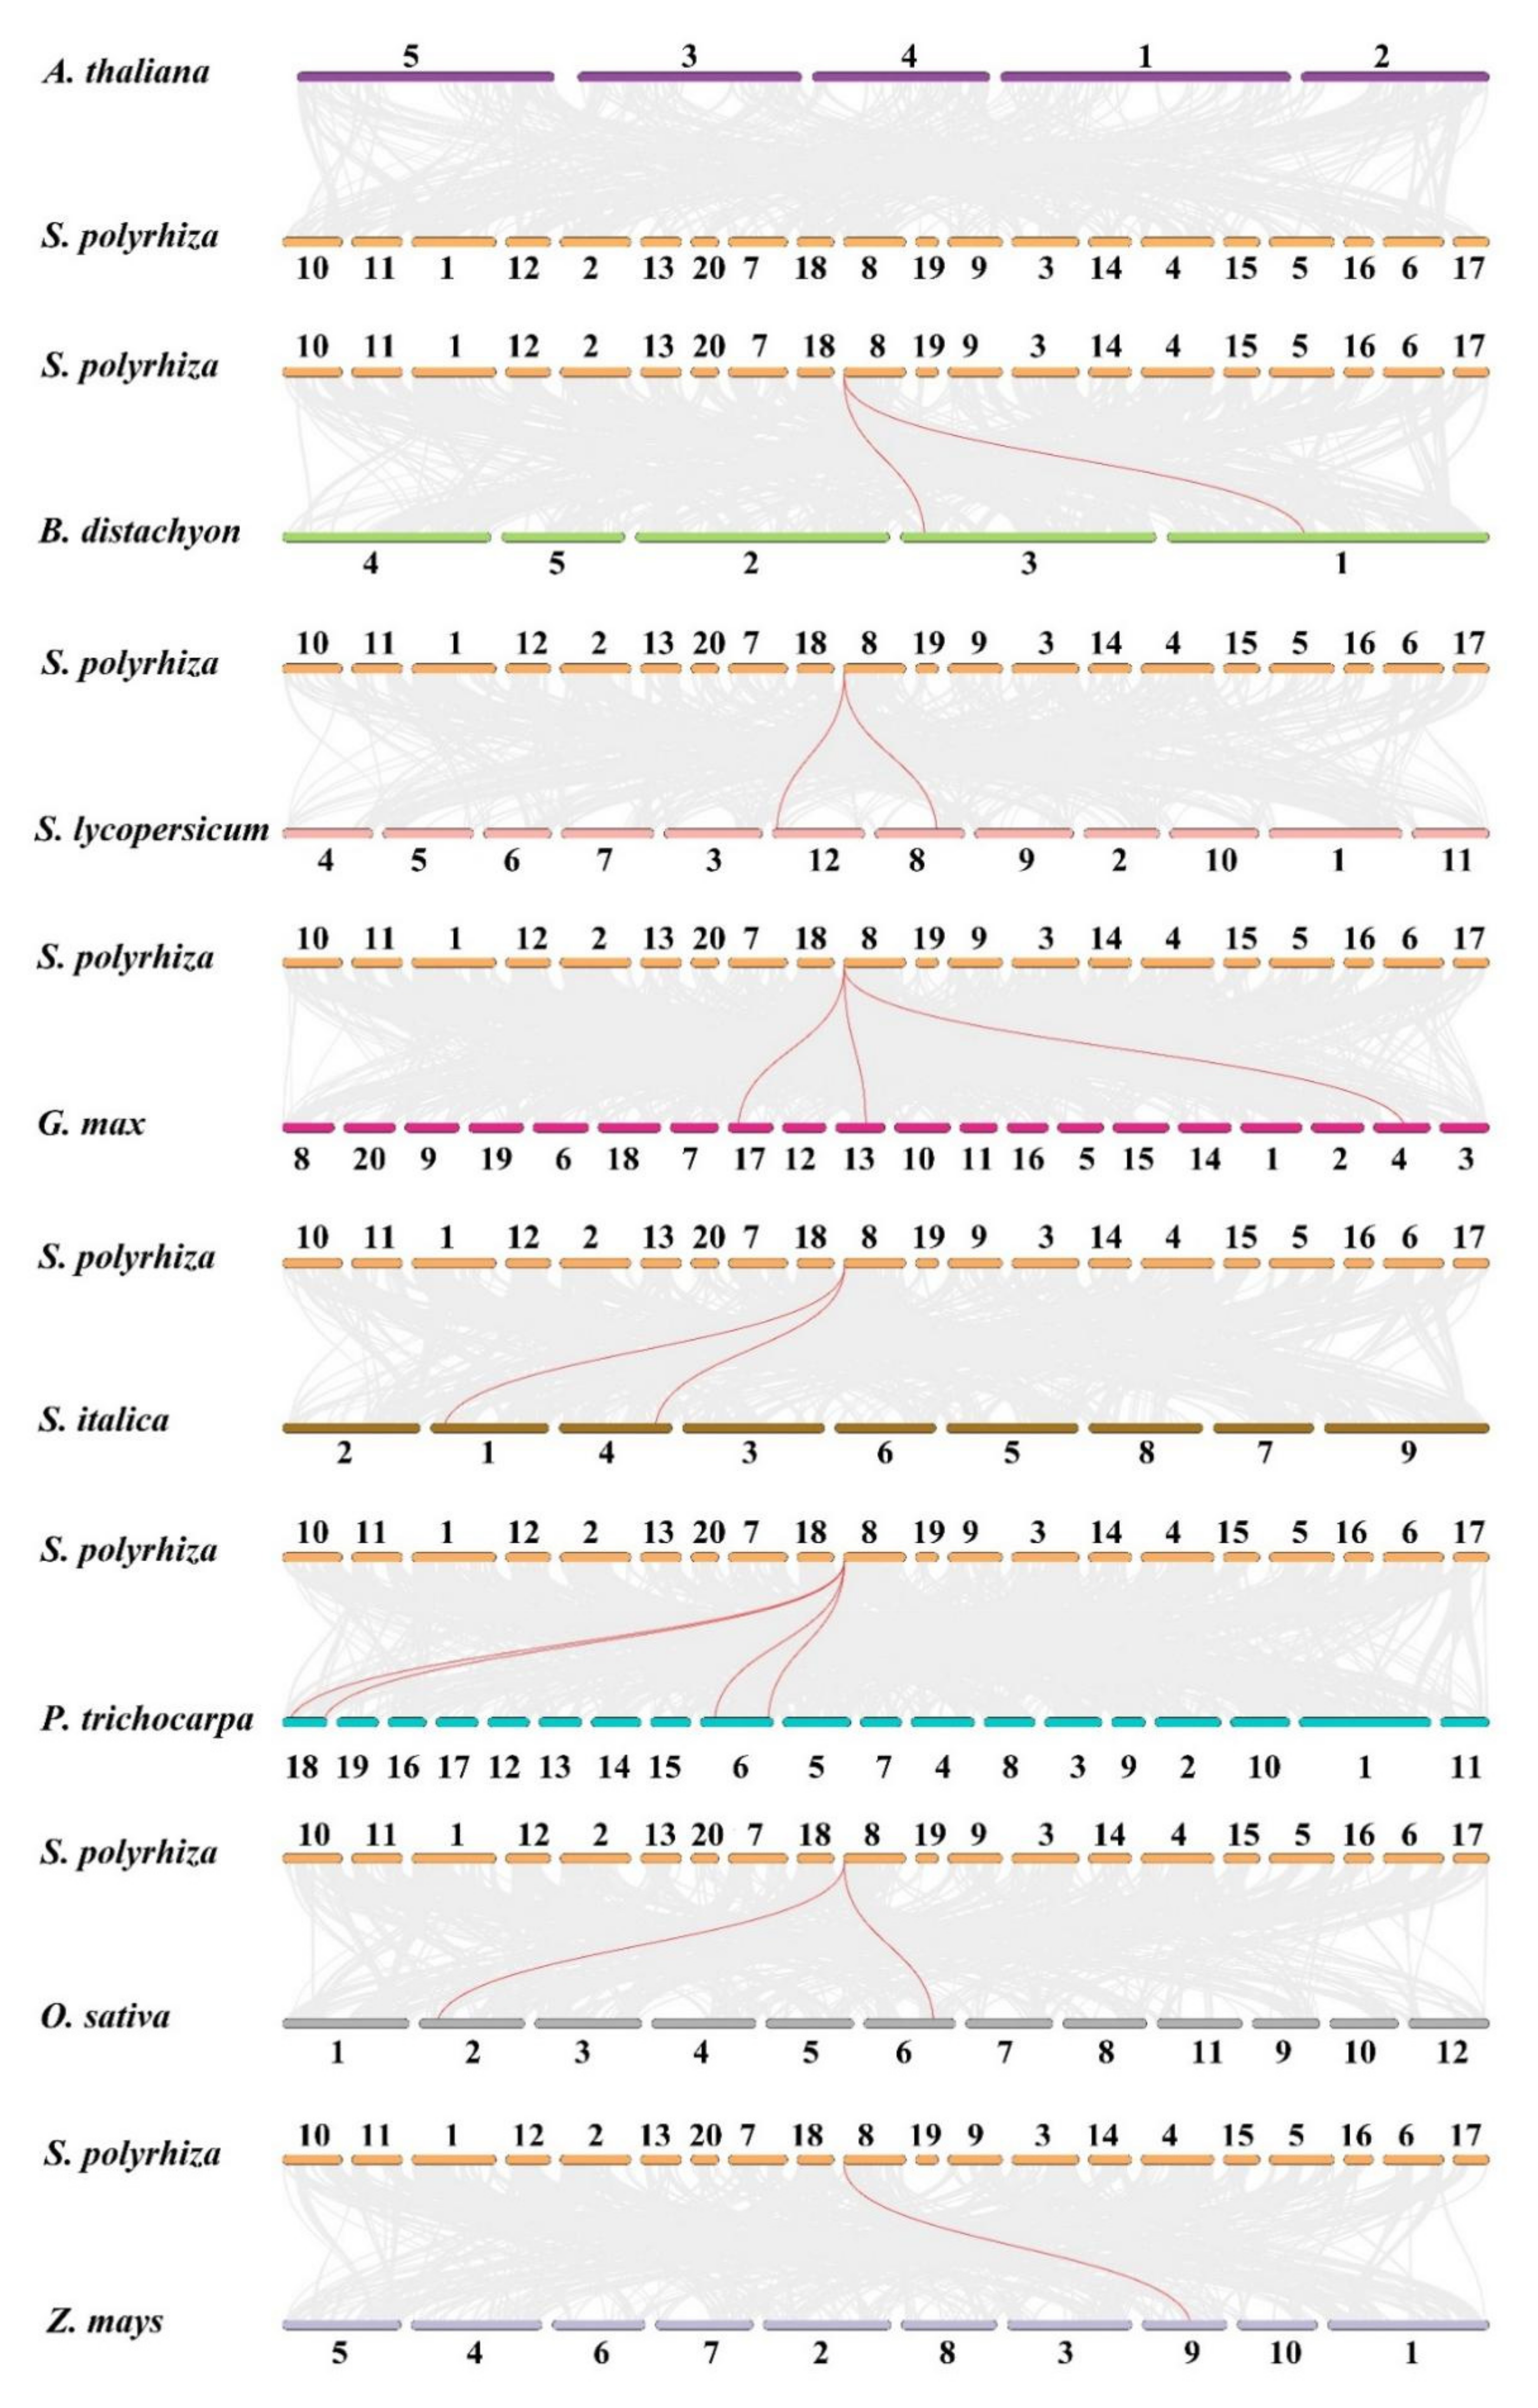
Synteny analysis was conducted at the chromosome-level genome assembly of the duckweed species of S. polyrhiza via McScan software. The results showed that no tandem repeat or segmental duplication events occurred in S. polyrhiza. In addition, three SPX genes were identified in S. polyrhiza, and their chromosome distributions were analyzed. SpSPX1 (Spo006549) and SpSPX3 (Spo009252) were located at chromosome number 8 (chr08), and SpSPX2 (Spo007656 SpSPX3) was located at chromosome number 10 (chr10) (Figure 4). The evolutionary relationships of the SPX family between S. polyrhiza and eight other species, including A. thaliana (Brassicaceae), B. distachyon (Poaceae), S. lycopersicum (Solanaceae), G. max (Fabaceae), S. italic (Poaceae), P. trichocarpa (Salicaceae), O. sativa (Poaceae), and Z. mays (Poaceae), were further analyzed. A collinearity gene map of the SPX family among these nine species is shown in Figure 5 and Table 3. No syntenic SPX gene pair between A. thaliana and S. polyrhiza could be found in the map. Moreover, 1–4 syntenic SPX gene pairs between S. polyrhiza and seven other species could be observed. Only SpSPX1 was found to be collinear with the SPX genes of other species. Four syntenic SPX gene pairs were identified between S. polyrhiza and P. trichocarpa (on chr06 and chr18). Two syntenic SPX gene pairs could be found between S. polyrhiza and B. distachyon (on chr01 and chr03), S. lycopersicum (chr08 and chr12), S. italic (chr01 and chr04), and O. sativa (chr02 and chr06). Only one syntenic SPX gene pair was found between S. polyrhiza and Z. may (chr09).

3.5. Molecular Interaction Networks and Protein Structure Prediction for SpSPXs

An interaction network between SpSPXs and their targets was constructed on the basis of the Arabidopsis genome (Figure 6). The results of the interaction network involved four SPX genes and 22 targets. Most of the targets were involved in low P response and P metabolism, including PHR (the central regulator in PSR regulatory system), Phosphate starvation-induced gene 2 (ATPS2), Pi transporters (PHO1, PHO1; H1, and PHT1; 4), Purple acid phosphatase 17 (PAP17) that is involved in the activation and utilization of Pi, PEPC1 (Pyridoxal phosphate phosphatase-related protein) that catalyzed the cleavage of pyrophosphate, Phospholipase D P2 (PLDP2) that is involved in regulating root development in response to Pi limitation, SPX–MFS proteins (AT4G11810, AT4G22990, and AT1G63010), and SPX–EXS protein (AT1G69480). The Senescence–related gene 3 (SRG3) was also identified to interact with SpSPX1 and SpSPX2. Some TFs, such as UNE12, which is required for ovule fertilization, and AT1G03040 (TF bHLH7 identifier), which regulates the competence of pericycle cells to initiate lateral root primordium formation, were found in the interaction network of SpSPXs. The interaction network contained some enzymes, transmembrane proteins, and macromolecular compounds, such as AT5G20790 (transmembrane protein); AT1G20770 (coiled–coil protein); and monogalactosyldiacylglycerol synthase 3 (MGDC), which is involved in the synthesis of the major structural component of photosynthetic membranes and in chloroplast envelope biogenesis, sulfoquinovosyldiacylglycerol 2 (SQD2), and 4, 5–dichlorocatechol. The 3D structures of three SpSPX proteins predicted by the trRosetta server are shown in Figure 7A–C. The modeled 3D structure of three SPX proteins consisted of two parts, including “SPX domain” and “non-SPX domain”. The “SPX domain” parts of three SPX proteins shared a high level of homology, thus providing information to explore their functions at the proteomic level.

3.6. Transcriptional Patterns of SpSPX Genes in S. polyrhiza

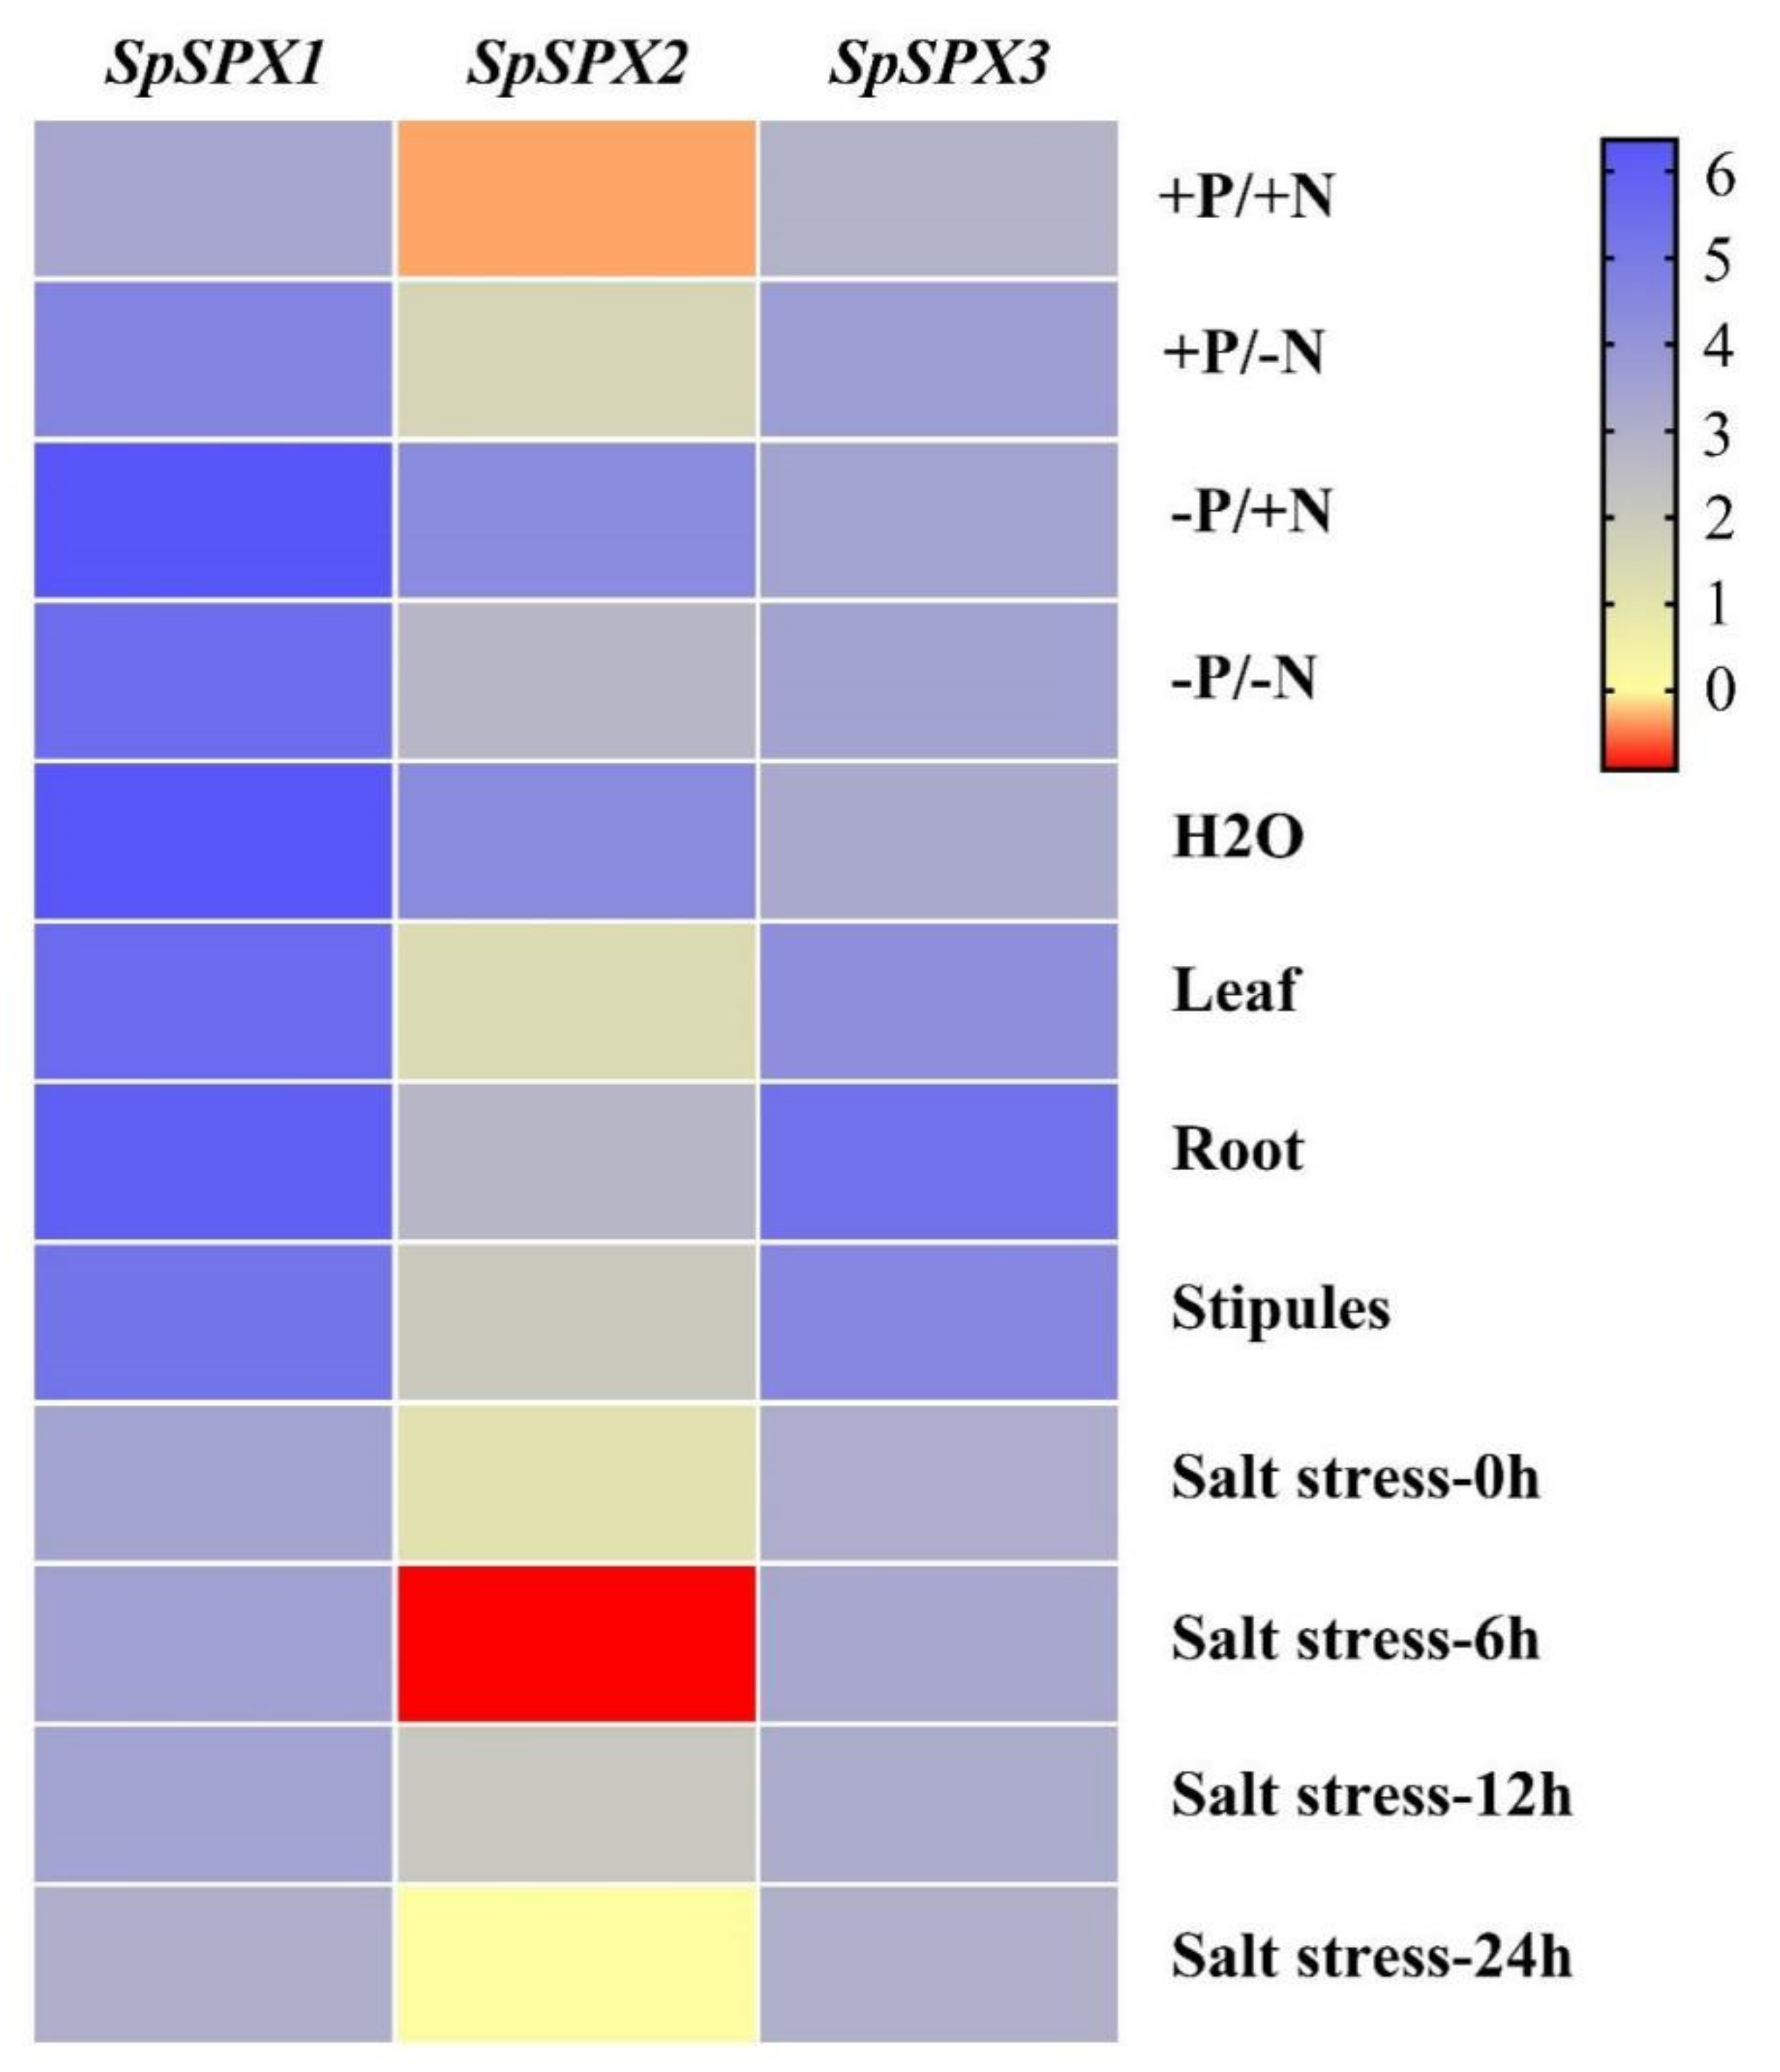
RNA–seq was used to explore the expression profiles of three SpSPX genes under low P/N stress (Figure 8). The expression profiles of SpSPX genes were shown as log2 values on the basis of TPM values (transcripts per kilobase of exon model per million mapped reads). The expression of SpSPX1 in the N deficiency, P deficiency, N–P deficiency, and nutrient deficiency groups increased to high levels compared with that in the CK group, especially in the P deficiency and nutrient deficiency groups. SpSPX2 expression only increased in the P deficiency and nutrient deficiency groups. The expression levels of SpSPX3 under different treatments were almost the same as those in the CK group. The above results indicated that SpSPX1 was more sensitive to N and P stresses than SpSPX2 and SpSPX3, which could rapidly respond to low P/N stresses and regulate the expression of other interacting genes. The expression of SpSPXs in previous studies was also analyzed, including different plant tissues and under salt stress treatment (Figure 8). The results showed that SpSPX1 was highly expressed in roots, leaves (mature fronds/mother fronds), and stipules (young fronds/daughter fronds). However, the expression of SpSPX2 in roots, leaves, and stipules was relatively low, and the expression levels were similar among various tissues. The expression of SpSPX3 in different tissues was higher than that of SpSPX2 and only at a high level in roots. The results suggested that the expression of these SpSPX genes had a tissue-specific pattern. However, the heatmap revealed that the expression of SpSPX genes was not affected by salt stress or the time of treatment.

3.7. Expression Analysis of SpSPX Genes in Response to low P/N Stress by qRT-PCR

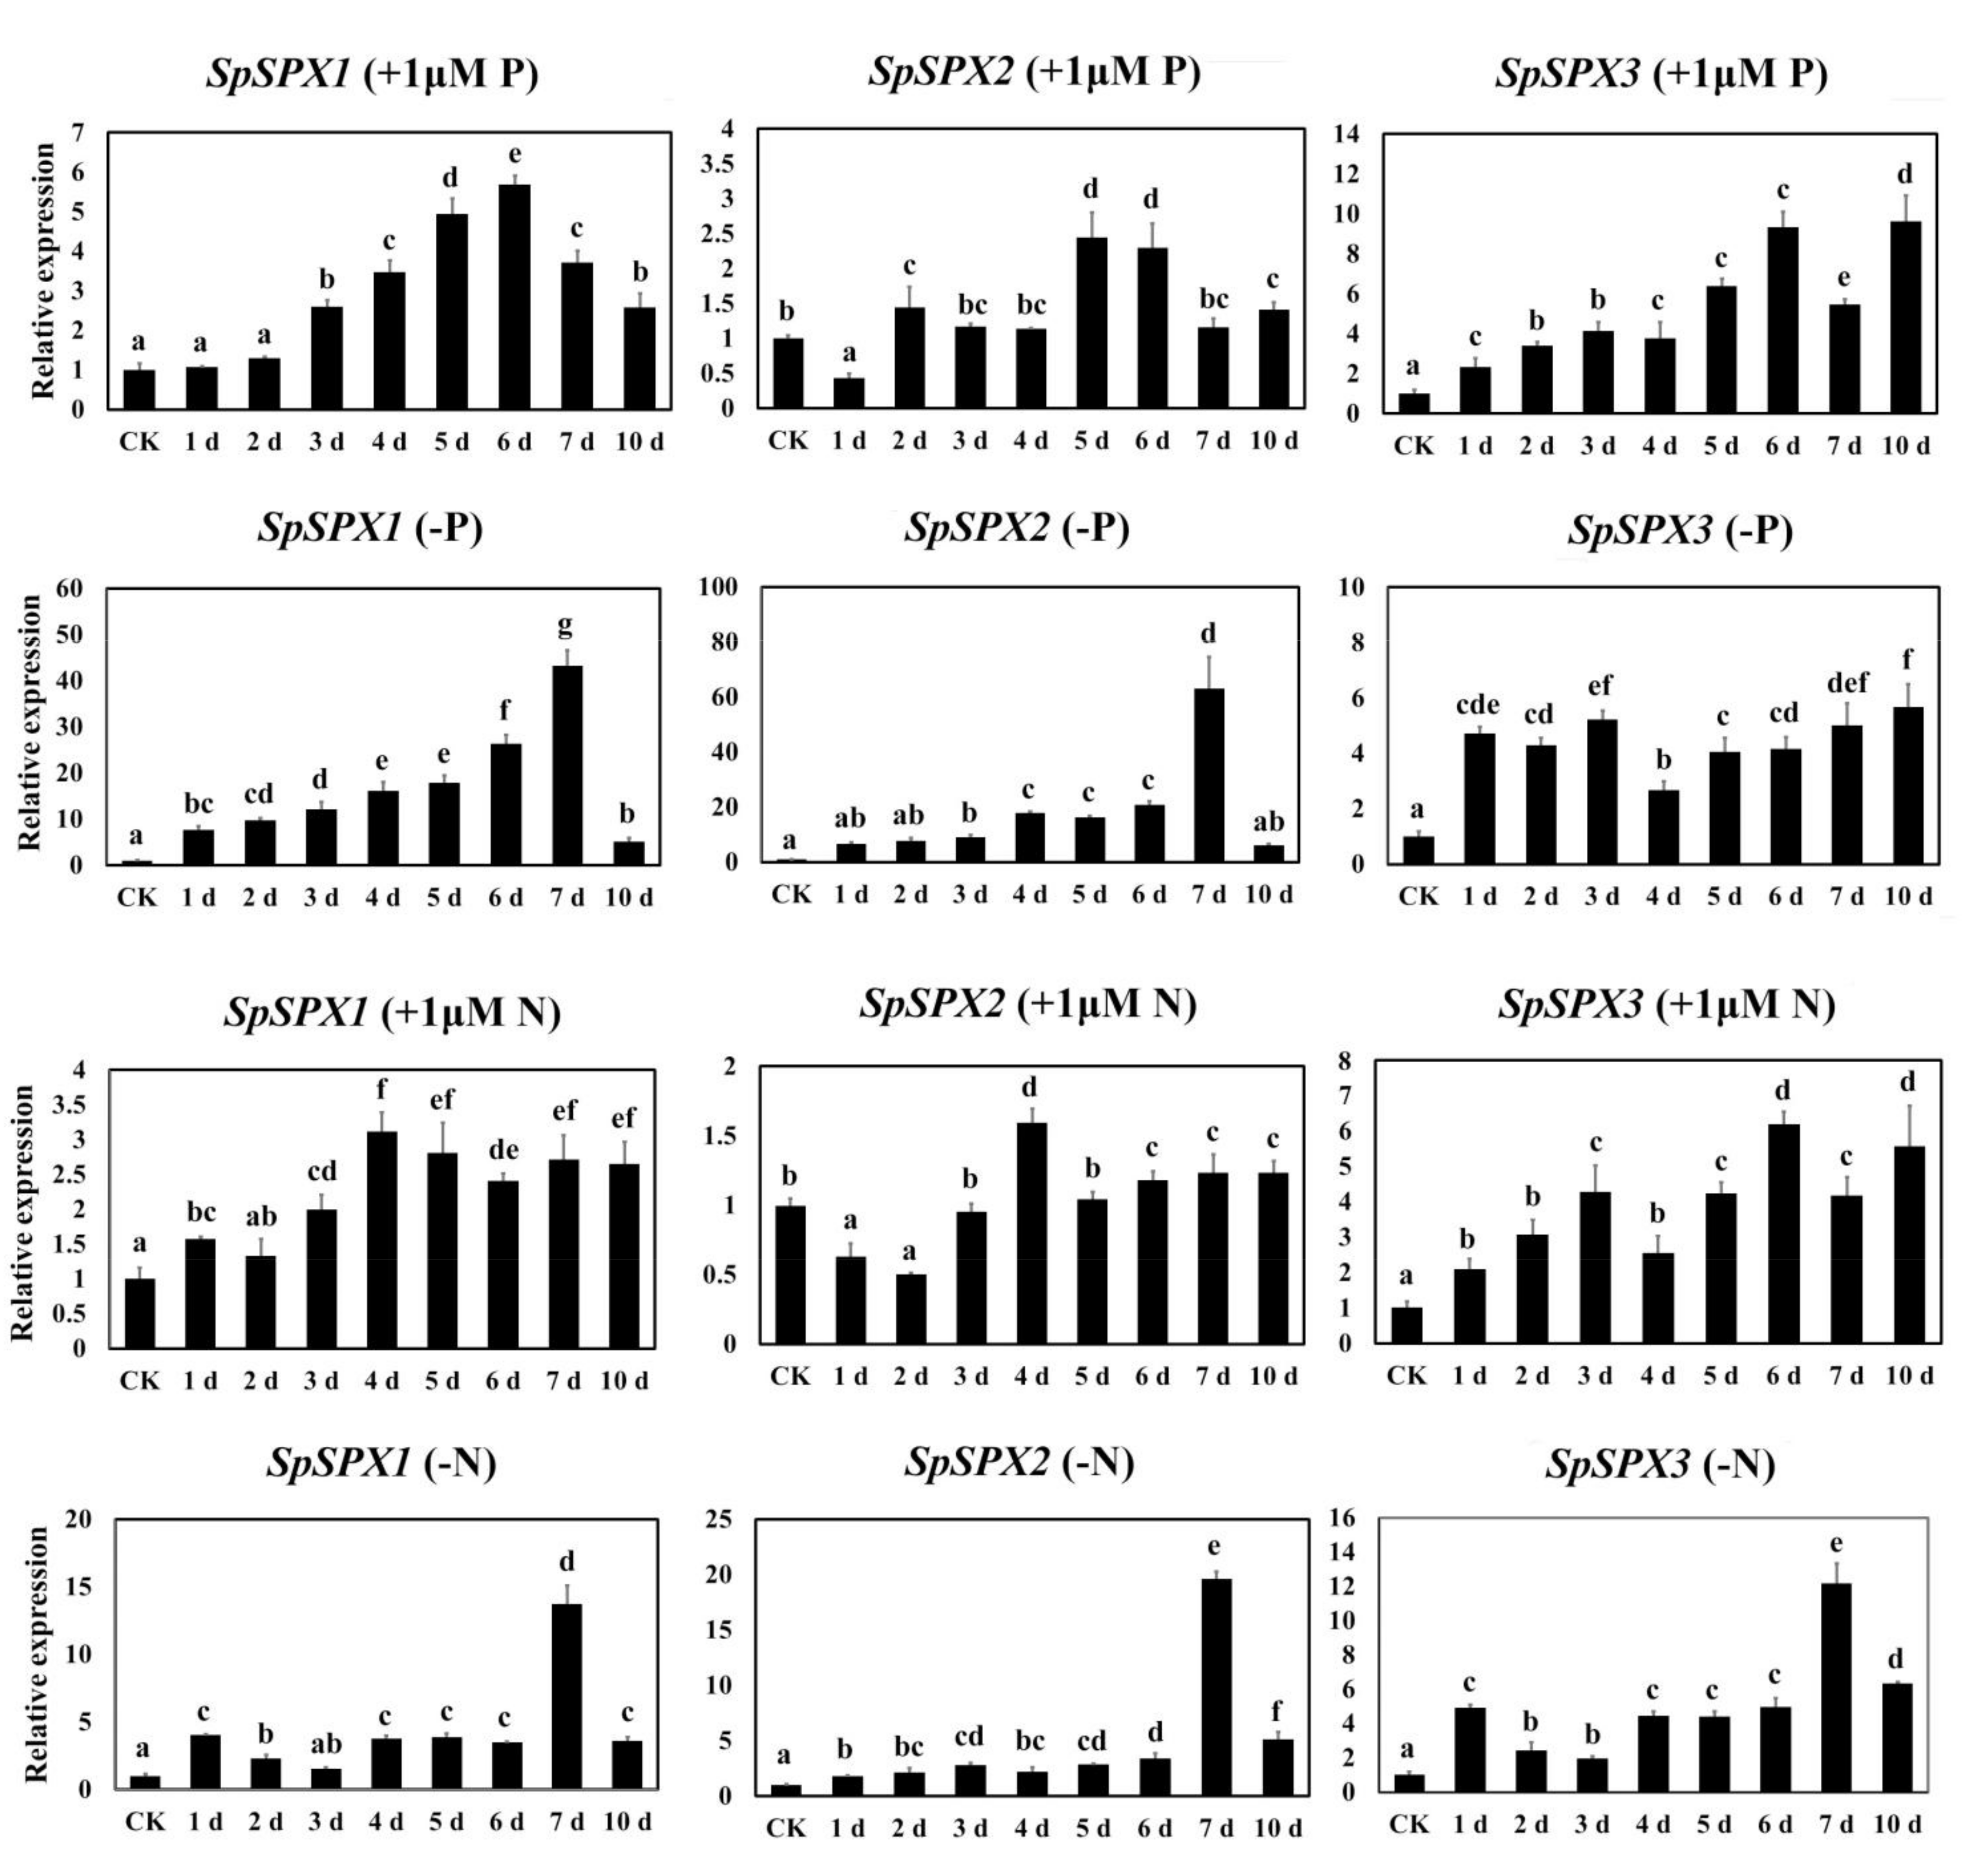
The expression of three SpSPX genes under different P/N stresses was further analyzed by qRT–PCR (Figure 9). When treated with 1μM P, SpSPX1 significantly upregulated from 1 day to 6 day and then downregulated at 7 day and 10 day. However, no significant difference was observed between the CK group and the 1 day and 2 day groups. By contrast, the expression of SpSPX1 significantly increased from 1 day to 7 day and was reduced to its lowest level at 10 day under P deficiency. A significant difference was observed between the CK group and the 1d group. Furthermore, the expression of SpSPX1 under P deficiency was significantly higher than that under 1 μM P treatment. Similarly, the expression of SpSPX1 under N deficiency was significantly higher than that under 1 μM N treatment. Although the expression of SpSPX1 from 1 day to 10 day under N deficiency was significantly higher than that of the CK group, the highest expression of SpSPX1 was observed at 7 day. The expression of SpSPX1 was significantly upregulated from 1 day to 4 day and then downregulated from 5 day to 10 day, with no significant difference. The expression of SpSPX2 was significantly downregulated at 1 day and then upregulated at 2, 5, and 6 day by 1 μM P treatment. No significant difference was found among the CK, 3, 4, 7, and 10 day groups. The expression of SpSPX2 was significantly downregulated at 1 day and 2 day by 1 μM P treatment and then upregulated from 3 day to 6 day. The highest expression of SpSPX2 was observed at 4 d, and its expression was maintained at a stable level from 6 d to 10 d. The expression changes of SpSPX2 were similar under P and N deficiency, significantly upregulated from 1 day to 7 day, and significantly downregulated at 10 day. The expression of SpSPX2 under P/N deficiency was higher than that under 1 μM P/N. All the expression levels of SpSPX3 were significantly upregulated at 1 day by all treatments. The highest expression of SpSPX3 was observed at 10 day under 1 μM P and P deficiency, 6 day under 1 μM N, and 7 day under P deficiency. The expression of SpSPX3 was significantly upregulated from 1 day to 6 day by 1 μM P treatment, significantly downregulated at 7 day, and increased to its highest level at 10 day. All the expression levels of SpSPX3 from 1 day to 10 day were relatively higher than those in the CK group under P deficiency. However, no significant difference was observed between 1 day and 2 day, 1 day and 3 day, 5 day and 6 day, 6 day and 7 day, and 7 day and 10 day. Although downregulated from 3 day to 4 day and 6 day to 7 day, the expression of SpSPX3 was significantly upregulated by 1 μM N treatments from 1 day to 10 day compared with that of the CK group. The expression of SpSPX3 was also significantly upregulated from 1 day to 10 day under N deficiency. These results suggested that SpSPX genes were induced by low P/N stresses and played critical roles in the regulation of P/N responses.
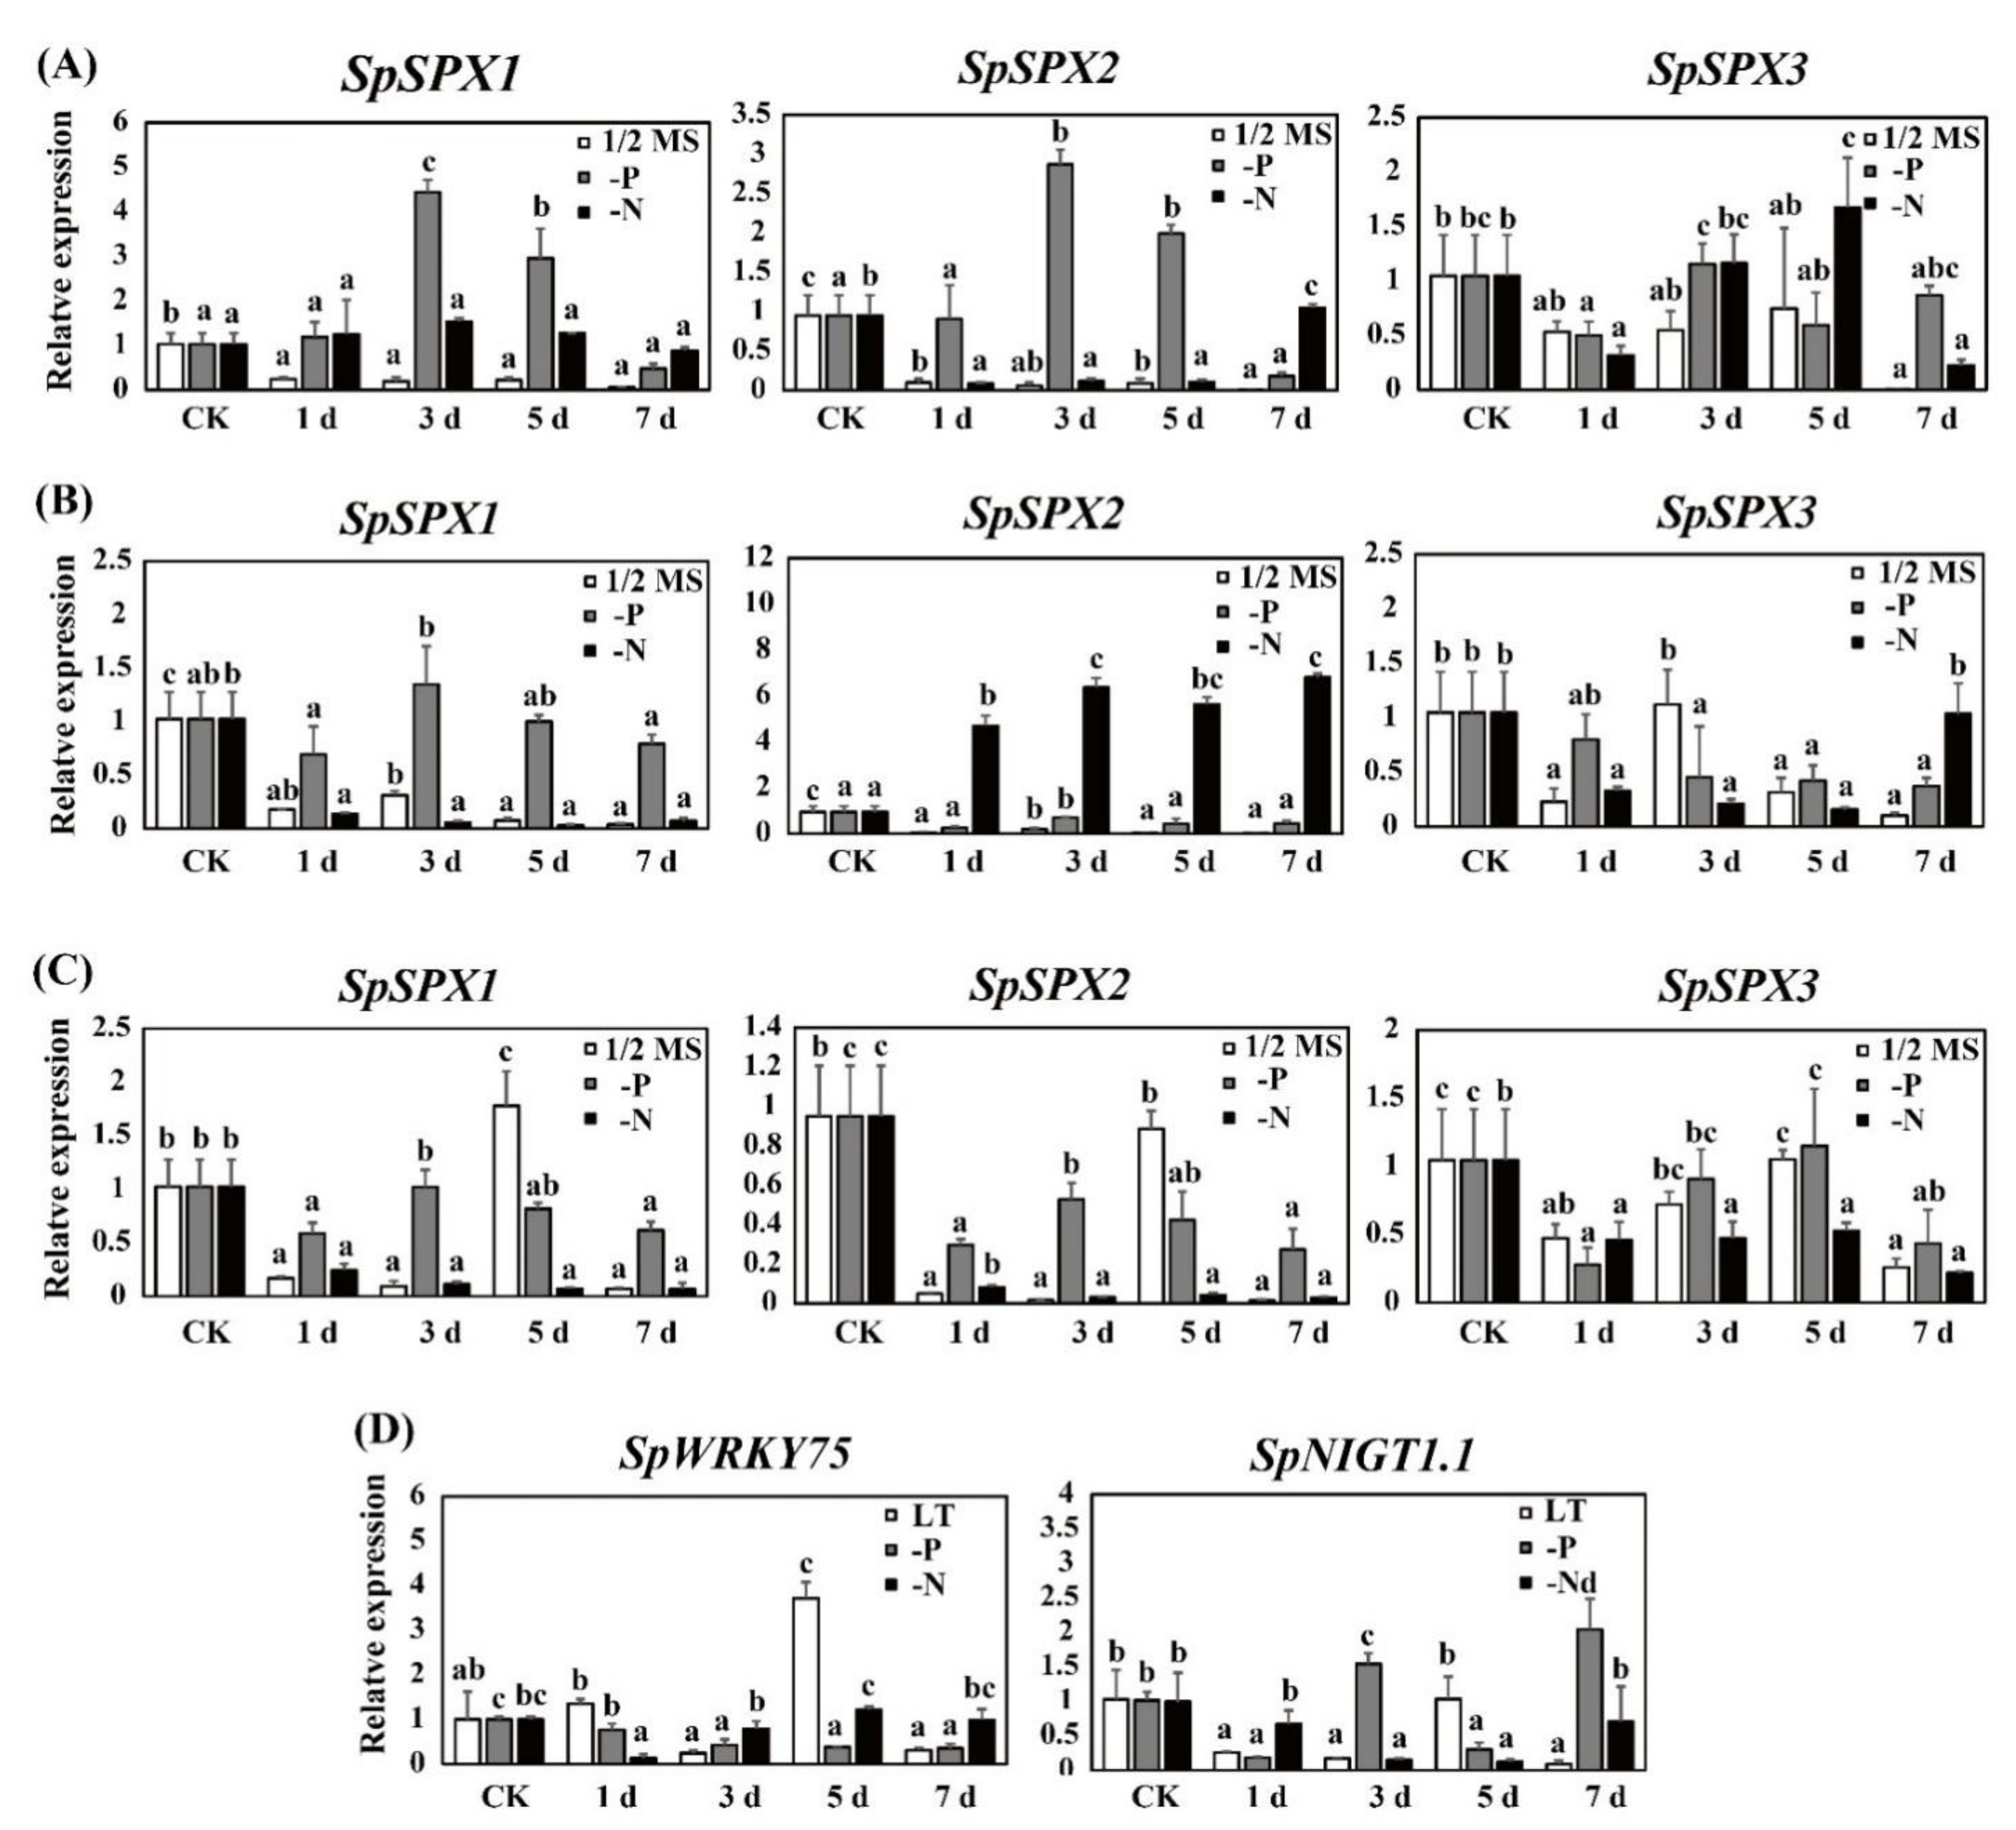
The expression of three SpSPX genes was also regulated by ABA treatment, osmotic, and LT stresses (Figure 10A–C). When Spirodela plants were cultured in 1/2 MS medium, all the expressions of three SpSPX genes were downregulated at 1 day under these stress conditions. Furthermore, the expression of SpSPX1 and SpSPX2 was significantly downregulated from 1 day to 7 day when treated by ABA and osmotic stresses. The expression of SpSPX1 and SpSPX2 was significantly upregulated from 1 day to 3 day and then downregulated to the lowest at 7 day when treated by LT stress. The expression levels of SpSPX3 were upregulated from 1 day to 5 day and downregulated to the lowest at 7 day when treated by ABA and LT stresses. When treated by osmotic stress, the expression of SpSPX3 was significantly upregulated from 1 day to 3 day and then downregulated from 5 day to 7 day. When Spirodela plants were cultured in 1/2 MS medium with P and N deficiency, the expression of SpSPX1 was upregulated from 1 d to 5 day and then downregulated at 7 day by ABA treatment. Similarly, the expression of SpSPX2 was also upregulated from 1 day to 5 day at 1/2 MS–P group under ABA treatment and from 1 day to 7 day at 1/2 MS -N group under osmotic stress. However, all the expression levels of three SpSPX genes were downregulated at 1 day in the remaining treatments. Furthermore, the expression levels of the SpSPX1 at 1/2 MS-N group under osmotic and LT stresses, the SpSPX2/3 at 1/2 MS-N group under LT stress, and the SpSPX3 at 1/2 MS-P group under osmotic stress were downregulated from 1 day to 7 day. By contrast, almost all the expression levels of SpSPXs in the remaining treatments were upregulated from 1 day to 3 day. The above results indicated that ABA treatment, osmotic and LT stresses inhibited the expression of SpSPXs even when Spirodela plants were cultured in P and N deficiency conditions. Although the expressions of SpSPXs were upregulated in the late treatment, such as 3 day or 5 day, the expression of SpSPXs was maintained at a relatively low level compared to those in plants without ABA, osmotic stress, and LT stress.
The expressions of TFs SpWRKY75 and SpNIGT1.1 under LT and low P/N stress conditions are shown in Figure 10D. When treated by LT stress, the expression of SpWRKY75 was significantly upregulated at 1 d. The highest expression of SpWRKY75 was observed at 5 day, and then significantly downregulated at 7 day. The expression of SpWRKY75 was contrary to that of SpSPXs, with levels significantly downregulated from 1 day to 7 day by P deficiency treatment. By contrast, the expression of SpWRKY75 was reduced to its lowest level at 1 day and then significantly increased from 3 day to 7 day by N deficiency treatment, which was similar to the expression of SpSPXs. The expression of SpNIGT1.1 was significantly downregulated from 1 day to 3 day and then significantly upregulated at 5 day by LT stress. The lowest level of SpNIGT1.1 was observed at 7 day. The expression of SpNIGT1.1 was significantly downregulated from 1 day to day by N deficiency treatment and then significantly increased to the highest level at 7 day, which was contrary to that of SpSPXs under N deficiency condition. However, the expression of SpNIGT1.1 was only significantly downregulated at 1 day and 3 day by P deficiency treatment. The expression levels of SpNIGT1.1 at 3 day and 7 day were significantly higher than that in CK group.

4. Discussion

Whole-genome sequencing of many plants has been completed thanks to the rapid development of high-throughput sequencing technology, which provides the convenience to carry out gene family analysis [61]. The SPX genes play an important role in the P signal network, including Pi absorption, transport, storage, and homeostasis [32]. However, studies on the identification and functional analysis of SPX genes involved in the P signal network in aquatic plants have not yet been reported. In the present investigation, 160 SPX genes were identified in the genomes of 28 species. The results revealed that the monocot species T. aestivum and dicot species G. hirsutum had more SPX genes than algae, ancient moss, and fern plants, possibly due to a higher abundance of intrachromosomal gene duplications [62]. The number ranges of SPX genes between monocot and dicot plants were close. However, the basal angiosperm A. trichopoda had only three SPX genes. These results indicated that SPX genes also played a similarly important functional role in ancestral species and that gene expansion occurred in the evolution from ancestral species to monocot and dicot plants. Although seven SPX genes were identified in the ancient moss plant P. patens, no SPX gene was found in the moss M. polymorpha. These results indicated that not only gene retention occurred during the evolution of plants but also gene loss [59]. The numbers of SPX genes in terrestrial plants were much higher than those in aquatic plants, such as S. polyrhiza, W. australiana, and Z. marina. This finding may be due to the difference in the distribution and content of P nutrients between terrestrial and aquatic environments, thus affecting the acquisition and absorption of P nutrients by plants [63]. Through phylogenetic tree analysis, these 160 SPX genes were divided into five clades. This was further supported by the results of gene structure and conserved motifs. The SPX genes in these five clades exhibited gene length and exon-intron structural divergences. However, the exon-intron and conserved motif structures of SPX genes were highly conserved within each clade, and the genes clustered together generally possessed a similar distribution of intronic regions amid the exonic sequences. For example, SlSPX4 clearly formed a single clade away from other clades, possibly due to its different gene structure and motif composition. SlSPX4 mainly consisted of three motifs (motifs 1, 3, and 4), fewer than genes in other clades. Moreover, SlSPX4 contained six introns and seven exons. However, the SPX genes in clade B were mostly composed of motifs 1–9 with four introns and five exons, while the SPX genes in clade C were only composed of motifs 1–4, 6, and 8 with two introns and three exons. By contrast, the SPX genes in clade D had almost all 10 motifs and contained two introns and three exons. Most of the SPX genes in clade E had motifs 1–9, while some genes, such as SceSPX1 and ZmaySPX1, contained only one intron or had no introns. The different motif compositions and exon–intron structures may contribute to the functional diversification of SPX genes.
The cis–elements in promoter regions play important roles in gene regulation and expression during plant growth and responses to diverse biotic and abiotic stresses [64]. Therefore, investigating cis–elements is necessary for the identification of genes related to plant development or stress resistance [65]. In response to low P stress, master transcriptional activator PHR1 acted on many PSI genes by preferentially binding to cis-element P1BS, thus activating a low P response and promoting Pi uptake [5,20,60]. In Arabidopsis and rice, AtSPX1/2 or OsSPX1/2 acted as negative regulators, inhibited OsPHR2/AtPHR1 activity through direct protein–protein interactions, and prevented the binding of PHR2 (or AtPHR1) to the promoter regions of PSI genes in a Pi-dependent manner [16,17]. The present study identified that most SPX genes contained two, four, six, or eight P1BS cis-elements, consistent with previous reports and thus suggesting that these SPX genes could be bound by low P-responsive transcriptional activator PHR1 in response to a low P response [16,17,20,66]. However, their response to P signaling and regulatory ability to the PHR1 gene may be different due to the difference in the number of P1BS elements in different SPX genes. In addition, other cis-elements involved in plant development and biotic/abiotic stress, such as dehydration responses, low-temperature responses, plant hormone responses, light responses, and injury response elements, and some TFs, such as MYB and WRKY, were identified; this finding indicated that SPX genes also participate in other important life activities in addition to Pi absorption and transport in plants, consistent with the findings in Arabidopsis [66,67]. Our previous study also reported that SpWRKY genes rapidly responded to P deficiency at 2 h treatment and 12 SpWRKYs were differentially expressed under P nutrients stress [55]. However, research on the diverse functions of SPX genes in other species is lacking.
The chromosomal localization, gene duplication, and synteny analysis of SPX genes in S. polyrhiza, the largest duckweed plant that has a strong enrichment ability for P/N, were further analyzed to explore the evolution and functions of SPX genes in aquatic plants [27]. In the present study, no tandem repeat or segmental duplication events occurred in S. polyrhiza, possibly because of its primitive evolutionary position, small genome size, and relatively simple genome structure [24]. The three SPX genes were identified in S. polyrhiza, with chromosome distributions at chr08 (SpSPX1 and SpSPX2) and chr10 (SpSPX3), which minimized the possibility for gene duplication events. The evolutionary relationships of the SPX family between S. polyrhiza and eight other species were also analyzed. Many colinear gene pairs among these species were revealed. Furthermore, only SpSPX1 was collinear with the SPX genes in other species, indicating that SpSPX1 was more conserved than SpSPX2 and SpSPX3. Two syntenic SPX gene pairs were found between S. polyrhiza and rice, and 1–4 syntenic SPX gene pairs were found between S. polyrhiza and other species, indicating that the SPX genes were highly conserved among these species. However, no syntenic SPX gene pair was identified between A. thaliana and S. polyrhiza because of their distant relationship.
The interaction network between SpSPX proteins and other proteins also provides basic information for further functional characterization of SpSPX proteins. The analysis results showed that most of the targets of SpSPXs were involved in P dynamics, including PHR1, ATPS2, PHO1, PHO1; H1, PHT1; 4, PAP17, PEPC1, PLDP2, SPX–MFS proteins, and SPX–EXS protein, which have been confirmed to interact with SPX proteins in Arabidopsis and rice [6]. Yan et al. (2019) characterized AtSPX1 as a key regulator in mediating the crosstalk among leaf senescence, Pi starvation, and salicylic acid (SA) signaling pathways in Arabidopsis [68]. The present study also identified that SpSPX1 and SpSPX2 proteins could interact with SRG3, indicating that the SpSPX proteins played an important role in plant senescence induced by low P stress. The interaction between SpSPX1 and SpSPX2 was also identified, implying their functional redundancy, and these two proteins may form homodimers and heterodimers in response to P starvation. In rice, SPX3/5 were verified to be functional repressors of OsPHR2 involved in restoring Pi balance with similar tissue expression patterns and subcellular localization. These results suggested that the evolution of the additional redundant paralogous SPX genes was beneficial to plants recovering Pi homeostasis after Pi starvation by the PHR2 pathway [19]. The interaction network also contained some TFs, enzymes, transmembrane proteins, macromolecular compounds, SQD2, and 4, 5–dichlorocatechol. In soybean, GmSPX1 was proven to interact with GmMYB48 and possibly function as a negative regulator of AtMYB4, an ortholog of GmMYB48 under low Pi conditions [31]. Ruan et al. (2018) reported that OsSPX1 interacted directly with REGULATOR OF LEAF INCLINATION1 (RLI1) to prevent RLI1 binding to the promoters of its downstream genes, BU1 (BRASSINOSTEROID UPREGULATED1), and BU1-LIKE 1 COMPLEX1, to control elongation of lamina joint cells, thereby enhancing leaf inclination [69]. Two RING-finger ubiquitin E3 ligases, SDEL1 and SDEL2, facilitated the degradation of OsSPX4 to modulate PHR2 activity and regulate Pi homeostasis and Pi signaling in response to external Pi availability in rice [70]. These results indicated the functional diversity of SpSPX genes and their importance in plant development, stress response, and other life processes.
In aquatic environments, N and P stresses are the main restrictions on the growth of aquatic plants, thereby affecting their adaptability to environmental changes [55]. In the present study, the transcriptional pattern profiles of three SpSPX genes under low P/N stress were analyzed. The results showed that SpSPX1 was highly expressed by low P/N stresses compared with SpSPX2 and SpSPX3. Moreover, SpSPX1 and SpSPX2 were more sensitive to low P stress than to low N stress, with relatively higher expression levels. Furthermore, SpSPX1 was also highly expressed in all the tissues of S. polyrhiza plants. SpSPX2 and SpSPX3 had a higher expression in roots than in leaves and stipules. This finding suggested that SpSPX1 and SpSPX3 mainly played a key regulatory role in root tissue. Different expression levels of the SPX gene in shoots and roots were also found in rice [18]. OsSPX1 and OsSPX2 had relatively higher expression in shoots, while OsSPX3, OsSPX5, and OsSPX6 were highly expressed in roots [18]. By contrast, the three SpSPX genes did not highly respond to salt stress, suggesting that SpSPX genes may not be involved in salt stress response. This finding was consistent with the above results, in which no salt stress-related cis-elements or interacting proteins were identified. However, our qRT–PCR results revealed that three SpSPX genes are sensitive to ABA treatment, osmotic, and LT stresses. These stresses inhibited the expression of SpSPXs even when Spirodela plants were cultured in P and N deficiency conditions, indicating that the transcriptional regulation of N and P responses by SpSPXs was affected by external environmental factors (ABA, osmotic, and LT stresses). We speculate that these environmental stresses may affect the acquisition of N and P nutrients, therefore inhibiting the response of SpSPXs to low N and P stresses. However, the underlying mechanism is still worthy of in-depth study. These results also confirmed our cis-element analysis results because the relevant cis-elements are found in the promoter regions of three SpSPX genes. The qRT–PCR results of SpSPXs low N and P stresses also verified the transcriptome data. The expression of SpSPX1, SpSPX2, and SpSPX3 was highly induced by low N and P stresses, and their transcripts continually accumulated to very high levels with prolonged treatments. The expression of SpSPXs under P stress was similar to that in Arabidopsis, rice, and soybean [15,18,31]. However, the expression of GmSPXs was still maintained at high levels at 10 d under P stress [31], while SpSPX1 and SpSPX2 was significantly downregulated at 10 d under P/N deficiency. These facts suggested that SpSPXs expression was highly induced by low P/N conditions, thereby playing a key regulatory function in P and N metabolism. Although some key genes related to N metabolism were not identified in the above interaction protein analysis, some previous studies have reported the mechanism underlying the balanced acquisition of N and P regulated by SPX proteins. For example, the NIGT1.1 (SPX–PHR cascade-mediated N status)-responsive regulation of Pi uptake and starvation signals in Arabidopsis [57]. Furthermore, the NRT1.1–SPX4 interaction promoted OsSPX4 ubiquitination and degradation via E3 ubiquitin ligase, which in turn led to the enhancement of Pi acquisition via activation of OsPHR2 [21,71]. In current study, we also analyzed the expression of SpNIGT1.1 under LT stress and P and N deficiency conditions. Results showed that the expression of SpNIGT1.1 was inhibited by these stresses at 1 d, which was opposite to the expression of SpSPXs under N and P deficiency conditions. However, the expression of SpNIGT1.1 continually accumulated to high levels with prolonged treatments under LT and P deficiency conditions. These results indicated that SpNIGT1.1-mediated regulation has generally antagonistic effects on the expression of SpSPXs. Similar results have been reported in Arabidopsis that N-induced expression of NIGT1.1 modified the expression level of SPX genes by severely reduced the activity of SPXs promoters [57]. The WRKY family is one of the largest TF families in plants and plays vital roles in various biotic and abiotic processes [72]. In our previous study [55], we analyzed the expression of 47 SpWRKY genes under abiotic stress including P deficiency stress, cold stress, and submergence stress [55]. We found that the SpWRKY genes rapidly responded to the P deficiency stress while the expression of SpWRKYs involved in cold and submergence stresses changed gradually over time. In current study, we further analyzed the expression of SpSPX75 (named SpSPX10 in [55]. Our results are consistent with Zhao et al., (2021) in that the expression of SpSPX75 was upregulated in response to cold stress at 1 d and downregulated from 1 d to 7 d by P deficiency stress [55]. Furthermore, the expression of SpSPX75 was upregulated from 1 d to 7 d by N deficiency stress, which was similar to the expression patterns of SpSPXs. However, Devaiah et al., (2007) reported that the expression of WRKY75 was strongly induced upon Pi starvation and was rapidly suppressed by Pi resupply. These results indicated that the regulation function of WRKY75 is diverse and WRKY75 responds in a different way to P and N deficiency stresses [56]. Considering the critical role of SPX genes in the regulation of P and N starvation signals, determining their functions in S. polyrhiza is important to provide a foundation for the development of duckweed strains with low P/N tolerance and high P/N enrichment for alleviating environmental problems, such as water eutrophication.

5. Conclusions

SPX genes are important regulators in the P/N signal regulatory network. In this study, comprehensive genome-wide identification and structural and expression analyses of SPX genes in 28 species were performed. A total of 160 SPX genes were characterized and divided into five clades, with high similarity in gene structure and motif composition within the same subfamily. All the SPX genes contained at least two P1BS elements and some elements involved in plant development and biotic/abiotic stress. Three SpSPX genes were further analyzed, revealing that most of the targets of SpSPXs were involved in P metabolism. Expression analysis of SpSPXs suggested that SpSPXs was highly induced by low P/N conditions, thereby playing a key regulatory function in P and N metabolism. Our findings could broaden our understanding of the evolution and biological function of the SPX family and offer a foundation to further investigate the SPX family in plants.

Supplementary Materials

The following supporting information can be downloaded at: https://www.mdpi.com/article/10.3390/cells11071167/s1, Table S1: Sequence Read Archive (SRA) accession numbers in S. polyrhiza. Table S2: The oligonucleotide primers of three SpSPXs, SpWRKY75 and SpNIGT1.1 used for qRT-PCR. Table S3: Physiochemical properties and subcellular localizations of 160 SPX proteins. Table S4: The detailed numbers of SSRs in 160 SPXs. Table S5: List of putative motifs of SPX proteins.

Author Contributions

J.Y.: Conceptualization, Investigation, Writing—original draf. X.Z.: Software. Y.C. (Yan Chen): Software. G.L.: Methodology. X.L.: Data curation. M.X.: Data curation. Z.S.: Methodology. Y.C. (Yimeng Chen): Visualization Y.L.: Visualization. L.Y.: Writing—review & editing. H.H.: Writing—review & editing, Funding acquisition, Supervision, Project administration. All authors have read and agreed to the published version of the manuscript.

Funding

This work was supported by the National Natural Science Foundation of China [Grant number, 32001107, 31870384, 32101254]; Hubei Province Postdoctoral Science Foundation to JY, National Key R & D Program of China [Grant numbers, 2020YFD0900305, 2018YFD0900801, 2017YFE0128800]; International Partnership Program of Chinese Academy of Sciences [152342KYSB20200021], Open project of State Key Laboratory of Freshwater Ecology and Biotechnology [2021FB04].

Institutional Review Board Statement

Not applicable.

Informed Consent Statement

Not applicable.

Data Availability Statement

The datasets used and/or analyzed during the current study are available from the corresponding author on reasonable request.

Acknowledgments

We thank Xin Wang at The Analysis and Testing Center of Institute of Hydrobiology, Chinese Academy of Sciences for experimental support.

Conflicts of Interest

The authors declare no conflict of interest.

References

  1. Heuer, S.; Gaxiola, R.; Schilling, R.; Herrera-Estrella, L.; López-Arredondo, D.; Wissuwa, M.; Delhaize, E.; Rouached, H. Improving phosphorus use efficiency: A complex trait with emerging opportunities. Plant J. 2017, 90, 868–885. [Google Scholar] [CrossRef] [PubMed] [Green Version]
  2. Holford, I.C.R. Soil phosphorus: Its measurement, and its uptake by plants. Aust. J. Soil Res. 1997, 35, 227–240. [Google Scholar] [CrossRef]
  3. Gilbert, N. Environment: The disappearing nutrient. Nature 2009, 461, 716–718. [Google Scholar] [CrossRef] [PubMed]
  4. López-Arredondo, D.L.; Leyva-González, M.A.; González-Morales, S.I.; López-Bucio, J.; Herrera-Estrella, L. Phosphate nutrition: Improving low-phosphate tolerance in crops. Annu. Rev. Plant Biol. 2014, 65, 95–123. [Google Scholar] [CrossRef]
  5. Rubio, V.; Linhares, F.; Solano, R.; Martin, A.C.; Iglesias, J.; Leyva, A.; Paz-Ares, J. A conserved MYB transcription factor involved in phosphate starvation signaling both in vascular plants and in unicellular algae. Genes Dev. 2001, 15, 2122–2133. [Google Scholar] [CrossRef] [PubMed] [Green Version]
  6. Puga, M.I.; Rojas-Triana, M.; De Lorenzo, L.; Leyva, A.; Rubio, V.; Paz-Ares, J. Novel signals in the regulation of Pi starvation responses in plants: Facts and promises. Curr. Opin. Plant Biol. 2017, 39, 40–49. [Google Scholar] [CrossRef]
  7. Gonzalez, E.; Solano, R.; Rubio, V.; Leyva, A.; Paz-Ares, J. Phosphate Transporter Traffic Facilitator1 is a plant-specific SEC12-related protein that enables the endoplasmic reticulum exit of a high-affinity phosphate transporter in Arabidopsis. Plant Cell. 2005, 17, 3500–3512. [Google Scholar] [CrossRef] [Green Version]
  8. Bari, R.; Pant, B.D.; Stitt, M.; Scheible, W. PHO2, microRNA399, and PHR1 define a phosphate-signaling pathway in plants. Plant Physiol. 2006, 141, 988–999. [Google Scholar] [CrossRef] [Green Version]
  9. Lin, W.; Huang, T.; Chiou, T. Nitrogen limitation adaption, a target of microRNA827, mediates degradation of plasma membrane-localized phosphate transporters to maintain phosphate homeostasis in Arabidopsis. Plant Cell. 2013, 25, 4061–4074. [Google Scholar] [CrossRef] [Green Version]
  10. Wu, P.; Shou, H.; Xu, G.; Lian, X. Improvement of phosphorus efficiency in rice on the basis of understanding phosphate signaling and homeostasis. Curr. Opin. Plant Biol. 2013, 16, 205–212. [Google Scholar] [CrossRef] [Green Version]
  11. Dong, J.; Ma, G.; Wei, M.; Satheesh, V.; Zhang, R.; Ge, S.; Li, J.; Zhang, T.; Wittwer, C.; Jessen, H.J.; et al. Inositol Pyrophosphate InsP8 acts as an intracellular phosphate signal in Arabidopsis. Mol. Plant. 2019, 12, 1463–1473. [Google Scholar] [CrossRef] [PubMed]
  12. Secco, D.; Wang, C.; Arpat, B.A.; Wang, Z.; Poirier, Y.; Tyerman, S.D.; Wu, P.; Shou, H.; Whelan, J. The emerging importance of the SPX domain-containing proteins in phosphate homeostasis. New Phytol. 2012, 193, 842–851. [Google Scholar] [CrossRef] [PubMed] [Green Version]
  13. Liu, J.; Yang, L.; Luan, M.; Wang, Y.; Zhang, C.; Zhang, B.; Shi, J.; Zhao, F.G.; Lan, W.; Luan, S. A vacuolar phosphate transporter essential for phosphate homeostasis in Arabidopsis. Proc. Natl. Acad. Sci. USA 2015, 112, E6571–E6578. [Google Scholar] [CrossRef] [Green Version]
  14. Wege, S.; Khan, G.A.; Jung, J.; Vogiatzaki, E.; Pradervand, S.; Aller, I.; Meyer, A.J.; Poirier, Y. The EXS domain of PHO1 participates in the response of shoots to phosphate deficiency via a root-to-shoot signal. Plant Physiol. 2016, 170, 385–400. [Google Scholar] [CrossRef] [PubMed] [Green Version]
  15. Duan, K.; Yi, K.; Dang, L.; Huang, H.; Wu, W.; Wu, P. Characterization of a sub-family of Arabidopsis genes with the SPX domain reveals their diverse functions in plant tolerance to phosphorus starvation. Plant J. 2008, 54, 965–975. [Google Scholar] [CrossRef]
  16. Puga, M.I.; Mateos, I.; Charukesi, R.; Wang, Z.; Franco-Zorrilla, J.M.; De Lorenzo, L.; Irigoyen, M.L.; Masiero, S.; Bustos, R.; Rodríguez, J.; et al. SPX1 is a phosphate-dependent inhibitor of Phosphate Starvation Response 1 in Arabidopsis. Proc. Natl. Acad. Sci. USA 2014, 111, 14947–14952. [Google Scholar] [CrossRef] [Green Version]
  17. Wang, Z.; Ruan, W.; Shi, J.; Zhang, L.; Xiang, D.; Yang, C.; Li, C.; Wu, Z.; Liu, Y.; Shou, H.; et al. Rice SPX1 and SPX2 inhibit phosphate starvation responses through interacting with PHR2 in a phosphate-dependent manner. Proc. Natl. Acad. Sci. USA 2014, 111, 14953–14958. [Google Scholar] [CrossRef] [Green Version]
  18. Zhong, Y.; Wang, Y.; Guo, J.; Zhu, X.; Shi, J.; He, Q.; Liu, Y.; Wu, Y.; Zhang, L.; Lv, Q.; et al. Rice SPX6 negatively regulates the phosphate starvation response through suppression of the transcription factor PHR2. New Phytol. 2018, 219, 135–148. [Google Scholar] [CrossRef] [Green Version]
  19. Shi, J.; Hu, H.; Zhang, K.; Zhang, W.; Yu, Y.; Wu, Z.; Wu, P. The paralogous SPX3 and SPX5 genes redundantly modulate Pi homeostasis in rice. J. Exp. Bot. 2014, 65, 859–870. [Google Scholar] [CrossRef] [Green Version]
  20. Lv, Q.; Zhong, Y.; Wang, Y.; Wang, Z.; Zhang, L.; Shi, J.; Wu, Z.; Liu, Y.; Mao, C.; Yi, K.; et al. SPX4 negatively regulates phosphate signaling and homeostasis through its interaction with PHR2 in rice. Plant Cell. 2014, 26, 1586–1597. [Google Scholar] [CrossRef] [Green Version]
  21. Hu, B.; Jiang, Z.; Wang, W.; Qiu, Y.; Zhang, Z.; Liu, Y.; Li, A.; Gao, X.; Liu, L.; Qian, Y.; et al. Nitrate-NRT1.1B-SPX4 cascade integrates nitrogen and phosphorus signalling networks in plants. Nat. Plants 2019, 5, 401–413. [Google Scholar] [CrossRef] [PubMed]
  22. Bog, M.; Sree, K.S.; Fuchs, J.; Hoang, P.T.N.; Schubert, I.; Kuever, J.; Rabenstein, A.; Paolacci, S.; Jansen, M.A.K.; Appenroth, K.J. A taxonomic revision of Lemna sect. Uninerves (Lemnaceae). Taxon 2020, 69, 56–66. [Google Scholar] [CrossRef] [Green Version]
  23. Acosta, K.; Appenroth, K.J.; Borisjuk, L.; Edelman, M.; Heinig, U.; Jansen, M.A.K.; Oyama, T.; Pasaribu, B.; Schubert, I.; Sorrels, S.; et al. Return of the Lemnaceae: Duckweed as a model plant system in the genomics and postgenomics era. Plant Cell. 2021, 33, 3207–3234. [Google Scholar] [CrossRef] [PubMed]
  24. An, D.; Zhou, Y.; Li, C.; Xiao, Q.; Wang, T.; Zhang, Y.; Wu, Y.; Li, Y.; Chao, D.; Messing, J.; et al. Plant evolution and environmental adaptation unveiled by long-read whole-genome sequencing of Spirodela. Proc. Natl. Acad. Sci. USA 2019, 116, 18893–18899. [Google Scholar] [CrossRef] [Green Version]
  25. Yang, J.J.; Li, G.J.; Bishopp, A.; Heenatigala, P.P.M.; Hu, S.; Chen, Y.; Wu, Z.; Kumar, S.; Duan, P.; Yao, L.; et al. A Comparison of growth on mercuric chloride for three Lemnaceae species reveals differences in growth dynamics that effect their suitability for use in either monitoring or remediating ecosystems contaminated with mercury. Front Chem. 2018, 6, 112. [Google Scholar] [CrossRef] [PubMed]
  26. Cui, W.; Cheng, J.J.; Appenroth, K. Growing duckweed for biofuel production: A review. Plant Biol. 2015, 1, 16–23. [Google Scholar] [CrossRef]
  27. Zhang, Z.; Xin, J.; Cai, S.; Xiao, Q. Study on growth of duckweed and its removal efficiency of phosphorus under different P-concentrations. Acta Agric. Jiangxi 2011, 23, 160–162. [Google Scholar]
  28. Toyama, T.; Hanaoka, T.; Tanaka, Y.; Morikawa, M.; Mori, K. Comprehensive evaluation of nitrogen removal rate and biomass, ethanol, and methane production yields by combination of four major duckweeds and three types of wastewater effluent. Bioresour. Technol. 2018, 250, 464–473. [Google Scholar] [CrossRef]
  29. Wang, C.; Ying, S.; Huang, H.; Li, K.; Wu, P.; Shou, H. Involvement of OsSPX1 in phosphate homeostasis in rice. Plant J. 2009, 57, 895–904. [Google Scholar] [CrossRef]
  30. Wang, Z.; Hu, H.; Huang, H.; Duan, K.; Wu, Z.; Wu, P. Regulation of OsSPX1 and OsSPX3 on expression of OsSPX domain genes and Pi-starvation signaling in rice. J. Integr. Plant Biol. 2009, 51, 663–674. [Google Scholar] [CrossRef]
  31. Zhang, J.; Zhou, X.; Xu, Y.; Yao, M.; Xie, F.; Gai, J.; Li, Y. Soybean SPX1 is an important component of the response to phosphate deficiency for phosphorus homeostasis. Plant Sci. 2016, 248, 82–91. [Google Scholar] [CrossRef] [PubMed]
  32. Du, H.; Yang, C.; Din, G.; Shi, L.; Xu, F. Genome-wide identification and characterization of SPX domain-containing members and their responses to phosphate deficiency in Brassica napus. Front Plant Sci. 2017, 8, 35. [Google Scholar] [CrossRef] [PubMed] [Green Version]
  33. Kumar, A.; Sharma, M.; Gahlaut, V.; Nagaraju, M.; Ghaudhary, S.; Kumar, A.; Tyagi, P.; Gajula, M.N.V.P.; Singh, K.P. Genome-wide identification, characterization, and expression profiling of SPX gene family in wheat. Int. J. Biol. Macromol. 2019, 140, 17–32. [Google Scholar] [CrossRef] [PubMed]
  34. Liu, N.; Shang, W.; Li, C.; Jia, L.; Wang, X.; Xing, G.; Zheng, W. Evolution of the SPX gene family in plants and its role in the response mechanism to phosphorus stress. Open Biol. 2018, 8, 170231. [Google Scholar] [CrossRef] [Green Version]
  35. Wheeler, T.J.; Eddy, S.R. Nhmmer: DNA homology search with profile HMMs. Bioinformatics 2013, 29, 2487–2489. [Google Scholar] [CrossRef] [Green Version]
  36. Gasteiger, E.; Gattiker, A.; Hoogland, C.; Ivanyi, I.; Appel, R.D.; Bairoch, A. ExPASy: The proteomics server for in-depth protein knowledge and analysis. Nucleic Acids Res. 2003, 31, 3784–3788. [Google Scholar] [CrossRef] [Green Version]
  37. Krogh, A.; Larsson, B.; von Heijne, G.; Sonnhammer, E.L.L. Predicting transmembrane protein topology with a hidden Markov model: Application to complete genomes. J. Mol. Biol. 2001, 305, 567–580. [Google Scholar] [CrossRef] [Green Version]
  38. Wu, Z.C.; Xiao, X.; Chou, K.C. iLoc-Plant: A multi-label classifier for predicting the subcellular localization of plant proteins with both single and multiple sites. Mol. Biosyst. 2011, 7, 3287–3297. [Google Scholar] [CrossRef]
  39. Horton, P.; Park, K.J.; Obayashi, T.; Fujita, N.; Harada, H.; Adams-Collier, C.J.; Nakai, K. WoLF PSORT: Protein localization predictor. Nucleic Acids Res. 2007, 35, W585–W587. [Google Scholar] [CrossRef] [Green Version]
  40. Savojardo, C.; Martelli, P.L.; Fariselli, P.; Profiti, G.; Casadio, R. BUSCA: An integrative web server to predict subcellular localization of proteins. Nucleic Acids Res. 2018, 46, W459–W466. [Google Scholar] [CrossRef]
  41. Beier, S.; Thiel, T.; Münch, T.; Scholz, U.; Mascher, M. MISA-web: A web server for microsatellite prediction. Bioinformatics 2017, 33, 2583–2585. [Google Scholar] [CrossRef] [PubMed] [Green Version]
  42. Li, K.B. ClustalW-MPI: ClustalW analysis using distributed and parallel computing. Bioinformatics 2003, 19, 1585–1586. [Google Scholar] [CrossRef] [PubMed] [Green Version]
  43. Kumar, S.; Stecher, G.; Li, M.; Knyaz, C.; Tamura, K. MEGA X: Molecular evolutionary genetics analysis across computing platforms. Mol. Biol. Evol. 2018, 35, 1547–1549. [Google Scholar] [CrossRef]
  44. Letunic, I.; Bork, P. Interactive tree of life (iTOL) v4: Recent updates and new developments. Nucleic Acids Res. 2019, 47, W256–W259. [Google Scholar] [CrossRef] [PubMed] [Green Version]
  45. Hu, B.; Jin, J.P.; Guo, A.Y.; Zhang, H.; Luo, J.C.; Gao, G. GSDS 2.0: An upgraded gene feature visualization server. Bioinformatics 2015, 31, 1296–1297. [Google Scholar] [CrossRef] [Green Version]
  46. Bailey, T.L.; Boden, M.; Buske, F.A.; Frith, M.; Grant, C.E.; Clementi, L.; Ren, J.; Li, W.W.; Noble, W.S. MEME SUITE: Tools for motif discovery and searching. Nucleic Acids Res. 2009, 37, W202–W208. [Google Scholar] [CrossRef]
  47. Chen, C.; Chen, H.; Zhang, Y.; Thomas, H.R.; Frank, M.H.; He, Y.; Xia, R. TBtools: An Integrative Toolkit Developed for Interactive Analyses of Big Biological Data. Mol Plant. 2020, 13, 1194–1202. [Google Scholar] [CrossRef]
  48. Wang, Y.; Tang, H.; DeBarry, J.D.; Tan, X.; Li, J.; Wang, X.; Lee, T.; Jin, H.; Marler, B.; Guo, H.; et al. MCScanX: A toolkit for detection and evolutionary analysis of gene synteny and collinearity. Nucleic Acids Res. 2012, 40, e49. [Google Scholar] [CrossRef] [Green Version]
  49. Wang, Y.; Li, J.; Paterson, A.H. MCScanX-transposed: Detecting transposed gene duplications based on multiple colinearity scans. Bioinformatics 2013, 29, 1458–1460. [Google Scholar] [CrossRef] [Green Version]
  50. Chen, Y.; Zhao, X.; Li, G.; Kumar, S.; Sun, Z.; Li, Y.; Guo, W.; Yang, J.; Hou, H. Genome-wide identification of the Nramp gene family in Spirodela polyrhiza and expression analysis under cadmium stress. Int. J. Mol. Sci. 2021, 22, 6414. [Google Scholar] [CrossRef]
  51. Szklarczyk, D.; Santos, A.; Mering, V.C.; Jensen, L.J.; Bork, P.; Kuhn, M. STITCH 5: Augmenting protein-chemical interaction networks with tissue and affinity data. Nucleic Acids Res. 2016, 44, D380–D384. [Google Scholar] [CrossRef] [PubMed]
  52. Baek, M.; DiMaio, F.; Anishchenko, I.; Dauparas, J.; Ovchinnikov, S.; Lee, G.R.; Wang, J.; Cong, Q.; Kinch, K.; Dustin Schaeffer, R.; et al. Accurate prediction of protein structures and interactions using a three-track neural network. Science 2021, 373, 871–876. [Google Scholar] [CrossRef] [PubMed]
  53. Du, Z.; Su, H.; Wang, W.; Ye, L.; Wei, H.; Peng, Z.; Anishchenko, I.; Baker, D.; Yang, J. The trRosetta server for fast and accurate protein structure prediction. Nat. Protoc. 2021, 16, 5634–5651. [Google Scholar] [CrossRef]
  54. Jumper, J.; Evans, R.; Pritzel, A.; Green, T.; Figurnov, M.; Ronneberger, O.; Tunyasuvunakool, K.; Bates, R.; Zidek, A.; Potapenko, A.; et al. Highly accurate protein structure prediction with AlphaFold. Nature 2021, 596, 583–589. [Google Scholar] [CrossRef]
  55. Zhao, X.Y.; Yang, J.J.; Li, G.J.; Sun, Z.L.; Hu, S.Q.; Chen, Y.; Guo, W.J.; Hou, H.W. Genome-wide identification and comparative analysis of the WRKY gene family in aquatic plants and their response to abiotic stresses in giant duckweed (Spirodela polyrhiza). Genomics 2021, 113, 1761–1777. [Google Scholar] [CrossRef] [PubMed]
  56. Devaiah, B.N.; Karthikeyan, A.S.; Raghothama, K.G. WRKY75 transcription factor is a modulator of phosphate acquisition and root development in Arabidopsis. Plant Physiol. 2007, 143, 1789–1801. [Google Scholar] [CrossRef] [PubMed] [Green Version]
  57. Ueda, Y.; Kiba, T.; Yanagisawa, S. Nitrate-inducible NIGT1 proteins modulate phosphate uptake and starvation signaling via transcriptional regulation of SPX genes. Plant J. 2020, 102, 448–466. [Google Scholar] [CrossRef]
  58. Pfaffl, M.W. A new mathematical model for relative quantification in real-time RT-PCR. Nucleic Acids Res. 2001, 29, e45. [Google Scholar] [CrossRef]
  59. Li, F.; Fan, K.; Ma, F.; Yue, E.; Bibi, N.; Wang, M.; Shen, H.; Hasan, M.M.; Wang, X. Genomic identification and comparative expansion analysis of the non-specific lipid transfer protein gene family in Gossypium. Sci. Rep. 2016, 6, 38948. [Google Scholar] [CrossRef]
  60. Bustos, R.; Castrillo, G.; Linhares, F.; Puga, M.I.; Rubio, V.; PérezPérez, J.; Solano, R.; Leyva, A.; Paz-Ares, J. A central regulatory system largely controls transcriptional activation and repression responses to phosphate starvation in Arabidopsis. PLoS Genet. 2010, 6, e1001102. [Google Scholar] [CrossRef] [Green Version]
  61. Yang, J.; Zhang, S.; Li, H.; Wang, L.; Liu, Y.; Niu, L.; Yang, Q.; Meng, D.; Fu, Y. Genome-wide analysis and characterization of R2R3-MYB family in pigeon pea (Cajanus cajan) and their functional identification in phenylpropanoids biosynthesis. Planta 2021, 254, 64. [Google Scholar] [CrossRef] [PubMed]
  62. International Wheat Genome Sequencing Consortium (IWGSC). A chromosome-based draft sequence of the hexaploid bread wheat (Triticum aestivum) genome. Science 2014, 345, 1251788. [Google Scholar] [CrossRef] [PubMed]
  63. O’Hare, M.T.; Baattrup-Pedersen, A.; Baumgarte, I.; Freeman, A.; Gunn, I.D.M.; Lazar, A.N.; Sinclair, R.; Wade, A.J.; Bowers, M.J. Responses of aquatic plants to eutrophication in rivers: A revised conceptual model. Front. Plant Sci. 2018, 9, 451. [Google Scholar] [CrossRef] [PubMed]
  64. Cheng, Z.; Zhang, X.; Yao, W.; Zhao, K.; Lin, L.; Gao, F.; Zhou, B.; Jiang, T. Genome-wide search and structural and functional analyses for late embryogenesis-abundant (LEA) gene family in poplar. BMC Plant Biol. 2021, 21, 110. [Google Scholar] [CrossRef] [PubMed]
  65. Biłas, R.; Szafran, K.; Hnatuszko-Konka, K.; Kononowicz, A.K. Cis-regulatory elements used to control gene expression in plants. Plant Cell Tiss. Org. 2016, 127, 269–287. [Google Scholar] [CrossRef] [Green Version]
  66. Li, Y.; Wu, H.; Fan, H.; Zhao, T.; Ling, H.Q. Characterization of the AtSPX3 promoter elucidates its complex regulation in response to phosphorus deficiency. Plant Cell Physiol. 2016, 57, 1767–1778. [Google Scholar] [CrossRef] [Green Version]
  67. Osorio, M.B.; Ng, S.; Berkowitz, O.; De Clercq, I.; Mao, C.; Shou, H.; Whelan, J.; Jost, R. SPX4 acts on PHR1-dependent and -independent regulation of shoot phosphorus status in Arabidopsis. Plant Physiol. 2019, 181, 332–352. [Google Scholar] [CrossRef] [Green Version]
  68. Yan, H.; Sheng, M.; Wang, C.; Liu, Y.; Yang, J.; Liu, F.; Xu, W.; Su, Z. AtSPX1-mediated transcriptional regulation during leaf senescence in Arabidopsis thaliana. Plant Sci. 2019, 283, 238–246. [Google Scholar] [CrossRef]
  69. Ruan, W.; Guo, M.; Xu, L.; Wang, X.; Zhao, H.; Wang, K.Y. An SPX-RLI1 module regulates leaf inclination in response to phosphate availability in rice. Plant Cell 2018, 30, 853–870. [Google Scholar] [CrossRef] [Green Version]
  70. Ruan, W.; Guo, M.; Wang, X.; Guo, Z.; Xu, Z.; Xu, L.; Zhao, H.; Sun, H.; Yan, C.; Keke, Y. Two RING-finger ubiquitin E3 ligases regulate the degradation of SPX4, an internal phosphate sensor, for phosphate homeostasis and signaling in rice. Mol. Plant 2019, 12, 1060–1074. [Google Scholar] [CrossRef]
  71. Poirier, Y. Post-translational regulation of SPX Proteins for coordinated nutrient signaling. Mol. Plant 2019, 12, 1041–1043. [Google Scholar] [CrossRef] [PubMed]
  72. Eulgem, T.; Rushton, P.J.; Robatzek, S.; Somssich, I.E. The WRKY superfamily of plant transcription factors. Trends Plant Sci. 2000, 5, 199–206. [Google Scholar] [CrossRef]
Figure 1. Phylogenetic analysis of 160 SPX genes in 28 species, including yeast, algae, moss, fern, monocot, and dicot plants. Maximum likelihood tree was generated by MEGA 7.0 with 1000 bootstrap replications on the basis of LG model. The 160 SPX genes were divided into five groups and labeled by different colors.
Cells 11 01167 g001
Figure 2. Cis-elements and conserved domain motifs in 160 SPX genes.
Cells 11 01167 g002
Figure 3. Frequency of main cis-elements in the 2 kb promoter region of 160 SPX genes.
Cells 11 01167 g003
Figure 4. Distribution and synteny relationship of SpSPX genes on the chromosomes of S. polyrhiza. The chromosomes were indicated by orange color. SpSPX1 (Spo006549) and SpSPX3 (Spo009252) were located at chromosome 08 (chr08), and SpSPX2 (Spo007656) was located at chromosome 10 (chr10). Scale bar indicated chromosome length (Mb).
Cells 11 01167 g004
Figure 5. Synteny relationship of SPX genes pairs between S. polyrhiza and other seven plant species. Red represents syntenic SPX genes, and gray lines show the collinear blocks of the plant genome. The chromosome number was labeled at the top of each chromosome.
Cells 11 01167 g005
Figure 6. Predicted interaction network of SpSPX genes and their targets according to Arabidopsis. The interacted genes were connected by different lines.
Cells 11 01167 g006
Figure 7. (AC) The predicted 3D structure of three SpSPX proteins by trRobetta server, (A)-SpSPX1 protein, (B)-SpSPX2 protein, and (C)-SpSPX3 protein.
Cells 11 01167 g007
Figure 8. Expression profiles of SpSPX genes under abiotic stress conditions (P/N stress, and salt stress) and in different tissues (leaf, root, and stipules).
Cells 11 01167 g008
Figure 9. Quantitative RT-PCR analysis of three SpSPX genes under 1 μM P/N and P/N deficiency conditions from 1 day to 10 day. Different letters indicate significant differences between treatments at the p < 0.05 level (Duncan test). Error bars indicate standard deviation.
Cells 11 01167 g009
Figure 10. Quantitative RT-PCR analysis of three SpSPX genes under ABA treatment (A), osmotic stress (B), and LT stress (C) in 1/2 MS medium and 1/2 MS medium with P/N deficiency (-P, -N) at 0 [CK], 1, 3, 5, 7 d. Quantitative RT-PCR analysis of SpWRKY75 and SpNIGT1.1 under LT stress (10 °C) and low P/N stresses at 0 [CK], 1, 3, 5, 7 d (D). Different letters indicate significant difference between treatments at the p < 0.05 level (Duncan test). Error bars indicate standard deviation.
Cells 11 01167 g010
Table 1. Number and type of SPX genes in 28 species.
SpeciesType of OrganismGroup AGroup BGroup CGroup DGroup ETotal
C. reinhardtiiYeast 1 1
S. cerevisiaeAlgae 369
P. patensMoss 7 7
A.filiculoidesFern 21 14
S. cucullataFern 21 14
S. moellendorffiiFern 4 2 6
B. distachyonMonocot 235
N. nuciferaMonocot 134
O. sativaMonocot 246
S. italicMonocot 235
S. polyrhizaMonocot 123
T. aestivumMonocot 31215
W. australianaMonocot 112
Z. maysMonocot 246
Z. marinaMonocot 123
A. thalianaDicot 224
A. trichopodaDicot 123
B. napusDicot 5611
C. papayaDicot 1225
C. clementineDicot 1225
E. grandisDicot 325
G. maxDicot 729
G. hirsutumDicot 16512
I. trilobaDicot 3 3
P. trichocarpaDicot 1427
P. persicaDicot 224
R. communisDicot 2226
S. lycopersicumDicot1 236
Total 11686174160
0.625%10%5%38.125%46.25%
Table 2. The distribution of SSRs types in 160 SPX genes.
SSR Motif LengthNumberPercentage/%
1252335.95
2123717.63
36108.69
4163223.25
56028.58
63094.40
7660.94
8230.33
9110.16
1050.07
Table 3. Identified colinear gene pairs between S. polyrhiza and other seven plant species.
SpeciesSpeciesColinear Gene Pairs
A. thalianaS. polyrhiza-
S. polyrhizaB. distachyonSpSPX1, BdSPX3, BdSPX5
S. polyrhizaS. lycopersicumSpSPX1, SlSPX5, SlSPX6
S. polyrhizaG. maxSpSPX1, GmSPX3, GmSPX7, GmSPX8
S. polyrhizaS. italicSpSPX1, SiSPX5, SiSPX4
S. polyrhizaP. trichocarpaSpSPX1, PtSPX3, PtSPX4, PtSPX6, PtSPX7
S. polyrhizaO. sativaSpSPX1, OsSPX2, OsSPX1
S. polyrhizaZ. maysSpSPX1, ZmaySPX5
Publisher’s Note: MDPI stays neutral with regard to jurisdictional claims in published maps and institutional affiliations.