1. Introduction
Obesity, a growing concern worldwide, is a complex health disease affected by various environmental factors such as heredity factors, lifestyle, and dietary habits. Studies are being actively conducted to identify obesity-related environmental factors [
1,
2]. Following the Human Genome Project, genome-wide association studies (GWASs) are being performed to investigate genes related to obesity mechanisms using new technologies [
3,
4].
Our pilot GWAS reported that two genes, mitogen-activated protein kinase, kinase 6 (
MAP2K6) and DnaJ Heat shock Protein Family Member C6 (
DNAJC6), were distinguishingly related to both the resting metabolic rate (RMR) and body mass index (BMI) as biomarkers of obesity in children. The results of a human study on
MAP2K6 gene variation and the roles of
MAP2K6 overexpression in cell and animal studies were published [
5,
6,
7].
DNAJC6 encodes auxilin, a neuronal protein that functions specifically in the pathway of clathrin-mediated endocytosis [
8].
DNAJC6 belongs to the evolutionarily conserved
DNAJ/HSP40 family of proteins, which regulate molecular chaperone activity by stimulating ATPase activity [
9]. The
DNAJC6 gene is present in organisms and cells and is stimulated by various environmental stresses such as heat, cold, and ultraviolet rays. Several studies reported that
DNAJC6 mutation might be related to the risk factors for the early onset of degenerative diseases, such as Parkinson’s disease and Alzheimer’s disease [
10,
11,
12]. However, few studies have shown an association between
DNAJC6 mutation and obesity. Vauthier et al. found that 7-year-old children with a homozygous 80 kb deletion in the chromosomal 1p31.3 region exhibited early-onset obesity, mental retardation, and epilepsy [
13]. In an animal study,
Dnajc6-null mice had a high rate of early postnatal mortality, although surviving pups had a normal life span despite a decrease in body weight [
14]. However, there has been no mechanistic study indicating that
DNAJC6 deficiency or mutation leads to obesity thus far. Although we found that
DNAJC6 is a gene related to RMR, it is necessary to have mechanistic research or systematic reviews on lipid synthesis and degradation for energy metabolism, inflammation, insulin signaling, etc.
The purpose of this study was to investigate new obesity mechanisms related to energy metabolism such as lipid metabolism (adipogenesis and lipolysis), adipokine expression, insulin signaling, and mitochondrial function, using DNAJC6-overexpressed 3T3-L1 preadipocytes. This study is the first report to show the effects of the RMR-related DNAJC6 gene on obesogenic environments, and it will provide the basic data for obesity research on customized prevention and treatment.
2. Materials and Methods
2.1. Cell Culture
3T3-L1 preadipocytes were purchased from the American Type Culture Collection (ATCC, Manassas, VA, USA) and cultured in Dulbecco’s Modified Eagle Medium (DMEM, Welgene, Gyeongsan, Korea) containing 1% penicillin/streptomycin (P/S, Welgene) and 10% Bovine Calf Serum (BCS, Thermo Fisher, Waltham, MA, USA) under 5% CO₂ at 37 °C. To induce differentiation (Day 0), 1 μM dexamethasone, 10 μg/mL insulin, and 0.5 mM 3-isobutyl-1-methylxanthine (MDI, Cat #D1756, #I9278, #I7018, Sigma-Aldrich, St. Louis, MO, USA) were added to the culture medium of high-glucose DMEM containing 1% P/S and 10% Fetal Bovine Serum (FBS, Capricorn Scientific GmbH, Ebsdorfergrund, Germany). After two days of differentiation (Day 2), the cells were cultured in 10% FBS high-glucose DMEM containing 10 μg/mL insulin. After four days of differentiation (Day 4), the 10% FBS high-glucose DMEM was changed every 48 h. The cells were harvested after eight days of differentiation (Day 8), and DNAJC6-overexpressed cells (TgHsp) and 3T3-L1 cells (control group) were compared. An MTT assay (Duchefa, Haarlem, The Netherlands) was conducted to evaluate cell viability. Absorbance was measured at 570–630 nm using a microplate reader.
2.2. DNAJC6 Transfection
3T3-L1 preadipocytes were transfected with DNAJC6 using a chemical method (L3000015, Thermo Fisher, Waltham, MA, USA). To increase the transfection efficiency, serum-free DMEM was used. A DNA master mix was prepared by mixing Opti-MEM, 2500 ng DNAJC6 DNA (OriGene, Rockville, MD, USA), P3000 reagent, and lipofectamine 3000 reagent. After reacting at room temperature for 15 min, the DNA master mix was dispensed into cells and cultured for 3–4 h. To remove untransfected cells during the transfection process, cells was cultured in DMEM containing 500 μg/mL of G418 (Cat #10131035, Thermo Fisher, Waltham, MA, USA) for 20 h under the same conditions described above. Thereafter, TgHsp cells were cultured using the same process and conditions of differentiation as those of the control group (Days 0–8).
2.3. RT-PCR to Confirm Transfection
TRIzol reagent (Cat #15596018, Thermo Fisher, Waltham, MA, USA) was used to collect cells, and an RNA pellet was centrifuged. The pellet was completely dissolved in RNase-free water and quantified using a Nano-Drop spectrophotometer. RNA (1 μg), dNTPs (Cat #4030, Takara Bio, Shiga, Japan), and a random primer (Invitrogen, San Diego, CA, USA) were mixed and heated at 65 °C for 5 min. A master mix was prepared with Superscript III Reverse Transcriptase, 5× First Strand buffer, and 0.1 M DTT (Cat #18080093, Invitrogen, Carlsbad, CA, USA), and the RNA mix and master mix were combined to prepare cDNA. PCR PreMix (Cat #K2036, Bioneer, Daejeon, Korea) was mixed with 19 µL of primer (Zenotech, Daejeon, Korea) and 1 µL of cDNA. The DNAJC6 primer (forward: GTG TAC GGT GGG AGG TCT AT; reverse: CCG CCT TTC ACC ATG TCA AA) was heated at 94 °C for 4 min, followed by 30 cycles of 30 s at 94 °C, 30 s at 61 °C, and 40 s at 72 °C. A total of 20 µL of the prepared sample was loaded on an agarose gel and electrophoresed at 100 V for 30 min. The gel was analyzed using a Chemi Doc Imaging System (Bio-Rad Laboratories, Hercules, CA, USA).
2.4. Cell Staining
The accumulation of lipid droplets was evaluated using Oil red O (ORO). On Days 0 and 8 of differentiation, the medium and PBS were removed. The cells were fixed with 1 mL of 4% paraformaldehyde for 1 h at room temperature. The cells were stained with 1 mL of ORO solution for 1 h and then washed with PBS. The lipid droplets were observed using an optical microscope and extracted with lipid droplets assay dye extraction solution (Cat #10008984, Cayman Chemical Company, Ann Arbor, MI, USA). Absorbance was measured at 492 nm. The cells were stained with DAPI/BODIPY to confirm nuclear damage and adipogenesis following transfection. The cells were fixed with 1 mL of 4% paraformaldehyde and washed with PBS. For the staining of lipid droplets and nuclear damage, the cells were stained with BODIPY and DAPI for 30 min. After staining the cell nucleus, a wet mount was made with fluorescent mounting medium (DAKO, Glostrup, Denmark), and the fat contents and nuclei of cells were observed using a confocal laser microscope (Carl Zeiss, Oberkochen, Germany).
2.5. Adipogenesis and Lipolysis Evaluation
Adipogenesis in adipocytes of 3T3-L1 and TgHsp cells was confirmed by ORO staining, and the expression of adipogenesis-related genes was measured by Western blotting analysis. Free glycerol in the medium was measured to confirm the breakdown of accumulated fat. Samples were collected on Days 0 and 8 of differentiation and stored at 37 °C for use on the same day. A total of 240 µL of free glycerol reagent (Cat #F6428, Sigma-Aldrich, St. Louis, MO, USA) was pipetted into a 1.5 mL amber tube, and 30 µL each of standard, distilled water, and sample was added. The tube was inverted immediately and incubated at 37 °C for 5 min. A total of 100 µL of each sample was added to a 96-well plate and measured at 540 nm. The measured value of the sample was divided by the measured value of the standard solution and multiplied by 0.26 mg/mL to calculate the amount of free glycerol.
2.6. Preparation of Protein Extracts and Western Blot Analysis
The protein of cells was extracted using RIPA buffer (EBA-1149, Elpis Biotech, Daejeon, Korea) containing protease and phosphatase inhibitors. Protein samples were quantified through the Bradford assay. The samples were then separated by electrophoresis using 8–12% SDS and transferred to a PVDF membrane (Cat #10600021, GE Healthcare, Chicago, IL, USA). The protein samples were blocked with 3% bovine serum albumin (BSA, Cat #BSA100, Bovogen, Melbourne, Australia) and incubated at 4 °C for 16 h with the following primary antibodies: β-actin (E12-041, Enogene, Jiangsu, China), Peroxisome proliferator-activated receptor gamma (PPARγ, Cat #SC-7273, Santa Cruz, Dallas, TX, USA), CCAAT/enhancer-binding protein alpha (C/EBPα, Cat #SC-9314, Santa Cruz), Adipocyte Fatty acid-Binding Protein (aP2, Cat #SC-271529, Santa Cruz, Dallas, TX, USA), phospho-Hormone-sensitive Lipase (pHSL, Cat #4139S, CST, Beverly, MA, USA), HSL (Cat #4170S, CST, Beverly, MA, USA), insulin receptor-β (Cat #3025, CST, Beverly, MA, USA), Insulin receptor substrate (IRS-1, Cat #2382S, CST, Beverly, MA, USA), p-IRS-1 (Cat #2381S, CST, Beverly, MA, USA), Protein Kinase B (AKT, Cat #9272, CST, Beverly, MA, USA), p-AKT (Cat #9275, CST, Beverly, MA, USA), Glucose transporter type 4 (GLUT4, Cat #2213, CST, Beverly, MA, USA), leptin (Cat #675002, Bio Legend, San Diego, CA, USA), leptin receptor (LEPR, Cat #ab5593, Abcam, Cambridge, UK), adiponectin (Cat #2789S, CST, Beverly, MA, USA), Uncoupling Protein1 (UCP1, Cat #14670S, CST, Beverly, MA, USA), and Microtubule-associated protein 1A/1B-light chain 3 (LC3-I/LC3-II, Cat #12741S, CST, Beverly, MA, USA). Subsequently, secondary antibodies were incubated at room temperature. Analysis was conducted using a ChemiDoc imaging system and Image Lab software (Bio-Rad Laboratories, Hercules, CA, USA).
2.7. Oxygen Consumption Test (Mitochondrial Function Test)
A Seahorse XF Cell Mito Stress Test Kit (Cat #Kit103015-100, Agilent Technologies, CA, USA) was used to analyze mitochondrial activity and oxygen consumption. 3T3-L1 and TgHsp cells in an XF Cell Culture Microplate were cultured under the same conditions and procedures as those for adipocyte differentiation. The calibrant solution was preheated for hydration 24 h before evaluating mito stress. Mitochondrial respiration was measured on Day 8 using a seahorse XFe24 analyzer (Agilent Technologies, San Jose, CA, USA). Oligomycin, carbonyl cyanide-p-trifluoromethoxyphenylhydrazone (FCCP), and rotenone/antimycin A (Rot/AA), which were injected into the mitochondria, were dissolved in XF media and injected into the drug port. After calibrating the calibrator of the Cell Mito Stress measuring instrument, oxygen consumption was measured by placing the drop port and microplate with cultured cells. Oligomycin, FCCP, and Rot/AA were injected, and each section was measured for 5 min. Mitochondrial function was calculated for each section. After measurement, cellular proteins were extracted, quantified, and normalized.
2.8. Statistical Analysis
Collected data were analyzed using Statistical Package for the Social Sciences software version 25.0 (SPSS Inc., Chicago, IL, USA). Student’s t-test or one-way analysis of variance (ANOVA) with Duncan’s multiple range test was performed to analyze significant differences between groups. The results were expressed as means ± standard deviations (SD). A value of p < 0.05 was considered statistically significant for differences between the means, which were described as a, b, c, and d, which indicate significant differences between the groups. Graphs were plotted using GraphPad Prism (version 8.0.1, GraphPad Software, La Jolla, CA, USA).
4. Discussion
Heat shock proteins are present in all organisms and cells and are induced by various environmental stresses [
15]. Among them,
DNAJC6 is a major risk factor for the early onset of Alzheimer’s and Parkinson’s diseases. From a previous GWAS, we found that two genes,
MAP2K6 (MEK6) and
DNAJC6, were related to childhood obesity due to energy metabolism imbalance, particularly RMR. Based on human studies, energy metabolism and inflammatory mechanisms related to body fat accumulation were investigated in cells and animals transfected with those genes.
MEK6 gene overexpression significantly induced fat accumulation with consistent results of increasing adipogenesis and decreasing adipolysis both in vitro and in vivo [
6,
7]. In previous studies, the mechanism of obesity induction mediated by
DNAJC6 was not established [
16,
17]. However, we found that the overexpression of
DNAJC6 in 3T3-L1 cells positively suppressed adipogenesis-related gene expression as well as inhibiting insulin signals and adipokine expression.
Compared to after the differentiation of 3T3-L1 cells, lipid formation was suppressed in the
DNAJC6-overexpressed cells, and no morphological changes in the cells were observed. Adipogenesis is induced by the transcription of C/EBPβ, C/EBPδ, and PPARγ, and adipokine genes are expressed in the late stage of adipogenesis [
18,
19]. Pro-inflammatory adipokines, such as TNF-α and IL-6, promote inflammatory M1 adipocytes, but anti-inflammatory adipokines, such as adiponectin, induce anti-inflammatory M2 adipocytes. The interactions between these pro- and anti-inflammatory adipocytes may change lipid metabolism and insulin/leptin resistance in adipose tissues [
20]. For the adipogenesis process in adipocytes, glucose influx is required through the GLUT4 transporter on the membranes with the activation of insulin cascade signals, IRS-1
ser307-AKT
thr308-GLUT4. [
21,
22]. Insulin/IGF-1 and TNF-α stimulated the phosphorylation of IRS-1 at Ser
307 in 3T3-L1 preadipocytes and adipocytes. However, the distinct kinase pathways might converge at Ser
307 to mediate the feedback inhibition of IRS-1 signaling to counter-regulate the insulin response in some conditions such as overexposure of insulin and dexamethasone, or oxidative stress [
23]. In the
DNAJC6-overexpressing group, the expression of both adipogenesis genes and adipokines was not changed while the insulin was treated. Defects in the insulin signaling system were more affected by the up/downregulation of the insulin receptor than the binding force between insulin and the receptor [
24]. The reduction in the insulin/receptor complex due to
DNAJC6 overexpression subsequently suppressed the recruitments of the GLUT4 transporters from the intracellular stores. In the
DNAJC6-overexpressing group, the inhibition of the insulin signaling system also inhibited leptin and LEPR expression, which increases in a dose-dependent manner and with the insulin treatment time [
25]. The deleted region comprised the proximal promoter and exons 1 and 2 of the
LEPR gene and exons 5 to 19 of the
DNAJC6 gene. This 80 kb deletion is consistent with previous observations that heterozygous human carriers of
leptin or
LEPR mutations are predisposed to overweight and obesity [
13]. The regulation of leptin secretion homeostasis in proportion to the size and number of adipocytes is dependent on LEPRs (up/downregulation) that are present in most cells. Therefore, the mechanisms involving the endocrine, immune, cardiovascular, and respiratory systems, in addition to diet and body fat control, are broad and complex [
26,
27]. Similar to the insulin receptor, various studies have shown that the leptin receptor exhibits substrate resistance and a cross-talk mechanism acting on both insulin and leptin [
28]. As adiponectin is regulated by PPARγ [
29], adiponectin may not have been expressed in the
DNAJC6-overexpressing group, in which the expression of adipogenesis-related proteins was suppressed.
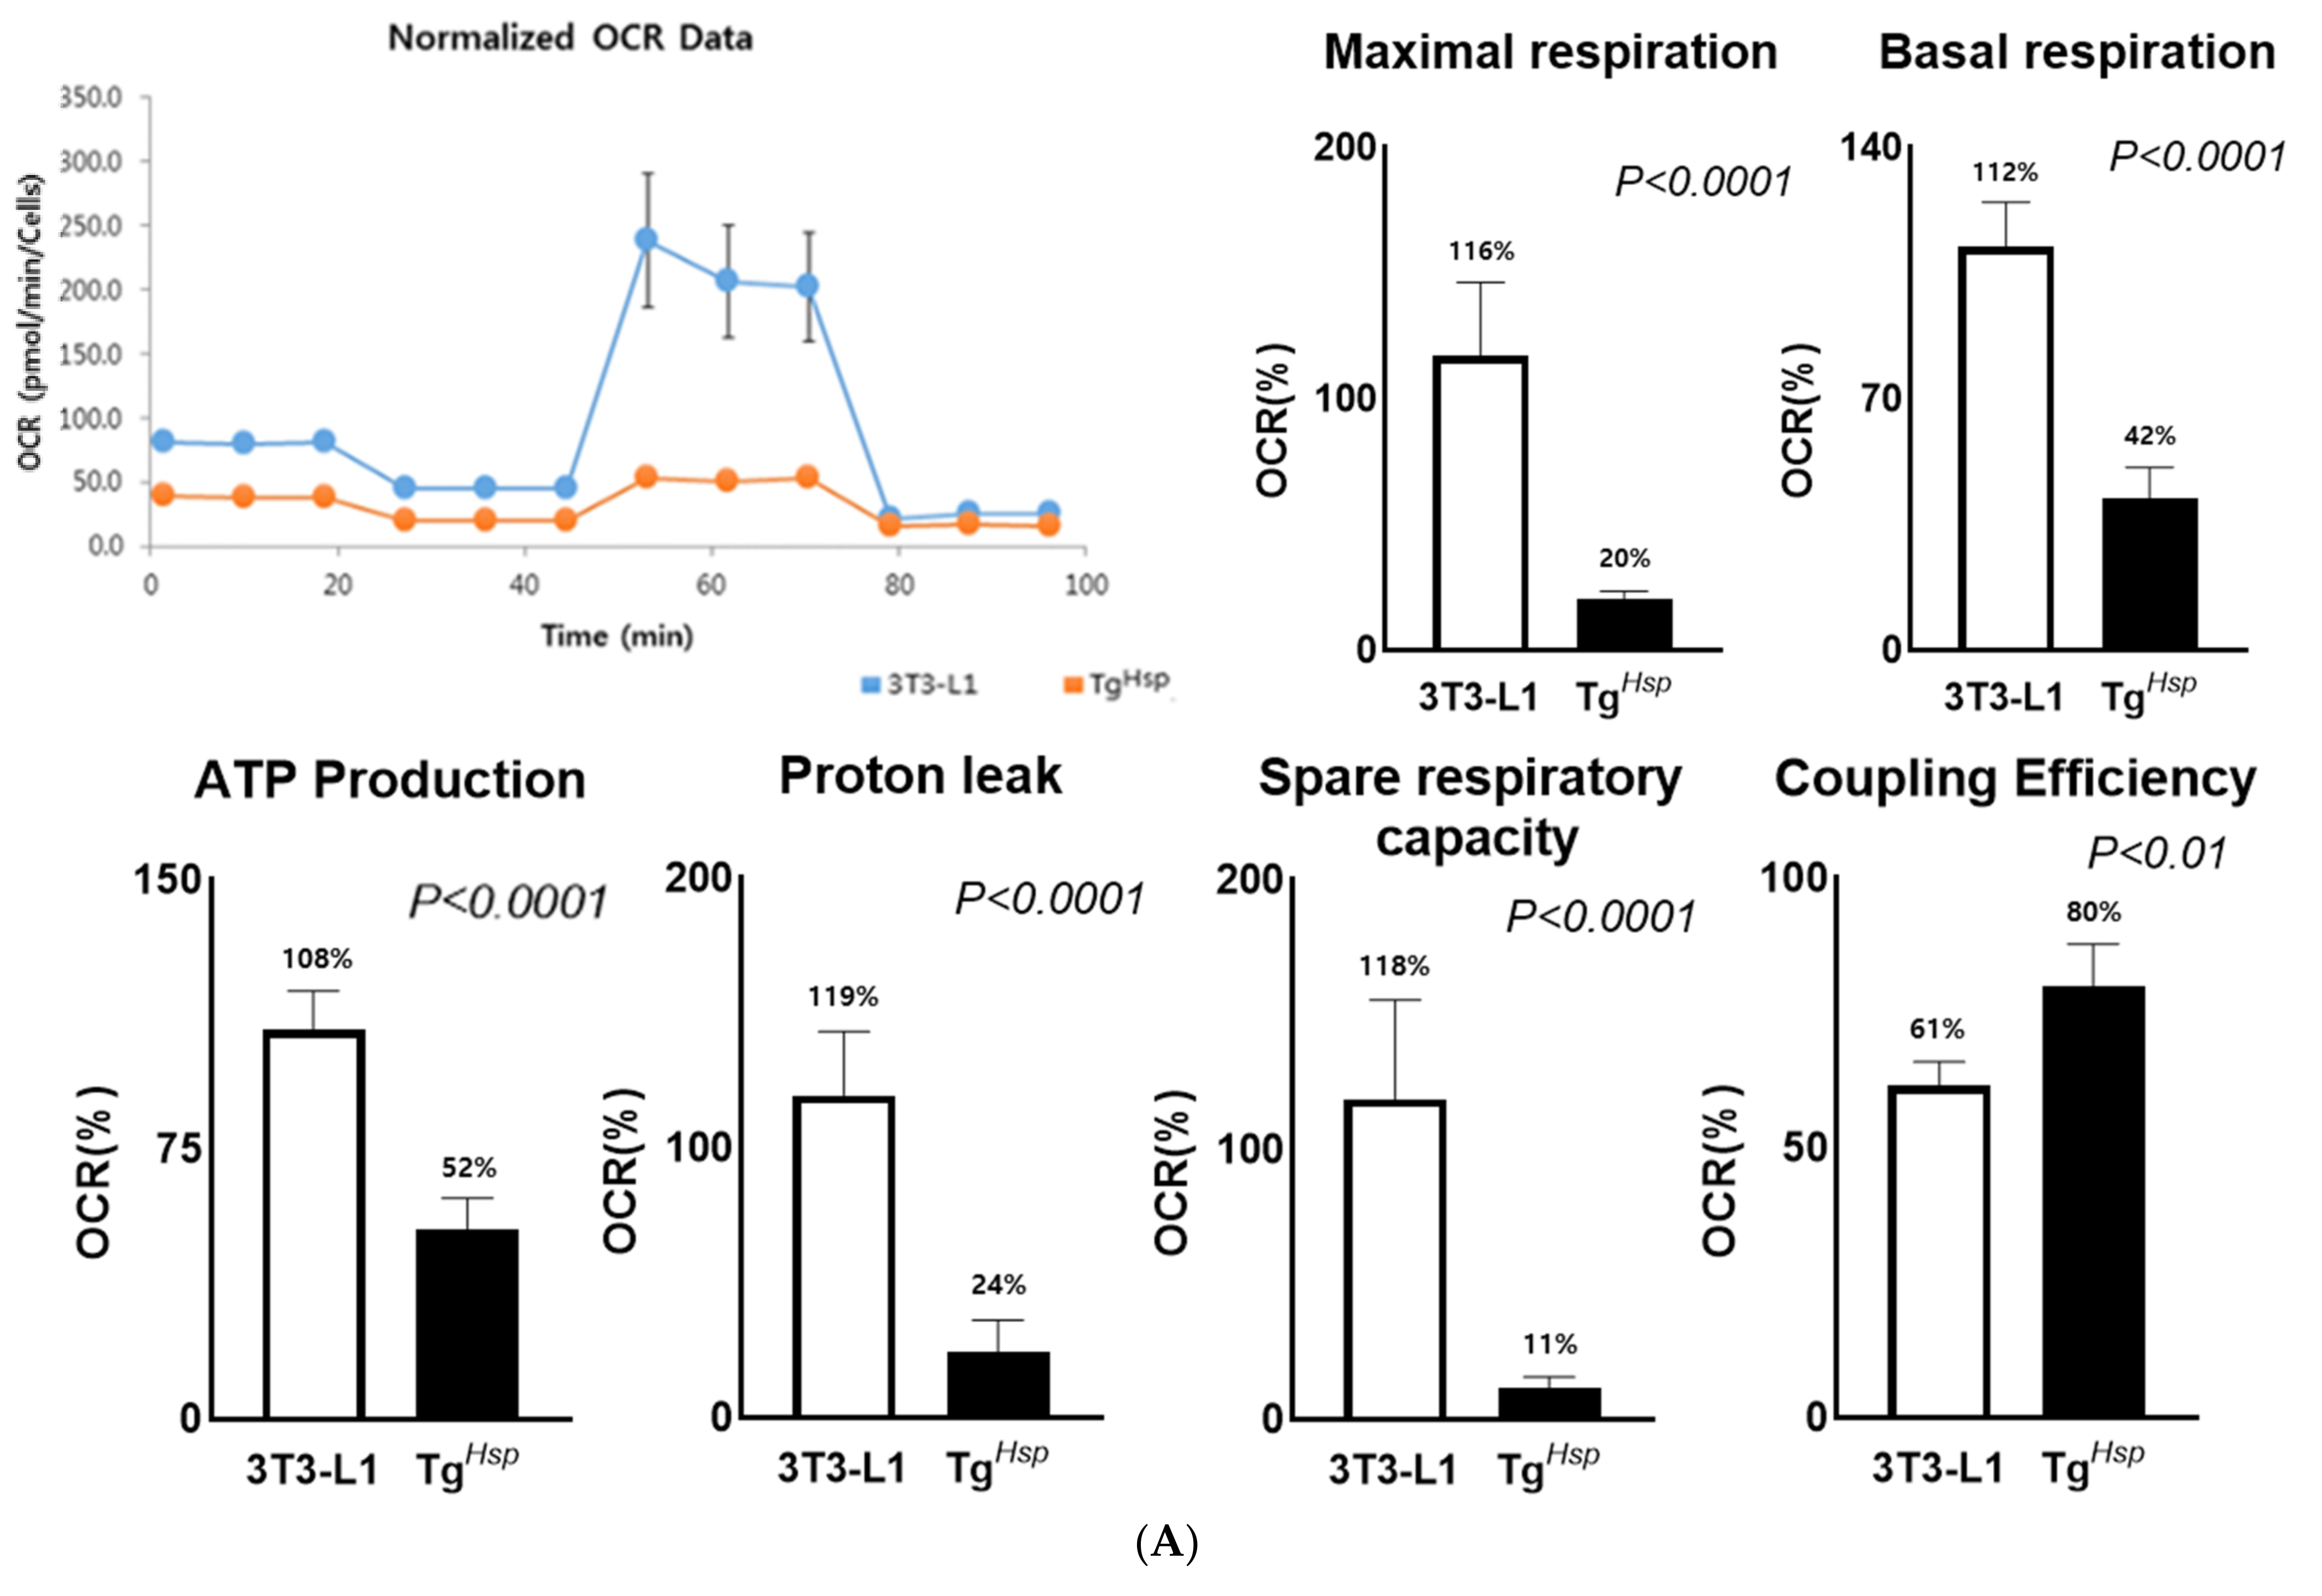
Furthermore, in the
DNAJC6-overexpressing group, the expression of pHSL (Ser563) involved in lipolysis, the free glycerol content, mitochondrial oxygen and energy consumption, and UCP1 protein expression were suppressed. HSL is activated by cyclin AMP-dependent protein kinases, whose expression increases during 3T3-L1 cell differentiation. HSL plays an important role in lipolysis [
30,
31]. However, in the
DNAJC6-overexpressing group, lipolysis was inhibited, and lipids were not formed. Therefore, lipolysis and adipokine expression were not observed. The low spare respiratory capacity and small increase in the maximum respiratory capacity in the
DNAJC6-overexpressing group suggest that mitochondria were already performing oxygen respiration at maximum capacity [
32]. Proton leak induced by inhibition of ATP synthesis is an indicator of a potential thermogenesis mechanism [
33,
34] and is related to the basal metabolic rate (BMR). In the
DNAJC6-overexpressing group, both proton leak and UCP1 expression decreased. These findings indicate that oxygen consumption was reduced in the
DNAJC6-overexpressing group due to a decrease in the BMR [
35]. Compared to the control group, the
DNAJC6-overexpressing group showed a significantly higher coupling efficiency. This suggests that, although coupling respiration is more active than uncoupling respiration in the
DNAJC6-overexpressing group, energy production is lower than that in the control group [
34].
Since non-adipogenesis, non-glucose influx, non-ATP generation, and non-thermogenesis were found in the differentiation of
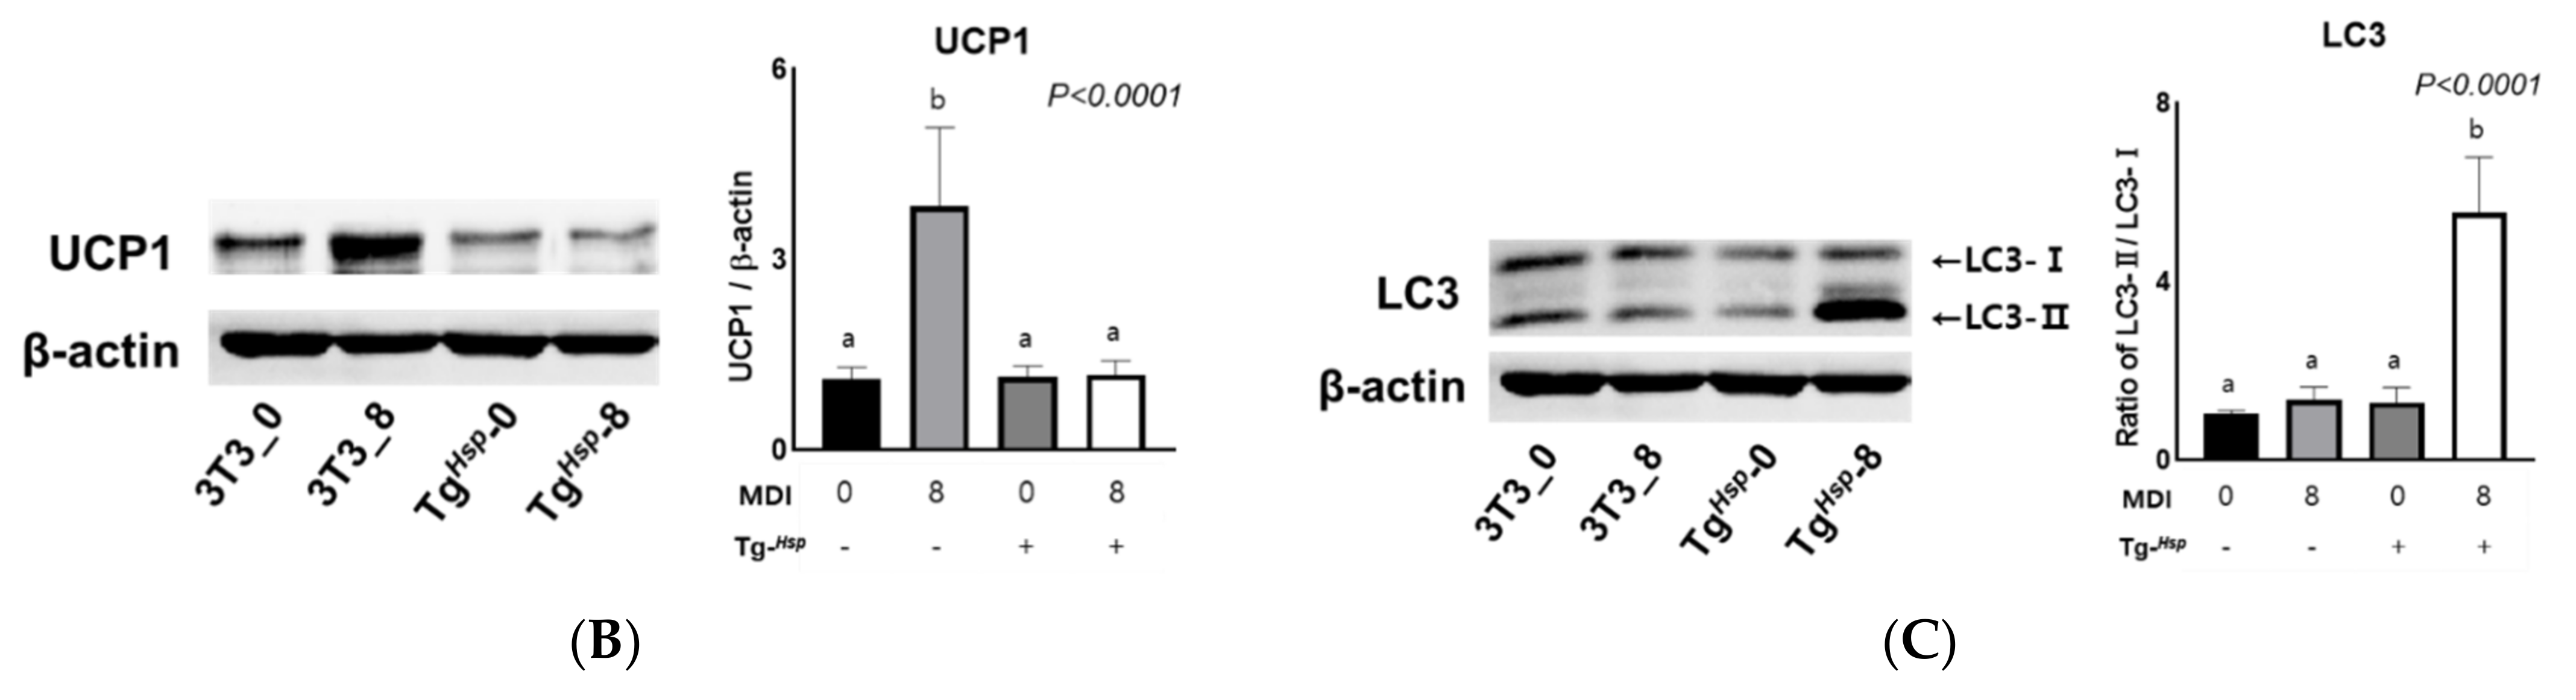
DNAJC6-overexpressed cells, we need to know the next survival step in the case of continuous malnutrition, such as autophagy progress. The conversion rate from LC3-I to LC3-II as a biomarker of autophagosome formation was increased in the
DNAJC6-overexpressed cells at the status of differentiation compared to the control. Mizushima reported that a simple comparison of LC3-I and LC3-II, or a summation of LC3-I and LC3-II for ratio determinations, may not be appropriate, and instead, the amount of LC3-II can be compared between samples [
36]. Although they recommended LC3-II levels, which are clearly correlated with the numbers of autophagosomes, we used the ratio of LC3-II/LC-I because of the importance of the conversion rate of LC3-II from LC3-I. Without the metabolic rate for energy production in
DNAJC6-overexpressed cells, autophagy/programmed cell death might have occurred to protect the cells from apoptosis [
37]. We concluded that the lack of adipogenesis in the
DNAJC6-overexpressing group might be caused by the inhibition of the following: expression of adipogenesis-related genes, glucose inflow due to defects in the insulin signaling system, and mitochondrial dysfunction.
Our limitation is that we did not confirm whether a null DNAJC6 case using knock-out (KO) transfection or siRNA induces adipogenesis compared to DNAJC6 overexpression. Therefore, we need animal experiments that use both cases of DNAJC6 overexpression and KO groups to confirm the mechanism of lipid energy metabolism.


