
Changes in the Proteome of Platelets from Patients with Critical Progression of COVID-19
 , , and
Abstract
:
1. Introduction
2. Materials and Methods
2.1. Study Population
2.2. Plasma Preparation
2.3. Platelet Isolation
2.4. Platelets Preparation for MS Analysis
2.5. Plasma Preparation for MS Analysis
2.6. Platelet Preparation for Enzyme-Linked Immunosorbent Assay (ELISA)
2.7. Label-Free nanoLC-MS/MS with Data-Dependent Acquisition (DDA)
2.8. Parallel Reaction Monitoring Mass Spectrometry (PRM-MS)—Validation of the Found Changes
2.9. ELISA—Validation of the Found Changes
2.10. Data Analysis
3. Results
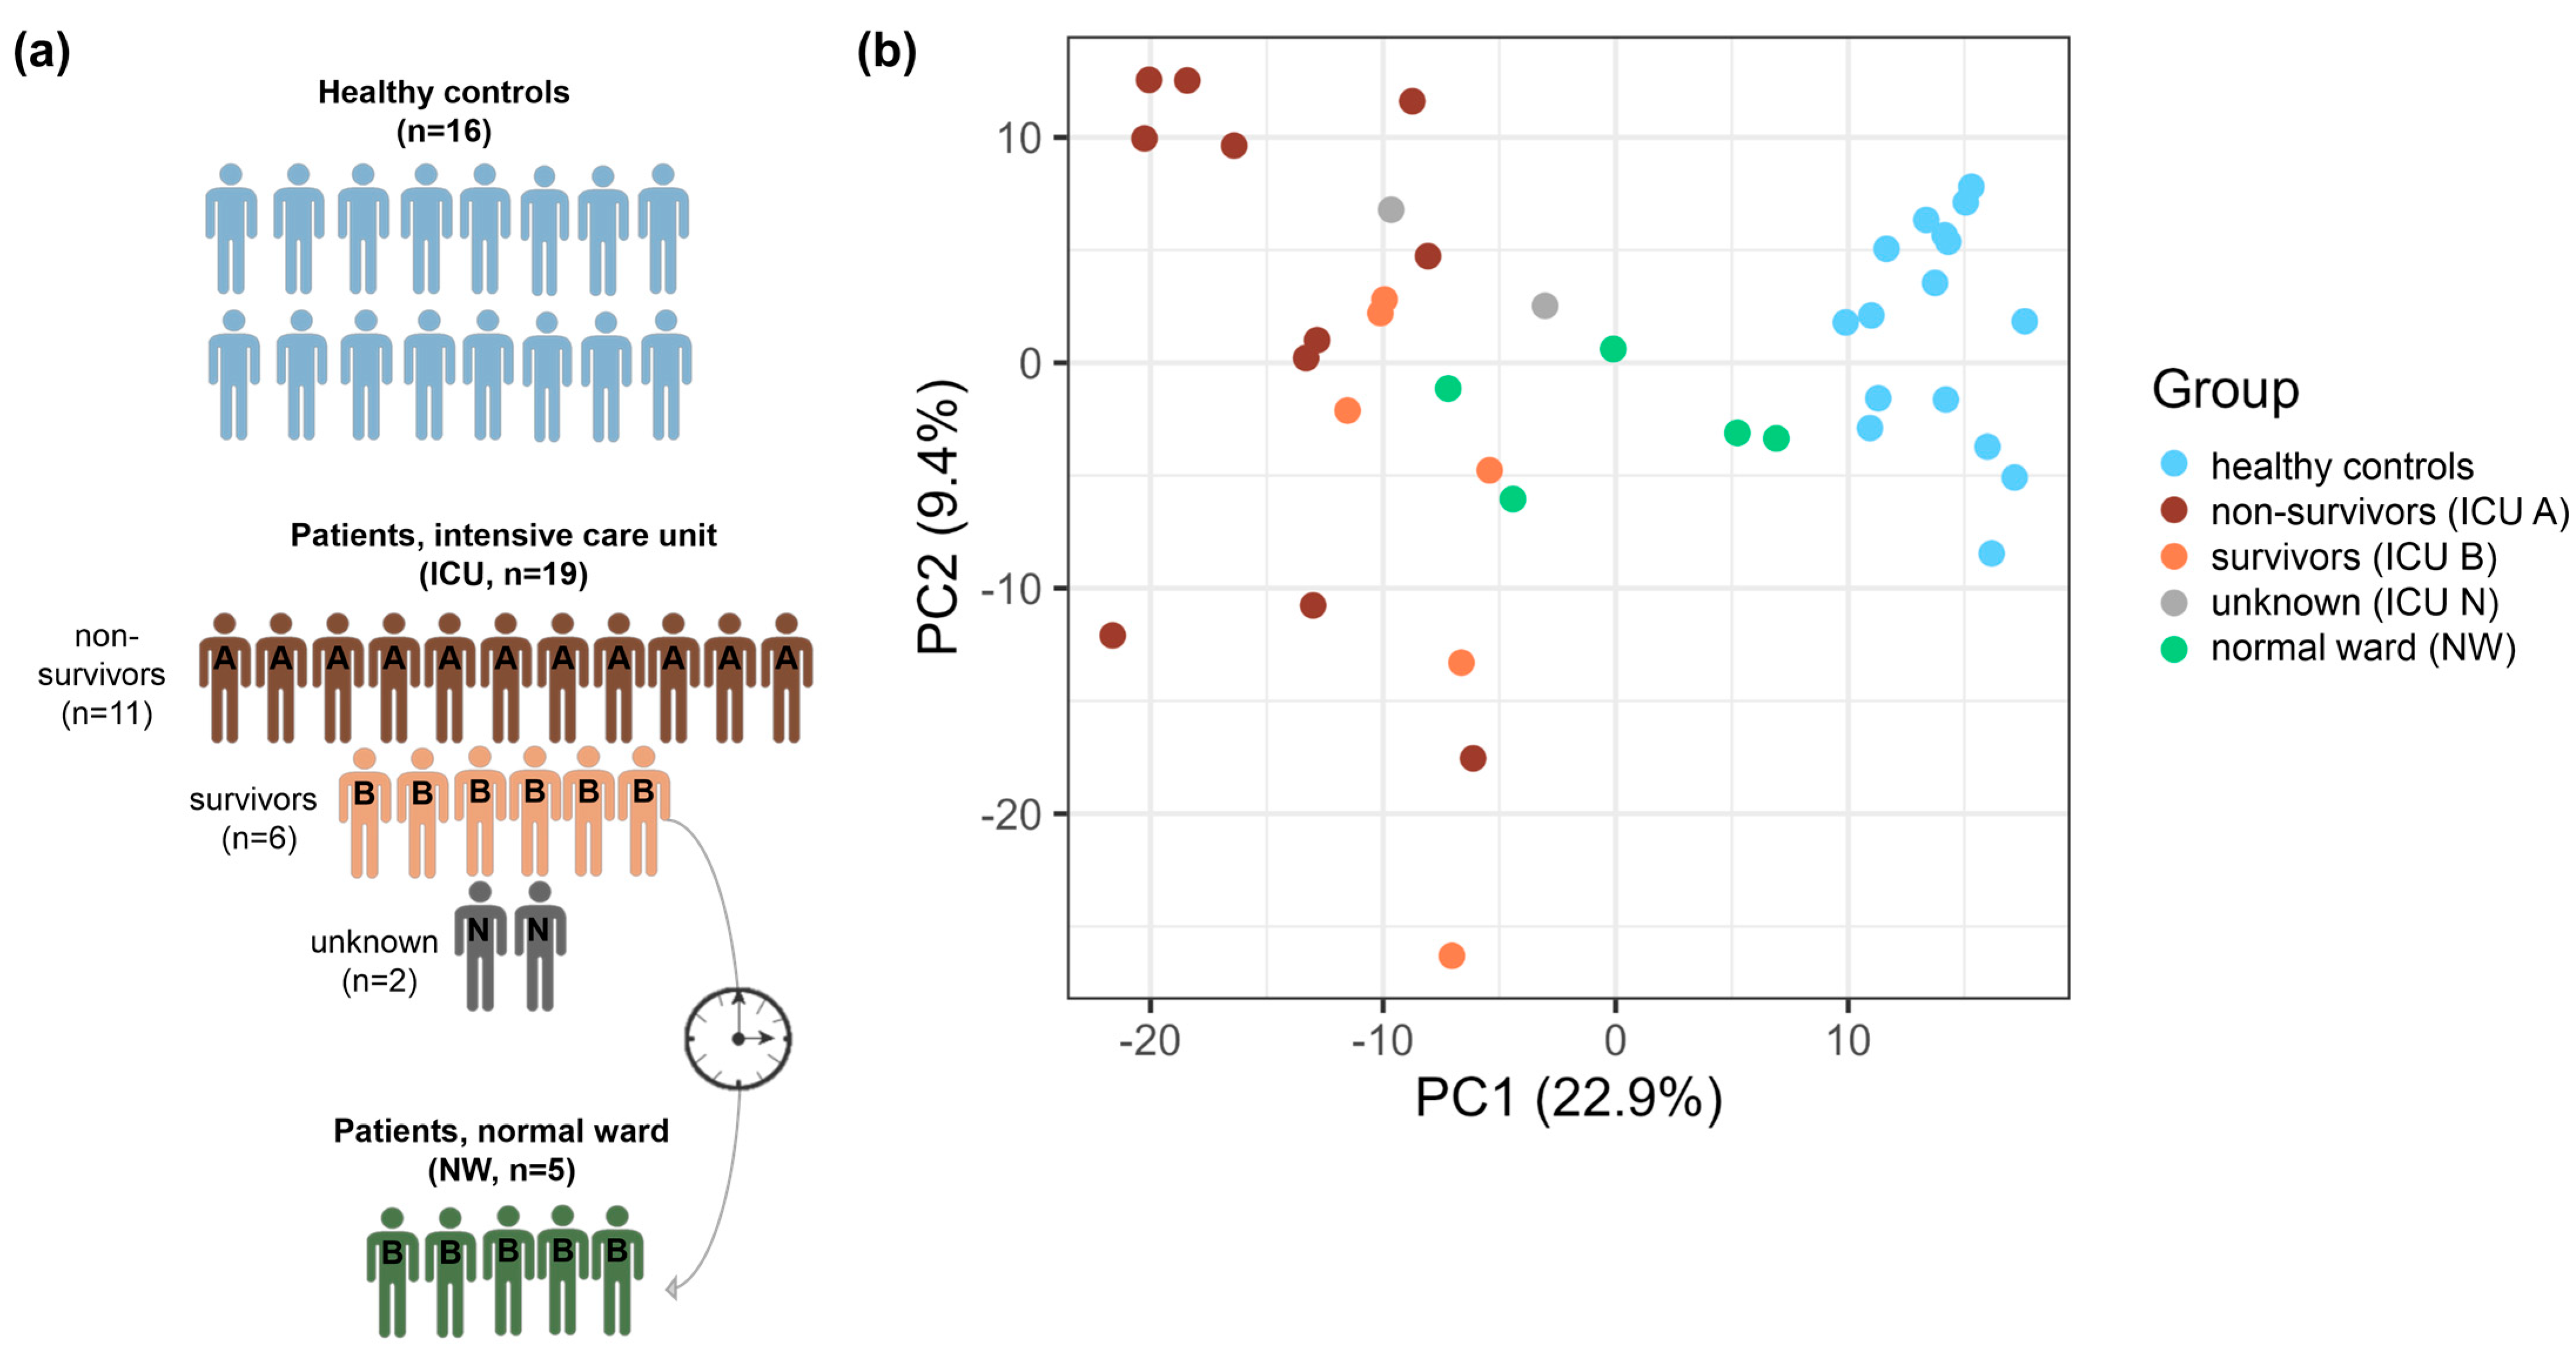
3.1. Patient Cohort
3.2. Global Proteomic Characterization of Platelets: ICU and Control Platelets Can Be Distinguished Based on Their Proteomes
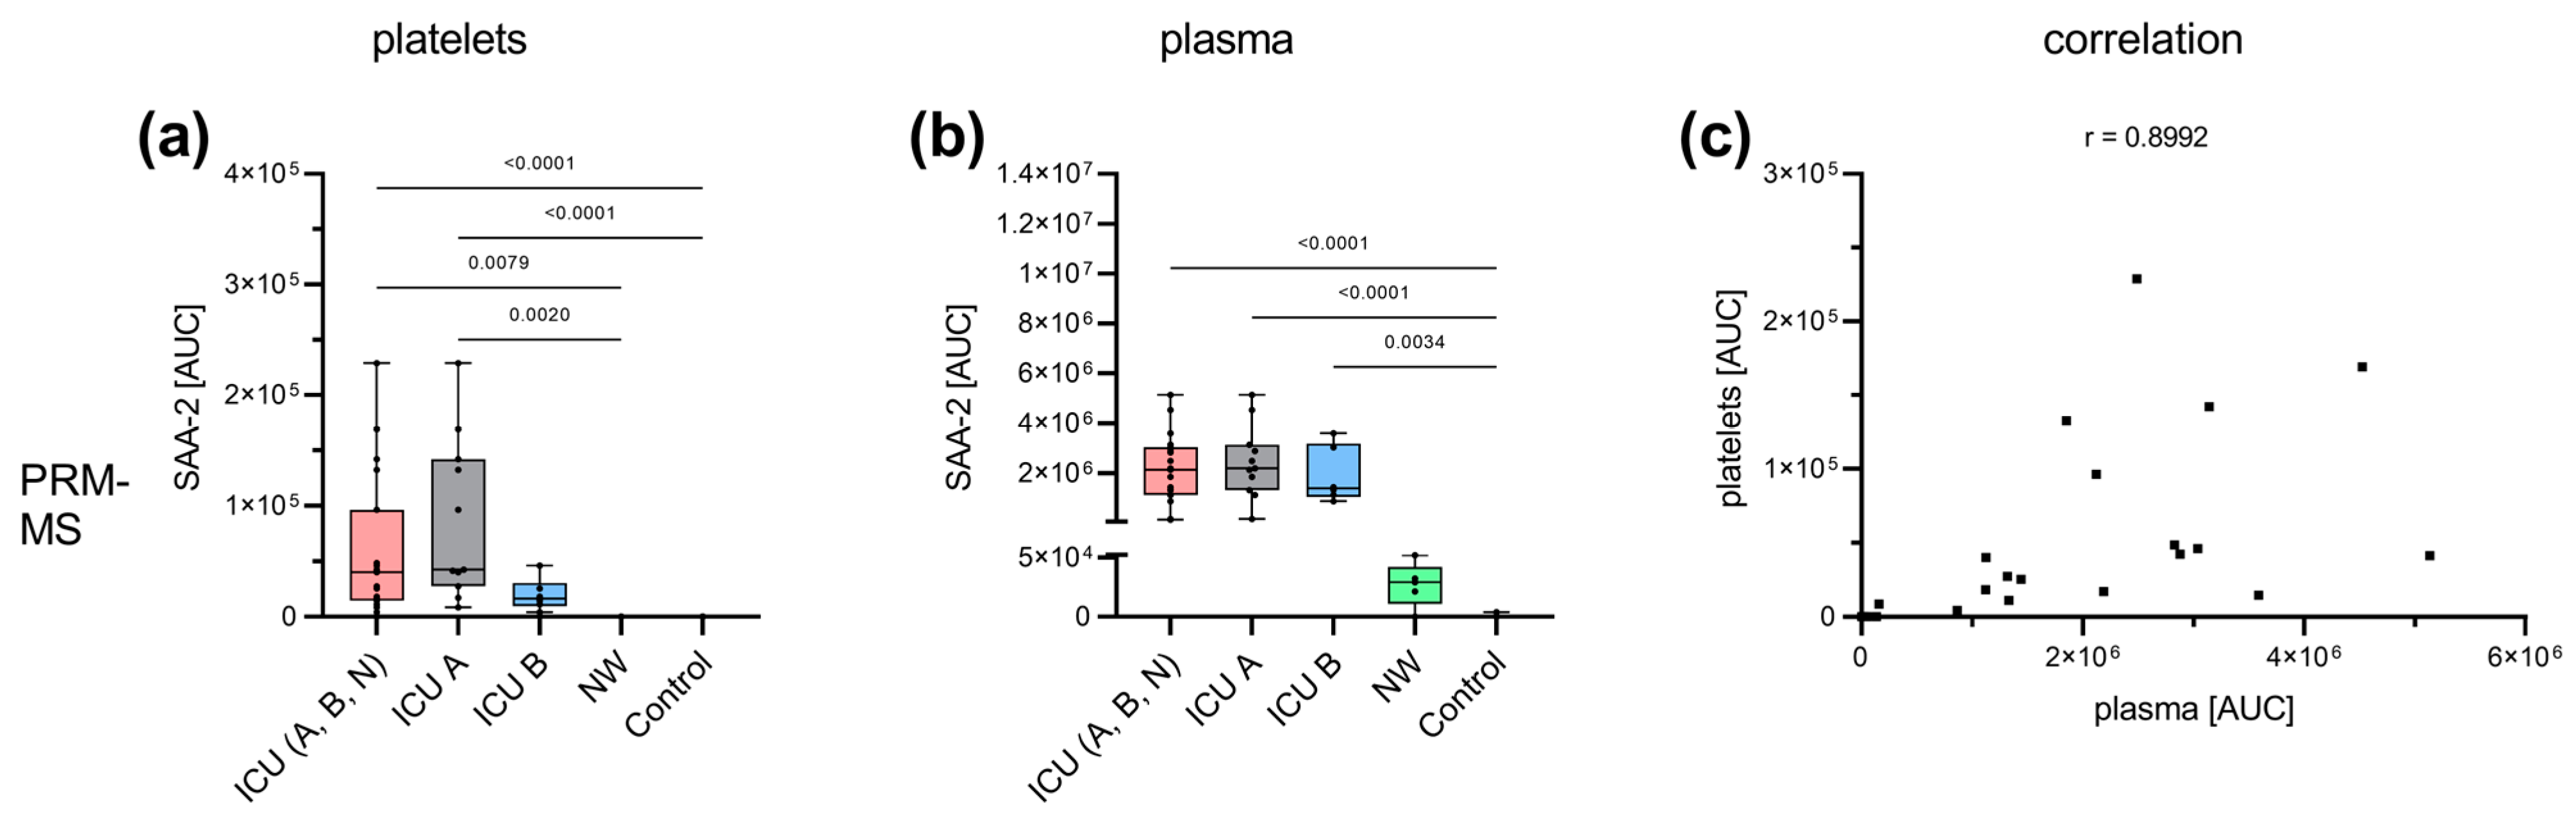
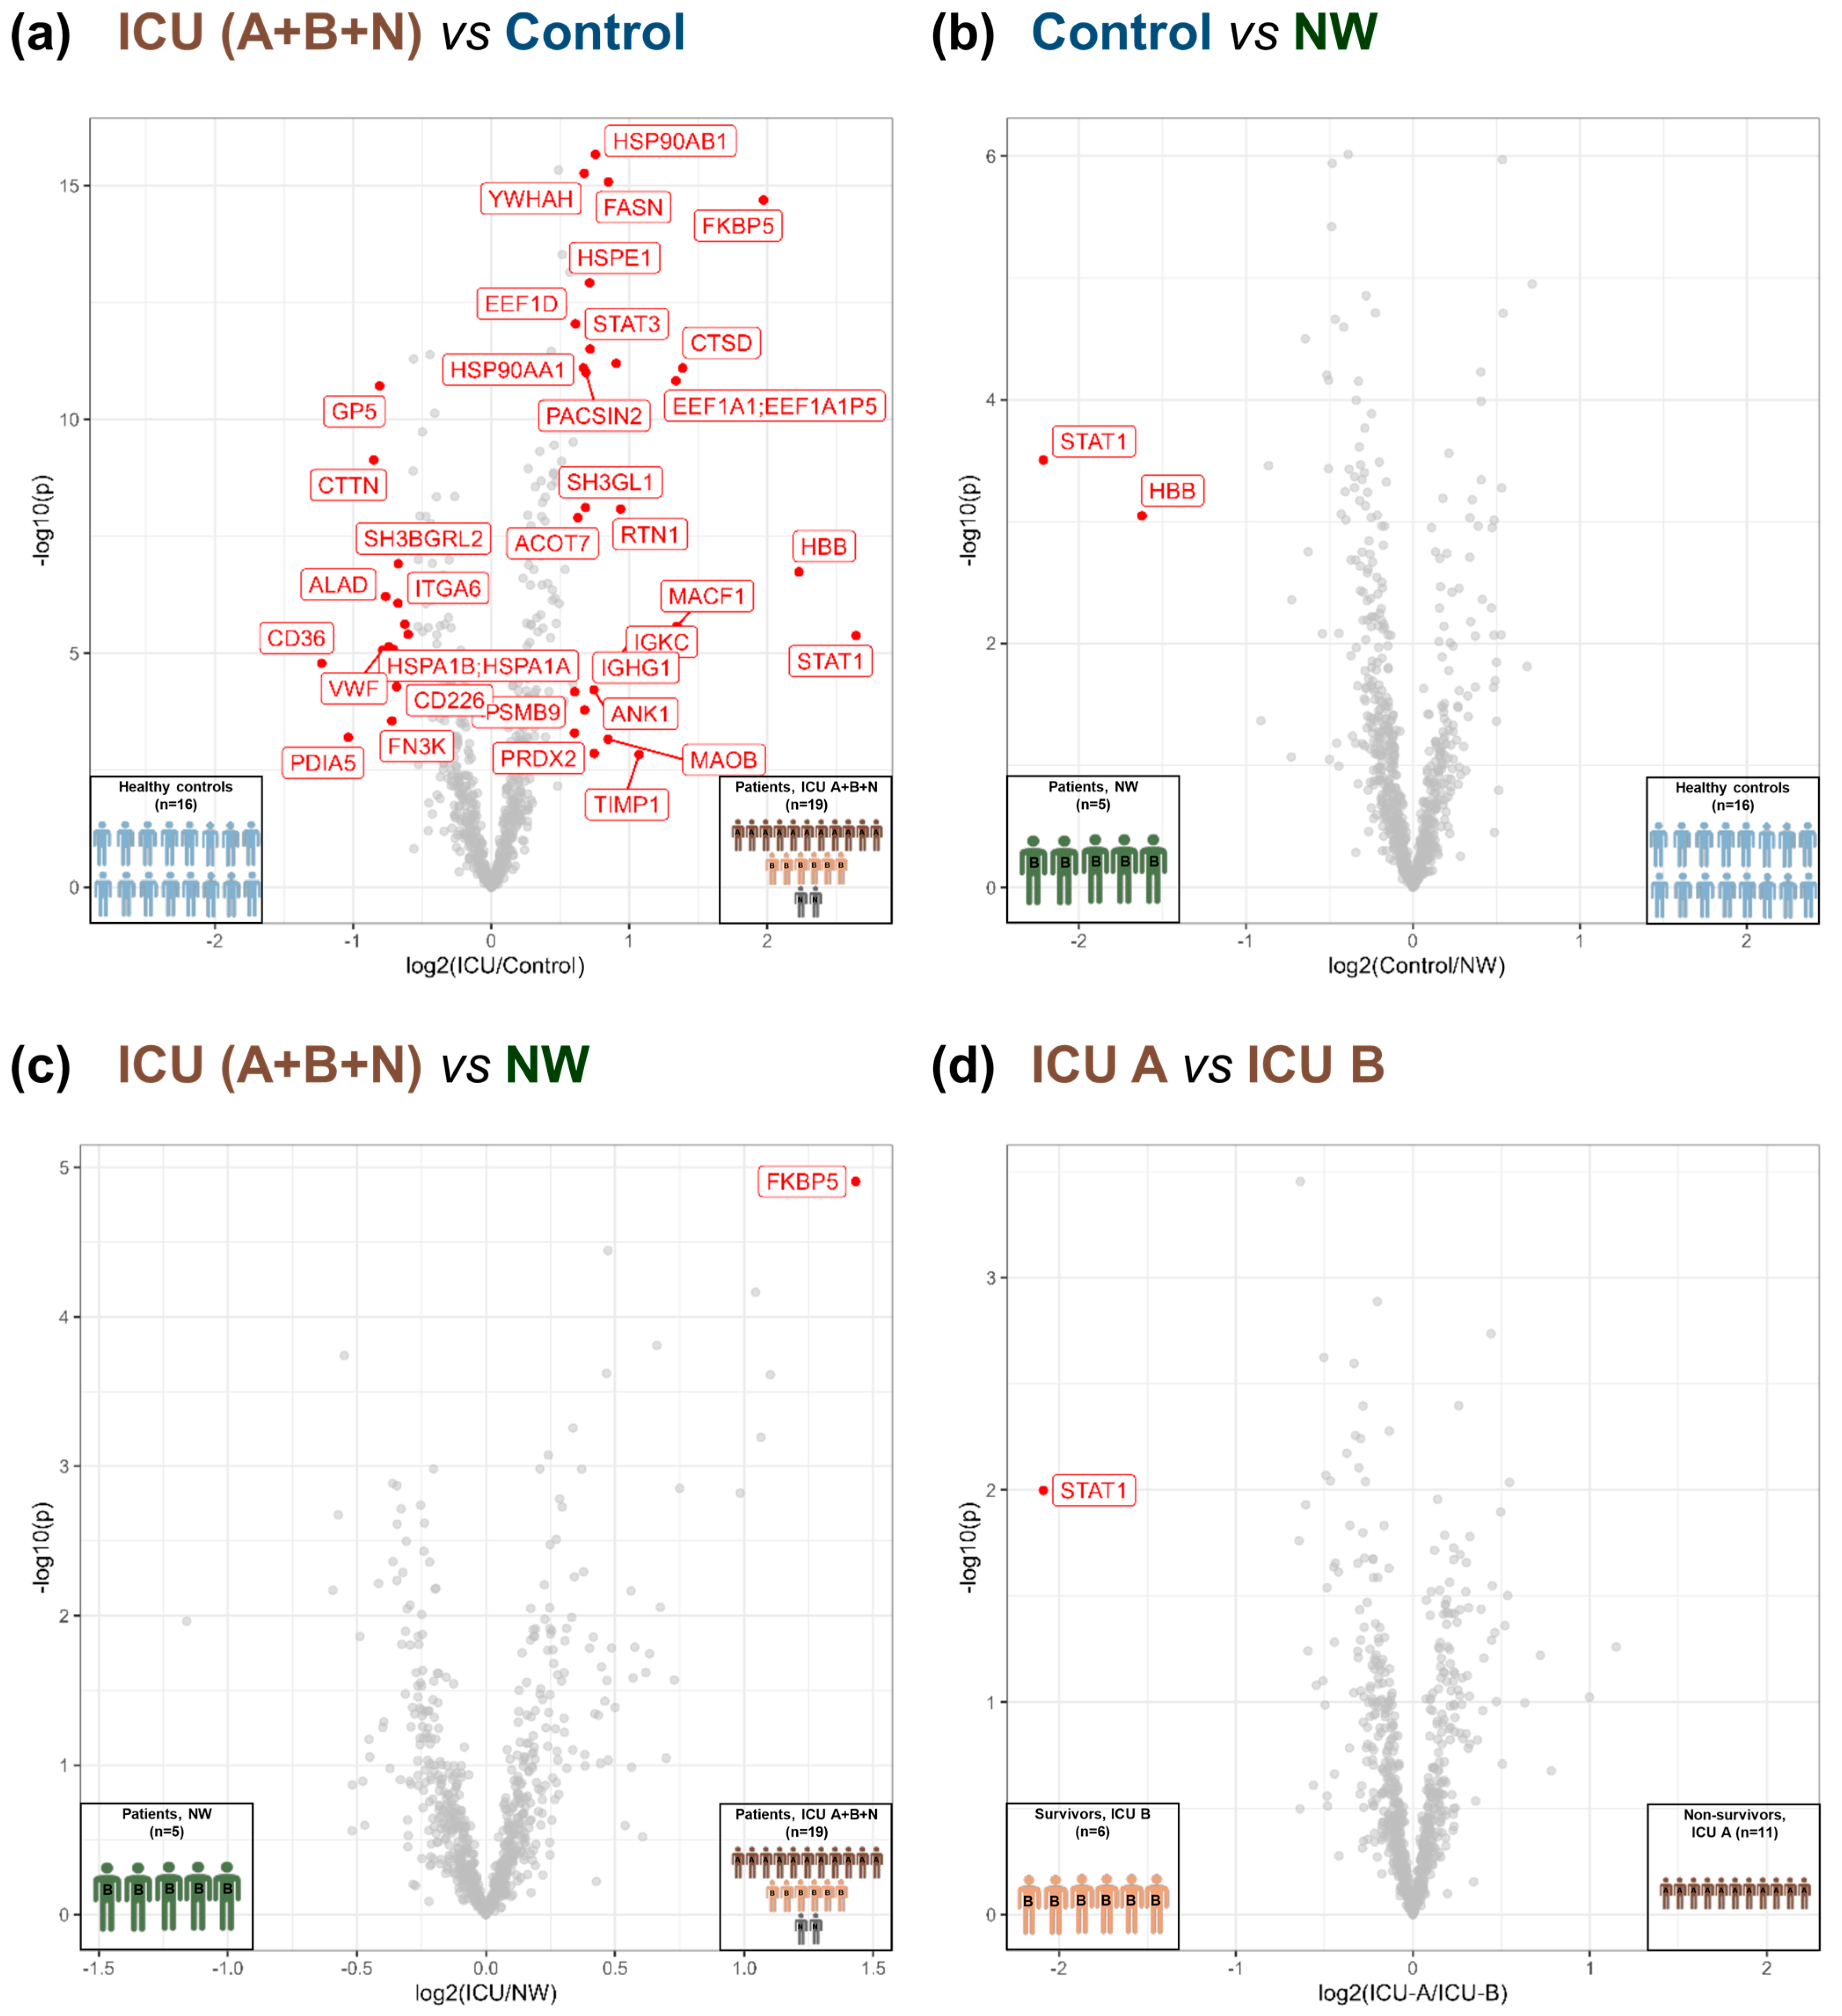
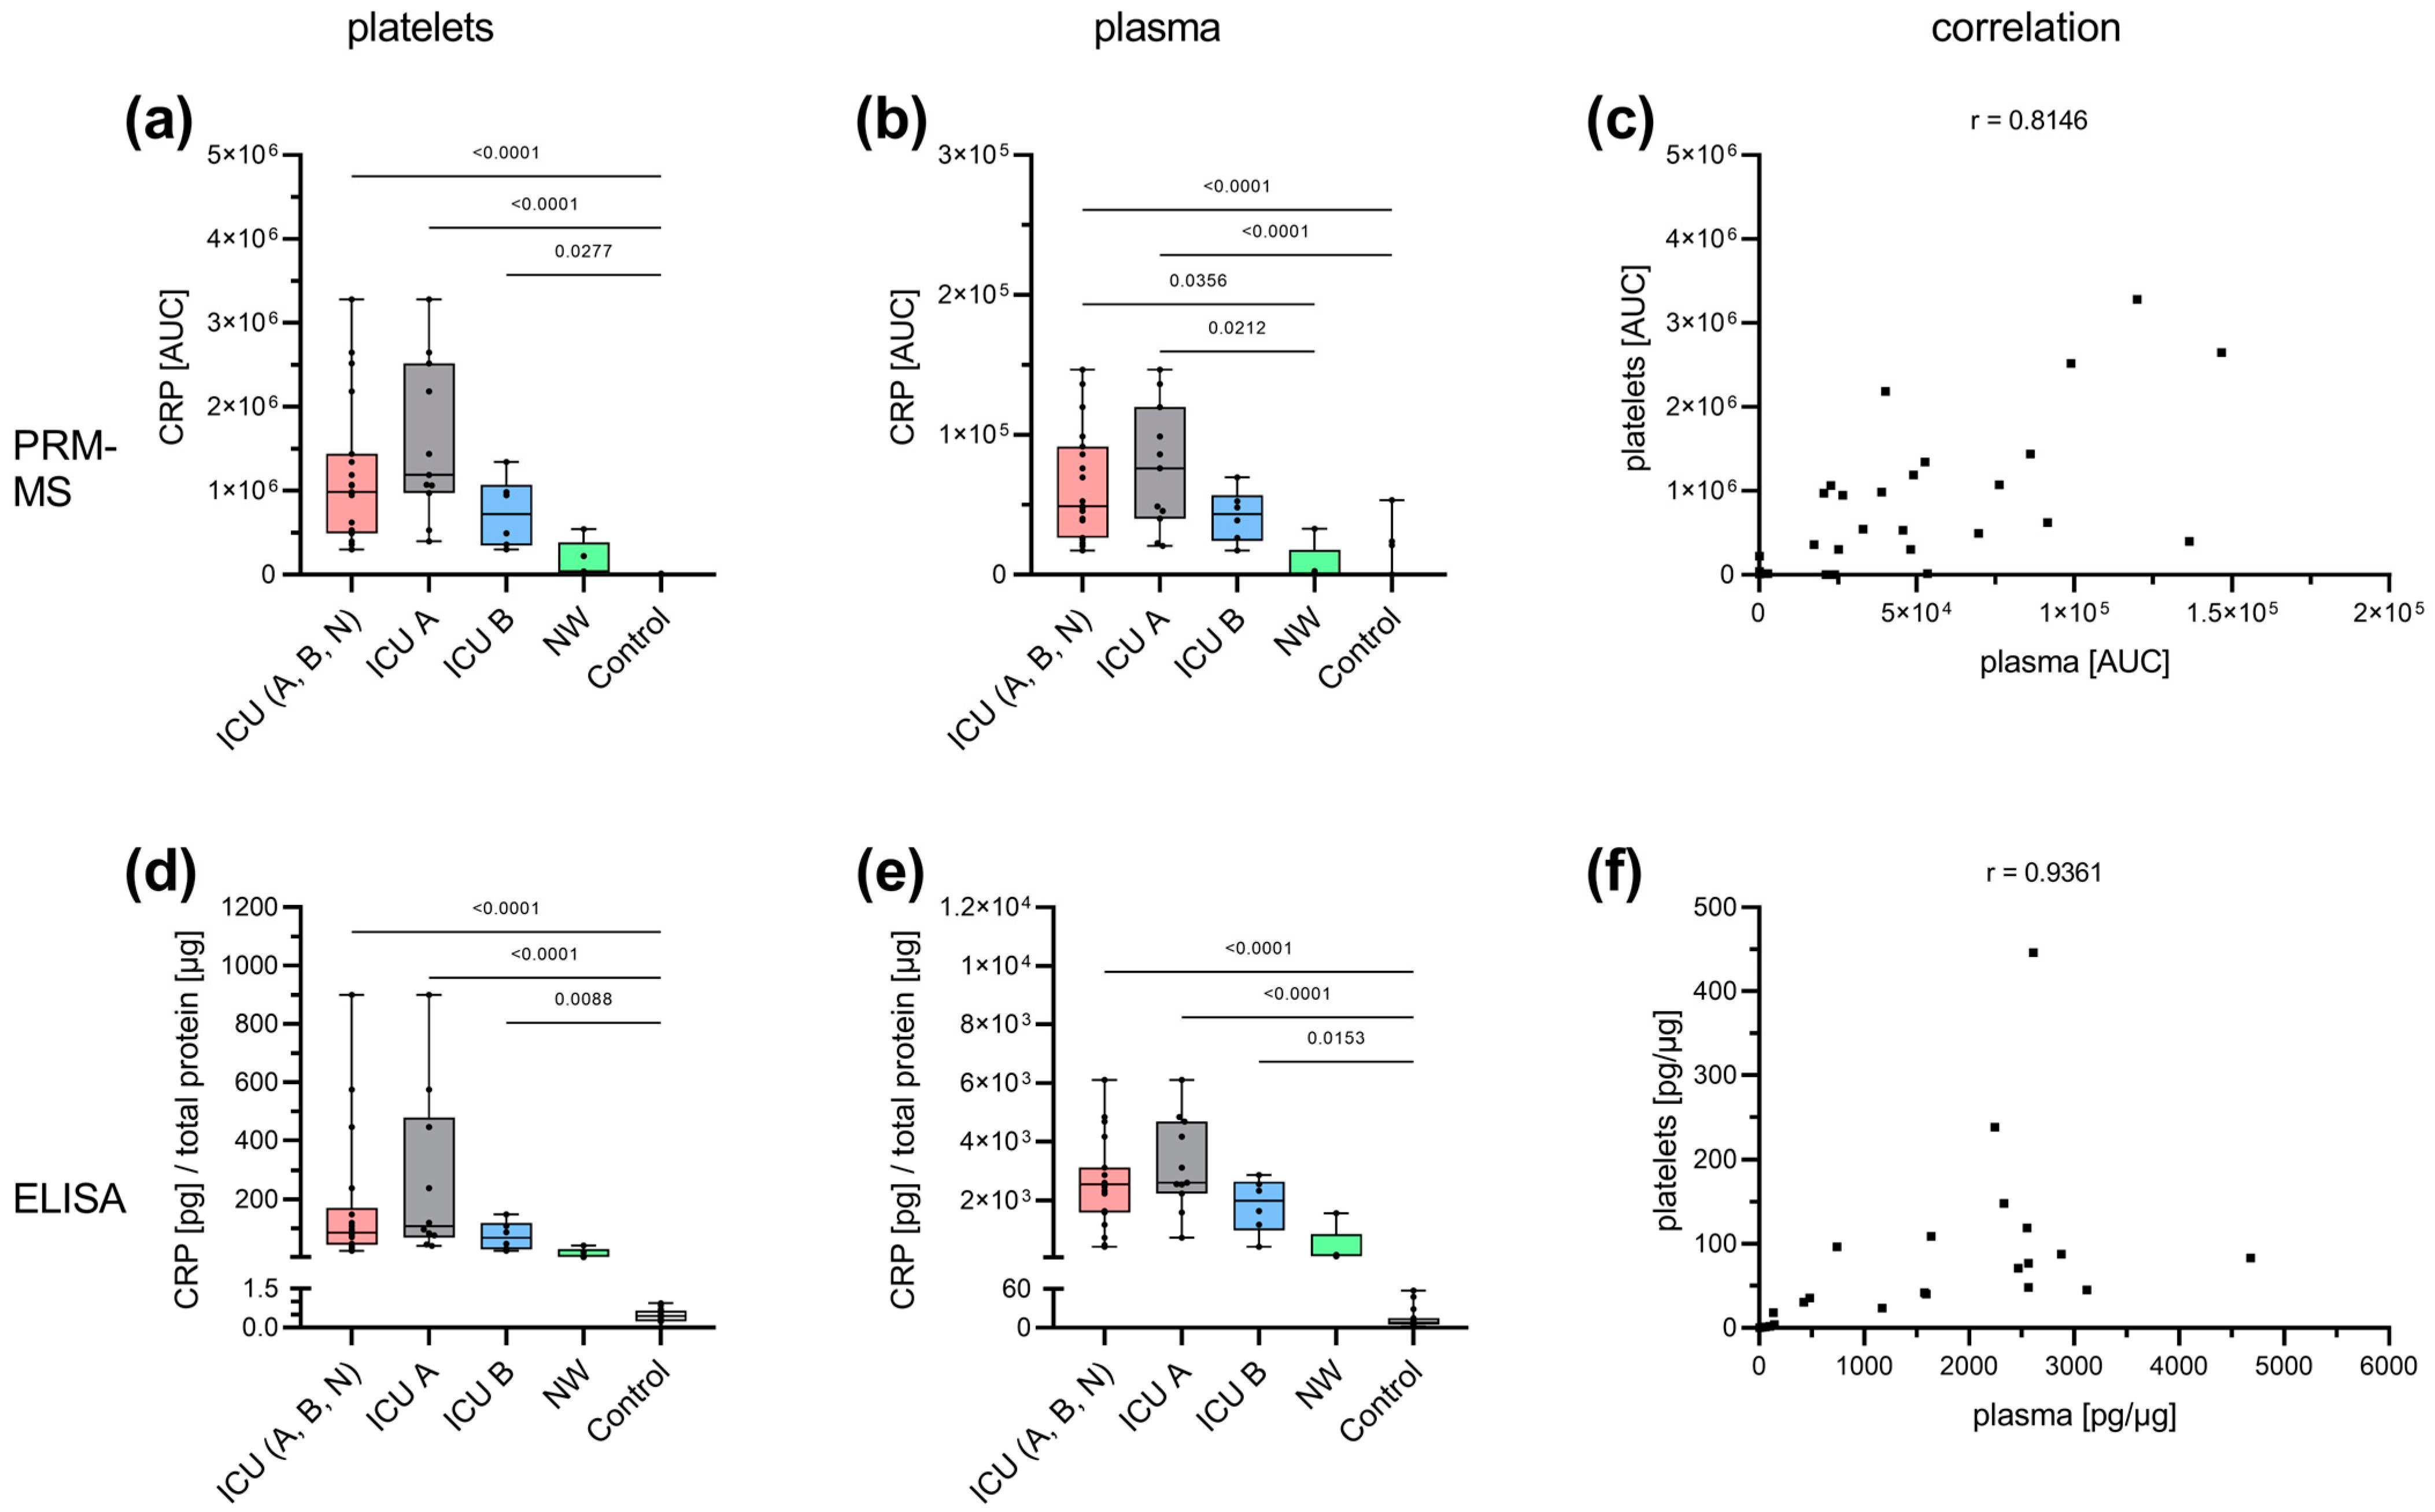
3.3. Acute-Phase and Erythrocyte-Associated Proteins in Focus for Biomarker Candidates
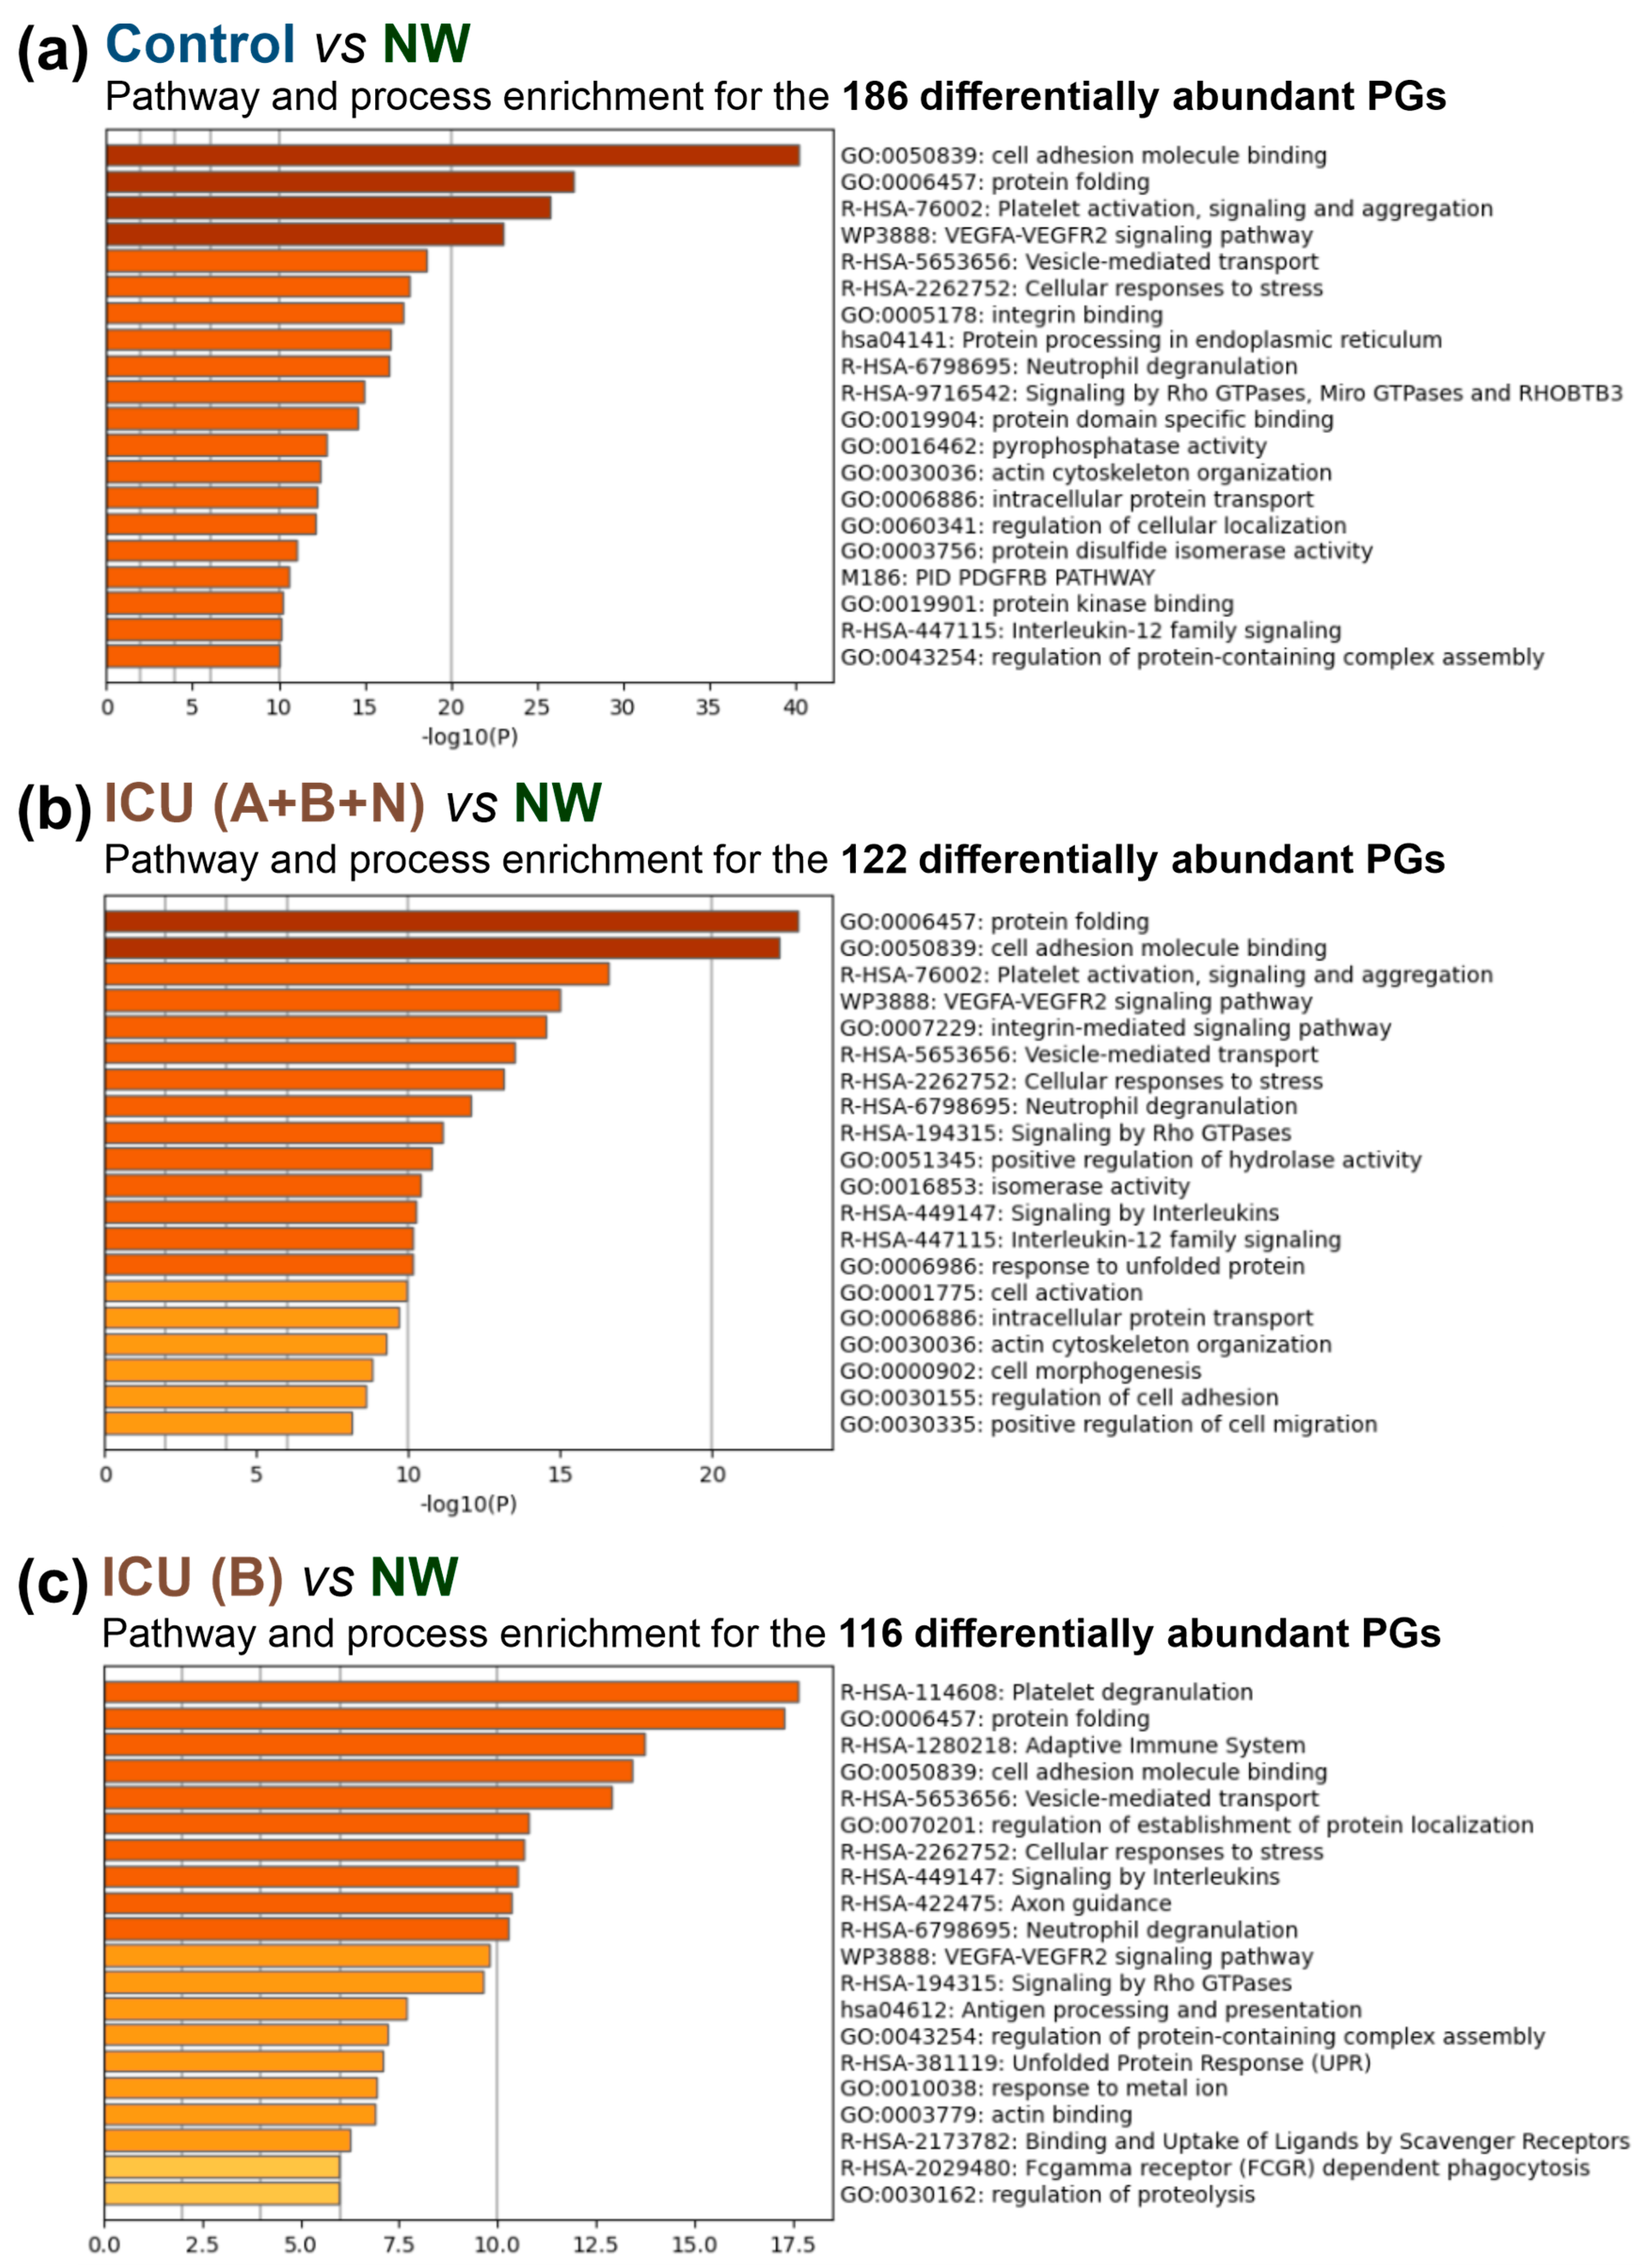
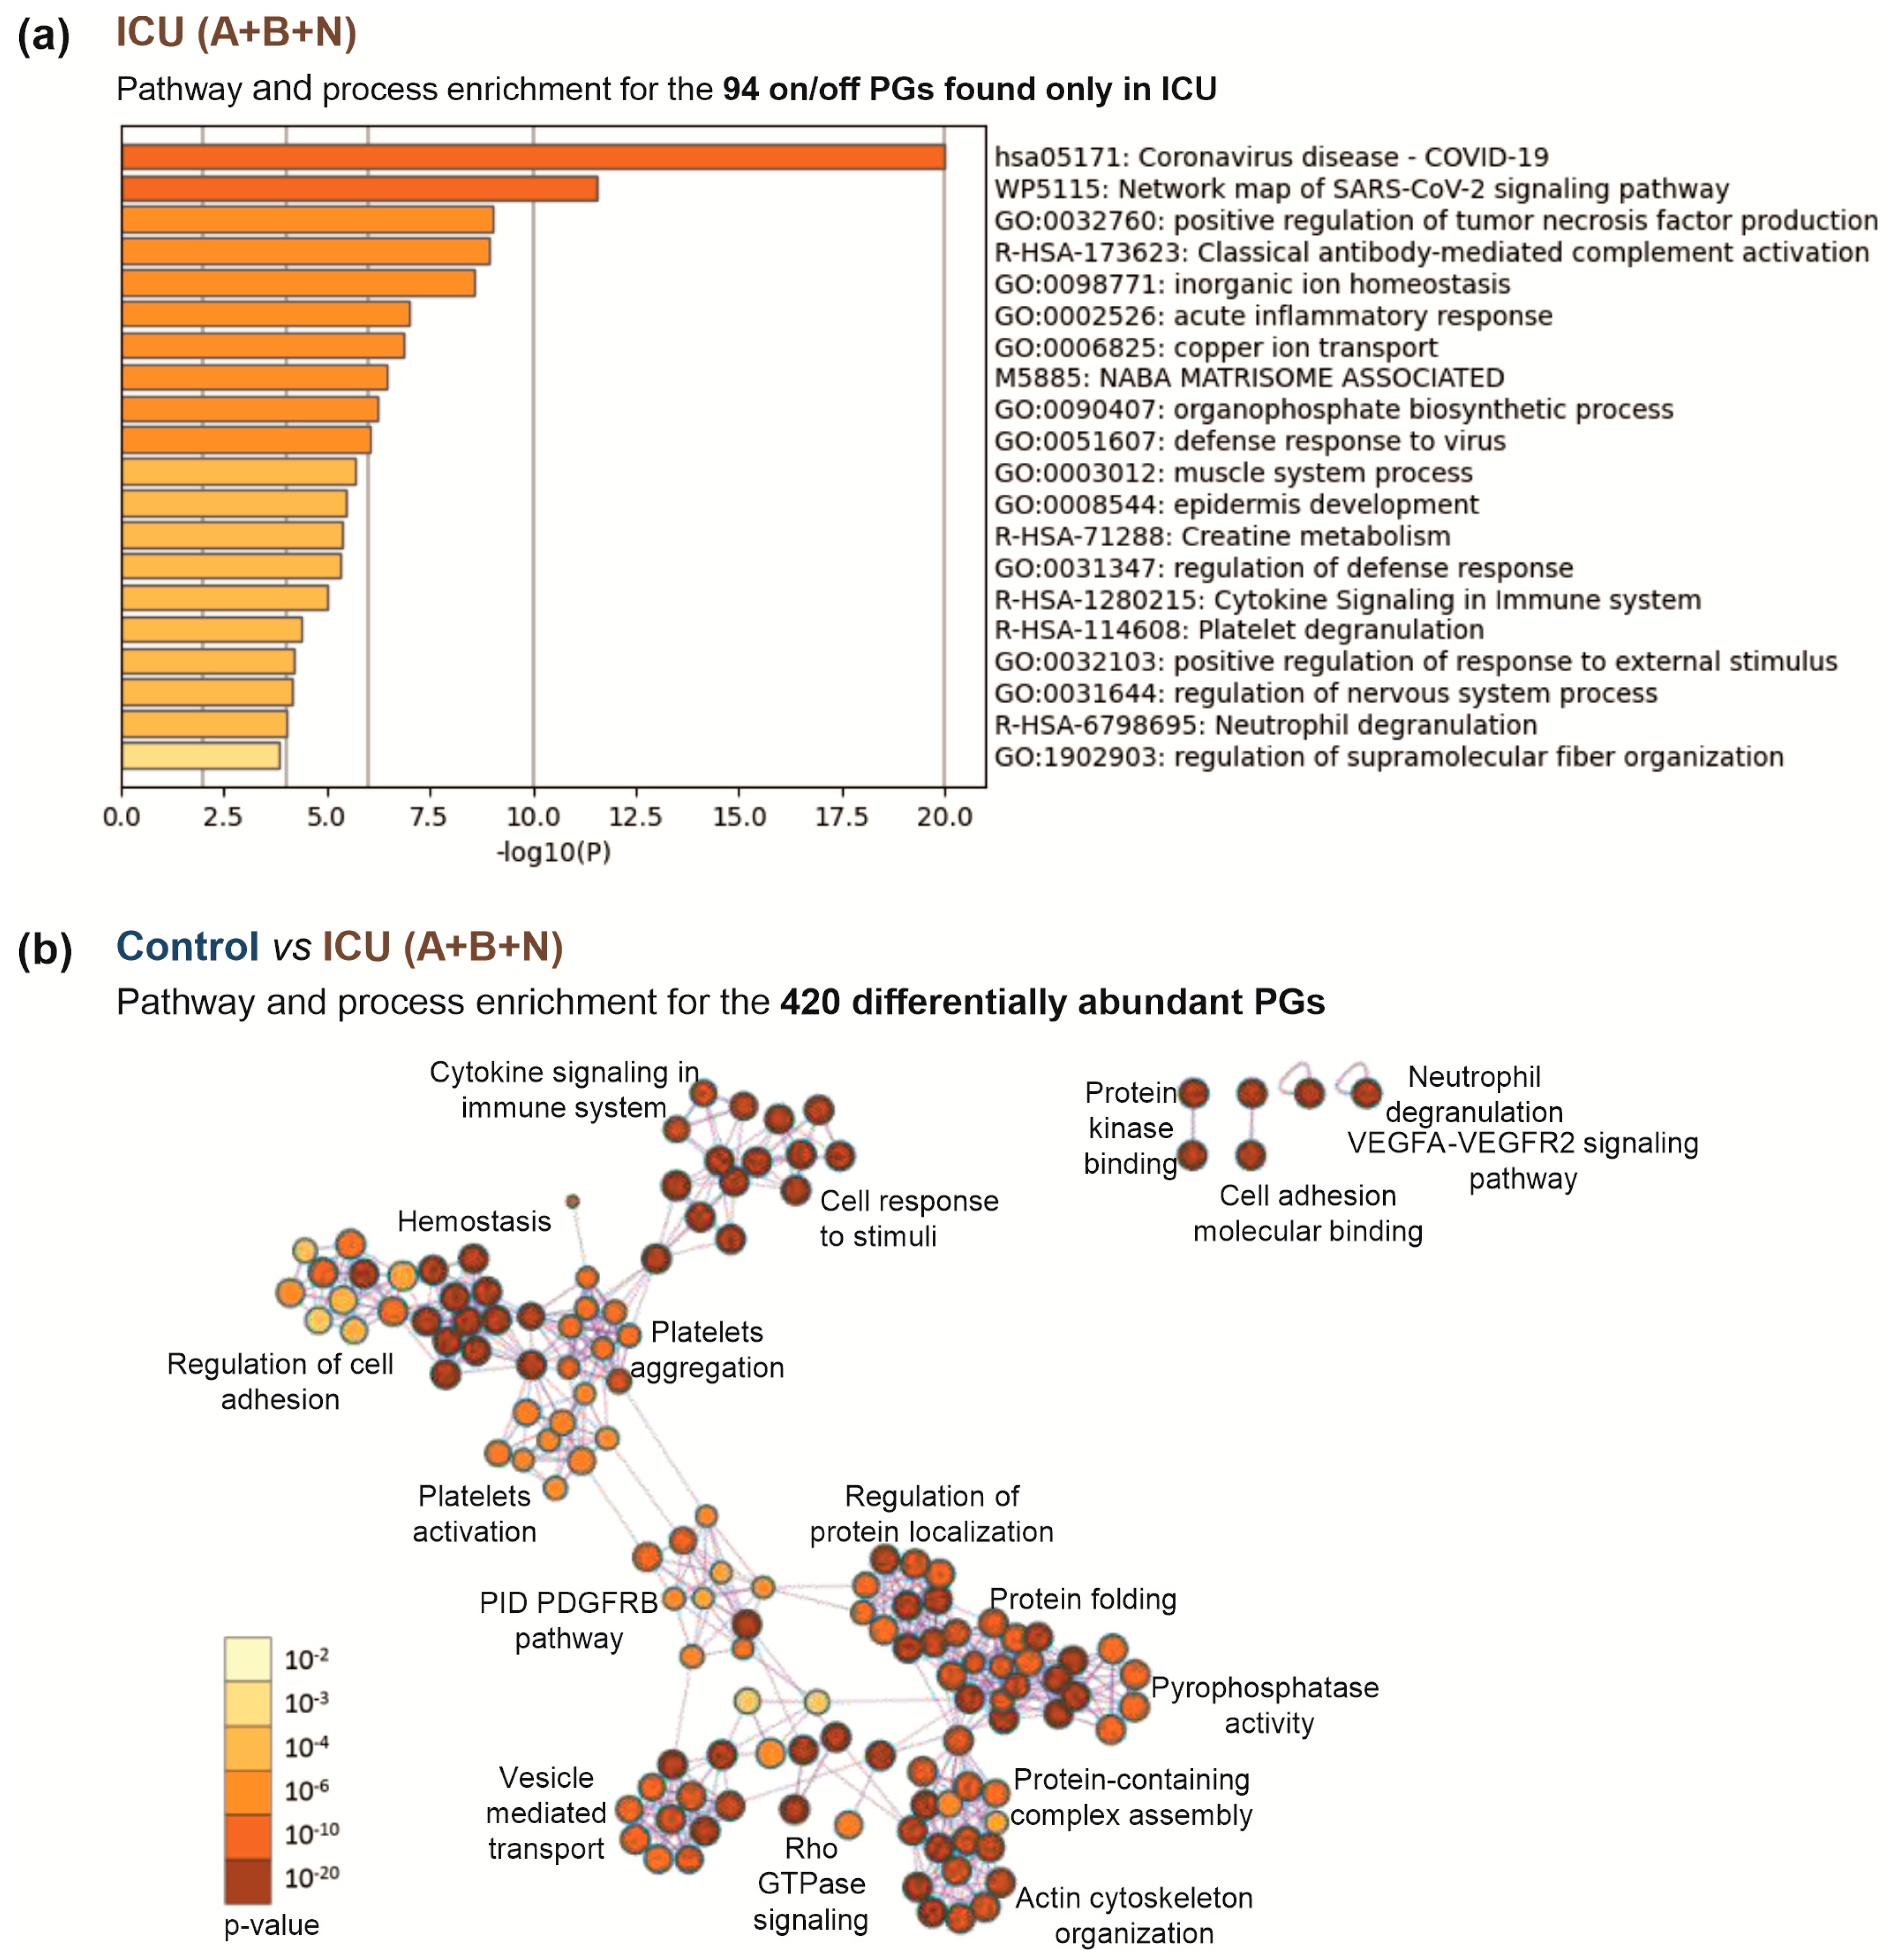
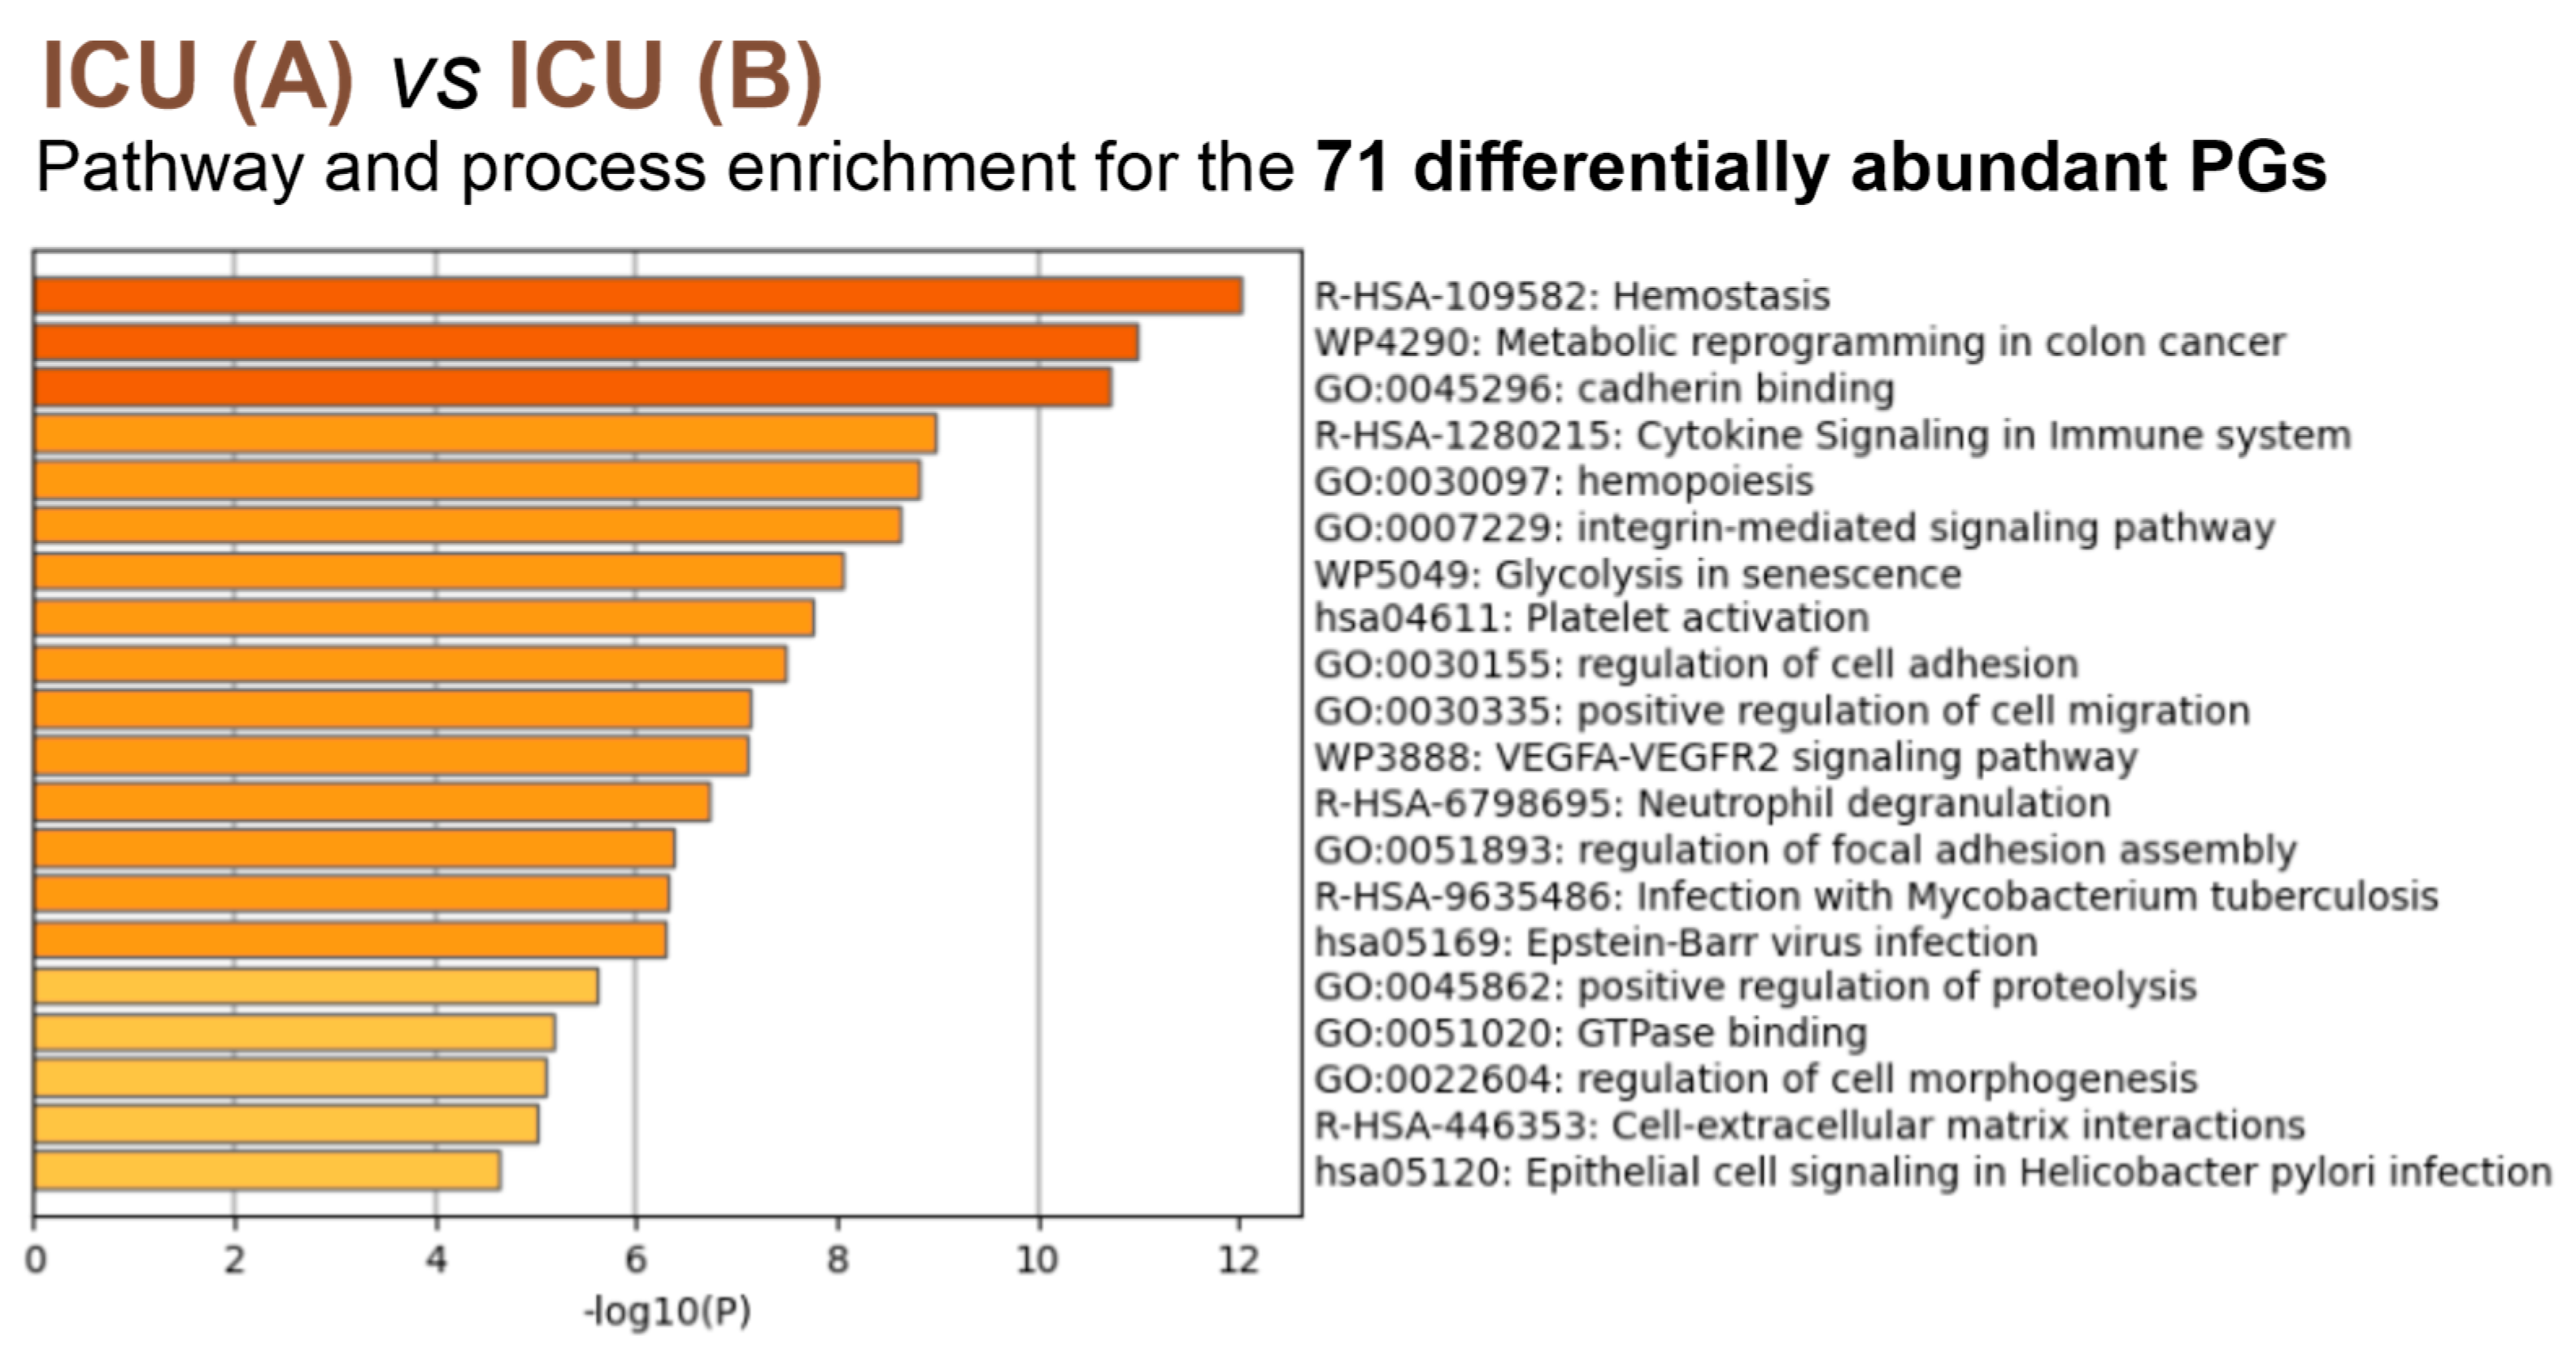
3.4. Insights into the Pathogenesis of COVID-19 at the Platelet Level
4. Discussion
4.1. Potential Predictive Biomarkers for the Outcome of COVID-19 in Patients’ Platelets
4.2. Cytokine Signaling and Non-Genomic Action of Transcription Factors in Platelets from Severely Affected COVID-19 Patients
5. Conclusions
Supplementary Materials
Author Contributions
Funding
Institutional Review Board Statement
Informed Consent Statement
Data Availability Statement
Acknowledgments
Conflicts of Interest
Appendix A


| Protein Name | ICU A+B+N vs. Control | ICU A+B+N vs. NW | NW vs. Control | ICU A vs. ICU B | ICU B vs. NW |
|---|---|---|---|---|---|
| Tubulin-specific chaperone A | ↑ | ↑ | |||
| Protein disulfide-isomerase | ↑ | ↑ | ↑ | ||
| Heat shock protein HSP 90-alpha | ↑↑ | ↑ | ↑ | ↑ | |
| Heat shock protein HSP 90-beta | ↑↑ | ↑ | ↑ | ||
| Heat shock 70 kDa protein 1B | ↑↑ | ↑ | ↑ | ||
| 60 kDa heat shock protein, mitochondrial | ↑ | ↑ | ↑ | ||
| Clusterin | ↑ | ||||
| Endoplasmic reticulum chaperone BiP | ↑ | ↑ | |||
| Heat shock cognate 71 kDa protein | ↑ | ↑ | ↑ | ||
| Protein disulfide-isomerase A4 | ↑ | ↑ | ↑ | ↑ | |
| Endoplasmin | ↑ | ↑ | ↑ | ↑ | |
| T-complex protein 1 subunit alpha | ↑ | ↑ | ↑ | ↑ | |
| Peptidyl-prolyl cis-trans isomerase B | ↑ | ↑ | |||
| Peptidyl-prolyl cis-trans isomerase FKBP2 | ↑ | ↑ | |||
| Calreticulin | ↑ | ↑ | ↑ | ↑ | |
| Endoplasmic reticulum resident protein 29 | ↑ | ↑ | |||
| Protein disulfide-isomerase A3 | ↑ | ↑ | |||
| Stress-induced phosphoprotein 1 | ↑ | ↑ | ↑ | ↑ | |
| Heat shock 70 kDa protein 4 | ↑ | ||||
| Stress-70 protein, mitochondrial | ↑ | ↑ | ↑ | ↑ | |
| T-complex protein 1 subunit zeta | ↑ | ↑ | |||
| T-complex protein 1 subunit epsilon | ↑ | ||||
| T-complex protein 1 subunit gamma | ↑ | ↑ | ↑ | ||
| T-complex protein 1 subunit theta | ↑ | ↑ | |||
| T-complex protein 1 subunit delta | ↑ | ↑ | |||
| 10 kDa heat shock protein, mitochondrial | ↑↑ | ↑ | ↑ | ↑ | |
| Peptidyl-prolyl cis-trans isomerase A | ↑ | ↑ | |||
| T-complex protein 1 subunit beta | ↑ | ↑ | ↑ | ||
| Peroxiredoxin-4 | ↑ | ↑ | |||
| Peptidyl-prolyl cis-trans isomerase FKBP5 | ↑↑ | ↑ | ↑ | ↑ | |
| Protein disulfide-isomerase A5 | ↓↓ | ↓ | |||
| LRP chaperone MESD | ↑ | ↑ | |||
| Protein disulfide-isomerase A6 | ↑ | ↑ | ↑ | ↑ | |
| Hsp90 co-chaperone Cdc37 | ↑ | ||||
| Thioredoxin domain-containing protein 5 | ↑ | ↑ | |||
| T-complex protein 1 subunit eta | ↑ | ↑ | |||
| Endoplasmic reticulum resident protein 44 | ↑ | ↑ | |||
| Protein unc-45 homolog A | ↑ | ||||
| UDP-glucose:glycoprotein glucosyltransferase 1 | ↑ | ↑ | |||
| Beta-2-microglobulin | ↓ | ||||
| Heat shock protein 105 kDa | ↑ | ↑ | |||
| DnaJ homolog subfamily B member 11 | ↑ | ↑ |
References
- Machlus, K.R.; Italiano, J.E., Jr. The incredible journey: From megakaryocyte development to platelet formation. J. Cell Biol. 2013, 201, 785–796. [Google Scholar] [CrossRef] [PubMed]
- Kapur, R.; Zufferey, A.; Boilard, E.; Semple, J.W. Nouvelle cuisine: Platelets served with inflammation. J. Immunol. 2015, 194, 5579–5587. [Google Scholar] [CrossRef] [PubMed]
- Noisakran, S.; Gibbons, R.V.; Songprakhon, P.; Jairungsri, A.; Ajariyakhajorn, C.; Nisalak, A.; Jarman, R.G.; Malasit, P.; Chokephaibulkit, K.; Perng, G.C. Detection of dengue virus in platelets isolated from dengue patients. S. Asian J. Trop. Med. Public. Health 2009, 40, 253–262. [Google Scholar]
- Koupenova, M.; Corkrey, H.A.; Vitseva, O.; Manni, G.; Pang, C.J.; Clancy, L.; Yao, C.; Rade, J.; Levy, D.; Wang, J.P.; et al. The role of platelets in mediating a response to human influenza infection. Nat. Commun. 2019, 10, 1780. [Google Scholar] [CrossRef] [PubMed]
- Van der Meide, P.H.; Schellekens, H. Cytokines and the immune response. Biotherapy 1996, 8, 243–249. [Google Scholar] [CrossRef] [PubMed]
- Meyers, K.M.; Holmsen, H.; Seachord, C.L. Comparative study of platelet dense granule constituents. Am. J. Physiol. 1982, 243, R454–R461. [Google Scholar] [CrossRef]
- Rendu, F.; Brohard-Bohn, B. The platelet release reaction: Granules’ constituents, secretion and functions. Platelets 2001, 12, 261–273. [Google Scholar] [CrossRef]
- Tang, Y.Q.; Yeaman, M.R.; Selsted, M.E. Antimicrobial peptides from human platelets. Infect. Immun. 2002, 70, 6524–6533. [Google Scholar] [CrossRef]
- Zawrotniak, M.; Rapala-Kozik, M. Neutrophil extracellular traps (NETs)—Formation and implications. Acta Biochim. Pol. 2013, 60, 277–284. [Google Scholar] [CrossRef]
- Rohlfing, A.K.; Rath, D.; Geisler, T.; Gawaz, M. Platelets and COVID-19. Hamostaseologie 2021, 41, 379–385. [Google Scholar] [CrossRef]
- Zaid, Y.; Puhm, F.; Allaeys, I.; Naya, A.; Oudghiri, M.; Khalki, L.; Limami, Y.; Zaid, N.; Sadki, K.; Ben El Haj, R.; et al. Platelets Can Associate with SARS-CoV-2 RNA and Are Hyperactivated in COVID-19. Circ. Res. 2020, 127, 1404–1418. [Google Scholar] [CrossRef] [PubMed]
- Le Joncour, A.; Biard, L.; Vautier, M.; Bugaut, H.; Mekinian, A.; Maalouf, G.; Vieira, M.; Marcelin, A.G.; Rosenzwajg, M.; Klatzmann, D.; et al. Neutrophil-Platelet and Monocyte-Platelet Aggregates in COVID-19 Patients. Thromb. Haemost. 2020, 120, 1733–1735. [Google Scholar] [CrossRef]
- Middleton, E.A.; He, X.Y.; Denorme, F.; Campbell, R.A.; Ng, D.; Salvatore, S.P.; Mostyka, M.; Baxter-Stoltzfus, A.; Borczuk, A.C.; Loda, M.; et al. Neutrophil extracellular traps contribute to immunothrombosis in COVID-19 acute respiratory distress syndrome. Blood 2020, 136, 1169–1179. [Google Scholar] [CrossRef] [PubMed]
- Yang, X.; Yang, Q.; Wang, Y.; Wu, Y.; Xu, J.; Yu, Y.; Shang, Y. Thrombocytopenia and its association with mortality in patients with COVID-19. J. Thromb. Haemost. 2020, 18, 1469–1472. [Google Scholar] [CrossRef] [PubMed]
- Wolny, M.; Dittrich, M.; Knabbe, C.; Birschmann, I. Immature platelets in COVID-19. Platelets 2023, 34, 2184183. [Google Scholar] [CrossRef] [PubMed]
- Manne, B.K.; Denorme, F.; Middleton, E.A.; Portier, I.; Rowley, J.W.; Stubben, C.; Petrey, A.C.; Tolley, N.D.; Guo, L.; Cody, M.; et al. Platelet gene expression and function in patients with COVID-19. Blood 2020, 136, 1317–1329. [Google Scholar] [CrossRef]
- Comer, S.P.; Cullivan, S.; Szklanna, P.B.; Weiss, L.; Cullen, S.; Kelliher, S.; Smolenski, A.; Murphy, C.; Altaie, H.; Curran, J.; et al. COVID-19 induces a hyperactive phenotype in circulating platelets. PLoS Biol. 2021, 19, e3001109. [Google Scholar] [CrossRef]
- Apostolidis, S.A.; Sarkar, A.; Giannini, H.M.; Goel, R.R.; Mathew, D.; Suzuki, A.; Baxter, A.E.; Greenplate, A.R.; Alanio, C.; Abdel-Hakeem, M.; et al. Signaling Through FcgammaRIIA and the C5a-C5aR Pathway Mediate Platelet Hyperactivation in COVID-19. Front. Immunol. 2022, 13, 834988. [Google Scholar] [CrossRef]
- Barrett, T.J.; Bilaloglu, S.; Cornwell, M.; Burgess, H.M.; Virginio, V.W.; Drenkova, K.; Ibrahim, H.; Yuriditsky, E.; Aphinyanaphongs, Y.; Lifshitz, M.; et al. Platelets contribute to disease severity in COVID-19. J. Thromb. Haemost. 2021, 19, 3139–3153. [Google Scholar] [CrossRef]
- Trugilho, M.R.O.; Azevedo-Quintanilha, I.G.; Gesto, J.S.M.; Moraes, E.C.S.; Mandacaru, S.C.; Campos, M.M.; Oliveira, D.M.; Dias, S.S.G.; Bastos, V.A.; Santos, M.D.M.; et al. Platelet proteome reveals features of cell death, antiviral response and viral replication in COVID-19. Cell Death Discov. 2022, 8, 324. [Google Scholar] [CrossRef]
- Goudswaard, L.J.; Williams, C.M.; Khalil, J.; Burley, K.L.; Hamilton, F.; Arnold, D.; Milne, A.; Lewis, P.A.; Heesom, K.J.; Mundell, S.J.; et al. Alterations in platelet proteome signature and impaired platelet integrin αIIbβ3 activation in patients with COVID-19. J. Thromb. Haemost. 2023, 21, 1307–1321. [Google Scholar] [CrossRef] [PubMed]
- Ercan, H.; Schrottmaier, W.C.; Pirabe, A.; Schmuckenschlager, A.; Pereyra, D.; Santol, J.; Pawelka, E.; Traugott, M.T.; Schorgenhofer, C.; Seitz, T.; et al. Platelet Phenotype Analysis of COVID-19 Patients Reveals Progressive Changes in the Activation of Integrin alphaIIbbeta3, F13A1, the SARS-CoV-2 Target EIF4A1 and Annexin A5. Front. Cardiovasc. Med. 2021, 8, 779073. [Google Scholar] [CrossRef] [PubMed]
- Kloka, J.A.; Blum, L.V.; Old, O.; Zacharowski, K.; Friedrichson, B. Characteristics and mortality of 561,379 hospitalized COVID-19 patients in Germany until December 2021 based on real-life data. Sci. Rep. 2022, 12, 11116. [Google Scholar] [CrossRef] [PubMed]
- Birschmann, I.; Mietner, S.; Dittrich, M.; Pfrang, J.; Dandekar, T.; Walter, U. Use of functional highly purified human platelets for the identification of new proteins of the IPP signaling pathway. Thromb. Res. 2008, 122, 59–68. [Google Scholar] [CrossRef]
- Bradford, M.M. A rapid and sensitive method for the quantitation of microgram quantities of protein utilizing the principle of protein-dye binding. Anal. Biochem. 1976, 72, 248–254. [Google Scholar] [CrossRef]
- Plum, S.; Helling, S.; Theiss, C.; Leite, R.E.P.; May, C.; Jacob-Filho, W.; Eisenacher, M.; Kuhlmann, K.; Meyer, H.E.; Riederer, P.; et al. Combined enrichment of neuromelanin granules and synaptosomes from human substantia nigra pars compacta tissue for proteomic analysis. J. Proteom. 2013, 94, 202–206. [Google Scholar] [CrossRef]
- May, C.; Serschnitzki, B.; Marcus, K. Good Old-Fashioned Protein Concentration Determination by Amino Acid Analysis. Methods Mol. Biol. 2021, 2228, 21–28. [Google Scholar] [CrossRef]
- Rozanova, S.; Uszkoreit, J.; Schork, K.; Serschnitzki, B.; Eisenacher, M.; Tönges, L.; Barkovits-Boeddinghaus, K.; Marcus, K. Quality Control—A Stepchild in Quantitative Proteomics: A Case Study for the Human CSF Proteome. Biomolecules 2023, 13, 491. [Google Scholar]
- Berthold, M.R.; Cebron, N.; Dill, F.; Gabriel, T.R.; Kötter, T.; Meinl, T.; Ohl, P.; Sieb, C.; Thiel, K.; Wiswedel, B. KNIME: The Konstanz Information Miner. In Proceedings of the Data Analysis, Machine Learning and Applications; Springer: Berlin, Germany, 2008; pp. 319–326. [Google Scholar]
- Perez-Riverol, Y.; Csordas, A.; Bai, J.; Bernal-Llinares, M.; Hewapathirana, S.; Kundu, D.J.; Inuganti, A.; Griss, J.; Mayer, G.; Eisenacher, M.; et al. The PRIDE database and related tools and resources in 2019: Improving support for quantification data. Nucleic Acids Res. 2019, 47, D442–D450. [Google Scholar] [CrossRef]
- Uszkoreit, J.; Winkelhardt, D.; Barkovits, K.; Wulf, M.; Roocke, S.; Marcus, K.; Eisenacher, M. MaCPepDB: A Database to Quickly Access All Tryptic Peptides of the UniProtKB. J. Proteome Res. 2021, 20, 2145–2150. [Google Scholar] [CrossRef]
- UniProt, C. UniProt: The universal protein knowledgebase in 2021. Nucleic Acids Res. 2021, 49, D480–D489. [Google Scholar] [CrossRef]
- Cox, J.; Hein, M.Y.; Luber, C.A.; Paron, I.; Nagaraj, N.; Mann, M. Accurate proteome-wide label-free quantification by delayed normalization and maximal peptide ratio extraction, termed MaxLFQ. Mol. Cell Proteom. 2014, 13, 2513–2526. [Google Scholar] [CrossRef] [PubMed]
- Tyanova, S.; Temu, T.; Sinitcyn, P.; Carlson, A.; Hein, M.Y.; Geiger, T.; Mann, M.; Cox, J. The Perseus computational platform for comprehensive analysis of (prote)omics data. Nat. Methods 2016, 13, 731–740. [Google Scholar] [CrossRef] [PubMed]
- Zhou, Y.; Zhou, B.; Pache, L.; Chang, M.; Khodabakhshi, A.H.; Tanaseichuk, O.; Benner, C.; Chanda, S.K. Metascape provides a biologist-oriented resource for the analysis of systems-level datasets. Nat. Commun. 2019, 10, 1523. [Google Scholar] [CrossRef] [PubMed]
- Shannon, P.; Markiel, A.; Ozier, O.; Baliga, N.S.; Wang, J.T.; Ramage, D.; Amin, N.; Schwikowski, B.; Ideker, T. Cytoscape: A software environment for integrated models of biomolecular interaction networks. Genome Res. 2003, 13, 2498–2504. [Google Scholar] [CrossRef]
- Szklarczyk, D.; Gable, A.L.; Lyon, D.; Junge, A.; Wyder, S.; Huerta-Cepas, J.; Simonovic, M.; Doncheva, N.T.; Morris, J.H.; Bork, P.; et al. STRING v11: Protein–protein association networks with increased coverage, supporting functional discovery in genome-wide experimental datasets. Nucleic Acids Res. 2019, 47, D607–D613. [Google Scholar] [CrossRef]
- Ramirez-Soto, M.C.; Ortega-Caceres, G.; Arroyo-Hernandez, H. Sex differences in COVID-19 fatality rate and risk of death: An analysis in 73 countries, 2020-2021. Infez. Med. 2021, 29, 402–407. [Google Scholar] [CrossRef]
- Koupenova, M.; Corkrey, H.A.; Vitseva, O.; Tanriverdi, K.; Somasundaran, M.; Liu, P.; Soofi, S.; Bhandari, R.; Godwin, M.; Parsi, K.M.; et al. SARS-CoV-2 Initiates Programmed Cell Death in Platelets. Circ. Res. 2021, 129, 631–646. [Google Scholar] [CrossRef]
- Shu, T.; Ning, W.; Wu, D.; Xu, J.; Han, Q.; Huang, M.; Zou, X.; Yang, Q.; Yuan, Y.; Bie, Y.; et al. Plasma Proteomics Identify Biomarkers and Pathogenesis of COVID-19. Immunity 2020, 53, 1108–1122.e5. [Google Scholar] [CrossRef]
- Lee, J.S.; Han, D.; Kim, S.Y.; Hong, K.H.; Jang, M.J.; Kim, M.J.; Kim, Y.G.; Park, J.H.; Cho, S.I.; Park, W.B.; et al. Longitudinal proteomic profiling provides insights into host response and proteome dynamics in COVID-19 progression. Proteomics 2021, 21, e2000278. [Google Scholar] [CrossRef]
- Tripp, B.C.; Smith, K.; Ferry, J.G. Carbonic Anhydrase: New Insights for an Ancient Enzyme*210. J. Biol. Chem. 2001, 276, 48615–48618. [Google Scholar] [CrossRef]
- Suvarna, K.; Biswas, D.; Pai, M.G.J.; Acharjee, A.; Bankar, R.; Palanivel, V.; Salkar, A.; Verma, A.; Mukherjee, A.; Choudhury, M.; et al. Proteomics and Machine Learning Approaches Reveal a Set of Prognostic Markers for COVID-19 Severity with Drug Repurposing Potential. Front. Physiol. 2021, 12, 652799. [Google Scholar] [CrossRef] [PubMed]
- Deniz, S.; Uysal, T.K.; Capasso, C.; Supuran, C.T.; Ozensoy Guler, O. Is carbonic anhydrase inhibition useful as a complementary therapy of COVID-19 infection? J. Enzym. Inhib. Med. Chem. 2021, 36, 1230–1235. [Google Scholar] [CrossRef] [PubMed]
- Trugilho, M.R.d.O.; Hottz, E.D.; Brunoro, G.V.F.; Teixeira-Ferreira, A.; Carvalho, P.C.; Salazar, G.A.; Zimmerman, G.A.; Bozza, F.A.; Bozza, P.T.; Perales, J. Platelet proteome reveals novel pathways of platelet activation and platelet-mediated immunoregulation in dengue. PLoS Pathog. 2017, 13, e1006385. [Google Scholar] [CrossRef]
- Liu, J.; Li, J.; Deng, X. Proteomic analysis of differential protein expression in platelets of septic patients. Mol. Biol. Rep. 2014, 41, 3179–3185. [Google Scholar] [CrossRef]
- Zimlichman, S.; Danon, A.; Nathan, I.; Mozes, G.; Shainkin-Kestenbaum, R. Serum Amyloid A, an Acute Phase Protein, Inhibits Platelet Activation. In Amyloid and Amyloidosis 1990, Proceedings of the VIth International Symposium on Amyloidosis Oslo, Norway, 5–8 August 1990; Natvig, J.B., Førre, Ø., Husby, G., Husebekk, A., Skogen, B., Sletten, K., Westermark, P., Eds.; Springer: Dordrecht, The Netherlands, 1991; pp. 133–134. [Google Scholar]
- Urieli-Shoval, S.; Shubinsky, G.; Linke, R.P.; Fridkin, M.; Tabi, I.; Matzner, Y. Adhesion of human platelets to serum amyloid A. Blood 2002, 99, 1224–1229. [Google Scholar] [CrossRef] [PubMed]
- Eisenhardt, S.U.; Habersberger, J.; Peter, K. Monomeric C-reactive protein generation on activated platelets: The missing link between inflammation and atherothrombotic risk. Trends Cardiovasc. Med. 2009, 19, 232–237. [Google Scholar] [CrossRef] [PubMed]
- Boncler, M.; Rywaniak, J.; Szymanski, J.; Potempa, L.A.; Rychlik, B.; Watala, C. Modified C-reactive protein interacts with platelet glycoprotein Ibalpha. Pharmacol. Rep. 2011, 63, 464–475. [Google Scholar] [CrossRef]
- Baker, C.; Belbin, O.; Kalsheker, N.; Morgan, K. SERPINA3 (aka alpha-1-antichymotrypsin). Front. Biosci. 2007, 12, 2821–2835. [Google Scholar] [CrossRef]
- Selak, M.A.; Chignard, M.; Smith, J.B. Cathepsin G is a strong platelet agonist released by neutrophils. Biochem. J. 1988, 251, 293–299. [Google Scholar] [CrossRef]
- Akkerman, J.W.; Holmsen, H.; Loughnane, M. Simultaneous measurement of aggregation, secretion, oxygen uptake, proton production, and intracellular metabolites in the same platelet suspension. Anal. Biochem. 1979, 97, 387–393. [Google Scholar] [CrossRef] [PubMed]
- Jakubowski, M.; Szahidewicz-Krupska, E.; Doroszko, A. The Human Carbonic Anhydrase II in Platelets: An Underestimated Field of Its Activity. Biomed. Res. Int. 2018, 2018, 4548353. [Google Scholar] [CrossRef] [PubMed]
- Agbani, E.O.; Zhao, X.; Williams, C.M.; Aungraheeta, R.; Hers, I.; Swenson, E.R.; Poole, A.W. Carbonic Anhydrase Inhibitors suppress platelet procoagulant responses and in vivo thrombosis. Platelets 2020, 31, 853–859. [Google Scholar] [CrossRef] [PubMed]
- Huang, Z.; Richmond, T.D.; Muntean, A.G.; Barber, D.L.; Weiss, M.J.; Crispino, J.D. STAT1 promotes megakaryopoiesis downstream of GATA-1 in mice. J. Clin. Investig. 2007, 117, 3890–3899. [Google Scholar] [CrossRef]
- Schulze, H.; Ballmaier, M.; Welte, K.; Germeshausen, M. Thrombopoietin induces the generation of distinct Stat1, Stat3, Stat5a and Stat5b homo- and heterodimeric complexes with different kinetics in human platelets. Exp. Hematol. 2000, 28, 294–304. [Google Scholar] [CrossRef]
- Weyrich, A.S.; Schwertz, H.; Kraiss, L.W.; Zimmerman, G.A. Protein synthesis by platelets: Historical and new perspectives. J. Thromb. Haemost. 2009, 7, 241–246. [Google Scholar] [CrossRef]
- Dittrich, M.; Birschmann, I.; Pfrang, J.; Herterich, S.; Smolenski, A.; Walter, U.; Dandekar, T. Analysis of SAGE data in human platelets: Features of the transcriptome in an anucleate cell. Thromb. Haemost. 2006, 95, 643–651. [Google Scholar] [CrossRef]
- Moraes, L.A.; Paul-Clark, M.J.; Rickman, A.; Flower, R.J.; Goulding, N.J.; Perretti, M. Ligand-specific glucocorticoid receptor activation in human platelets. Blood 2005, 106, 4167–4175. [Google Scholar] [CrossRef]
- Liverani, E.; Banerjee, S.; Roberts, W.; Naseem, K.M.; Perretti, M. Prednisolone exerts exquisite inhibitory properties on platelet functions. Biochem. Pharmacol. 2012, 83, 1364–1373. [Google Scholar] [CrossRef]
- Dhawan, L.; Liu, B.; Blaxall, B.C.; Taubman, M.B. A novel role for the glucocorticoid receptor in the regulation of monocyte chemoattractant protein-1 mRNA stability. J. Biol. Chem. 2007, 282, 10146–10152. [Google Scholar] [CrossRef]
- European Medicines Agency. EMA Endorses Use of Dexamethasone in COVID-19 Patients on Oxygen or Mechanical Ventilation. Available online: https://www.ema.europa.eu/en/documents/press-release/ema-endorses-use-dexamethasone-covid-19-patients-oxygen-mechanical-ventilation_en.pdf (accessed on 28 August 2023).
- National Institutes of Health. COVID-19 Treatment Guidelines Panel. Coronavirus Disease 2019 (COVID-19) Treatment Guidelines. Available online: https://www.covid19treatmentguidelines.nih.gov/ (accessed on 28 August 2023).
- Praituan, W.; Rojnuckarin, P. Faster platelet recovery by high-dose dexamethasone compared with standard-dose prednisolone in adult immune thrombocytopenia: A prospective randomized trial. J. Thromb. Haemost. 2009, 7, 1036–1038. [Google Scholar] [CrossRef] [PubMed]
- Gobbi, G.; Carubbi, C.; Tagliazucchi, G.M.; Masselli, E.; Mirandola, P.; Pigazzani, F.; Crocamo, A.; Notarangelo, M.F.; Suma, S.; Paraboschi, E.; et al. Sighting acute myocardial infarction through platelet gene expression. Sci. Rep. 2019, 9, 19574. [Google Scholar] [CrossRef] [PubMed]
- Chambraud, B.; Belabes, H.; Fontaine-Lenoir, V.; Fellous, A.; Baulieu, E.E. The immunophilin FKBP52 specifically binds to tubulin and prevents microtubule formation. FASEB J. 2007, 21, 2787–2797. [Google Scholar] [CrossRef] [PubMed]
- Cuenca-Zamora, E.J.; Ferrer-Marin, F.; Rivera, J.; Teruel-Montoya, R. Tubulin in Platelets: When the Shape Matters. Int. J. Mol. Sci. 2019, 20, 3484. [Google Scholar] [CrossRef]
- Bouwmeester, T.; Bauch, A.; Ruffner, H.; Angrand, P.O.; Bergamini, G.; Croughton, K.; Cruciat, C.; Eberhard, D.; Gagneur, J.; Ghidelli, S.; et al. A physical and functional map of the human TNF-alpha/NF-kappa B signal transduction pathway. Nat. Cell Biol. 2004, 6, 97–105. [Google Scholar] [CrossRef]
- Erlejman, A.G.; De Leo, S.A.; Mazaira, G.I.; Molinari, A.M.; Camisay, M.F.; Fontana, V.; Cox, M.B.; Piwien-Pilipuk, G.; Galigniana, M.D. NF-kappaB transcriptional activity is modulated by FK506-binding proteins FKBP51 and FKBP52: A role for peptidyl-prolyl isomerase activity. J. Biol. Chem. 2014, 289, 26263–26276. [Google Scholar] [CrossRef]
- Paul, M.; Kemparaju, K.; Girish, K.S. Inhibition of constitutive NF-kappaB activity induces platelet apoptosis via ER stress. Biochem. Biophys. Res. Commun. 2017, 493, 1471–1477. [Google Scholar] [CrossRef]
- Malaver, E.; Romaniuk, M.A.; D’Atri, L.P.; Pozner, R.G.; Negrotto, S.; Benzadon, R.; Schattner, M. NF-kappaB inhibitors impair platelet activation responses. J. Thromb. Haemost. 2009, 7, 1333–1343. [Google Scholar] [CrossRef]
- Gambaryan, S.; Kobsar, A.; Rukoyatkina, N.; Herterich, S.; Geiger, J.; Smolenski, A.; Lohmann, S.M.; Walter, U. Thrombin and Collagen Induce a Feedback Inhibitory Signaling Pathway in Platelets Involving Dissociation of the Catalytic Subunit of Protein Kinase A from an NFκB-IκB Complex*. J. Biol. Chem. 2010, 285, 18352–18363. [Google Scholar] [CrossRef]
- Rivadeneyra, L.; Carestia, A.; Etulain, J.; Pozner, R.G.; Fondevila, C.; Negrotto, S.; Schattner, M. Regulation of platelet responses triggered by Toll-like receptor 2 and 4 ligands is another non-genomic role of nuclear factor-kappaB. Thromb. Res. 2014, 133, 235–243. [Google Scholar] [CrossRef]
- Jerez-Dolz, D.; Torramade-Moix, S.; Palomo, M.; Moreno-Castano, A.; Lopez-Vilchez, I.; Hernandez, R.; Badimon, J.J.; Zafar, M.U.; Diaz-Ricart, M.; Escolar, G. Internalization of microparticles by platelets is partially mediated by toll-like receptor 4 and enhances platelet thrombogenicity. Atherosclerosis 2020, 294, 17–24. [Google Scholar] [CrossRef] [PubMed]
- Barberis, E.; Vanella, V.V.; Falasca, M.; Caneapero, V.; Cappellano, G.; Raineri, D.; Ghirimoldi, M.; De Giorgis, V.; Puricelli, C.; Vaschetto, R.; et al. Circulating Exosomes Are Strongly Involved in SARS-CoV-2 Infection. Front. Mol. Biosci. 2021, 8, 632290. [Google Scholar] [CrossRef] [PubMed]

| ICU (A+B+N) | NW | Control | |
|---|---|---|---|
| n | 19 | 5 | 16 |
| age, median (range) [a] | 62 (46–81) | 61 (46–69) | 61.5 (48–70) |
| male, n (%) | 19 (100.0) | 5 (100.0) | 16 (100.0) |
| Platelet count on sampling, median (range) (109/L) | 164 (25–309) | 243 (213–253) | 285.5 (179–414) |
| immature platelet fraction on sampling, median (range) (%) | 6.1 (2.7–11.5) | 2.0 (0.9–4.7) | 3.4 (1.6–14.3) |
| Hospitalization | |||
| total stay, median (range) (d) | 30 (4–113) | 51 (35–78) | |
| ICU, median (range) (d) | 24 (4–113) | 34 (24–63) | NA |
| NW, median (range) (d) | 12.5 (6–26) | 15 (6–26) | |
| Outcome at discharge | |||
| deceased, n (%) | 11 (57.9) | 0 (0.0) | |
| improved, n(%) | 6 (31.6) | 5 (100.0) | NA |
| unknown, n(%) | 2 (10.5) | 0 (0.0) | |
| Comorbidities | |||
| adipositas, n (%) | 7 (36.8) | 2 (40.0) | |
| hypertension, n (%) | 12 (63.2) | 3 (60.0) | |
| hyperlipoproteinemia, n (%) | 4 (21.1) | 1 (20.0) | |
| diabetes mellitus type II, n (%) | 7 (36.8) | 2 (40.0) | NA |
| cardiac disease, n (%) | 11 (57.9) | 3 (60.0) | |
| COPD, n (%) | 2 (10.5) | 0 (0.0) | |
| renal insufficiency, n (%) | 5 (26.3) | 1 (20.0) | |
| Treatment | |||
| invasive mechanical ventilation, n (%) | 18 (94.7) | 5 (100.0) | |
| ECMO, n (%) | 13 (68.4) | 2 (40.0) | |
| ECMO duration, mean (d) | 17.5 | 9.4 | |
| convalescent plasma, n (%) | 7 (36.8) | 2 (40.0) | NA |
| platelet concentrate, n (%) | 14 (73.7) | 1 (20.0) | |
| platelet concentrate number, mean | 4.5 | 0.4 | |
| dexamethasone, n (%) | 11 (57.9) | 0 (0.0) | |
| Laboratory findings on admission | |||
| leukocytes, median (range) (109/L) | 12.3 (4.1–46.0) | 10.1 (4.1–18.9) | |
| erythrocytes, median (range) (1012/L) | 3.6 (3.0–5.0) | 4.34 (3.73–5.04) | |
| platelets, median (range) (109/L) | 210 (73–770) | 188 (126–331) | |
| CRP, median (range) (mg/dL) | 19.0 (4.7–53.0) | 14.0 (9.2–26.0) | |
| IL-6, median (range) (pg/mL) | 116 (26–938) | 88 (46–143) | NA |
| fibrinogen, median (range) (mg/dL) | 624 (286–900) | 543 (286–624) | |
| d-dimer, median (range) (mg/L) | 3.5 (0.6–35.2) | 2.3 (0.6–35.2) | |
| PTT, median (range) (s) | 29 (23–200) | 25 (23–46) | |
| INR, median (range) | 1.1 (1.0–1.9) | 1 (1.0–1.9) |
| Patient Group | Relevant Processes | Protein (Gene Name) |
|---|---|---|
| Control, NW | Glycogen metabolism | PPP1R3E |
| Signaling, trafficking | CD63 | |
| Control, NW, ICU B | Signaling, trafficking, cell cycle regulation | PAPSS2, RGS7, CDK3, RAB30, PLEKHF2 |
| Focal adhesion | TNS1 | |
| ICU A+B | Acute phase | SAA1, SAA2, ORM1 |
| Antiviral response | OAS2, OAS3, PARP9, PIK3R1, DDX58 | |
| Ribosomal proteins | RPL12, RPS14, RPS4X, RPS3A | |
| Apoptosis and inflammation | PYCARD, STAT2 | |
| Nucleotide synthesis | CMPK2 | |
| Metabolism | PPT1, TFRC, BCKDK, ATP6V1D, GATM | |
| Binding activity regulation | OLFML2A, LGAL | |
| ICU A+B, NW | Acute phase, defense response | CRP, APOD, LGALS3BP, ITIH3, IGHG3, IGHM, IGKV3D-20 |
| Protein folding | FKBP4, CCDC47 | |
| Ribosomal proteins | RPS3, RPS7, RPL18, RPS18, RPS28 | |
| Cell death | CD274, HTATIP2, S100A8 | |
| Erythrocyte | CA1 | |
| Nucleic acid binding | YBX1, UBAP2L, SERBP1, PRKAR1B | |
| Metabolism | OPLAH, CP | |
| Other | ECHDC1, MAP1B, PITPNM2 |
Disclaimer/Publisher’s Note: The statements, opinions and data contained in all publications are solely those of the individual author(s) and contributor(s) and not of MDPI and/or the editor(s). MDPI and/or the editor(s) disclaim responsibility for any injury to people or property resulting from any ideas, methods, instructions or products referred to in the content. |
© 2023 by the authors. Licensee MDPI, Basel, Switzerland. This article is an open access article distributed under the terms and conditions of the Creative Commons Attribution (CC BY) license (https://creativecommons.org/licenses/by/4.0/).
Share and Cite
Wolny, M.; Rozanova, S.; Knabbe, C.; Pfeiffer, K.; Barkovits, K.; Marcus, K.; Birschmann, I. Changes in the Proteome of Platelets from Patients with Critical Progression of COVID-19. Cells 2023, 12, 2191. https://doi.org/10.3390/cells12172191
Wolny M, Rozanova S, Knabbe C, Pfeiffer K, Barkovits K, Marcus K, Birschmann I. Changes in the Proteome of Platelets from Patients with Critical Progression of COVID-19. Cells. 2023; 12(17):2191. https://doi.org/10.3390/cells12172191
Chicago/Turabian StyleWolny, Monika, Svitlana Rozanova, Cornelius Knabbe, Kathy Pfeiffer, Katalin Barkovits, Katrin Marcus, and Ingvild Birschmann. 2023. "Changes in the Proteome of Platelets from Patients with Critical Progression of COVID-19" Cells 12, no. 17: 2191. https://doi.org/10.3390/cells12172191