Article

Overexpression of FRA1 (FOSL1) Leads to Global Transcriptional Perturbations, Reduced Cellular Adhesion and Altered Cell Cycle Progression

1
School of Natural Sciences, Laurentian University, Sudbury, ON P3E 2C6, Canada
2
Medical Sciences Division, NOSM University, 935 Ramsey Lake Rd., Sudbury, ON P3E 2C6, Canada
3
Medical Sciences Division, NOSM University, 955 Oliver Rd., Thunder Bay, ON P7B 5E1, Canada
4
Department of Biology, Lakehead University, Thunder Bay, ON P7B 5E1, Canada
5
Department of Radiation Oncology, Radiation and Cancer Biology Laboratories, Indiana University School of Medicine, Indianapolis, IN 46202, USA
6
Department of Medical & Molecular Genetics, Indiana University School of Medicine, Indianapolis, IN 46202, USA
7
Health Sciences North Research Institute, Sudbury, ON P3E 2H2, Canada
*
Author to whom correspondence should be addressed.
Cells 2023, 12(19), 2344; https://doi.org/10.3390/cells12192344
Submission received: 19 August 2023 / Revised: 18 September 2023 / Accepted: 21 September 2023 / Published: 24 September 2023
(This article belongs to the Section Cell Signaling)

Abstract

:
FRA1 (FOSL1) is a transcription factor and a member of the activator protein-1 superfamily. FRA1 is expressed in most tissues at low levels, and its expression is robustly induced in response to extracellular signals, leading to downstream cellular processes. However, abnormal FRA1 overexpression has been reported in various pathological states, including tumor progression and inflammation. To date, the molecular effects of FRA1 overexpression are still not understood. Therefore, the aim of this study was to investigate the transcriptional and functional effects of FRA1 overexpression using the CGL1 human hybrid cell line. FRA1-overexpressing CGL1 cells were generated using stably integrated CRISPR-mediated transcriptional activation, resulting in a 2–3 fold increase in FRA1 mRNA and protein levels. RNA-sequencing identified 298 differentially expressed genes with FRA1 overexpression. Gene ontology analysis showed numerous molecular networks enriched with FRA1 overexpression, including transcription-factor binding, regulation of the extracellular matrix and adhesion, and a variety of signaling processes, including protein kinase activity and chemokine signaling. In addition, cell functional assays demonstrated reduced cell adherence to fibronectin and collagen with FRA1 overexpression and altered cell cycle progression. Taken together, this study unravels the transcriptional response mediated by FRA1 overexpression and establishes the role of FRA1 in adhesion and cell cycle progression.

1. Introduction

Fos-related antigen 1 (FRA1) is a transcription factor encoded by the FOSL1 gene. FRA1 belongs to the activator protein complex 1 (AP-1) family of basic leucine zipper domain (bZIP)-containing transcription factors that regulate gene expression [1]. The AP-1 transcription factors mediate cellular differentiation, proliferation, and apoptosis in response to a variety of extracellular signals, including growth factors, oxidative stress responses, and inflammatory signals [1,2,3,4,5].
The core AP-1 complex consists of hetero- and homodimers of FOS and JUN families [6]. FRA1 is a member of the FOS family of proteins, which also includes c-FOS, FOSB, and FRA2. The JUN family includes c-JUN, JUNB, and JUND. The JUN subtypes form homo- or heterodimers with FOS members, whereas FOS members form heterodimers with JUN subtypes and are unable to homodimerize [1,7]. Other bZIP-containing accessory proteins of the AP-1 complex include members of the ATF, NRF, and MAF families of transcription factors [6].
The AP1 binding sites consist of TPA-responsive elements (TRE; 5′-TGAGCTCA-3′) and cyclic AMP response elements (CRE; 5′-TGACGTCA-3′) [8,9]. The AP-1 dimer composition plays an important role in determining which AP-1 binding sites are bound and transcriptionally active [10]. In addition, the AP-1 complex can bind degenerate sequences that are similar but not identical to the TRE and CRE binding sites [11]. Therefore, the AP-1 transcriptional response is complex and depends on the balance between the AP-1-binding subtypes, which are, in turn, regulated by multiple signaling pathways [12]. The most studied AP-1 complex consists of c-JUN/c-FOS heterodimers [13,14]. However, the role of FRA1 in the AP-1 transcriptional response is less established [2].
FRA1 is ubiquitously expressed in most tissues, including the liver, breast, lung, brain, heart, and bone [4,15,16,17,18,19]. At the cellular level, FRA1 is expressed in a variety of cell types, including fibroblasts, endothelial cells, epithelial cells, smooth muscle cells, macrophages, and osteoblasts [4,20,21,22,23,24]. Basal FRA1 expression is low in normal tissue states; however, FRA1 expression can be robustly induced in response to extracellular signals via MAPK/ERK signaling cascades [25,26,27]. In addition, the expression pattern of FRA1 can vary depending on the cell type and the stimulus [25,28]. For example, FRA1 expression is induced in epidermal keratinocytes in response to UV irradiation [29]. Similarly, TGF-β activation promotes FRA1 expression in fibroblasts and osteoblasts [30,31]. In contrast, SMAD4 suppresses FRA1 expression in pancreatic cells [32]. In addition to expression, phosphorylation of human FRA1 at Ser252, Ser265, and Thr230 improves FRA1 activity [33]. Here, phosphorylation prevents FRA1 degradation in proteasomes while also increasing its ability to dimerize with JUN members leading to activation of transcriptional responses [34,35]. Therefore, the downstream cellular effects of FRA1 expression and activity vary depending on the context and cell type. In normal tissues, FRA1 expression promotes a variety of cellular functions, including proliferation, differentiation, apoptosis, migration, and tissue development [36,37,38,39,40].
Abnormal FRA1 expression has been reported in various tumors, and its effect on tumor progression varies depending on the cancer type [12,41]. For example, FRA1 is often overexpressed in certain cancers, such as breast cancer, bladder cancer, liver carcinoma, thyroid tumors, gastric cancer, kidney cancer, osteosarcoma, gastrointestinal carcinoma, melanoma, and pancreatic cancer [36,41,42,43,44,45,46,47,48,49]. In these cancer types, FRA1 overexpression is positively correlated with tumor progression, invasion, and angiogenesis [36,41]. In contrast, FRA1 expression is downregulated in other cancer types, including non-small cell lung cancer and cervical cancer [50,51,52]. In these cancer types, FRA1 overexpression induces tumor-suppressive effects. In addition, we have previously shown that the FRA1 gene (FOSL1) was deleted or epigenetically silenced in ionizing radiation-induced neoplastic transformants using the CGL1 human hybrid cell line, a precancerous model of cervical cancer [53,54,55]. Here, reinsertion of the FRA1 gene in tumorigenic variants suppressed tumor formation in vivo. In addition to carcinogenesis, abnormal FRA1 expression has been linked to various inflammatory conditions [56,57,58]. Taken together, FRA1 expression can be both beneficial and detrimental depending on the context, and further research is needed to fully understand its role in various physiological and pathological processes.
The majority of studies implicating FRA1 overexpression with cancer progression utilize correlational approaches [41]. These tumor models contain several gene alterations that contribute to the cancer phenotype. Therefore, it is difficult to discern the molecular effects of FRA1 upregulation in this context. Thus, the primary aim of this study was to investigate the cellular and molecular effects of FRA1 overexpression using the CGL1 nontumorigenic cell model. The CGL1 cell line was created by the hybridization of HeLa, a tumorigenic human cervical cancer cell, and a nontumorigenic human-skin fibroblast [53,59]. The resulting hybrid CGL1 cells share transcriptional and phenotypic profiles with the parental nontumorigenic fibroblast cells [54,55,60]. More importantly, CGL1 cells do not form tumors when implanted in vivo but can be induced to form HeLa-like tumorigenic phenotype using high-dose radiation exposures [54,61,62]. Therefore, CGL1 cells are preneoplastic and nontumorigenic cells and have been extensively used for studying radiation-induced neoplastic transformation [53,54,55,59,63].
In this study, FRA1 was overexpressed in CGL1 cells using stably integrated CRISPR-mediated transcriptional activation (CRISPRa). The CRISPRa system consists of dead Cas9 (dCas9), a mutant form of the Streptococcus pyogenes Cas9 enzyme devoid of its endonuclease activity and fused to the potent VP64 transcriptional activator, and a guide RNA (gRNA) designed to target dCas9 to the gene of interest [64,65]. This system upregulates the endogenous gene within physiologically relevant levels, a method that has not been previously utilized in FRA1 studies [66]. Using the CRISPRa system, we have generated FRA1 overexpressing CGL1 cells (CGL1FRA1) that demonstrated a 2–3 fold increase in FRA1 mRNA and protein levels. The whole transcriptome RNA-sequencing (RNA-seq) analysis revealed that FRA1 overexpression resulted in 298 differentially expressed genes. Here, the expression of the core AP-1 complex members was dysregulated. Gene ontology analysis illustrated that FRA1 overexpression altered various molecular networks, including transcription-factor activity, regulation of extracellular matrix and cellular adhesion, and a variety of cell signaling processes, including protein tyrosine kinase activity, chemokine signaling, and G protein-coupled receptor activity. Moreover, cell adhesion and cell cycle functional assays were performed to corroborate the RNA-seq results. Indeed, FRA1 overexpression reduced cell adhesion and altered the cell cycle progression. Taken together, this study unravels numerous cellular and molecular changes mediated by FRA1 overexpression.

2. Material and Methods

2.1. Cell Culture

The CGL1 cells were cultured in Minimum Essential Medium (Corning, 10-010CV; Corning, New York, NY, USA), supplemented with 5% calf serum (Sigma-Aldrich, C8056; St. Louis, MO, USA) and 100 U/mL penicillin-streptomycin (Corning, 30001CI). The human embryonic kidney 293-T (HEK293T) cells were purchased from ATCC (CRL-3216). HEK293T cells were cultured in Dulbecco’s Modified Eagle Medium (HyClone, SH3028501; Marlborough, MD, USA), supplemented with 10% fetal bovine serum (HyClone, SH3039603HI) and 100 U/mL of penicillin-streptomycin. Both cell lines were incubated in humidity at 37 °C with 5% CO2.

2.2. Design and Cloning of CRISPRa gRNA Sequences into Lentiviral Transfer Plasmid

The Sigma-Aldrich Advanced Genomics bioinformatics tool was utilized to design CRISPRa gRNA target sequences for activation of the FRA1 gene. The CRISPRa system utilized the dCas9 variant fused to the VP64 transcriptional activator, as described previously [64]. The design criteria included the identification of 20 nucleotide guide sequences complementary to the FRA1 gene preceded by a 5′NGG PAM sequence (requirement for S. pyogenes Cas enzyme function). The design tool generated gRNA sequences optimized for gene activation with minimal off-target activity, as described previously [65]. The top three FRA1 gRNA target sequences [#1: 5′-GTAACTTCCTCGCCGCGCCC-3′ (−237 to −218 from transcription start site); #2: 5′-GTATGGGCAGCTACGTCAGG-3′ (−212 to −193 from transcription start site); and #3: 5′-TCGGGACCGACGGGCCAAGG-3′ (−104 to −85 from transcription start site)] were selected for cloning into the third generation lentiviral gRNA cloning backbone vector (Addgene, 73795; Watertown, MD, USA). This plasmid contains BsmBI sites for scarless insertion of the gRNA target sequences. Therefore, the BsmBI overhang sequences were appended to the gRNA target sequences and ordered as single-stranded oligonucleotides from IDT. The forward and reverse oligonucleotides were phosphorylated and annealed in-house using a 10 μL reaction volume consisting of 10 μM forward and reverse oligonucleotides, 1 mM ATP (NEB), 1X Kinase Reaction Buffer A (NEB), and 5 units of T4 polynucleotide kinase (NEB). The reaction was completed in a thermocycler using the following parameters: (1) 37 °C for 30 min, (2) 95 °C for 5 min, and (3) temperature ramp down to 25 °C at 0.1 °C /s. The samples were diluted by 250 fold by mixing 2 μL of reaction mix with 498 μL molecular grade water (HyClone, SH30538.LS). Single-step digestion and ligation of the vector and annealed oligonucleotides was completed in 20 μL reaction volume consisting of 100 ng lentiviral gRNA transfer plasmid, 2 μL of diluted and annealed oligonucleotides, 1X Tango Buffer (ThermoScientific), 1 mM DTT (NEB), 1 mM ATP (NEB), 10 units BsmBI (ThermoScientific), and 1 μL T4 Quick Ligase (NEB). The reaction was completed in a thermocycler using the following parameters: (1) 37 °C for 5 min, (2) 23 °C for 5 min, and (3) steps 1 and 2 repeated for 6 cycles; 2 μL of the final ligation product was transformed into NEB Stable Competent E. coli cells according to the manufacturer’s instructions and selected for ampicillin resistance (100 μg/mL). Select clones were amplified and subjected to plasmid purification using the GeneJet Plasmid Miniprep Kit (ThermoFisher, K0502), according to the manufacturer’s instructions. Successful insertion of the gRNA target sequences into the lentiviral backbone vector was verified by Sanger sequencing performed by The Centre for Applied Genomics (TCAG, SickKids, Toronto, ON, Canada).

2.3. Preparation of CRISPRa Lentiviral Particles via Calcium Phosphate Transfection

HEK293T cells were plated into three 10 cm dishes at 1.0 × 10⁶ cells per dish 48 h before transfection. Cells were ~50–60% confluent on the day of transfection. Two hours prior to the transfection, the media was replaced with 9.0 mL/dish of prewarmed complete media without antibiotics. In a 15 mL tube, the following amounts of third generation lentiviral plasmids were mixed to a final volume of 1.35 mL with molecular grade water: 10 μg pMD2.G (Addgene, 12259), 30 μg psPAX2 (Addgene, 12260), and 40 μg transfer plasmid (Addgene, 61425-dCas9 or cloned CRISPRa gRNA plasmids described above); 150 μL of 2.5 M CaCl2 were added to the plasmid mixture and mixed by vortex. Next, 1.5 mL of 2× HEPES-buffered saline (0.05 M HEPES, 0.28 M NaCl, 1.5 mM Na2HPO4, pH 7.0) were added dropwise while the solution was continuously vortexed. After incubating the transfection solution for 15 min at room temperature, 1 mL of solution was added dropwise into each 10 cm plate. After 20 h post-transfection, the media was replaced with 7 mL of complete media per 10 cm dish. The supernatant containing the lentiviral particles was collected 8 h after the media change. The supernatant was centrifuged at 500× g for 5 min at 4 °C to remove cellular debris and cleared using a 0.45 μm syringe filter. The viral solution was aliquoted into 1 mL fractions and stored at −80 °C.

2.4. CGL1 Lentiviral Infection for Producing CRISPRa Mediated FRA1 Overexpression

CGL1 cells were seeded into a six-well plate in complete media at 100,000 cells per well 24 h before the lentiviral infection. Cells were ~40–50% confluent on the day of the infections. Two hours prior to the infection, the media was replaced with 0.9 mL/well of complete media. The infection was initiated via the addition of 1 mL of lentiviral solution and 100 μL of 20X polybrene solution (8 μg/mL final concentration). After 16 h, the virus solution was removed and each well was incubated with 2 mL of complete media. After 48 h, the cells were passaged and transferred to T25 flasks under antibiotic selection (0.8 μg/mL blasticidin for dCas9 selection; 8 μg/mL puromycin for gRNA selection). The antibiotic selection was maintained for four rounds of passage, at which point the cells were maintained without the selection antibiotic. FRA1-overexpressing CGL1 cells were generated via sequential viral infections. First, dCas9-expressing CGL1 cells were generated (CGL1dCas9) and verified via immunohistochemical analysis using a Cas9 antibody (ThermoScientific, 10C11-A12). Next, the CGL1dCas9 cells were subsequently infected with three unique lentiviral preparations containing varying gRNA sequences designed for FRA1 overexpression (CGL1FRA1—#1/2/3). All assays were performed within 4–7 passages from the initial CRISPRa lentiviral infections.

2.5. RNA Extraction

Total RNA was extracted from CGL1, CGL1dCas9, and CGL1FRA1 cells using the TRIzol reagent (Invitrogen, Waltham, MA, USA), as described previously [67,68]. Briefly, cells were seeded in six-well plates with complete media and collected at ~70–80% confluency. Cells were washed with phosphate-buffered saline (PBS) and harvested using 500 μL of TRIzol per well. The samples were transferred into a 1.5 mL tube and mixed with 100 μL of chloroform. The mixture was incubated at room temperature for 15 min and centrifuged at 12,000× g for 20 min at 4 °C. After centrifugation, the top aqueous layer containing the total RNA fraction was transferred to a new 1.5 mL tube. The RNA was precipitated with 125 μL of isopropanol. The mixture was vortexed for 15 s, incubated for 10 min at room temperature, and centrifuged at 12,000× g for 8 min at 4 °C. The supernatant was discarded, and the RNA pellet was washed with 1 mL of 70% ethanol. The solution was centrifuged at 7500× g for 5 min. The supernatant was removed, and the RNA pellet was air-dried for 10 min. The RNA pellet was dissolved in 20 μL of molecular grade water in a thermomixer for 10 min at 37 °C at 1000 rpm. The RNA samples were incubated on ice for 20 min, followed by RNA analysis on the NanoDrop spectrophotometer (ThermoScientific, ND-1000). Absorbance ratios of 260/280 nm >1.8 were considered suitable for downstream applications.

2.6. cDNA Synthesis

Complementary DNA (cDNA) synthesis was performed using the SuperScript IV First-Strand Synthesis (ThermoScientific, LS18090050) kit according to the manufacturer’s instructions, with minor modifications. Briefly, 1 μg of RNA was subjected to DNase treatment and converted to cDNA using random hexamers and the reverse transcriptase enzyme. The reaction volume was adjusted to 25 μL to obtain a final cDNA concentration of 40 ng/μL and stored at −80 °C.

2.7. RT-qPCR

Forward and reverse primer pairs for SYBR-Green-based RT-qPCR analysis were designed in-house and validated under stringent conditions (efficiency between 90–110% and R2 > 0.99), as described previously [55,69,70,71]. Table 1 lists the validated RT-qPCR primer sequences utilized in this study. RT-qPCR reactions were performed using the QuantStudio 5 Real-Time PCR instrument (ThermoScientific) in 96-well plates. The RT-qPCR reaction mix was completed in 15 μL reaction volume consisting of 5 ng cDNA, 600 nm forward and reverse primers, and 7.5 μL 2× Luna Universal qPCR Master Mix (NEB, M3003). The RT-qPCR cycling parameters consisted of 95 °C for one min followed by a two-step denaturation and extension cycle of 95 °C for 15 s and 60 °C for 30 s for a total of 40 cycles. Plate reading was performed at the end of the extension phase. A DNA melt curve was performed at the completion of each RT-qPCR experiment to assess the amplification specificity. The RT-qPCR data was analyzed using the 2−∆∆Ct analysis method, as described previously [72,73]. All samples were normalized to two independent housekeeping genes (RSP18 and RPL4). The relative mRNA expression of each gene was reported as the mRNA fold change ± standard error of means (SEM) relative to the CGL1dCas9 control cells.

2.8. Protein Extraction and Western Blot Analysis

Cells were harvested in T25 flasks at ~70–80% confluency for protein extraction. Briefly, cells were washed with PBS, trypsinized, neutralized with media, and centrifuged. The cell pellet was washed with ice-cold PBS, followed by resuspension of the pellet with 100 μL of fresh RIPA lysis buffer (150 mM NaCl, 5 mM EDTA, 50 mM Tris, 1% NP-40, 0.5% sodium deoxycholate, and 0.1% SDS; pH 7.5) supplemented with a protease inhibitor mix (ThermoScientific, A32955). The lysis mixture was agitated for 30 min at 4 °C with intermittent vortex, followed by centrifugation at 20,000× g for 20 min at 4 °C. The soluble protein fraction was transferred to a 1.5 mL tube and stored at −80 °C. Protein concentration was determined using the Pierce BCA Protein Assay Kit (ThermoScientific, PI23225) according to the manufacturer’s instructions.
The protein samples were analyzed via gel electrophoresis using the BOLT Bis-Tris Plus gel system (ThermoScientific). Briefly, samples were prepared for gel electrophoresis in 50 μL of reaction volumes consisting of 25 μg of RIPA solubilized protein sample, 1X Bolt LDS Sample Buffer (LSB0007), and 1X Bolt Reducing Agent (LSB0004). The samples were sonicated at 10 Hz for 20 s, followed by 70 °C for 10 min. The protein ladder (ThermoScientific, 26619) and samples were loaded onto a Blot Bis-Tris Plus Mini Gel (ThermoScientific, NW04120BOX) and electrophoresed for 22 min at a constant 200 V.
The contents of the gel were transferred to a nitrocellulose membrane (PALL, 66593) using the Mini Bolt Module (B1000) according to the manufacturer’s instructions. The blots were blocked with 5% bovine serum albumin (BSA) in TBS-T buffer (Tris-buffered saline with 0.1% Tween-20) for 60 min at room temperature. The blots were washed three times with TBS-T for 5 min each at room temperature, followed by incubation with the following primary rabbit monoclonal antibodies overnight at 4 °C: FRA1 (1:1000; Cell Signaling #5281T), cFos (1:500; Cell Signaling #2250S), cJun (1:1000; Cell Signaling #9165S), Integrin α4 (1:1000; Cell Signaling #8440T), Integrin α11 (1:500; Cell Signaling #37815S) and Integrin β8 (1:500; Cell Signaling #88300S). The blots were washed four times with TBS-T and incubated with HRP-conjugated goat antirabbit secondary antibody (ThermoScientific, G21234) at 1:10,000 dilution for 1 h at room temperature. After four washes with TBS-T, the blots were incubated with 2mL of ECL mixture (ThermoScientific, 0032109) for 5 min followed by signal imaging using the ChemiDoc Imaging System (Bio-Rad, Hercules, CA, USA). The antibodies were stripped from the blots using a mild stripping buffer (0.2 M glycine, 0.5% SDS, and 1% Tween-20; pH 2.2) for 10 min at room temperature. The blocking, washing, and antibody incubation procedure described above were repeated for the mouse monoclonal Gapdh (1:20,000; ThermoScientific, MA515738) or α-Tubulin (1:1000; Cell Signaling #3873S) housekeeping antibody, followed by the HRP-conjugated goat anti-mouse secondary antibody (1:10,000; ThermoScientific, LSG21234). The band intensities were quantified using the ImageJ analysis software, as described previously [74,75].

2.9. Cell Growth Assay

In T25 flasks, 100,000 cells were seeded with complete media. Cells were collected at 24 h intervals for seven consecutive days in duplicates. Media change was performed on day 3 and day 5. Cell collection included a PBS wash followed by the addition of 0.05% trypsin and normalization using complete media. The total cell count per T25 flask was determined using a hemocytometer. The mean cell count for three independent experiments ± SEM is provided for each cell line.

2.10. RNA-seq Whole Transcriptome Analysis

Total RNA was extracted using the TRIzol method and further purified using the NEB Monarch® RNA cleanup kit (NEB, T2040L). Purified RNA (A260/280 ~2.0 ± 0.1) was subjected to RNA-sequencing library preparation using the NEBNext® Ultra™ II Directional RNA Library Kit (NEB, E7765S). This kit purifies poly-A mRNA products and prepares strand-specific directional libraries using the dUTP method for strand-specificity. The library-prepared samples were quantified using the NEBNext® Library Quant Kit (NEB, E7630S). The samples were pooled at equimolar concentration and sequenced at TCAG on a NovaSeq 6000 Illumina platform at approximately 35 million reads per sample (paired-end 100 base-pair reads). The sequencing data was processed in house using various bioinformatics toolkits offered by DRAGEN Inc. via the Illumina Sequence Hub (San Diego, CA, USA) platform. Briefly, DRAGEN FASTQ was used for sequencing the data quality check and read trims. DRAGEN RNA was used to align reads to the human reference genome (GRCh38.p13) and perform transcript-count analysis. DRAGEN Differential Expression was used to complete differential expression analysis based on the DESeq2 platform. Differential gene-selection criteria were determined based on gene-fold change <−1.5 or >1.5, false discovery rate (FDR) corrected p-values < 0.05, and minimum average read count of 30 transcripts per million. iPathwayGuide (AdvaitaBio; Ann Arbor, MI, USA) was used to perform gene ontology analysis, as shown previously [55,76,77]. Select targets were verified via RT-qPCR.

2.11. Cell Adhesion Assay

Cell adhesion assay was performed, as described previously, with minor modifications [74]. Briefly, 7.5 ng/μL fibronectin (Sigma-Aldrich, F2006), 5 ng/μL collagen (Sigma-Aldrich, C5533), or 100 ng/μL poly-d-lysine positive control (Sigma-Aldrich, P7280) were plated on flat-bottom 96-well plates and incubated at 4 °C overnight. The plates were washed with wash solution (0.2% BSA in PBS) and blocked with 2% BSA. The cells were collected by trypsinization and resuspended in cell recovery media (serum-free media supplemented with 20 mM HEPES and 0.1% bovine serum albumin, pH 7.4). After 30 min of cell recovery at 37 °C, the cells were plated at 25,000 and 50,000 cells/well for the fibronectin and collagen-coated wells, respectively, and both cell counts were also plated on the poly-d-lysine positive control wells. After one hour, the cells plated on fibronectin and collagen were washed three times with a prewarmed wash solution. All wells were then fixed with 4% paraformaldehyde for 10 min at room temperature, followed by 0.1% crystal violet stain for 30 min at room temperature. The wells were washed with water three times and air-dried. The crystal violet contained in the adhered cells was solubilized using 2% SDS (30 min at room temperature). The solubilized crystal violet was quantified by measuring the ultraviolet absorbance at 550 nM using the Cytation 5 BioTek (Agilent, Santa Clara, CA, USA) plate imager. The absorbance readings for cells plated on fibronectin and collagen were normalized using the poly-d-lysine positive control wells. The relative cell adhesion was reported as fold change ± SEM relative to CGL1dCas9 controls.

2.12. Cell Cycle Flow-Cytometry Analysis

In T25 flasks in complete media, 100,000 cells were seeded. The media was replaced 48h later with complete media. Cells were collected at the following timepoints post media change: 2, 4, 8, and 24 h. Cell collection involved a PBS wash, trypsinization, neutralization, cell count using a hemocytometer, and transfer of 250,000 cells/flask to assay tubes. The cells were washed with PBS and fixed with 70% ethanol at −20 °C overnight. The cells were washed with ice-cold PBS and centrifuged at 300× g for 5 min. The cells were then resuspended with 300 μL of stain solution consisting of 50 μg/mL of propidium iodide (PI) nucleic acid fluorescent stain (ThermoFisher, P1304MP) and 100 μg/mL of RNAseA (NEB, 7013S) prepared in PBS. After 10 min incubation, the samples were analyzed on a flow cytometer (Sony SA3800). Kaluza (London, UK) was used to process the flow-cytometer data in order to identify the proportion of cells that are in one of the three interphase stages of the cell cycle based on the PI fluorescent cell distribution and intensity.

2.13. Quantification and Statistical Analysis

Data were generated from a minimum of three independent experiments per assay and presented as mean ± SEM. Excel (t-test) or GraphPad PRISM (one-way or two-way ANOVA) was used to determine significant differences between experimental conditions (p < 0.05).

3. Results

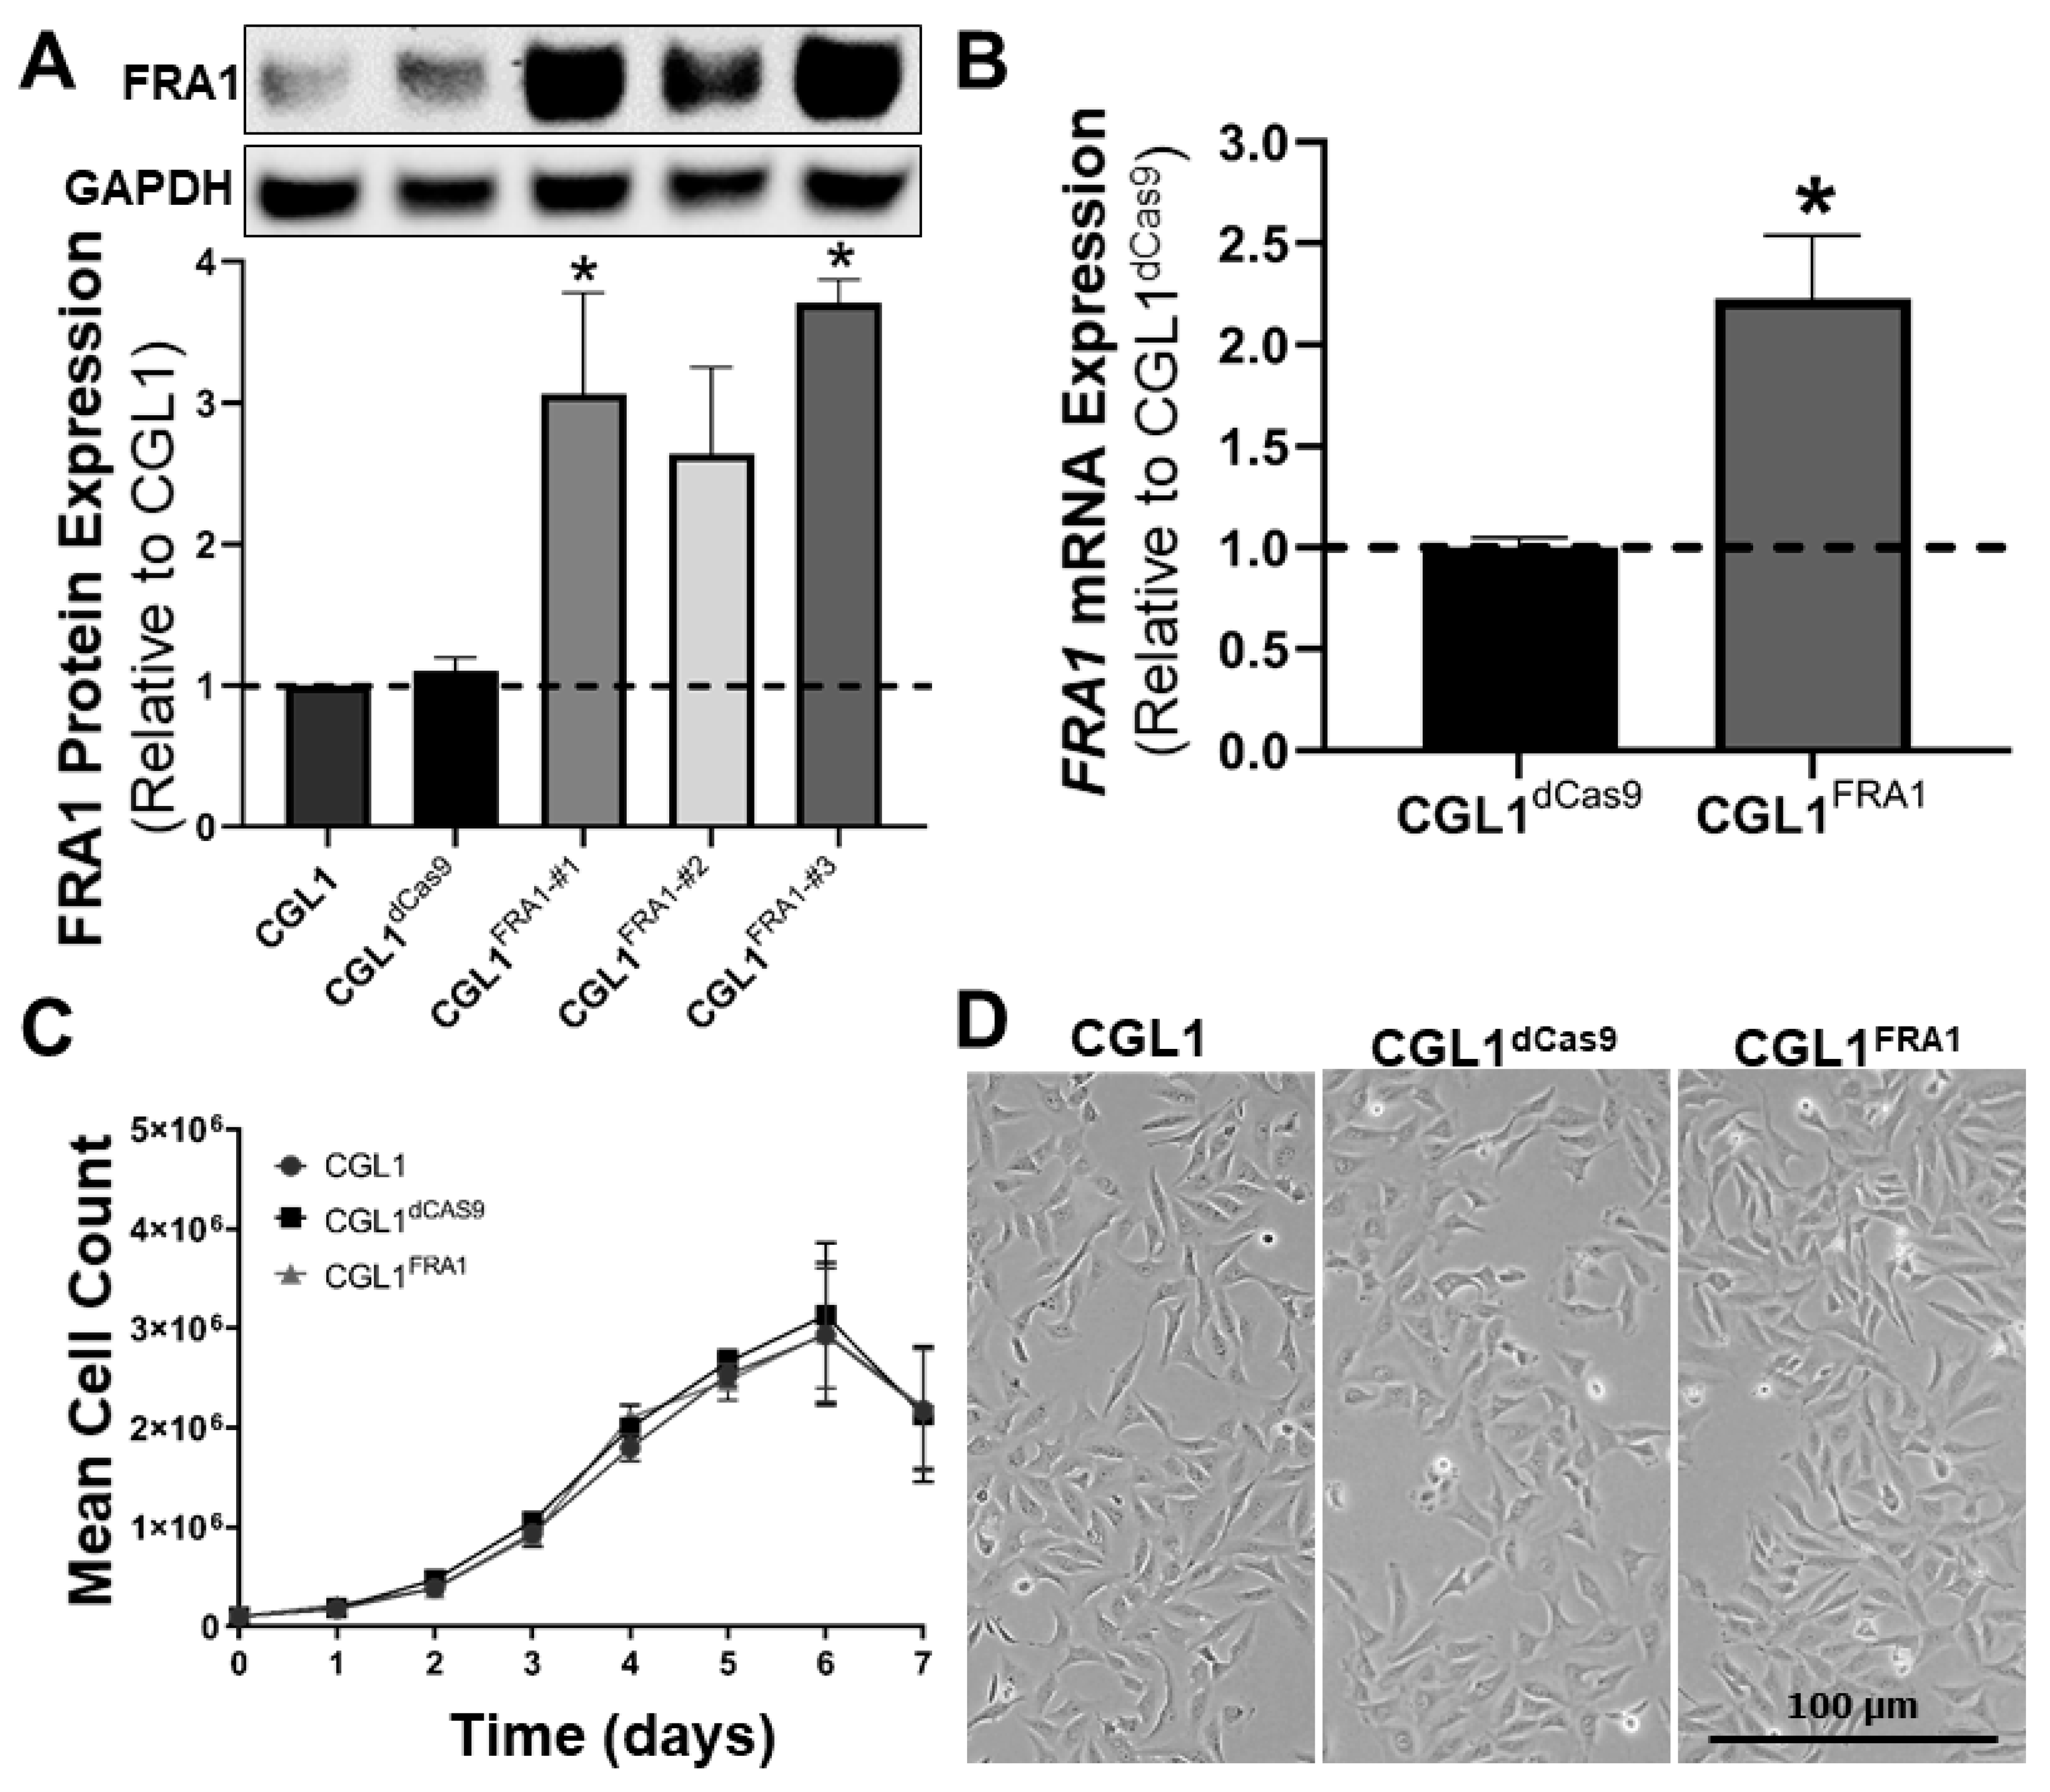
3.1. Establishing FRA1-Overexpressing CGL1 Cells

Stable FRA1 overexpressing CGL1 cells were generated using lentiviral-mediated genomic integration of the CRISPRa components (dCas9 and gRNA targeting the FRA1 promoter). This system resulted in the upregulation of the endogenous FRA1 gene. First, dCas9-expressing CGL1 cells were generated (CGL1dCas9) via lentiviral mediated delivery of the dCas9 gene. Next, the CGL1dCas9 cells were subsequently infected with three lentiviral preparations containing unique gRNA sequences designed for FRA1 overexpression (CGL1FRA1—#1/2/3). A Western blot analysis of the FRA1 protein expression in the CGL1 and CGL1dCas9 control cell lines demonstrated that dCas9 expression had no effect on basal FRA1 protein expression as expected (Figure 1A). More importantly, CGL1FRA1—#1 and CGL1FRA1—#3 showed a 3.0- and 3.5-fold upregulation of FRA1 protein expression, respectively, compared to CGL1 cells (n = 3, p < 0.05), while FRA1 expression in CGL1FRA1—#2 was elevated but not statistically significant (Figure 1A). Therefore, CGL1FRA1—#3 was chosen for all further downstream experiments, as this CRISPR activation system demonstrated the most robust FRA1 upregulation and will be referred to hereinafter as CGL1FRA1. Furthermore, RT-qPCR analysis was performed to confirm FRA1 overexpression (Figure 1B). CGL1FRA1 demonstrated a two-fold increase in FRA1 mRNA levels relative to CGL1dCas9 (n = 3, p < 0.05). Taken together, the CRISPRa system designed for FRA1 overexpression was successfully engineered into the CGL1 cells, resulting in the CGL1FRA1 cell line, demonstrating stable upregulation of the endogenous FRA1 gene.
In order to assess whether FRA1 overexpression affected the cell growth pattern, a growth-curve analysis was performed using CGL1, CGL1dCas9, and CGL1FRA1 cell lines (Figure 1C). Cell growth was quantified at 24 h intervals for seven consecutive days. There were no significant differences in the cell growth patterns for all three cell lines (n = 3). In addition, phase-contrast imaging of the exponentially growing CGL1, CGL1dCas9, and CGL1FRA1 cell lines revealed that there were no observable differences in the cell morphologies between the cell lines (Figure 1D). In addition, all cell lines demonstrated fibroblast-like features. Therefore, FRA1 overexpression had no effect on the cellular growth rate and the morphological features of the CGL1 cells. Additionally, CGL1dCas9 was chosen as the control cell line for all downstream experiments, as dCas9 expression had no effect on FRA1 expression, the cell growth pattern, or cell morphology compared to CGL1 cells (Figure 1).

3.2. Whole Transcriptome RNA-seq Analysis of CGL1FRA1 Cells Relative to CGL1dCas9 Cells

RNA-seq whole transcriptome analysis was performed to elucidate the global gene-expression changes induced by FRA1 overexpression. RNA sequencing of CGL1FRA1 and CGL1dCas9 cells at a depth of 35 million reads per sample resulted in the identification of 13,158 unique mRNA transcripts. Of this, 298 significant differentially expressed genes (DEG) were identified in CGL1FRA1 cells relative to CGL1dCas9 cells (DEG criteria: fold-change <−1.5 and >1.5 and FDR adjusted p-value < 0.05). Figure 2A shows a volcano plot illustrating the 124 upregulated DEGs (red circles) and 174 downregulated DEGs (blue circles). In order to confirm the transcriptome dataset, twelve representative genes were randomly selected from the RNA-seq analysis and cross-verified using RT-qPCR analysis. The genes analyzed included six DEGs (ITGA4, FOSL1, CD24, ITGβ8, FOS, and FN1) and six non-DEGs (CCND1, EGFR, JUN, ITGB1, LAMA1, and CTNNB1). An additional FRA1-overexpressing CGL1 line was assessed (CGL1FRA1—#1) in order to screen for potential off- target effects of the CRISPRa gRNA. Figure 1B demonstrated that the mRNA fold change between the RNA-seq and RT-qPCR analyses were similar in magnitude and significance across the twelve representative genes and the two different CGL1 FRA1 overexpressing cell lines (n = 3; *, p < 0.05). These results provide confidence in the RNA-seq dataset and its use in downstream bioinformatics analyses.
The top 15 upregulated and downregulated genes in CGL1FRA1 cells are represented in Figure 2C and Figure 2D, respectively. The tables contain the gene description and p-value and are ranked based on fold change. The majority of the top 15 DEGs had a fold change between ±4–10. However, the top two upregulated and downregulated genes had extreme differences in fold change: KLHL15 (2.3 × 10⁶), AUNIP (162.2), UTP14C (−6.3 × 10⁶), and PCDHGB5 (−81.8). The full list of 298 DEGs is presented in Supplementary Table S1 in alphabetical order. The table provides information on the fold change, p-value, and the transcript counts (transcript per million).

3.3. Gene Ontology (GO) Enrichment Analysis of DEGs in CGL1FRA1 Cells

In order to classify the DEGs induced by FRA1 overexpression into cellular and molecular pathways, GO enrichment analysis was performed. The iPathwayGuide (AdvaitaBio) GO analysis package was used to hierarchically rank the co-occurrence of the 298 DEGs within annotated GO units identified by the GO classification system. The GO analysis included FDR correction to obtain GO terms with increased statistical significance. Table 2 summarizes the top enriched GO terms categorized as molecular functions, biological processes, and cellular components, ranked by q-value (FDR-adjusted p-value). The table includes the total number of genes annotated within the GO database and the number of DEGs identified within each GO term.
The GO molecular function analysis identified numerous GO terms aligned with the established role of FRA1 as a transcription factor: DNA-binding transcription-factor activity (GO:0003700), RNA polymerase II specific DNA-binding transcription-factor activity (GO:0000981), and RNA polymerase II cis-regulatory sequence DNA binding (GO:0000978). Interestingly, the GO analysis identified several molecular functions previously less established with FRA1 activity, such as extracellular matrix profile and cellular adhesion (GOs: 0005201, 0005178, and 0005518), and cell signaling processes, including glycosaminoglycan binding (GO:0005539), protein tyrosine kinase activity (GO:0030296), chemokine activity (GO:0008009), and G protein-coupled receptor signaling (GO:0001664). The GO biological process analysis consisted of GO IDs related to positive regulation of multicellular organismal processes (GOs: 0051240, 0051239, 0032501, and 0050789) and positive regulation of developmental processes (GOs: 0051094, 0050793, and 0048731). In addition, biological processes, including response to external stimulus (GO:0009605) and regulation of cell population proliferation (GO:0042127), were also significantly enriched. Overall, the biological processes identified by the GO analysis are in alignment with the established role of FRA1 and the AP-1 complex in regulating cellular differentiation and proliferation. Finally, the cellular component analysis identified GO IDs that act at the level of the cell membrane or extracellularly: external encapsulating structure (GO:0030312), extracellular matrix (GO:0031012), collagen-containing extracellular matrix (GO:0062023), and cell periphery (GO:0071944). In summary, the GO profiles suggest that FRA1 overexpression positively regulates multicellular organismal and development processes by acting on molecular pathways involved in transcription-factor activity, regulation of the extracellular matrix profile and cellular adhesion, and a variety of cell signaling processes that initiate with receptor activation at the level of the cell membrane.

3.4. FRA1 Upregulation Alters the Expression of Core AP-1 Complex Members

The GO analysis revealed that FRA1 upregulation induced a wide range of gene-network changes previously established with AP-1 activity. The AP-1 dimer composition plays an important role in determining which AP-1 binding sites are bound and transcriptionally active. Therefore, the mRNA expression of the core AP-1 complex members (Jun and Fos family genes) was determined in order to understand whether FRA1 upregulation shifts the AP-1 dimer composition (Figure 3A). Indeed, FRA1 overexpression significantly downregulated the mRNA levels of FOS (expresses cFos protein) and JUNB by 1.53 and 1.49 fold, respectively, relative to CGL1dCas9 cells, while the expression of JUN (expresses cJun protein) was significantly increased by 1.32 fold (n = 3, p < 0.05). On the contrary, the expressions of FOSL2, FOSB, and JUND were unaffected by FRA1 overexpression. Similarly, the expression of accessory AP-1 binding partners including the gene members of the ATF, NRF, and MAF families were unchanged between CGL1FRA1 and CGL1dCas9 cells (Supplementary Table S1). In order to assess whether the gene-expression changes translated to protein-expression alterations, select AP1 complex members were analyzed via Western blotting (Figure 3B,C). Similar to the gene-expression results, the protein expression of FRA1 and cJUN were significantly upregulated by 3.0 and 1.5, respectively, relative to CGL1dCas9 cells, while the expression of cFOS was significantly downregulated by 3.3 fold (p < 0.05). In summary, FRA1 overexpression altered the expression of AP-1 complex members.

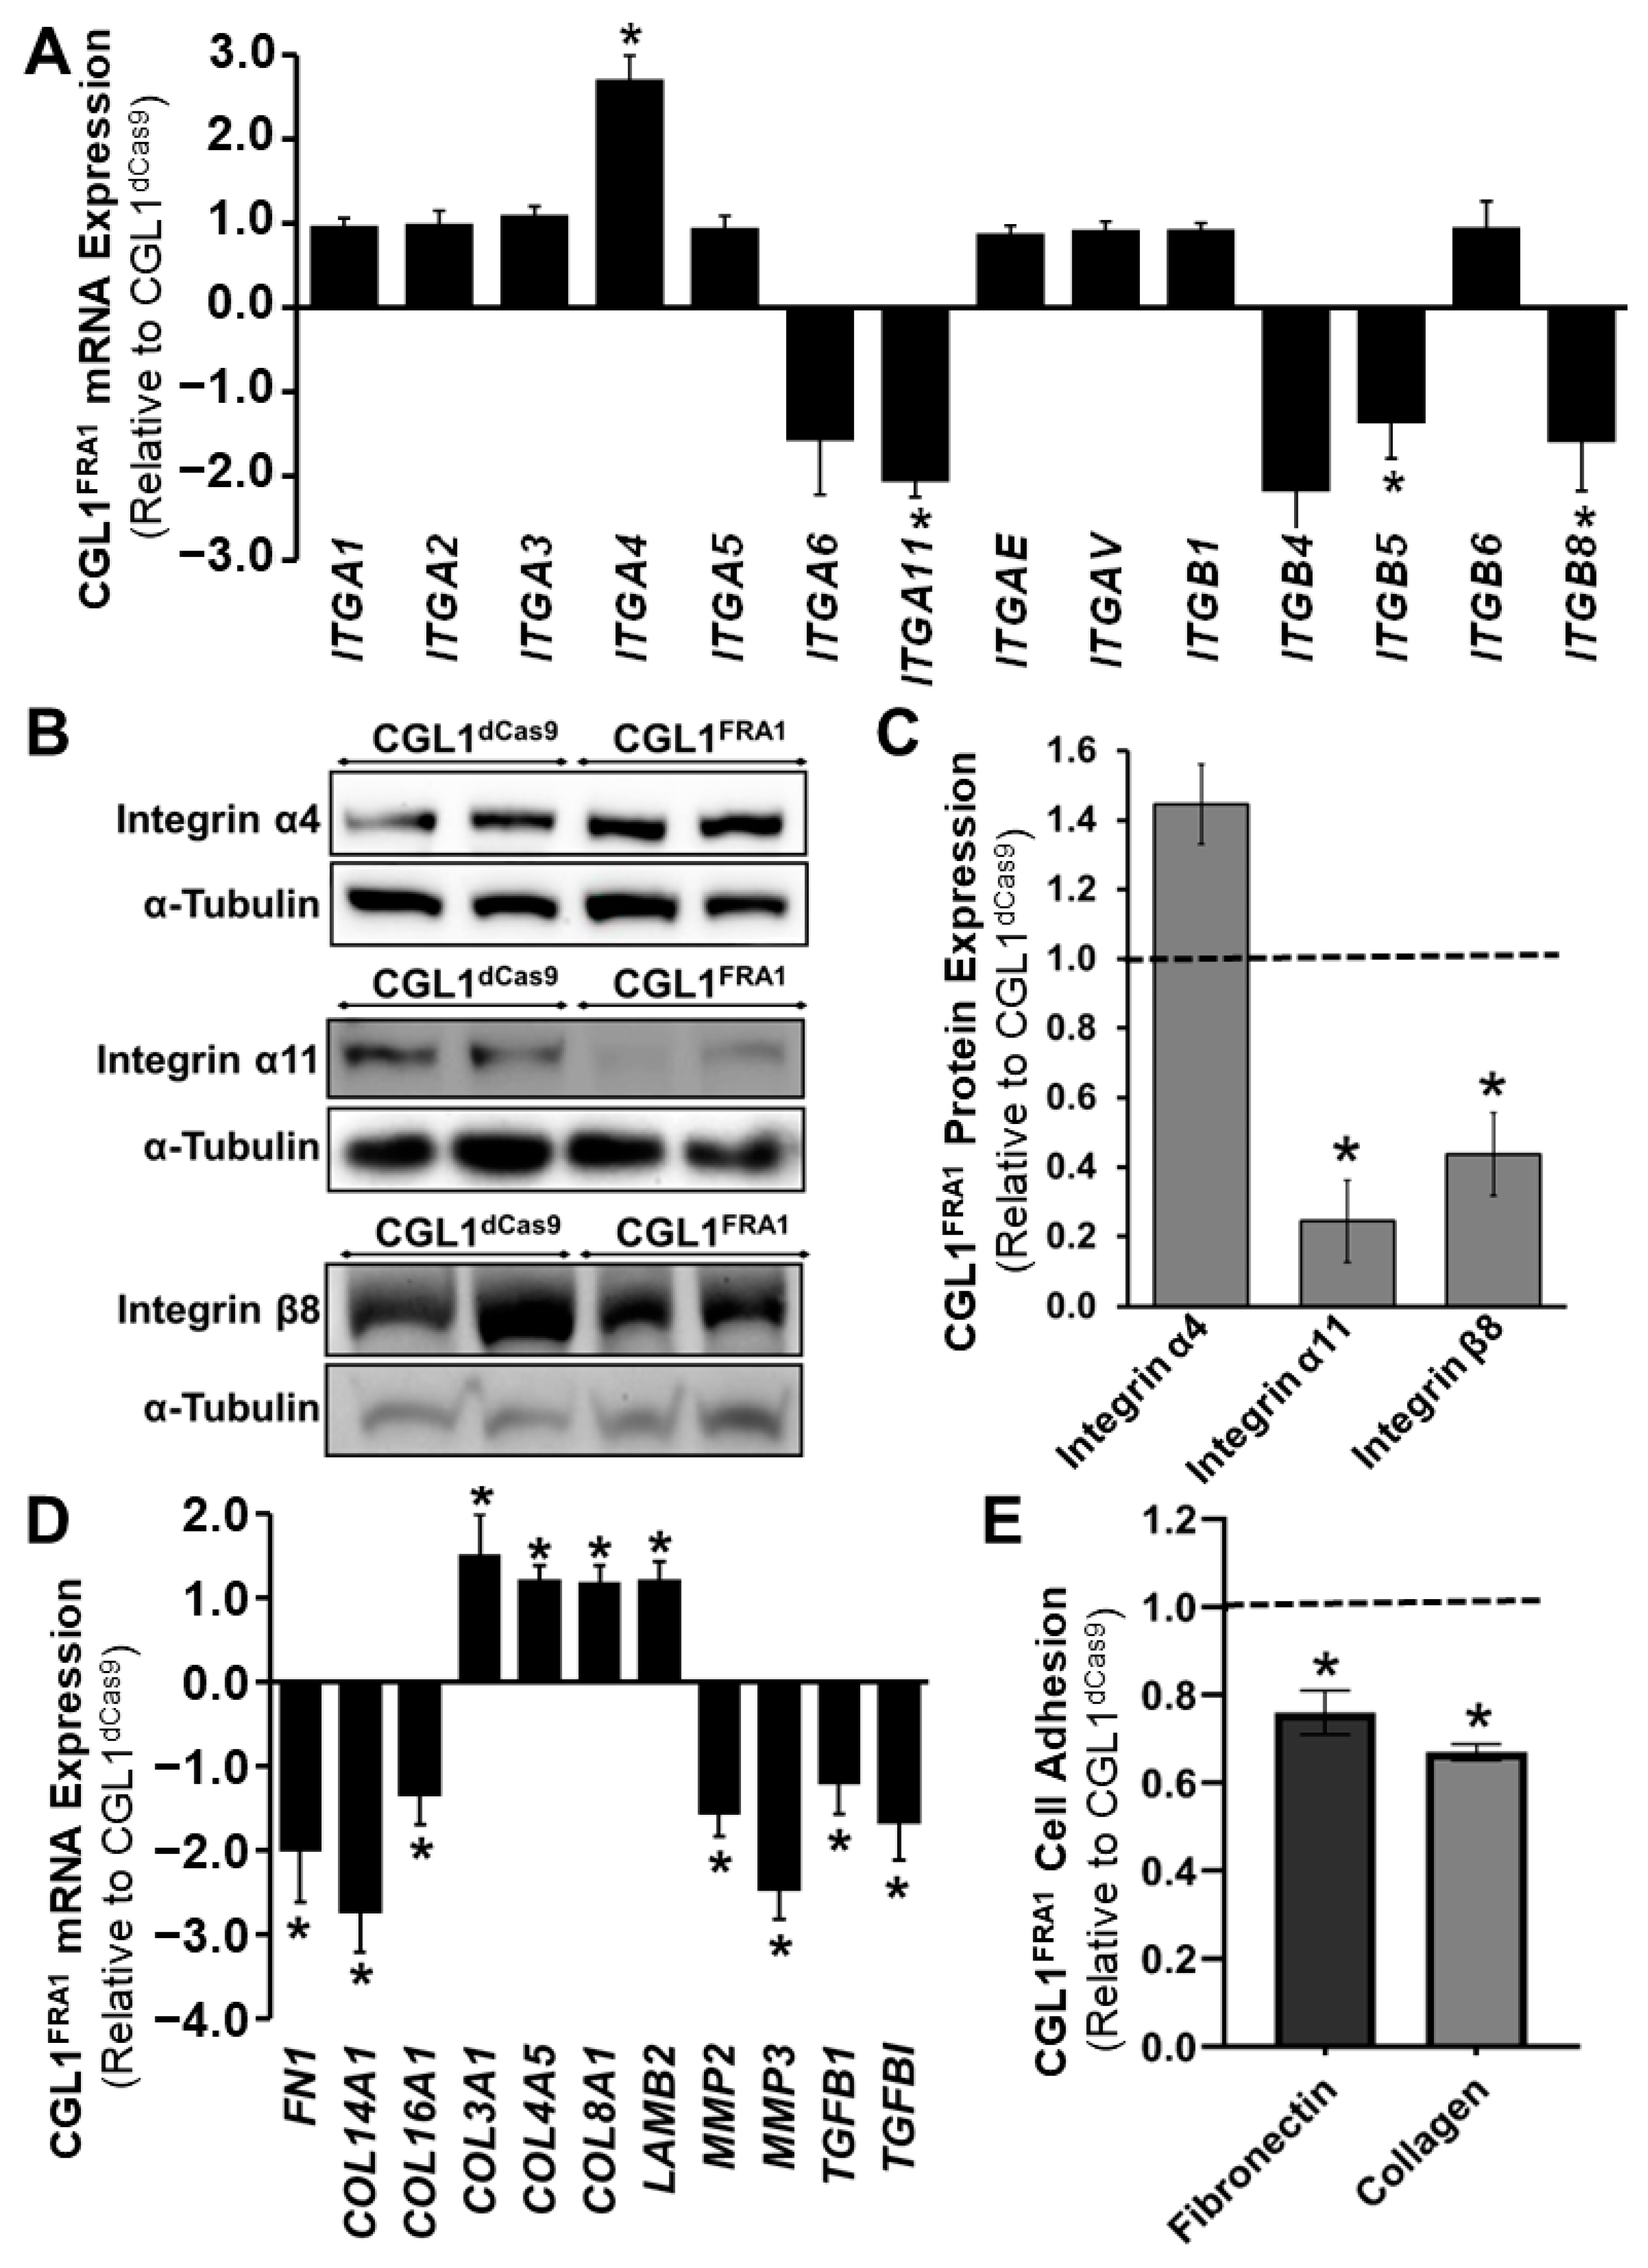
3.5. FRA1 Upregulation Alters the Adhesion Profile of CGL1 Cells

The GO analysis of CGL1FRA1 cells identified multiple networks across all three GO domains related to the extracellular matrix (ECM) profile and integrin binding, with particular emphasis on collagen-containing ECM and collagen binding (Table 2). Therefore, the mRNA expression of select members of the integrin family and ECM network was identified in order to understand the impact of FRA1 upregulation on the expression of these gene networks. The expression of all integrins detected by the RNA-seq analysis (average read counts >30 transcripts per million) in CGL1FRA1 and CGL1dCas9 cells is provided in Figure 4A. The expression of ITGA4 (integrin α4) was significantly upregulated by 2.7 fold in CGL1FRA1 cells relative to CGL1dCas9, while the expression of ITGA11 (integrin α11), ITGB5 (integrin β5), and ITGB8 (integrin β8) were significantly downregulated by 2.1, 1.4, and 1.6 fold, respectively (n = 3, p < 0.05). In addition, ITGB4 (integrin β4) was non-significantly downregulated by 2.2 fold (p = 0.051). The expression of the other integrins was unaffected by FRA1 overexpression, including ITGB1 (integrin β1), which forms heterodimers with the majority of alpha integrins (Figure 4A). In order to confirm whether the gene-expression results translated to protein changes, select integrins were analyzed via Western blotting (Figure 4B,C). Similar to the RNA-seq results, the protein expression of integrins α11 and β8 were significantly downregulated by 4.1 and 2.3, respectively, relative to CGL1dCas9 cells, while the expression of integrin α4 was non-significantly increased by 1.4 fold (p = 0.10). Taken together, the decreased expression of integrin α11 (collagen receptor) and integrin β8 (fibronectin receptors) suggests that FRA1 upregulation impairs the ability of CGL1 cells to bind collagen and fibronectin.
The expression of select ECM-network genes in CGL1FRA1 cells relative to CGL1dCas9 cells is presented in Figure 4D. In line with the changes to the integrin profile, the expression of FN1 (fibronectin 1), COL14A1 (collagen type XIV alpha 1 chain), and COL16A1 (collagen type XVI alpha 1 chain) were significantly downregulated by 2.0, 2.8, and 1.4 fold, respectively (n = 3, p < 0.05). In contrast, the expression of LAMB2 (laminin subunit beta 2), COL3A1 (collagen type III alpha 1 chain), COL4A5 (collagen type IV alpha 5 chain), and COL8A1 (collagen type VIII alpha 1 chain) were modestly increased by 1.2, 1.5, 1.2, and 1.2 fold, respectively (n = 3, p < 0.05). In addition, analysis of genes encoding ECM degradation proteins, including MMP2 (matrix metallopeptidase 2) and MMP3, were downregulated by 1.6 and 2.5 fold, respectively. Finally, the expression of the integrin activity modulators TGFB1 (transforming growth-factor beta 1) and TGFBI (transforming growth-factor beta induced) was downregulated by 1.2 and 1.7 fold, respectively. Taken together, the gene-expression changes in the ECM-network profile indicate that FRA1 overexpression reduces ECM expression and ECM-mediated signaling.
The integrin expression patterns (Figure 4A–C) suggest that FRA1 overexpression impairs the ability of CGL1 cells to bind collagen and fibronectin. To test this hypothesis, a cell adhesion assay was performed to assess the ability of CGL1FRA1 and CGL1dCas9 cells to adhere to 7.5 ng/μL fibronectin and 5 ng/μL collagen (Figure 4E). Indeed, CGL1FRA1 cells demonstrated 30% and 35% decreased adhesion to fibronectin and collagen relative to CGL1dCas9 cells (n = 3; *, p < 0.05). In summary, FRA1 overexpression reduced the ability of CGL1 cells to bind collagen and fibronectin, likely via inhibiting the expression of integrin α11 and integrins β5/β8, respectively.

3.6. Cell Cycle Analysis of CGL1FRA1 and CGL1dCas9 Cells

RNA-seq analysis of CGL1FRA1 cells relative to CGL1dCas9 cells identified numerous DEGs involved in the regulation of the cell cycle (Supplementary Table S1): CDK20 (cyclin-dependent kinase 20; −1.6 fold change), GAS7 (growth arrest specific 7; −7.5 fold change), C2CD3 (C2 domain containing centriole elongation regulator three; −1.5 fold change); EFHD1 (EF-hand domain family member D1; −1.9 fold change), POLA1 (DNA polymerase alpha 1; −2.7 fold change), SETBD2 (SET domain bifurcated histone lysine methyltransferase 2; 5.5 fold change), SMC1A (structural maintenance of chromosomes 1A; 1.58), and CENPP (centromere protein P; 1.56 fold change). Therefore, a cell cycle analysis was performed in CGL1FRA1 and CGL1dCas9 cells in order to investigate the effects of FRA1 overexpression on CGL1 cell cycle progression. Here, cells grown for 48 h were stimulated with fresh complete media and collected at the following timepoints post media change: 2, 4, 8, and 24 h. Cell cycle phases were determined using PI nucleic acid fluorescent stain analyzed using a flow cytometer. The cell cycle distributions of CGL1FRA1 and CGL1dCas9 are presented as percent G1 (Figure 5A), G2 (Figure 5B), and S (Figure 5C). Supplementary Figure S1 provides representative cell cycle distribution images for CGL1FRA1 and CGL1dCas9 samples across the various timepoints. Overall, the cell cycle analysis demonstrated a significant decrease in the distribution of CGL1FRA1 cells in the G1 phase of the cell cycle relative to CGL1dCas9 cells at the 4, 8, and 24 h timepoints (two-way ANOVA, p = 0.0083). However, there were no significant differences between the distribution of CGL1FRA1 and CGL1dCas9 cells at G2 and S phase. Interestingly, the percent G1 cell cycle results match the gene-expression profile of CGL1FRA1 cells, whereby reduced expression of cell cycle genes, such as CDK20 and GAS7, have been associated with increased progression of the cell cycle from G1 to S and G2 phases [78,79]. Taken together, FRA1 overexpression promotes cell cycle progression possibly via transcriptional regulation of genes that promote G1 transition.

4. Discussion

FRA1 overexpression has been reported in various pathological states, including tumor progression and inflammation [12,56,80]. However, the transcriptional and functional effects of FRA1 overexpression are still not understood. This is the first study to utilize the CRISPRa system to investigate the cellular and molecular effects of stable overexpression of the endogenous FRA1 gene. Using gene-expression analysis and cellular functional assays, we have unraveled numerous cellular and molecular changes mediated by FRA1 upregulation. First, we have identified 298 significant DEGs in FRA1-overexpressing CGL1 cells. Gene ontology analysis illustrated that FRA1 overexpression altered various molecular networks, including transcription-factor activity, regulation of extracellular matrix and cellular adhesion, and a variety of cell signaling processes, including protein tyrosine kinase activity, chemokine signaling, and G protein-coupled receptor activity. Taken together, these results demonstrate that FRA1 upregulation leads to global transcriptional perturbations. Second, the cell adhesion assay corroborated the RNA-seq results and established that FRA1 overexpression impaired CGL1 cell adhesion to collagen and fibronectin. Finally, we revealed that FRA1 overexpression promoted cell cycle progression via the transcriptional regulation of genes that promote G1 transition. Taken together, this study identified the transcriptional responses mediated by FRA1 overexpression and established the role of FRA1 in cellular adhesion and cell cycle progression.
FRA1 and other members of the AP-1 complex are signal transducers that mediate the cellular response of various extracellular signals. The AP-1 dimer composition plays an important role in determining the gene-expression changes mediated by the extracellular signals. Here, FRA1 overexpression decreased FOS expression while JUN levels were increased. This suggests that with FRA1 upregulation, there is decreased presence of c-Fos/c-Jun heterodimers and increased FRA1/c-Jun heterodimers. We have previously observed similar shifts in AP1 dimer composition using CO-IP and EMSA techniques in ionizing radiation-induced neoplastic CGL1 transformants with FRA1 re-expression. The gamma-irradiated mutant (GIM) and control (CON) CGL1 transformants were isolated post seven Gy of ionizing radiation exposures. The tumorigenic GIM cells contained deleted or epigenetically silenced FRA1 gene [53,54,55]. In those studies, reinsertion of the FRA1 gene in tumorigenic variants reduced FOS expression while JUN expression was increased. Taken together with our current results, we further demonstrate that FRA1 overexpression suppresses FOS expression.
Interestingly, although FRA1 and cFos demonstrate homology in their leucine zipper DNA-binding domains, cFos contains additional transactivation domains required for tumorigenesis and cellular transformation, whereas FRA1 lacks these transactivation domains [4,81]. Perhaps cell types that demonstrate FRA1 upregulation and cFos downregulation demonstrate reduced tumorigenesis. Indeed, we have previously observed that FRA1 re-expression in tumorigenic GIM cells shows decreased cFos expression and the absence of in vivo tumor formation.
The GO enrichment analysis further emphasized the role of FRA1 as a transcription factor, with multiple GO terms highlighting DNA binding and transcription activity (Table 2). These findings are expected given the structure of FRA1, which contains basic leucine zipper DNA binding domains, and previous studies implicating FRA1 with the AP1 transcriptional complex [2,82]. The GO enrichment analysis also identified numerous molecular and cellular GO terms less established with FRA1 activity, especially extracellular matrix profile and cellular adhesion.
The results from Figure 4 demonstrate that FRA1 overexpression has profound effects on cellular adhesion, including the gene expression of extracellular matrix adhesion proteins and integrins (adhesion receptors). Importantly, we demonstrated that FRA1 upregulation decreased the expression of integrin α11 (collagen receptor) and integrins β5 and β8 (fibronectin receptors). Functionally, these gene changes were consistent with the cell adhesion assay results that revealed a decreased ability of CGL1FRA1 cells to adhere to collagen and fibronectin. In contrast, integrin α4 expression was elevated with FRA1 upregulation. In comparison to our previous study on tumorigenic GIM cells, the re-expression of FRA1 also increased integrin α4 expression. Interestingly, integrin α4 does not contain a ligand-binding domain and, therefore, does not participate in cellular adhesion [83]. Integrin α4 is involved in lymphocyte homing [84], suggesting the involvement of FRA1 in immune regulation. In contrast to the current study, re-expression of FRA1 in GIM cells increased integrin α3 and α5 expression and no change in the expression of the other integrins. The differing results in CGL1 and GIM cells demonstrate the effects of FRA1 on integrin expression are cell-type dependent. Indeed, we have previously shown that GIM cells are tumorigenic and display epithelial-like morphology, whereas CGL1 cells are fibroblast-like and are nontumorigenic [53,59,63]. Moreover, there are over a thousand genes differentially expressed between GIM and CGL1 cells, demonstrating that these cell types are transcriptionally dissimilar [53,55]. In addition, there are other studies that also report cell-type-dependent regulation of integrin expression via FRA1 activation. For example, FRA1 represses the transcription of αV and β3 integrin genes in endothelial cells [21], while FRA1 activation induces the expression of integrin α6 in canine kidney cells [85].
In addition to integrin expression, Figure 4 illustrates that FRA1 overexpression altered the expression of extracellular matrix genes. Here, the gene expression of fibronectin 1 and collagen subtypes 14A1 and 16A1 were significantly downregulated, while there was a modest increase in the gene expression of collagen subtypes 3A1, 4A5, and 8A1, along with decreased expression of laminin subunit β2. We also identified decreased expression of TGFB1 and its direct downstream target gene (TGFBI) [86]. TGFβ1 promotes the expression of various adhesion molecules, including fibronectin and collagen [87]. Therefore, FRA1 overexpression-mediated downregulation of TGFB1 may explain the reduced expression of matrix proteins. We also showed that downstream target genes of fibronectin, MMP2, and MMP3, were downregulated (Figure 4D) [88]. MMPs are matrix metalloproteinases and are involved in the breakdown of extracellular matrix proteins [89]. Given the overall reduced expression of matrix proteins with FRA1 overexpression, the decreased expression of MMP genes is congruent with the overall shift in extracellular matrix genes. Finally, TGFβ1 is a positive regulator of the epithelial-to-mesenchymal transition (EMT), and fibronectin is a classic mesenchymal marker [90]. The reduced expression of TGFβ1 and fibronectin with FRA1 overexpression suggests that FRA1 prevents EMT in CGL1 cells. Interestingly, this response seems to be cell-type dependent. In mammary epithelial cells, FRA1 expression promotes TGFβ1 and fibronectin expression, leading to increased EMT and tumorigenic profile [22].
In addition to the regulation of cell adhesion, FRA1 overexpression promoted cell cycle progression and the transcription of genes that support G1 transition. First, FRA1 overexpression reduced the gene expression of CDK20, a marker for the G1 phase of the cell cycle [78]. Second, FRA1 overexpression upregulated the expression of STXBP4, a positive regulator of G1/S cell cycle transition [91]. Third, the expression of genes involved in S and G2 cell cycle phases were modestly upregulated, including URGCP and EVI5 [92,93], while the expression of the growth arrest gene GAS7 was reduced [79]. Finally, the expression of genes related to the preparation for mitosis was upregulated, including SETDB2, L3MBTL1, STIL, CENPP, ESPL1, and EVI5 [94]. Taken together, these transcriptional responses suggest that FRA1 overexpression promotes the exit of cells from the G1 cell cycle phase. Indeed, the cell cycle assay demonstrated that CGL1FRA1 cells demonstrated a significant decrease in the distribution of cells in the G1 phase of the cell cycle relative to CGL1dCas9 cells (Figure 5). Consistent with these results, there was also a non-significant increase in CGL1FRA1 cells at the G2 and S phase of the cell cycle. Similarly, Casalino et al. reported the role of FRA1 in cell cycle regulation and identified cyclin A (CCNA2) as a novel transcriptional target of FRA1 [95]. In our study, CCNA2 was also significantly upregulated by 27% with FRA1 overexpression (FDR p-value < 0.05); however, CCNA2 is not present on the DEG list (Supplementary Table S1), as our criteria for gene-fold change was set to <−1.5 or >1.5. Collectively, the gene-expression data and cell cycle assay demonstrate that FRA1 overexpression promotes cell cycle progression.
In addition to cell cycle and adhesion, multiple lines of evidence point towards the role of FRA1 overexpression in immune regulation. For example, the GO enrichment analysis identified chemokine activity as a top molecular function. Further review of the RNA-seq DEG list revealed 24 genes that are involved in the immune system. The following genes were upregulated with FRA1 overexpression and are involved in cytokine production or downstream cytokine signaling: IL6ST, CSF2RA, IFNGR2, CXCL12, TNFSF13, N4BP2L2, TMEM106A, and CD177 [96,97,98]. In addition, the majority of immune related DEGs with FRA1 overexpression were downregulated and are categorized as follows: (1) proinflammatory cytokine signaling genes (CCL2, CCL5, INAVA, TRIM13, HERC5, IFIH1, DDX58, CEBPD, and NFKBIA), (2) interferon-specific signaling-pathway genes (IRF7, ISG15, and IFI44), or (3) immune-cell activation genes (KMT2C, NFATC2, COLEC12, and TCF7L1) [99,100,101]. The overall trend suggests that FRA1 overexpression mediates anti-inflammatory transcriptional changes in CGL1 cells.
In addition, previous studies have illustrated the role of FRA1 in regulating cytokine production. For example, overexpression of FRA1 in RAW264.7 cells decreased LPS-stimulated IL-6 production [57]. Furthermore, in medullary thymic epithelial cells, FRA1 increased the expression of cytokines CCL-5, CCL-19, and CCL-21, while the expression of IL-1β, IL-6, IL-8, and ICAM1 was downregulated [102]. In terms of inflammatory conditions, FRA1 expression has been primarily associated with increased inflammation. For instance, FRA1 activation enhanced macrophage-mediated inflammation [56]. FRA1 expression is also correlated with the severity of inflammatory bowel diseases [103]. Here, FRA1 knockdown ameliorated inflammation and barrier damage in ulcerative colitis [104]. In contrast to these reports, the gene-expression results from the current study suggest that FRA1 overexpression mediates anti-inflammatory transcriptional changes in CGL1 cells. Therefore, the effects of FRA1 on immune regulation are likely cell-type dependent.
We and others have previously shown that FRA1 serves as a tumor suppressor in cervical cancer models [53,54,55,59,63]. The CGL1 cells used in this study are a precancerous model of cervical cancer [53,54,55]. Although not the focus of this study, the overall results presented in this study point to numerous lines of evidence supporting the role of FRA1 as a tumor suppressor. First, FRA1 overexpression upregulated the expression of genes involved in DNA damage repair: KLHL15 [105], AUNIP [106], DNAJC14 [107], DDB2 [108], and NFRKB [109]. Interestingly, KLHL15 and AUNIP were the two highest upregulated genes in CGL1FRA1 cells in terms of fold change (Figure 2C). KLHL15 is a ubiquitin ligase that promotes homologous recombination (HR) repair over nonhomologous end-joining (NHEJ) [110], and AUNIP binds to damaged DNA and promotes double-strand break repair [106]. DDB2 is involved in nucleotide excision repair (NER), while DNAJC14 and NFRKB augment the core DNA damage repair systems [111]. The increased basal expression of these DNA-repair genes suggests a tumor-suppressive phenotype. Second, the overexpression of FRA1 downregulated the expression of the following genes involved in transformation and tumor promotion: WNT9A [112], AXIN2 [113], and MYB [114]. WNT9a promotes osteosarcoma and its expression is controlled by cFos expression [112]. In our study, FRA1 overexpression suppressed cFos, thereby explaining reduced WNT9a expression. AXIN2 is a scaffolding protein of the Wnt signaling pathway and promotes cancer-cell invasion and metastasis in various types of cancers [113,115]. MYB encodes for a transcription factor that participates in hematopoiesis but is also an established proto-oncogene that drives tumorigenesis [116,117]. In addition, FRA1 overexpression upregulated EIPR1 (also known as TSSC1), a tumor-suppressor gene [118]. EIPR1 is located in the imprinted gene domain of 11p15.5, an important tumor-suppressor gene region [119]. Third, FRA1 overexpression suppressed the genes involved in EMT (TGFB1, FN1, etc.) [120]. EMT is a hallmark of cancer progression [121]. Finally, inflammation has a role in promoting tumor progression [122]. A review of clinical data and mouse studies demonstrated that tumor-suppressor inactivation enhanced inflammation and promoted tumor progression [80]. In our study, FRA1 overexpression promoted anti-inflammatory transcriptional changes, further emphasizing the impact of FRA1 in tumor suppression. Taken together, there are multiple lines of evidence supporting the role of FRA1 as a tumor suppressor in CGL1 cells. In future studies, we plan on examining whether CGL1FRA1 cells demonstrate altered cellular transformation. The CGL1 cells undergo spontaneous transformation or can be induced to form tumorigenic transformants with high doses (7 Gy) of radiation. Based on the results of this paper, we predict that FRA1 overexpression will reduce the frequency of radiation-induced neoplastic transformation in CGL1 cells.
In summary, we have unraveled the transcriptional and functional effects of FRA1 overexpression. The results from this study demonstrate that FRA1 upregulation leads to global transcriptional perturbations, reduced cellular adhesion, and altered cell cycle progression. This study also sheds light on the potential roles of FRA1 in immune regulation and tumor suppression. In congruence with the literature, our results further emphasize that the cellular and molecular effects of FRA1 are cell-type dependent. Further research is needed to comprehensively understand the role of FRA1 in cell biology.

Supplementary Materials

The following supporting information can be downloaded at: https://www.mdpi.com/article/10.3390/cells12192344/s1, Table S1: Full list of 298 DEGs in CGL1FRA1 cells relative to CGL1dCas9 cells presented in alphabetical order. Figure S1: Representative cell cycle distribution images of CGL1FRA1 and CGL1dCas9 cells.

Author Contributions

Conceptualization, W.A.-k., J.P., M.S.M., T.C.T., C.T. and S.T.; Methodology, W.A.-k., J.P., J.D., T.L., C.T. and S.T.; Formal Analysis, W.A.-k., J.P., J.D., N.D., T.L., C.T. and S.T.; Investigation, W.A.-k., J.P., J.D., N.D., T.L., C.T. and S.T.; Resources, N.K., S.J.L., M.S.M., D.R.B., T.C.T., C.T. and S.T.; Writing—Original Draft Preparation, W.A.-k., C.T. and S.T.; Writing—Review and Editing, W.A.-k., J.P., J.D., T.L., N.K., S.J.L., M.S.M., D.R.B., T.C.T., C.T. and S.T.; Supervision, T.C.T., C.T. and S.T.; Project Administration, W.A.-k., J.D., T.L., T.C.T., C.T. and S.T.; Funding Acquisition, N.K., S.J.L., M.S.M., D.R.B., T.C.T., C.T. and S.T. All authors have read and agreed to the published version of the manuscript.

Funding

This research was funded by the following agencies and grants: (1) Natural Sciences and Engineering Research Council of Canada (NSERC) Collaborative Research and Development in partnership with Bruce Power and the Nuclear Innovation Institute, (2) NSERC Discovery Grant, (3) Northern Cancer Foundation, (4) Northern Ontario School of Medicine University Faculty Association Research Development Award, (5) Canada Graduate Scholarships—Master’s program, and (6) Ontario Graduate Scholarship.

Institutional Review Board Statement

Not applicable.

Informed Consent Statement

Not applicable.

Data Availability Statement

The data that support the findings of this study are available from the corresponding author upon a reasonable request.

Acknowledgments

The authors thank Graysen Vigneux for guidance on the adhesion assay.

Conflicts of Interest

D.R.B. was previously employed by the company Bruce Power. Other authors declare no conflict of interest.

References

  1. Sobolev, V.V.; Khashukoeva, A.Z.; Evina, O.E.; Geppe, N.A.; Chebysheva, S.N.; Korsunskaya, I.M.; Tchepourina, E.; Mezentsev, A. Role of the Transcription Factor FOSL1 in Organ Development and Tumorigenesis. Int. J. Mol. Sci. 2022, 23, 1521. [Google Scholar] [CrossRef] [PubMed]
  2. Casalino, L.; Talotta, F.; Cimmino, A.; Verde, P. The Fra-1/AP-1 Oncoprotein: From the “Undruggable” Transcription Factor to Therapeutic Targeting. Cancers 2022, 14, 1480. [Google Scholar] [CrossRef] [PubMed]
  3. Galvagni, F.; Orlandini, M.; Oliviero, S. Role of the AP-1 transcription factor FOSL1 in endothelial cells adhesion and migration. Cell Adhes. Migr. 2013, 7, 408–411. [Google Scholar] [CrossRef]
  4. Matsuo, K.; Owens, J.M.; Tonko, M.; Elliott, C.; Chambers, T.J.; Wagner, E.F. Fosl1 is a transcriptional target of c-Fos during osteoclast differentiation. Nat. Genet. 2000, 24, 184–187. [Google Scholar] [CrossRef]
  5. Wang, C.; Li, Z.; Shao, F.; Yang, X.; Feng, X.; Shi, S.; Gao, Y.; He, J. High expression of Collagen Triple Helix Repeat Containing 1 (CTHRC1) facilitates progression of oesophageal squamous cell carcinoma through MAPK/MEK/ERK/FRA-1 activation. J. Exp. Clin. Cancer Res. CR 2017, 36, 84. [Google Scholar] [CrossRef] [PubMed]
  6. Bejjani, F.; Evanno, E.; Zibara, K.; Piechaczyk, M.; Jariel-Encontre, I. The AP-1 transcriptional complex: Local switch or remote command? Biochim. Et Biophys. Acta. Rev. Cancer 2019, 1872, 11–23. [Google Scholar] [CrossRef]
  7. John, M.; Leppik, R.; Busch, S.J.; Granger-Schnarr, M.; Schnarr, M. DNA binding of Jun and Fos bZip domains: Homodimers and heterodimers induce a DNA conformational change in solution. Nucleic Acids Res. 1996, 24, 4487–4494. [Google Scholar] [CrossRef]
  8. Lee, W.; Mitchell, P.; Tjian, R. Purified transcription factor AP-1 interacts with TPA-inducible enhancer elements. Cell 1987, 49, 741–752. [Google Scholar] [CrossRef] [PubMed]
  9. Park, Y.G.; Nesterova, M.; Agrawal, S.; Cho-Chung, Y.S. Dual blockade of cyclic AMP response element- (CRE) and AP-1-directed transcription by CRE-transcription factor decoy oligonucleotide. gene-specific inhibition of tumor growth. J. Biol. Chem. 1999, 274, 1573–1580. [Google Scholar] [CrossRef]
  10. Karin, M.; Liu, Z.; Zandi, E. AP-1 function and regulation. Curr. Opin. Cell Biol. 1997, 9, 240–246. [Google Scholar] [CrossRef] [PubMed]
  11. Wisdom, R. AP-1: One switch for many signals. Exp. Cell Res. 1999, 253, 180–185. [Google Scholar] [CrossRef]
  12. Zeng, F.; He, J.; Jin, X.; Liao, Q.; Chen, Z.; Peng, H.; Zhou, Y. FRA-1: A key factor regulating signal transduction of tumor cells and a potential target molecule for tumor therapy. Biomed. Pharmacother. Biomed. Pharmacother. 2022, 150, 113037. [Google Scholar] [CrossRef]
  13. Glover, J.N.; Harrison, S.C. Crystal structure of the heterodimeric bZIP transcription factor c-Fos-c-Jun bound to DNA. Nature 1995, 373, 257–261. [Google Scholar] [CrossRef] [PubMed]
  14. Halazonetis, T.D.; Georgopoulos, K.; Greenberg, M.E.; Leder, P. c-Jun dimerizes with itself and with c-Fos, forming complexes of different DNA binding affinities. Cell 1988, 55, 917–924. [Google Scholar] [CrossRef] [PubMed]
  15. Fan, F.; Podar, K. The Role of AP-1 Transcription Factors in Plasma Cell Biology and Multiple Myeloma Pathophysiology. Cancers 2021, 13, 2326. [Google Scholar] [CrossRef] [PubMed]
  16. Nishina, T.; Deguchi, Y.; Miura, R.; Yamazaki, S.; Shinkai, Y.; Kojima, Y.; Okumura, K.; Kumagai, Y.; Nakano, H. Critical Contribution of Nuclear Factor Erythroid 2-related Factor 2 (NRF2) to Electrophile-induced Interleukin-11 Production. The J. Biol. Chem. 2017, 292, 205–216. [Google Scholar] [CrossRef]
  17. Takada, Y.; Gresh, L.; Bozec, A.; Ikeda, E.; Kamiya, K.; Watanabe, M.; Kobayashi, K.; Asano, K.; Toyama, Y.; Wagner, E.F.; et al. Interstitial lung disease induced by gefitinib and toll-like receptor ligands is mediated by Fra-1. Oncogene 2011, 30, 3821–3832. [Google Scholar] [CrossRef]
  18. Niidome, K.; Taniguchi, R.; Yamazaki, T.; Tsuji, M.; Itoh, K.; Ishihara, Y. FosL1 Is a Novel Target of Levetiracetam for Suppressing the Microglial Inflammatory Reaction. Int. J. Mol. Sci. 2021, 22, 10962. [Google Scholar] [CrossRef]
  19. Wu, H.Y.; Zhou, Y.M.; Liao, Z.Q.; Zhong, J.W.; Liu, Y.B.; Zhao, H.; Liang, C.Q.; Huang, R.J.; Park, K.S.; Feng, S.S.; et al. Fosl1 is vital to heart regeneration upon apex resection in adult Xenopus tropicalis. NPJ Regen. Med. 2021, 6, 36. [Google Scholar] [CrossRef]
  20. Kakumoto, K.; Sasai, K.; Sukezane, T.; Oneyama, C.; Ishimaru, S.; Shibutani, K.; Mizushima, H.; Mekada, E.; Hanafusa, H.; Akagi, T. FRA1 is a determinant for the difference in RAS-induced transformation between human and rat fibroblasts. Proc. Natl. Acad. Sci. USA 2006, 103, 5490–5495. [Google Scholar] [CrossRef]
  21. Evellin, S.; Galvagni, F.; Zippo, A.; Neri, F.; Orlandini, M.; Incarnato, D.; Dettori, D.; Neubauer, S.; Kessler, H.; Wagner, E.F.; et al. FOSL1 controls the assembly of endothelial cells into capillary tubes by direct repression of alphav and beta3 integrin transcription. Mol. Cell. Biol. 2013, 33, 1198–1209. [Google Scholar] [CrossRef]
  22. Bakiri, L.; Macho-Maschler, S.; Custic, I.; Niemiec, J.; Guio-Carrion, A.; Hasenfuss, S.C.; Eger, A.; Muller, M.; Beug, H.; Wagner, E.F. Fra-1/AP-1 induces EMT in mammary epithelial cells by modulating Zeb1/2 and TGFbeta expression. Cell Death Differ. 2015, 22, 336–350. [Google Scholar] [CrossRef]
  23. Shao, S.; Liu, Y.; Hong, W.; Mo, Y.; Shu, F.; Jiang, L.; Tan, N. Influence of FOSL1 Inhibition on Vascular Calcification and ROS Generation through Ferroptosis via P53-SLC7A11 Axis. Biomedicines 2023, 11, 635. [Google Scholar] [CrossRef] [PubMed]
  24. Luther, J.; Driessler, F.; Megges, M.; Hess, A.; Herbort, B.; Mandic, V.; Zaiss, M.M.; Reichardt, A.; Zech, C.; Tuckermann, J.P.; et al. Elevated Fra-1 expression causes severe lipodystrophy. J. Cell Sci. 2011, 124, 1465–1476. [Google Scholar] [CrossRef] [PubMed]
  25. Gillies, T.E.; Pargett, M.; Minguet, M.; Davies, A.E.; Albeck, J.G. Linear Integration of ERK Activity Predominates over Persistence Detection in Fra-1 Regulation. Cell Syst. 2017, 5, 549–563. [Google Scholar] [CrossRef] [PubMed]
  26. Talotta, F.; Casalino, L.; Verde, P. The nuclear oncoprotein Fra-1: A transcription factor knocking on therapeutic applications’ door. Oncogene 2020, 39, 4491–4506. [Google Scholar] [CrossRef] [PubMed]
  27. Young, M.R.; Nair, R.; Bucheimer, N.; Tulsian, P.; Brown, N.; Chapp, C.; Hsu, T.C.; Colburn, N.H. Transactivation of Fra-1 and consequent activation of AP-1 occur extracellular signal-regulated kinase dependently. Mol. Cell. Biol. 2002, 22, 587–598. [Google Scholar] [CrossRef]
  28. Cursons, J.; Leuchowius, K.J.; Waltham, M.; Tomaskovic-Crook, E.; Foroutan, M.; Bracken, C.P.; Redfern, A.; Crampin, E.J.; Street, I.; Davis, M.J.; et al. Stimulus-dependent differences in signalling regulate epithelial-mesenchymal plasticity and change the effects of drugs in breast cancer cell lines. Cell Commun. Signal. CCS 2015, 13, 26. [Google Scholar] [CrossRef] [PubMed]
  29. Catani, M.V.; Rossi, A.; Costanzo, A.; Sabatini, S.; Levrero, M.; Melino, G.; Avigliano, L. Induction of gene expression via activator protein-1 in the ascorbate protection against UV-induced damage. Biochem. J. 2001, 356, 77–85. [Google Scholar] [CrossRef] [PubMed]
  30. Limoge, M.; Safina, A.; Beattie, A.; Kapus, L.; Truskinovsky, A.M.; Bakin, A.V. Tumor-fibroblast interactions stimulate tumor vascularization by enhancing cytokine-driven production of MMP9 by tumor cells. Oncotarget 2017, 8, 35592–35608. [Google Scholar] [CrossRef]
  31. Eferl, R.; Hoebertz, A.; Schilling, A.F.; Rath, M.; Karreth, F.; Kenner, L.; Amling, M.; Wagner, E.F. The Fos-related antigen Fra-1 is an activator of bone matrix formation. EMBO J. 2004, 23, 2789–2799. [Google Scholar] [CrossRef]
  32. Dai, C.; Rennhack, J.P.; Arnoff, T.E.; Thaker, M.; Younger, S.T.; Doench, J.G.; Huang, A.Y.; Yang, A.; Aguirre, A.J.; Wang, B.; et al. SMAD4 represses FOSL1 expression and pancreatic cancer metastatic colonization. Cell Rep. 2021, 36, 109443. [Google Scholar] [CrossRef]
  33. Terasawa, K.; Okazaki, K.; Nishida, E. Regulation of c-Fos and Fra-1 by the MEK5-ERK5 pathway. Genes Cells Devoted Mol. Cell. Mech. 2003, 8, 263–273. [Google Scholar] [CrossRef]
  34. Basbous, J.; Chalbos, D.; Hipskind, R.; Jariel-Encontre, I.; Piechaczyk, M. Ubiquitin-independent proteasomal degradation of Fra-1 is antagonized by Erk1/2 pathway-mediated phosphorylation of a unique C-terminal destabilizer. Mol. Cell. Biol. 2007, 27, 3936–3950. [Google Scholar] [CrossRef]
  35. Talotta, F.; Mega, T.; Bossis, G.; Casalino, L.; Basbous, J.; Jariel-Encontre, I.; Piechaczyk, M.; Verde, P. Heterodimerization with Fra-1 cooperates with the ERK pathway to stabilize c-Jun in response to the RAS oncoprotein. Oncogene 2010, 29, 4732–4740. [Google Scholar] [CrossRef] [PubMed]
  36. Belguise, K.; Kersual, N.; Galtier, F.; Chalbos, D. FRA-1 expression level regulates proliferation and invasiveness of breast cancer cells. Oncogene 2005, 24, 1434–1444. [Google Scholar] [CrossRef]
  37. Bakiri, L.; Takada, Y.; Radolf, M.; Eferl, R.; Yaniv, M.; Wagner, E.F.; Matsuo, K. Role of heterodimerization of c-Fos and Fra1 proteins in osteoclast differentiation. Bone 2007, 40, 867–875. [Google Scholar] [CrossRef]
  38. Shirsat, N.V.; Shaikh, S.A. Overexpression of the immediate early gene fra-1 inhibits proliferation, induces apoptosis, and reduces tumourigenicity of c6 glioma cells. Exp. Cell Res. 2003, 291, 91–100. [Google Scholar] [CrossRef] [PubMed]
  39. Rattanasinchai, C.; Llewellyn, B.J.; Conrad, S.E.; Gallo, K.A. MLK3 regulates FRA-1 and MMPs to drive invasion and transendothelial migration in triple-negative breast cancer cells. Oncogenesis 2017, 6, e345. [Google Scholar] [CrossRef] [PubMed]
  40. Jochum, W.; David, J.P.; Elliott, C.; Wutz, A.; Plenk, H., Jr.; Matsuo, K.; Wagner, E.F. Increased bone formation and osteosclerosis in mice overexpressing the transcription factor Fra-1. Nat. Med. 2000, 6, 980–984. [Google Scholar] [CrossRef]
  41. Jiang, X.; Xie, H.; Dou, Y.; Yuan, J.; Zeng, D.; Xiao, S. Expression and function of FRA1 protein in tumors. Mol. Biol. Rep. 2020, 47, 737–752. [Google Scholar] [CrossRef] [PubMed]
  42. Sayan, A.E.; Stanford, R.; Vickery, R.; Grigorenko, E.; Diesch, J.; Kulbicki, K.; Edwards, R.; Pal, R.; Greaves, P.; Jariel-Encontre, I.; et al. Fra-1 controls motility of bladder cancer cells via transcriptional upregulation of the receptor tyrosine kinase AXL. Oncogene 2012, 31, 1493–1503. [Google Scholar] [CrossRef]
  43. Gao, X.Q.; Ge, Y.S.; Shu, Q.H.; Ma, H.X. Expression of Fra-1 in human hepatocellular carcinoma and its prognostic significance. Tumour Biol. J. Int. Soc. Oncodevelopmental Biol. Med. 2017, 39, 1010428317709635. [Google Scholar] [CrossRef] [PubMed]
  44. Kim, Y.H.; Oh, J.H.; Kim, N.H.; Choi, K.M.; Kim, S.J.; Baik, S.H.; Choi, D.S.; Lee, E.S. Fra-1 expression in malignant and benign thyroid tumor. Korean J. Intern. Med. 2001, 16, 93–97. [Google Scholar] [CrossRef] [PubMed]
  45. He, J.; Zhu, G.; Gao, L.; Chen, P.; Long, Y.; Liao, S.; Yi, H.; Yi, W.; Pei, Z.; Wu, M.; et al. Fra-1 is upregulated in gastric cancer tissues and affects the PI3K/Akt and p53 signaling pathway in gastric cancer. Int. J. Oncol. 2015, 47, 1725–1734. [Google Scholar] [CrossRef] [PubMed]
  46. Kimura, R.; Ishikawa, C.; Rokkaku, T.; Janknecht, R.; Mori, N. Phosphorylated c-Jun and Fra-1 induce matrix metalloproteinase-1 and thereby regulate invasion activity of 143B osteosarcoma cells. Biochim. Et Biophys. Acta 2011, 1813, 1543–1553. [Google Scholar] [CrossRef]
  47. Iskit, S.; Schlicker, A.; Wessels, L.; Peeper, D.S. Fra-1 is a key driver of colon cancer metastasis and a Fra-1 classifier predicts disease-free survival. Oncotarget 2015, 6, 43146–43161. [Google Scholar] [CrossRef]
  48. Dikshit, A.; Jin, Y.J.; Degan, S.; Hwang, J.; Foster, M.W.; Li, C.Y.; Zhang, J.Y. UBE2N Promotes Melanoma Growth via MEK/FRA1/SOX10 Signaling. Cancer Res. 2018, 78, 6462–6472. [Google Scholar] [CrossRef]
  49. Hanson, R.L.; Brown, R.B.; Steele, M.M.; Grandgenett, P.M.; Grunkemeyer, J.A.; Hollingsworth, M.A. Identification of FRA-1 as a novel player in pancreatic cancer in cooperation with a MUC1: ERK signaling axis. Oncotarget 2016, 7, 39996–40011. [Google Scholar] [CrossRef]
  50. Ma, K.; Chang, D.; Gong, M.; Ding, F.; Luo, A.; Tian, F.; Liu, Z.; Wang, T. Expression and significance of FRA-1 in non-small-cell lung cancer. Cancer Investig. 2009, 27, 353–359. [Google Scholar] [CrossRef]
  51. Zhang, M.; Liang, L.; He, J.; He, Z.; Yue, C.; Jin, X.; Gao, M.; Xiao, S.; Zhou, Y. Fra-1 Inhibits Cell Growth and the Warburg Effect in Cervical Cancer Cells via STAT1 Regulation of the p53 Signaling Pathway. Front. Cell Dev. Biol. 2020, 8, 579629. [Google Scholar] [CrossRef] [PubMed]
  52. Xiao, S.; Zhou, Y.; Yi, W.; Luo, G.; Jiang, B.; Tian, Q.; Li, Y.; Xue, M. Fra-1 is downregulated in cervical cancer tissues and promotes cervical cancer cell apoptosis by p53 signaling pathway in vitro. Int. J. Oncol. 2015, 46, 1677–1684. [Google Scholar] [CrossRef] [PubMed]
  53. Pirkkanen, J.S.; Boreham, D.R.; Mendonca, M.S. The CGL1 (HeLa x Normal Skin Fibroblast) Human Hybrid Cell Line: A History of Ionizing Radiation Induced Effects on Neoplastic Transformation and Novel Future Directions in SNOLAB. Radiat. Res. 2017, 188, 512–524. [Google Scholar] [CrossRef] [PubMed]
  54. Pirkkanen, J.; Tharmalingam, S.; Thome, C.; Sinex, H.C.; Benjamin, L.V.; Losch, A.C.; Borgmann, A.J.; Dhaemers, R.M.; Gordon, G.; Boreham, D.R.; et al. Genomic Loss and Epigenetic Silencing of the FOSL1 Tumor Suppressor Gene in Radiation-induced Neoplastic Transformation of Human CGL1 Cells Alters the Tumorigenic Phenotype In Vitro and In Vivo. Radiat. Res. 2023, 200, 48–64. [Google Scholar] [CrossRef]
  55. Pirkkanen, J.; Tharmalingam, S.; Morais, I.H.; Lam-Sidun, D.; Thome, C.; Zarnke, A.M.; Benjamin, L.V.; Losch, A.C.; Borgmann, A.J.; Sinex, H.C.; et al. Transcriptomic profiling of gamma ray induced mutants from the CGL1 human hybrid cell system reveals novel insights into the mechanisms of radiation-induced carcinogenesis. Free. Radic. Biol. Med. 2019, 145, 300–311. [Google Scholar] [CrossRef]
  56. Hannemann, N.; Cao, S.; Eriksson, D.; Schnelzer, A.; Jordan, J.; Eberhardt, M.; Schleicher, U.; Rech, J.; Ramming, A.; Uebe, S.; et al. Transcription factor Fra-1 targets arginase-1 to enhance macrophage-mediated inflammation in arthritis. J. Clin. Investig. 2019, 129, 2669–2684. [Google Scholar] [CrossRef]
  57. Morishita, H.; Saito, F.; Kayama, H.; Atarashi, K.; Kuwata, H.; Yamamoto, M.; Takeda, K. Fra-1 negatively regulates lipopolysaccharide-mediated inflammatory responses. Int. Immunol. 2009, 21, 457–465. [Google Scholar] [CrossRef]
  58. Cao, S.; Schnelzer, A.; Hannemann, N.; Schett, G.; Soulat, D.; Bozec, A. The Transcription Factor FRA-1/AP-1 Controls Lipocalin-2 Expression and Inflammation in Sepsis Model. Front. Immunol. 2021, 12, 701675. [Google Scholar] [CrossRef] [PubMed]
  59. Mendonca, M.S.; Antoniono, R.J.; Latham, K.M.; Stanbridge, E.J.; Redpath, J.L. Characterization of intestinal alkaline phosphatase expression and the tumorigenic potential of gamma-irradiated HeLa x fibroblast cell hybrids. Cancer Res. 1991, 51, 4455–4462. [Google Scholar]
  60. Redpath, J.L.; Sun, C.; Colman, M.; Stanbridge, E.J. Radiobiological studies of human hybrid cells (skin fibroblasts X HeLa) and their tumourigenic segregants. Int. J. Radiat. Biol. Relat. Stud. Phys. Chem. Med. 1985, 48, 479–483. [Google Scholar] [CrossRef]
  61. Redpath, J.L.; Sun, C.; Colman, M.; Stanbridge, E.J. Neoplastic transformation of human hybrid cells by gamma radiation: A quantitative assay. Radiat. Res. 1987, 110, 468–472. [Google Scholar] [CrossRef] [PubMed]
  62. Mendonca, M.S.; Farrington, D.L.; Mayhugh, B.M.; Qin, Y.; Temples, T.; Comerford, K.; Chakrabarti, R.; Zainabadi, K.; Redpath, J.L.; Stanbridge, E.J.; et al. Homozygous deletions within the 11q13 cervical cancer tumor-suppressor locus in radiation-induced, neoplastically transformed human hybrid cells. Genes Chromosomes Cancer 2004, 39, 277–287. [Google Scholar] [CrossRef] [PubMed]
  63. Mendonca, M.S.; Howard, K.; Desmond, L.A.; Derrow, C.W. Previous loss of chromosome 11 containing a suppressor locus increases radiosensitivity, neoplastic transformation frequency and delayed death in HeLa x fibroblast human hybrid cells. Mutagenesis 1999, 14, 483–490. [Google Scholar] [CrossRef]
  64. Maeder, M.L.; Linder, S.J.; Cascio, V.M.; Fu, Y.; Ho, Q.H.; Joung, J.K. CRISPR RNA-guided activation of endogenous human genes. Nat. Methods 2013, 10, 977–979. [Google Scholar] [CrossRef]
  65. Konermann, S.; Brigham, M.D.; Trevino, A.E.; Joung, J.; Abudayyeh, O.O.; Barcena, C.; Hsu, P.D.; Habib, N.; Gootenberg, J.S.; Nishimasu, H.; et al. Genome-scale transcriptional activation by an engineered CRISPR-Cas9 complex. Nature 2015, 517, 583–588. [Google Scholar] [CrossRef] [PubMed]
  66. Casas-Mollano, J.A.; Zinselmeier, M.H.; Erickson, S.E.; Smanski, M.J. CRISPR-Cas Activators for Engineering Gene Expression in Higher Eukaryotes. CRISPR J. 2020, 3, 350–364. [Google Scholar] [CrossRef]
  67. Khurana, S.; Grandbois, J.; Tharmalingam, S.; Murray, A.; Graff, K.; Nguyen, P.; Tai, T.C. Fetal programming of adrenal PNMT and hypertension by glucocorticoids in WKY rats is dose and sex-dependent. PLoS ONE 2019, 14, e0221719. [Google Scholar] [CrossRef] [PubMed]
  68. Lamothe, J.; Khurana, S.; Tharmalingam, S.; Williamson, C.; Byrne, C.J.; Khaper, N.; Mercier, S.; Tai, T.C. The Role of DNMT and HDACs in the Fetal Programming of Hypertension by Glucocorticoids. Oxid. Med. Cell Longev. 2020, 2020, 5751768. [Google Scholar] [CrossRef]
  69. Vigneux, G.; Pirkkanen, J.; Laframboise, T.; Prescott, H.; Tharmalingam, S.; Thome, C. Radiation-Induced Alterations in Proliferation, Migration, and Adhesion in Lens Epithelial Cells and Implications for Cataract Development. Bioengineering 2022, 9, 29. [Google Scholar] [CrossRef]
  70. Davidson, C.Q.; Tharmalingam, S.; Niccoli, S.; Nemec-Bakk, A.; Khurana, S.; Murray, A.; Tai, T.C.; Boreham, D.R.; Khaper, N.; Lees, S.J. Dose threshold for radiation induced fetal programming in a mouse model at 4 months of age: Hepatic expression of genes and proteins involved in glucose metabolism and glucose uptake in brown adipose tissue. PLoS ONE 2020, 15, e0231650. [Google Scholar] [CrossRef] [PubMed]
  71. Murray, A.; Tharmalingam, S.; Khurana, S.; Lalonde, C.; Nguyen, P.; Tai, T.C. Effect of Prenatal Glucocorticoid Exposure on Circadian Rhythm Gene Expression in the Brains of Adult Rat Offspring. Cells 2022, 11, 1613. [Google Scholar] [CrossRef]
  72. Livak, K.J.; Schmittgen, T.D. Analysis of relative gene expression data using real-time quantitative PCR and the 2(-Delta Delta C(T)) Method. Methods 2001, 25, 402–408. [Google Scholar] [CrossRef] [PubMed]
  73. Puukila, S.; Tharmalingam, S.; Al-Khayyat, W.; Peterson, J.; Hooker, A.M.; Muise, S.; Boreham, D.R.; Dixon, D.L. Transcriptomic Response in the Spleen after Whole-Body Low-Dose X-Ray Irradiation. Radiat. Res. 2021, 196, 66–73. [Google Scholar] [CrossRef] [PubMed]
  74. Tharmalingam, S.; Daulat, A.M.; Antflick, J.E.; Ahmed, S.M.; Nemeth, E.F.; Angers, S.; Conigrave, A.D.; Hampson, D.R. Calcium-sensing receptor modulates cell adhesion and migration via integrins. J. Biol. Chem. 2011, 286, 40922–40933. [Google Scholar] [CrossRef]
  75. Tharmalingam, S.; Wu, C.; Hampson, D.R. The calcium-sensing receptor and integrins modulate cerebellar granule cell precursor differentiation and migration. Dev. Neurobiol. 2016, 76, 375–389. [Google Scholar] [CrossRef]
  76. Peterson, J.; McTiernan, C.D.; Thome, C.; Khaper, N.; Lees, S.J.; Boreham, D.R.; Tai, T.C.; Tharmalingam, S. Identification of Radiation-Induced miRNA Biomarkers Using the CGL1 Cell Model System. Bioengineering 2022, 9, 214. [Google Scholar] [CrossRef] [PubMed]
  77. Tharmalingam, S.; Khurana, S.; Murray, A.; Lamothe, J.; Tai, T.C. Whole transcriptome analysis of adrenal glands from prenatal glucocorticoid programmed hypertensive rodents. Sci. Rep. 2020, 10, 18755. [Google Scholar] [CrossRef]
  78. Lai, L.; Shin, G.Y.; Qiu, H. The Role of Cell Cycle Regulators in Cell Survival-Dual Functions of Cyclin-Dependent Kinase 20 and p21(Cip1/Waf1). Int. J. Mol. Sci. 2020, 21, 8504. [Google Scholar] [CrossRef]
  79. Ju, Y.T.; Chang, A.C.; She, B.R.; Tsaur, M.L.; Hwang, H.M.; Chao, C.C.; Cohen, S.N.; Lin-Chao, S. gas7: A gene expressed preferentially in growth-arrested fibroblasts and terminally differentiated Purkinje neurons affects neurite formation. Proc. Natl. Acad. Sci. USA 1998, 95, 11423–11428. [Google Scholar] [CrossRef]
  80. Yang, L.; Karin, M. Roles of tumor suppressors in regulating tumor-associated inflammation. Cell Death Differ. 2014, 21, 1677–1686. [Google Scholar] [CrossRef]
  81. Cohen, D.R.; Ferreira, P.C.; Gentz, R.; Franza, B.R., Jr.; Curran, T. The product of a fos-related gene, fra-1, binds cooperatively to the AP-1 site with Jun: Transcription factor AP-1 is comprised of multiple protein complexes. Genes Dev. 1989, 3, 173–184. [Google Scholar] [CrossRef] [PubMed]
  82. Pecce, V.; Verrienti, A.; Fiscon, G.; Sponziello, M.; Conte, F.; Abballe, L.; Durante, C.; Farina, L.; Filetti, S.; Paci, P. The role of FOSL1 in stem-like cell reprogramming processes. Sci. Rep. 2021, 11, 14677. [Google Scholar] [CrossRef] [PubMed]
  83. Irie, A.; Kamata, T.; Takada, Y. Multiple loop structures critical for ligand binding of the integrin alpha4 subunit in the upper face of the beta-propeller mode 1. Proc. Natl. Acad. Sci. USA 1997, 94, 7198–7203. [Google Scholar] [CrossRef] [PubMed]
  84. Rose, D.M.; Han, J.; Ginsberg, M.H. Alpha4 integrins and the immune response. Immunol. Rev. 2002, 186, 118–124. [Google Scholar] [CrossRef]
  85. Zhang, K.; Myllymaki, S.M.; Gao, P.; Devarajan, R.; Kytola, V.; Nykter, M.; Wei, G.H.; Manninen, A. Oncogenic K-Ras upregulates ITGA6 expression via FOSL1 to induce anoikis resistance and synergizes with alphaV-Class integrins to promote EMT. Oncogene 2017, 36, 5681–5694. [Google Scholar] [CrossRef]
  86. Ge, J.; Apicella, M.; Mills, J.A.; Garcon, L.; French, D.L.; Weiss, M.J.; Bessler, M.; Mason, P.J. Dysregulation of the Transforming Growth Factor beta Pathway in Induced Pluripotent Stem Cells Generated from Patients with Diamond Blackfan Anemia. PLoS ONE 2015, 10, e0134878. [Google Scholar] [CrossRef] [PubMed]
  87. Kim, K.K.; Sheppard, D.; Chapman, H.A. TGF-beta1 Signaling and Tissue Fibrosis. Cold Spring Harb. Perspect. Biol. 2018, 10, a022293. [Google Scholar] [CrossRef]
  88. Esparza, J.; Vilardell, C.; Calvo, J.; Juan, M.; Vives, J.; Urbano-Marquez, A.; Yague, J.; Cid, M.C. Fibronectin upregulates gelatinase B (MMP-9) and induces coordinated expression of gelatinase A (MMP-2) and its activator MT1-MMP (MMP-14) by human T lymphocyte cell lines. A process repressed through RAS/MAP kinase signaling pathways. Blood 1999, 94, 2754–2766. [Google Scholar] [CrossRef]
  89. Birkedal-Hansen, H.; Moore, W.G.; Bodden, M.K.; Windsor, L.J.; Birkedal-Hansen, B.; DeCarlo, A.; Engler, J.A. Matrix metalloproteinases: A review. Crit. Rev. Oral Biol. Med. Off. Publ. Am. Assoc. Oral Biol. 1993, 4, 197–250. [Google Scholar] [CrossRef]
  90. Lee, J.M.; Dedhar, S.; Kalluri, R.; Thompson, E.W. The epithelial-mesenchymal transition: New insights in signaling, development, and disease. J. Cell Biol. 2006, 172, 973–981. [Google Scholar] [CrossRef]
  91. Li, Y.; Peart, M.J.; Prives, C. Stxbp4 regulates DeltaNp63 stability by suppression of RACK1-dependent degradation. Mol. Cell. Biol. 2009, 29, 3953–3963. [Google Scholar] [CrossRef] [PubMed]
  92. Hong, L.; Qing, O.; Ji, Z.; Chengqu, Z.; Ying, C.; Hao, C.; Minhui, X.; Lunshan, X. Downregulation of miR-16 via URGCP pathway contributes to glioma growth. Sci. Rep. 2017, 7, 13470. [Google Scholar] [CrossRef] [PubMed]
  93. Eldridge, A.G.; Loktev, A.V.; Hansen, D.V.; Verschuren, E.W.; Reimann, J.D.; Jackson, P.K. The evi5 oncogene regulates cyclin accumulation by stabilizing the anaphase-promoting complex inhibitor emi1. Cell 2006, 124, 367–380. [Google Scholar] [CrossRef] [PubMed]
  94. Nath, S.; Ghatak, D.; Das, P.; Roychoudhury, S. Transcriptional control of mitosis: Deregulation and cancer. Front. Endocrinol. 2015, 6, 60. [Google Scholar] [CrossRef] [PubMed]
  95. Casalino, L.; Bakiri, L.; Talotta, F.; Weitzman, J.B.; Fusco, A.; Yaniv, M.; Verde, P. Fra-1 promotes growth and survival in RAS-transformed thyroid cells by controlling cyclin A transcription. EMBO J. 2007, 26, 1878–1890. [Google Scholar] [CrossRef] [PubMed]
  96. Chauhan, P.; Nair, A.; Patidar, A.; Dandapat, J.; Sarkar, A.; Saha, B. A primer on cytokines. Cytokine 2021, 145, 155458. [Google Scholar] [CrossRef]
  97. Bignold, R.; Johnson, J.R. Effects of cytokine signaling inhibition on inflammation-driven tissue remodeling. Curr. Res. Pharmacol. Drug Discov. 2021, 2, 100023. [Google Scholar] [CrossRef]
  98. O’Shea, J.J.; Murray, P.J. Cytokine signaling modules in inflammatory responses. Immunity 2008, 28, 477–487. [Google Scholar] [CrossRef]
  99. Hanada, T.; Yoshimura, A. Regulation of cytokine signaling and inflammation. Cytokine Growth Factor Rev. 2002, 13, 413–421. [Google Scholar] [CrossRef]
  100. Barrat, F.J.; Crow, M.K.; Ivashkiv, L.B. Interferon target-gene expression and epigenomic signatures in health and disease. Nat. Immunol. 2019, 20, 1574–1583. [Google Scholar] [CrossRef]
  101. Singh, H.; Khan, A.A.; Dinner, A.R. Gene regulatory networks in the immune system. Trends Immunol. 2014, 35, 211–218. [Google Scholar] [CrossRef]
  102. Li, Q.R.; Ni, W.P.; Lei, N.J.; Yang, J.Y.; Xuan, X.Y.; Liu, P.P.; Gong, G.M.; Yan, F.; Feng, Y.S.; Zhao, R.; et al. The overexpression of Fra1 disorders the inflammatory cytokine secretion by mTEC of myasthenia gravis thymus. Scand. J. Immunol. 2018, 88, e12676. [Google Scholar] [CrossRef] [PubMed]
  103. Wang, X.; Guo, R.; Lv, Y.; Fu, R. The regulatory role of Fos related antigen-1 in inflammatory bowel disease. Mol. Med. Rep. 2018, 17, 1979–1985. [Google Scholar] [CrossRef]
  104. Ma, L.; Zhang, X.; Zhang, C.; Hou, B.; Zhao, H. FOSL1 knockdown ameliorates DSS-induced inflammation and barrier damage in ulcerative colitis via MMP13 downregulation. Exp. Ther. Med. 2022, 24, 551. [Google Scholar] [CrossRef] [PubMed]
  105. Wang, C.; Tang, M.; Chen, Z.; Nie, L.; Li, S.; Xiong, Y.; Szymonowicz, K.A.; Park, J.M.; Zhang, H.; Feng, X.; et al. Genetic vulnerabilities upon inhibition of DNA damage response. Nucleic Acids Res. 2021, 49, 8214–8231. [Google Scholar] [CrossRef]
  106. Lou, J.; Chen, H.; Han, J.; He, H.; Huen, M.S.Y.; Feng, X.H.; Liu, T.; Huang, J. AUNIP/C1orf135 directs DNA double-strand breaks towards the homologous recombination repair pathway. Nat. Commun. 2017, 8, 985. [Google Scholar] [CrossRef]
  107. Moura, D.S.; Pena-Chilet, M.; Cordero Varela, J.A.; Alvarez-Alegret, R.; Agra-Pujol, C.; Izquierdo, F.; Ramos, R.; Ortega-Medina, L.; Martin-Davila, F.; Castilla-Ramirez, C.; et al. A DNA damage repair gene-associated signature predicts responses of patients with advanced soft-tissue sarcoma to treatment with trabectedin. Mol. Oncol. 2021, 15, 3691–3705. [Google Scholar] [CrossRef]
  108. Stoyanova, T.; Roy, N.; Kopanja, D.; Raychaudhuri, P.; Bagchi, S. DDB2 (damaged-DNA binding protein 2) in nucleotide excision repair and DNA damage response. Cell Cycle 2009, 8, 4067–4071. [Google Scholar] [CrossRef]
  109. Wang, W.; Mani, A.M.; Wu, Z.H. DNA damage-induced nuclear factor-kappa B activation and its roles in cancer progression. J. Cancer Metastasis Treat. 2017, 3, 45–59. [Google Scholar] [CrossRef] [PubMed]
  110. Ferretti, L.P.; Himmels, S.F.; Trenner, A.; Walker, C.; von Aesch, C.; Eggenschwiler, A.; Murina, O.; Enchev, R.I.; Peter, M.; Freire, R.; et al. Cullin3-KLHL15 ubiquitin ligase mediates CtIP protein turnover to fine-tune DNA-end resection. Nat. Commun. 2016, 7, 12628. [Google Scholar] [CrossRef]
  111. Tharmalingam, S.; Sreetharan, S.; Brooks, A.L.; Boreham, D.R. Re-evaluation of the linear no-threshold (LNT) model using new paradigms and modern molecular studies. Chem. Biol. Interact. 2019, 301, 54–67. [Google Scholar] [CrossRef]
  112. Matsuoka, K.; Bakiri, L.; Wolff, L.I.; Linder, M.; Mikels-Vigdal, A.; Patino-Garcia, A.; Lecanda, F.; Hartmann, C.; Sibilia, M.; Wagner, E.F. Wnt signaling and Loxl2 promote aggressive osteosarcoma. Cell Res. 2020, 30, 885–901. [Google Scholar] [CrossRef]
  113. Yook, J.I.; Li, X.Y.; Ota, I.; Hu, C.; Kim, H.S.; Kim, N.H.; Cha, S.Y.; Ryu, J.K.; Choi, Y.J.; Kim, J.; et al. A Wnt-Axin2-GSK3beta cascade regulates Snail1 activity in breast cancer cells. Nat. Cell Biol. 2006, 8, 1398–1406. [Google Scholar] [CrossRef]
  114. Liu, X.; Xu, Y.; Han, L.; Yi, Y. Reassessing the Potential of Myb-targeted Anti-cancer Therapy. J. Cancer 2018, 9, 1259–1266. [Google Scholar] [CrossRef]
  115. Yook, J.I.; Li, X.Y.; Ota, I.; Fearon, E.R.; Weiss, S.J. Wnt-dependent regulation of the E-cadherin repressor snail. J. Biol. Chem. 2005, 280, 11740–11748. [Google Scholar] [CrossRef] [PubMed]
  116. Soza-Ried, C.; Hess, I.; Netuschil, N.; Schorpp, M.; Boehm, T. Essential role of c-myb in definitive hematopoiesis is evolutionarily conserved. Proc. Natl. Acad. Sci. USA 2010, 107, 17304–17308. [Google Scholar] [CrossRef] [PubMed]
  117. Ciciro, Y.; Sala, A. MYB oncoproteins: Emerging players and potential therapeutic targets in human cancer. Oncogenesis 2021, 10, 19. [Google Scholar] [CrossRef]
  118. Hu, R.J.; Lee, M.P.; Connors, T.D.; Johnson, L.A.; Burn, T.C.; Su, K.; Landes, G.M.; Feinberg, A.P. A 2.5-Mb transcript map of a tumor-suppressing subchromosomal transferable fragment from 11p15.5, and isolation and sequence analysis of three novel genes. Genomics 1997, 46, 9–17. [Google Scholar] [CrossRef] [PubMed]
  119. Karnik, P.; Paris, M.; Williams, B.R.; Casey, G.; Crowe, J.; Chen, P. Two distinct tumor suppressor loci within chromosome 11p15 implicated in breast cancer progression and metastasis. Hum. Mol. Genet. 1998, 7, 895–903. [Google Scholar] [CrossRef]
  120. Lamouille, S.; Xu, J.; Derynck, R. Molecular mechanisms of epithelial-mesenchymal transition. Nat. Reviews. Mol. Cell Biol. 2014, 15, 178–196. [Google Scholar] [CrossRef] [PubMed]
  121. Ribatti, D.; Tamma, R.; Annese, T. Epithelial-Mesenchymal Transition in Cancer: A Historical Overview. Transl. Oncol. 2020, 13, 100773. [Google Scholar] [CrossRef] [PubMed]
  122. Zhao, H.; Wu, L.; Yan, G.; Chen, Y.; Zhou, M.; Wu, Y.; Li, Y. Inflammation and tumor progression: Signaling pathways and targeted intervention. Signal Transduct. Target. Ther. 2021, 6, 263. [Google Scholar] [CrossRef] [PubMed]
Figure 1. Establishing FRA1 overexpressing CGL1 cells using stably integrated CRISPR transcriptional activation. (A) Western blot analysis of FRA1 protein expression in CGL1 and CGL1dCas9 control cell lines and three CGL1dCas9 variants expressing unique gRNA sequences designed for FRA1 overexpression (CGL1FRA1—#1/2/3). Gapdh (glyceraldehyde 3-phosphate dehydrogenase) was used as an internal loading control. Bar graphs illustrate FRA1 protein expression relative to wild-type CGL1 cells (n = 3; *, p < 0.05). CGL1FRA1—#3 was chosen for all further downstream experiments as this CRISPR activation system demonstrated the most robust FRA1 overexpression compared to the other variants. (B) RT-qPCR analysis of FRA1 mRNA expression relative to CGL1dCas9. CGL1FRA1 demonstrated two-fold increase in FRA1 mRNA levels relative to CGL1dCas9 (n = 3; *, p < 0.05). (C) Cell growth analysis of CGL1, CGL1dCas9, and CGL1FRA1 cell lines; 100,000 cells were seeded in T25 flasks and the cell growth was quantified at 24 h intervals for seven consecutive days. There were no significant differences in the cell growth patterns for all three cell lines (n = 3). (D) Representative phase-contrast images of CGL1, CGL1dCas9, and CGL1FRA1. There were no observable differences in the cell morphology between the cell lines.
Cells 12 02344 g001
Figure 2. RNA-seq transcriptome analysis of CGL1FRA1 cells relative to CGL1dCas9 cells. (A) A volcano plot illustrating the 298 differentially expressed genes (DEG) between CGL1FRA1 and CGL1dCas9 cells (DEG criteria: fold change <−1.5 and >1.5 and FDR adjusted p-value < 0.05). The red and blue dots represent 124 upregulated genes and 174 downregulated genes, respectively, in CGL1FRA1 cells relative to CGL1dCas9 cells. The left and right sides of the plot depict highly dysregulated genes, while genes higher on the graph indicate increased statistical significance. (B) Validation of RNA-seq dataset using RT-qPCR analysis. Twelve representative genes were randomly selected from the RNA-seq analysis. This list included six DEGs (ITGA4, FOSL1, CD24, ITGβ8, FOS, and FN1) and six non-DEGs (CCND1, EGFR, JUN, ITGB1, LAMA1, and CTNNB1). The graph represents CGL1FRA1 gene expression relative to CGL1dCas9 (CGL1FRA1—#1 and CGL1FRA1—#3 represent unique gRNA variants). The mRNA fold change between RNA-seq and RT-qPCR analyses were similar in magnitude and significance across the twelve representative genes (n = 3; *, p < 0.05). (C) Top 15 upregulated genes and (D) top 15 downregulated genes identified from the RNA-seq analysis of CGL1FRA1 cells relative to CGL1dCas9 cells, presented with gene description, p-value (p), and ranked based on fold change (F.C.). Abbreviations: CCND1 (cyclin D1), CTNNB1 (catenin beta 1), EGFR (epidermal growth-factor receptor), FN1 (fibronectin 1), FOS (Fos proto-oncogene), FOSL1 (FOS like 1), ITGA4 (integrin subunit alpha 4), ITGB1 (integrin subunit beta 1), ITGB8 (integrin subunit beta 8), JUN (Jun proto-oncogene), and LAMA1 (laminin subunit alpha 1).
Cells 12 02344 g002
Figure 3. FRA1 upregulation alters the expression of core AP-1 complex members. (A) RNA-seq mRNA expression analysis of AP-1 complex gene members. CGL1FRA1 gene expression is represented as fold change ± SEM relative to CGL1dCas9 cells (n = 3; *, p < 0.05). (B) Representative Western blot images of FRA1, cJun, and cFos protein expression in CGL1dCas9 and CGL1FRA1 cells. α-Tubulin was used as an internal loading control. (C) Bar graphs illustrate CGL1FRA1 protein expression relative to CGL1dCas9 cells (*, p < 0.05). The dashed line indicates CGL1dCas9 protein expression. Abbreviations: FOS (Fos proto-oncogene), FOSB (FosB proto-oncogene), FOSL1 (FOS like 1), FOSL2 (FOS like 2), JUN (Jun proto-oncogene), JUNB (JunB proto-oncogene), and JUND (JunD proto-oncogene).
Cells 12 02344 g003
Figure 4. FRA1 upregulation alters the adhesion profile of CGL1 cells. (A) RNA-seq mRNA expression analysis of integrin family gene members. CGL1FRA1 gene expression is represented as fold change ± SEM relative to CGL1dCas9 cells (n = 3; *, p < 0.05). FRA1 upregulation alters the expression of the ECM profile in CGL1 cells. (B) Representative Western blot images of integrin α4, integrin α11, and integrin β11 protein expression in CGL1dCas9 and CGL1FRA1 cells. α-Tubulin was used in internal loading control. (C) Bar graphs illustrate CGL1FRA1 protein expression relative to CGL1dCas9 cells (*, p < 0.05). (D) RNA-seq mRNA expression analysis of select extracellular matrix (ECM) network genes. CGL1FRA1 gene expression is represented as fold change ± SEM relative to CGL1dCas9 cells (n = 3; *, p < 0.05). (E) CGL1FRA1 and CGL1dCas9 cells were assessed for adhesion to assay plates coated with 7.5 ng/μL fibronectin or 5 ng/μL collagen. The dashed line indicates the adhesion of control CGL1dCas9 cells to fibronectin and collagen. CGL1FRA1 cell adhesion is represented as fold change ± SEM relative to CGL1dCas9 cells. FRA1 overexpression decreased CGL1 cell adhesion to fibronectin and collagen (n = 3; *, p < 0.05). Abbreviations: COL14A1 (collagen type XIV alpha 1 chain), COL16A1 (collagen type XVI alpha 1 chain), COL3A1 (collagen type III alpha 1 chain), COL4A5 (collagen type IV alpha 5 chain), COL8A1 (collagen type VIII alpha 1 chain), FN1 (fibronectin 1), ITGA1 (integrin subunit alpha 1), ITGA11 (integrin subunit alpha 11), ITGA2 (integrin subunit alpha 2), ITGA3 (integrin subunit alpha 3), ITGA4 (integrin subunit alpha 4), ITGA5 (integrin subunit alpha 5), ITGA6 (integrin subunit alpha 6), ITGAE (integrin subunit alpha E), ITGB1 (integrin subunit beta 1), ITGB4 (integrin subunit beta 4), ITGB5 (integrin subunit beta 5), ITGB6 (integrin subunit beta 6), ITGB8 (integrin subunit beta 8), LAMB2 (laminin subunit beta 2), MMP2 (matrix metallopeptidase 2), MMP3 (matrix metallopeptidase 3), TGFB1 (transforming growth-factor beta 1), and TGFBI (transforming growth-factor beta induced).
Cells 12 02344 g004
Figure 5. Cell cycle analysis of CGL1FRA1 and CGL1dCas9 cells. Cells were grown for 48 h followed by a complete media change. Samples were collected at the following timepoints post media change: 2, 4, 8, and 24 h. Cell cycle phases were determined using propidium iodide (PI) nucleic acid fluorescent stain and analyzed using a flow cytometer. The cell cycle distributions of CGL1FRA1 and CGL1dCas9 cells are presented as percent G1 (A), G2 (B), and S (C). Data points represent mean ± SEM (n = 3). CGL1FRA1 cells demonstrated a significant decrease in the distribution of cells in the G1 phase of the cell cycle relative to CGL1dCas9 cells (two-way ANOVA, p = 0.0083). There was no significant difference between the distribution of CGL1FRA1 and CGL1dCas9 cells at G2 and S phase. Supplementary Figure S1 provides representative cell cycle distribution images.
Cells 12 02344 g005
Table 1. RT-qPCR primer sequences. Forward and reverse primer pairs for SYBR-Green based RT-qPCR analysis designed using Primer-BLAST and validated under stringent conditions (efficiency between 90–110% and R2 > 0.99). The optimal annealing temperature for all primer sets is 60 °C.
Gene NameGene IDPrimer Seqeunce (5′ → 3′)
CCND1NM_053056.3Forward:ATCAAGTGTGACCCGGACTG
Reverse:CTTGGGGTCCATGTTCTGCT
CD24NM_013230.3Forward:GCTCCTACCCACGCAGATTT
Reverse:GCCTTGGTGGTGGCATTAGT
CTNNB1NM_001098209.2Forward:AATCAGCTGGCCTGGTTTGA
Reverse:GCTTGGTTAGTGTGTCAGGC
EGFRNM_005228.4Forward:GAGCTCTTCGGGGAGCAG
Reverse:TCGTGCCTTGGCAAACTTTC
FN1NM_212482.2Forward:AACAAACACTAATGTTAATTGCCCA
Reverse:TCTTGGCAGAGAGACATGCTT
FOSNM_005252.4Forward:GGGGCAAGGTGGAACAGTTA
Reverse:AGTTGGTCTGTCTCCGCTTG
FOSL1NM_005438.5Forward:GCCTTGTGAACAGATCAGCC
Reverse:AGTTTGTCAGTCTCCGCCTG
ITGA4NM_000885.5Forward:GCTGTGCCTGGGGGTC
Reverse:CACTAGGAGCCATCGGTTCG
ITGB1NM_002211.4Forward:GCCGCGCGGAAAAGATGAAT
Reverse:CACAATTTGGCCCTGCTTGTA
ITGB8NM_002214.2Forward:GGCAGCTGTCTGTGAAAGTC
Reverse:CCGTCATTGGGCACCACTAT
JUNNM_002228.4Forward:CTTTTCAAAGCCGGGTAGCG
Reverse:TTTCTCTAAGAGCGCACGCA
LAMA1NM_000546.5Forward:CACTGTTCTGGAAAAGCCCG
Reverse:TCAACAAGATGTTTTGCCAACTG
RPL4NM_000968.4Forward:CACGCAAGAAGATCCATCGC
Reverse:CCGGAGCTTGTGATTCCTGG
RPS18NM_022551.2Forward:ATTAAGGGTGTGGGCCGAAG
Reverse:GGTGATCACACGTTCCACCT
Table 2. Summary of gene ontology (GO) enrichment analysis in CGL1FRA1 cells relative to CGL1dCas9 cells. Top enriched GO terms categorized as molecular functions, biological processes, and cellular components are presented ranked by q-value (FDR-adjusted p-value). The table includes the total number of genes annotated within the GO database (Total Genes), and the number of DEGs identified in each GO term (DEGs). GO analysis was performed by iPathwayGuide (AdvaitaBio) using the DEGs identified from the RNA-seq analysis of CGL1FRA1 relative to CGL1dCas9 cells. GO profiles suggest that FRA1 overexpression causes shifts in the extracellular matrix profile, cellular adhesion characteristics, transcription-factor binding, chemokine activity, and regulation of developmental processes.
GO IDMolecular FunctionsDEGsTotal Genesq-Value
GO:0005201extracellular matrix structural constituent11890.00570
GO:0005539glycosaminoglycan binding111010.00975
GO:0000981DNA-binding transcription-factor activity (RNA polymerase II) 398630.01125
GO:0005178integrin binding10950.01125
GO:0030296protein tyrosine kinase activator activity4110.01125
GO:0005518collagen binding7460.01125
GO:0008009chemokine activity350.01125
GO:0003700DNA-binding transcription-factor activity398940.01125
GO:0000978RNA polymerase II cis-regulatory DNA binding357700.01125
GO:0001664G protein-coupled receptor binding111220.01125
GO IDBiological ProcessesDEGsTotal Genesq-value
GO:0051240positive regulation of multicellular organismal process457890.00012
GO:0051239regulation of multicellular organismal process6814810.00012
GO:0051094positive regulation of developmental process437600.00016
GO:0050793regulation of developmental process6514660.00049
GO:2000026regulation of multicellular organismal development427830.00060
GO:0048731system development10328180.00069
GO:0009605response to external stimulus6214060.00069
GO:0032501multicellular organismal process13039200.00174
GO:0050789regulation of biological process19968730.00174
GO:0042127regulation of cell population proliferation469710.00257
GO IDCellular ComponentsDEGsTotal Genesq-value
GO:0030312external encapsulating structure26267<0.00001
GO:0031012extracellular matrix26267<0.00001
GO:0062023collagen-containing extracellular matrix192100.00016
GO:0071944cell periphery10228190.00072
Disclaimer/Publisher’s Note: The statements, opinions and data contained in all publications are solely those of the individual author(s) and contributor(s) and not of MDPI and/or the editor(s). MDPI and/or the editor(s) disclaim responsibility for any injury to people or property resulting from any ideas, methods, instructions or products referred to in the content.

