
Methods to Assess Proliferation of Stimulated Human Lymphocytes In Vitro: A Narrative Review

Abstract
:1. Introduction
2. Results and Discussion
2.1. Applications of LPT
2.1.1. T Cell Immunodeficiency
2.1.2. Metal-Specific LPTs
2.2. LPT Alternatives
2.2.1. Proliferation Assays
Memory Lymphocyte Immunostimulation Assay (MELISA®)
2.2.2. Flow-Cytometry-Based Proliferation Assays
Nucleotide-Based: Bromodeoxyuridine/5-Bromo-2′-deoxyuridine (BrdU) Assay
Nucleotide-Based: Ethynyldeoxyuridine/5-Ethynyl-2′-deoxyuridine (EdU) Assay
Dye-Based: Carboxyfluorescein Succinimidyl Ester (CFSE) Assay
Dye-Based: Flow-Cytometric Assay for Specific Cell-Mediated Immune Response in Activated Whole Blood (FASCIA)
Dye-Based: Paul Karl Horan (PKH) Dyes
Dye-Based: Violet Proliferation Dye 450 (VPD-450)
2.2.3. Flow-Cytometry-Based Immunophenotyping
Activation Markers: CD69+, CD25+, and HLA-DR+
Proliferation Marker: Ki-67+
2.2.4. Colorimetric Assay(s)
3-(4,5-Dimethyl thiazol-2-yl)-2,5-indiphenyl Tetrazolium Bromide (MTT) Colorimetric Assay
2.3. Future Perspectives
3. Concluding Remarks
Author Contributions
Funding
Institutional Review Board Statement
Informed Consent Statement
Data Availability Statement
Conflicts of Interest
Abbreviations
References
- Di Blasi, D.; Claessen, I.; Turksma, A.W.; van Beek, J.; ten Brinke, A. Guidelines for analysis of low-frequency antigen-specific T cell results: Dye-based proliferation assay vs 3H-thymidine incorporation. J. Immunol. Methods 2020, 487, 112907. [Google Scholar] [CrossRef] [PubMed]
- Parish, C.R. Fluorescent dyes for lymphocyte migration and proliferation studies. Immunol. Cell Biol. 1999, 77, 499–508. [Google Scholar] [CrossRef] [PubMed] [Green Version]
- Kleiveland, C.R. Peripheral Blood Mononuclear Cells. In The Impact of Food Bioactives on Health; Verhoeckx, K., Cotter, P., López-Expósito, I., Kleiveland, C., Lea, T., Mackie, A., Requena, T., Swiatecka, D., Wichers, H., Eds.; Springer International Publishing: Cham, Switzerland, 2015; pp. 161–167. ISBN 978-3-319-15791-7. Available online: http://link.springer.com/10.1007/978-3-319-16104-4_15 (accessed on 28 January 2022).
- Hines, S.E.; Pacheco, K.; Maier, L.A. The role of lymphocyte proliferation tests in assessing occupational sensitization and disease. Curr. Opin. Allergy Clin. Immunol. 2012, 12, 102–110. [Google Scholar] [CrossRef]
- Johansen, J.D.; Aalto-Korte, K.; Agner, T.; Andersen, K.E.; Bircher, A.; Bruze, M.; Cannavó, A.; Giménez-Arnau, A.; Gonçalo, M.; Goossens, A.; et al. European Society of Contact Dermatitis guideline for diagnostic patch testing—Recommendations on best practice: ESCD PATCH TEST GUIDELINE. Contact Dermatitis 2015, 73, 195–221. [Google Scholar] [CrossRef] [PubMed]
- Brenan, M.; Parish, C.R. Intracellular fluorescent labelling of cells for analysis of lymphocyte migration. J. Immunol. Methods 1984, 74, 31–38. [Google Scholar] [CrossRef] [PubMed]
- Ten Brinke, A.; Marek-Trzonkowska, N.; Mansilla, M.J.; Turksma, A.W.; Piekarska, K.; Iwaszkiewicz-Grześ, D.; Passerini, L.; Locafaro, G.; Puñet-Ortiz, J.; van Ham, S.M.; et al. Monitoring T-Cell Responses in Translational Studies: Optimization of Dye-Based Proliferation Assay for Evaluation of Antigen-Specific Responses. Front. Immunol. 2017, 8, 1870. [Google Scholar] [CrossRef] [PubMed]
- Farris, G.M.; Newman, L.S.; Frome, E.L.; Shou, Y.; Barker, E.; Habbersett, R.C.; Maier, L.; Smith, H.N.; Marrone, B.L. Detection of beryllium sensitivity using a flow cytometric lymphocyte proliferation test: The Immuno-Be-LPT. Toxicology 2000, 143, 125–140. [Google Scholar] [CrossRef]
- Reichard, P.; Estborn, B. Utilization of desoxyribosides in the synthesis of polynucleotides. J. Biol. Chem. 1951, 188, 839–846. [Google Scholar] [CrossRef]
- Samuel, G.; Maier, L.A. Immunology of chronic beryllium disease. Curr. Opin. Allergy Clin. Immunol. 2008, 8, 126–134. [Google Scholar] [CrossRef] [PubMed]
- Frome, E.L.; Newman, L.S.; Cragle, D.L.; Colyer, S.P.; Wambach, P.F. Identification of an abnormal beryllium lymphocyte proliferation test. Toxicology 2003, 183, 39–56. [Google Scholar] [CrossRef]
- Edgar, J.D.M. T cell immunodeficiency. J. Clin. Pathol. 2008, 61, 988–993. [Google Scholar] [CrossRef]
- Lee, H.-J.; Gau, C.-C.; Lee, W.-F.; Lee, W.-I.; Huang, J.-L.; Chen, S.-H.; Yeh, H.-Y.; Liang, C.-J.; Fu, S.-H. Comparison of [3H]-Thymidine, Carboxyfluorescein Diacetate Succinimidyl Ester and Ki-67 in Lymphocyte Proliferation. Front. Pediatr. 2022, 10, 638549. [Google Scholar] [CrossRef] [PubMed]
- Falta, M.T.; Bowerman, N.A.; Dai, S.; Kappler, J.W.; Fontenot, A.P. Linking genetic susceptibility and T cell activation in beryllium-induced disease. Proc. Am. Thorac. Soc. 2010, 7, 126–129. [Google Scholar] [CrossRef]
- Newman, L.S. Immunotoxicology of beryllium lung disease. Environ. Health Prev. Med. 2007, 12, 161–164. [Google Scholar] [CrossRef]
- Mroz, M.M.; Maier, L.A.; Strand, M.; Silviera, L.; Newman, L.S. Beryllium lymphocyte proliferation test surveillance identifies clinically significant beryllium disease. Am. J. Ind. Med. 2009, 52, 762–773. [Google Scholar] [CrossRef] [PubMed] [Green Version]
- Chronic beryllium disease prevention program. Office of Environment, Safety and Health, Department of Energy. Final rule. Fed. Regist. 1999, 64, 68854–68914. [Google Scholar]
- Redline, S.; Barna, B.P.; Tomashefski, J.F.; Abraham, J.L. Granulomatous disease associated with pulmonary deposition of titanium. Br. J. Ind. Med. 1986, 43, 652–656. [Google Scholar] [CrossRef] [PubMed]
- Fireman, E.; Goshen, M.; Ganor, E.; Spirer, Z.; Lerman, Y. Induced sputum as an additional tool in the identification of metal-induced sarcoid-like reaction. Sarcoidosis Vasc. Diffuse Lung Dis. 2004, 21, 152–156. [Google Scholar]
- De Vuyst, P.; Dumortier, P.; Schandené, L.; Estenne, M.; Verhest, A.; Yernault, J.C. Sarcoidlike lung granulomatosis induced by aluminum dusts. Am. Rev. Respir. Dis. 1987, 135, 493–497. [Google Scholar] [CrossRef]
- Kwon, Y.-M.; Thomas, P.; Summer, B.; Pandit, H.; Taylor, A.; Beard, D.; Murray, D.W.; Gill, H.S. Lymphocyte proliferation responses in patients with pseudotumors following metal-on-metal hip resurfacing arthroplasty. J. Orthop. Res. 2010, 28, 444–450. [Google Scholar] [CrossRef]
- Kreiss, K.; Wasserman, S.; Mroz, M.M.; Newman, L.S. Beryllium disease screening in the ceramics industry. Blood lymphocyte test performance and exposure-disease relations. J. Occup. Med. 1993, 35, 267–274. [Google Scholar] [PubMed]
- Pacheco, K.; Barker, L.; Maier, L.; Erb, S.; Sills, M.; Knight, V. Development of a validated blood test for nickel sensitization. J. Allergy Clin. Immunol. 2013, 132, 767–769. [Google Scholar] [CrossRef] [PubMed]
- Frigerio, E.; Pigatto, P.D.; Guzzi, G.; Altomare, G. Metal sensitivity in patients with orthopaedic implants: A prospective study. Contact Dermatitis 2011, 64, 273–279. [Google Scholar] [CrossRef]
- Martin, A.K.; Mack, D.G.; Falta, M.T.; Mroz, M.M.; Newman, L.S.; Maier, L.A.; Fontenot, A.P. Beryllium-specific CD4+ T cells in blood as a biomarker of disease progression. J. Allergy Clin. Immunol. 2011, 128, 1100–1106.e5. [Google Scholar] [CrossRef] [Green Version]
- Lyons, A.B.; Parish, C.R. Determination of lymphocyte division by flow cytometry. J. Immunol. Methods 1994, 171, 131–137. [Google Scholar] [CrossRef] [PubMed]
- Stange, A.W.; Furman, F.J.; Hilmas, D.E. Rocky Flats Beryllium Health Surveillance. Environ. Health Perspect. 1996, 104 (Suppl. 5), 981–986. [Google Scholar] [CrossRef] [Green Version]
- Fireman, E.; Shai, A.B.; Alcalay, Y.; Ophir, N.; Kivity, S.; Stejskal, V. Identification of metal sensitization in sarcoid-like metal-exposed patients by the MELISA® lymphocyte proliferation test—A pilot study. J. Occup. Med. Toxicol. 2016, 11, 18. [Google Scholar] [CrossRef] [Green Version]
- Solius, G.M.; Maltsev, D.I.; Belousov, V.V.; Podgorny, O.V. Recent advances in nucleotide analogue-based techniques for tracking dividing stem cells: An overview. J. Biol. Chem. 2021, 297, 101345. [Google Scholar] [CrossRef]
- Carollo, M.; Palazzo, R.; Bianco, M.; Smits, K.; Mascart, F.; Ausiello, C.M. Antigen-specific responses assessment for the evaluation of Bordetella pertussis T cell immunity in humans. Vaccine 2012, 30, 1667–1674. [Google Scholar] [CrossRef]
- Pinto, L.A.; Galvão Castro, B.; Soares, M.B.P.; Grassi, M.F.R. An Evaluation of the Spontaneous Proliferation of Peripheral Blood Mononuclear Cells in HTLV-1-Infected Individuals Using Flow Cytometry. ISRN Oncol. 2011, 2011, 326719. [Google Scholar] [CrossRef] [Green Version]
- Last’ovicka, J.; Budinský, V.; Spísek, R.; Bartůnková, J. Assessment of lymphocyte proliferation: CFSE kills dividing cells and modulates expression of activation markers. Cell. Immunol. 2009, 256, 79–85. [Google Scholar] [CrossRef] [PubMed]
- Milovanova, T.N. Comparative analysis between CFSE flow cytometric and tritiated thymidine incorporation tests for beryllium sensitivity. Cytometry B 2007, 72, 265–275. [Google Scholar] [CrossRef] [PubMed]
- Magg, T.; Albert, M.H. Tracking cell proliferation using the far red fluorescent dye SNARF-1. Cytometry B Clin. Cytom. 2007, 72, 458–464. [Google Scholar] [CrossRef] [PubMed]
- Venken, K.; Thewissen, M.; Hellings, N.; Somers, V.; Hensen, K.; Rummens, J.-L.; Stinissen, P. A CFSE based assay for measuring CD4+CD25+ regulatory T cell mediated suppression of auto-antigen specific and polyclonal T cell responses. J. Immunol. Methods 2007, 322, 1–11. [Google Scholar] [CrossRef] [PubMed]
- Putz, T.; Ramoner, R.; Gander, H.; Rahm, A.; Bartsch, G.; Höltl, L.; Thurnher, M. Monitoring of CD4+ and CD8+ T-cell responses after dendritic cell-based immunotherapy using CFSE dye dilution analysis. J. Clin. Immunol. 2004, 24, 653–663. [Google Scholar] [CrossRef]
- Mannering, S.I.; Morris, J.S.; Jensen, K.P.; Purcell, A.W.; Honeyman, M.C.; van Endert, P.M.; Harrison, L.C. A sensitive method for detecting proliferation of rare autoantigen-specific human T cells. J. Immunol. Methods 2003, 283, 173–183. [Google Scholar] [CrossRef]
- Fulcher, D.; Wong, S. Carboxyfluorescein succinimidyl ester-based proliferative assays for assessment of T cell function in the diagnostic laboratory. Immunol. Cell Biol. 1999, 77, 559–564. [Google Scholar] [CrossRef] [Green Version]
- Angulo, R.; Fulcher, D.A. Measurement of Candida-specific blastogenesis: Comparison of carboxyfluorescein succinimidyl ester labelling of T cells, thymidine incorporation, and CD69 expression. Cytometry 1998, 34, 143–151. [Google Scholar] [CrossRef]
- Marits, P.; Wikström, A.-C.; Popadic, D.; Winqvist, O.; Thunberg, S. Evaluation of T and B lymphocyte function in clinical practice using a flow cytometry based proliferation assay. Clin. Immunol. 2014, 153, 332–342. [Google Scholar] [CrossRef]
- Weichert, H.; Blechschmidt, I.; Schröder, S.; Ambrosius, H. The MTT-assay as a rapid test for cell proliferation and cell killing: Application to human peripheral blood lymphocytes (PBL). Allerg Immunol. 1991, 37, 139–144. [Google Scholar]
- Beijer, E.; Meek, B.; Bossuyt, X.; Peters, S.; Vermeulen, R.C.H.; Kromhout, H.; Veltkamp, M. Immunoreactivity to metal and silica associates with sarcoidosis in Dutch patients. Respir. Res. 2020, 21, 141. [Google Scholar] [CrossRef] [PubMed]
- Soares, A.; Govender, L.; Hughes, J.; Mavakla, W.; de Kock, M.; Barnard, C.; Pienaar, B.; Janse van Rensburg, E.; Jacobs, G.; Khomba, G.; et al. Novel application of Ki67 to quantify antigen-specific in vitro lymphoproliferation. J. Immunol. Methods 2010, 362, 43–50. [Google Scholar] [CrossRef] [Green Version]
- Goodell, V.; dela Rosa, C.; Slota, M.; MacLeod, B.; Disis, M.L. Sensitivity and specificity of tritiated thymidine incorporation and ELISPOT assays in identifying antigen specific T cell immune responses. BMC Immunol. 2007, 8, 21. [Google Scholar] [CrossRef] [PubMed]
- Messele, T.; Roos, M.T.; Hamann, D.; Koot, M.; Fontanet, A.L.; Miedema, F.; Schellekens, P.T.; Rinke de Wit, T.F. Nonradioactive techniques for measurement of in vitro T-cell proliferation: Alternatives to the [(3)H]thymidine incorporation assay. Clin. Diagn. Lab. Immunol. 2000, 7, 687–692. [Google Scholar] [CrossRef] [PubMed] [Green Version]
- Wemme, H.; Pfeifer, S.; Heck, R.; Müller-Quernheim, J. Measurement of lymphocyte proliferation: Critical analysis of radioactive and photometric methods. Immunobiology 1992, 185, 78–89. [Google Scholar] [CrossRef]
- Stejskal, V.D.; Cederbrant, K.; Lindvall, A.; Forsbeck, M. MELISA-an in vitro tool for the study of metal allergy. Toxicol. In Vitro 1994, 8, 991–1000. [Google Scholar] [CrossRef]
- Valentine-Thon, E.; Schiwara, H.-W. Validity of MELISA for metal sensitivity testing. Neuro Endocrinol. Lett. 2003, 24, 57–64. [Google Scholar]
- Beijer, E.; Kraaijvanger, R.; Roodenburg, C.; Grutters, J.C.; Meek, B.; Veltkamp, M. Simultaneous testing of immunological sensitization to multiple antigens in sarcoidosis reveals an association with inorganic antigens specifically related to a fibrotic phenotype. Clin. Exp. Immunol. 2020, 203, 115–124. [Google Scholar] [CrossRef]
- Stejskal, V.D.; Danersund, A.; Lindvall, A.; Hudecek, R.; Nordman, V.; Yaqob, A.; Mayer, W.; Bieger, W.; Lindh, U. Metal-specific lymphocytes: Biomarkers of sensitivity in man. Neuro Endocrinol. Lett. 1999, 20, 289–298. [Google Scholar]
- Wadey, K.S.; Somos, A.; Cross, S.J.; Reolizo, L.M.; Johnson, J.L.; George, S.J. Monitoring Cellular Proliferation, Migration, and Apoptosis Associated with Atherosclerosis Plaques In Vitro. Methods Mol. Biol. 2022, 2419, 133–167. [Google Scholar] [CrossRef]
- Duque, A.; Rakic, P. Different effects of bromodeoxyuridine and [3H]thymidine incorporation into DNA on cell proliferation, position, and fate. J. Neurosci. 2011, 31, 15205–15217. [Google Scholar] [CrossRef] [Green Version]
- Salic, A.; Mitchison, T.J. A chemical method for fast and sensitive detection of DNA synthesis in vivo. Proc. Natl. Acad. Sci. USA 2008, 105, 2415–2420. [Google Scholar] [CrossRef] [Green Version]
- Breinbauer, R.; Köhn, M. Azide-alkyne coupling: A powerful reaction for bioconjugate chemistry. ChemBioChem 2003, 4, 1147–1149. [Google Scholar] [CrossRef] [PubMed]
- Ivanova, A.; Gruzova, O.; Ermolaeva, E.; Astakhova, O.; Itaman, S.; Enikolopov, G.; Lazutkin, A. Synthetic Thymidine Analog Labeling without Misconceptions. Cells 2022, 11, 1888. [Google Scholar] [CrossRef] [PubMed]
- Chehrehasa, F.; Meedeniya, A.C.B.; Dwyer, P.; Abrahamsen, G.; Mackay-Sim, A. EdU, a new thymidine analogue for labelling proliferating cells in the nervous system. J. Neurosci. Methods 2009, 177, 122–130. [Google Scholar] [CrossRef] [PubMed]
- Alvarez, K.L.F.; Poma-Acevedo, A.; Fernández-Sánchez, M.; Fernández-Díaz, M. An EdU-based flow cytometry assay to evaluate chicken T lymphocyte proliferation. BMC Vet. Res. 2020, 16, 230. [Google Scholar] [CrossRef]
- Quah, B.J.C.; Parish, C.R. The use of carboxyfluorescein diacetate succinimidyl ester (CFSE) to monitor lymphocyte proliferation. J. Vis. Exp. 2010, e2259. [Google Scholar] [CrossRef] [Green Version]
- Milovanova, T.N.; Popma, S.H.; Cherian, S.; Moore, J.S.; Rossman, M.D. Flow cytometric test for beryllium sensitivity. Cytometry B 2004, 60, 23–30. [Google Scholar] [CrossRef]
- Romar, G.A.; Kupper, T.S.; Divito, S.J. Research Techniques Made Simple: Techniques to Assess Cell Proliferation. J. Investig. Dermatol. 2016, 136, e1–e7. [Google Scholar] [CrossRef] [Green Version]
- Quah, B.J.C.; Lyons, A.B.; Parish, C.R. The Use of CFSE-like Dyes for Measuring Lymphocyte Proliferation: Experimental Considerations and Biological Variables. Math. Model. Nat. Phenom. 2012, 7, 53–64. [Google Scholar] [CrossRef]
- Parish, C.R.; Glidden, M.H.; Quah, B.J.C.; Warren, H.S. Use of the intracellular fluorescent dye CFSE to monitor lymphocyte migration and proliferation. Curr. Protoc. Immunol. 2009, 84, 4.9.1–4.9.13. [Google Scholar] [CrossRef] [PubMed]
- Terrén, I.; Orrantia, A.; Vitallé, J.; Zenarruzabeitia, O.; Borrego, F. CFSE dilution to study human T and NK cell proliferation in vitro. In Methods in Enzymology; Elsevier: Amsterdam, The Netherlands, 2020; pp. 239–255. ISBN 978-0-12-818673-2. Available online: https://linkinghub.elsevier.com/retrieve/pii/S007668791930179X (accessed on 4 June 2022).
- Gaines, H.; Andersson, L.; Biberfeld, G. A new method for measuring lymphoproliferation at the single-cell level in whole blood cultures by flow cytometry. J. Immunol. Methods 1996, 195, 63–72. [Google Scholar] [CrossRef] [PubMed]
- Ashley, D.M.; Bol, S.J.; Waugh, C.; Kannourakis, G. A novel approach to the measurement of different in vitro leukaemic cell growth parameters: The use of PKH GL fluorescent probes. Leuk. Res. 1993, 17, 873–882. [Google Scholar] [CrossRef] [PubMed]
- Allsopp, C.E.; Nicholls, S.J.; Langhorne, J. A flow cytometric method to assess antigen-specific proliferative responses of different subpopulations of fresh and cryopreserved human peripheral blood mononuclear cells. J. Immunol. Methods 1998, 214, 175–186. [Google Scholar] [CrossRef]
- Wallace, P.K.; Palmer, L.D.; Perry-Lalley, D.; Bolton, E.S.; Alexander, R.B.; Horan, P.K.; Yang, J.C.; Muirhead, K.A. Mechanisms of adoptive immunotherapy: Improved methods for in vivo tracking of tumor-infiltrating lymphocytes and lymphokine-activated killer cells. Cancer Res. 1993, 53, 2358–2367. [Google Scholar]
- Hendrikx, P.J.; Martens, C.M.; Hagenbeek, A.; Keij, J.F.; Visser, J.W. Homing of fluorescently labeled murine hematopoietic stem cells. Exp. Hematol. 1996, 24, 129–140. [Google Scholar]
- Khalaf, A.N.; Wolff-Vorbeck, G.; Bross, K.; Kerp, L.; Petersen, K.G. In vivo labelling of the spleen with a red-fluorescent cell dye. J. Immunol. Methods 1993, 165, 121–125. [Google Scholar] [CrossRef]
- Albertine, K.H.; Gee, M.H. In vivo labeling of neutrophils using a fluorescent cell linker. J. Leukoc. Biol. 1996, 59, 631–638. [Google Scholar] [CrossRef]
- Beavis, A.J.; Pennline, K.J. Tracking of murine spleen cells in vivo: Detection of PKH26-labeled cells in the pancreas of non-obese diabetic (NOD) mice. J. Immunol. Methods 1994, 170, 57–65. [Google Scholar] [CrossRef]
- Young, A.J.; Hay, J.B. Rapid turnover of the recirculating lymphocyte pool in vivo. Int. Immunol. 1995, 7, 1607–1615. [Google Scholar] [CrossRef] [Green Version]
- Boutonnat, J.; Faussat, A.-M.; Marie, J.-P.; Bignon, J.; Wdzieczak-Bakala, J.; Barbier, M.; Thierry, J.; Ronot, X.; Colle, P.-E. Usefulness of PKH fluorescent labelling to study leukemic cell proliferation with various cytostatic drugs or acetyl tetrapeptide--AcSDKP. BMC Cancer 2005, 5, 120. [Google Scholar] [CrossRef] [Green Version]
- Lemieszek, M.B.; Findlay, S.D.; Siegers, G.M. CellTraceTM Violet Flow Cytometric Assay to Assess Cell Proliferation. Methods Mol. Biol. 2022, 2508, 101–114. [Google Scholar] [CrossRef]
- Filby, A.; Begum, J.; Jalal, M.; Day, W. Appraising the suitability of succinimidyl and lipophilic fluorescent dyes to track proliferation in non-quiescent cells by dye dilution. Methods 2015, 82, 29–37. [Google Scholar] [CrossRef]
- Begum, J.; Day, W.; Henderson, C.; Purewal, S.; Cerveira, J.; Summers, H.; Rees, P.; Davies, D.; Filby, A. A method for evaluating the use of fluorescent dyes to track proliferation in cell lines by dye dilution. Cytometry A 2013, 83, 1085–1095. [Google Scholar] [CrossRef]
- Ivanov, D.P.; Parker, T.L.; Walker, D.A.; Alexander, C.; Ashford, M.B.; Gellert, P.R.; Garnett, M.C. In vitro co-culture model of medulloblastoma and human neural stem cells for drug delivery assessment. J. Biotechnol. 2015, 205, 3–13. [Google Scholar] [CrossRef] [Green Version]
- Haramoto, Y.; Onuma, Y.; Mawaribuchi, S.; Nakajima, Y.; Aiki, Y.; Higuchi, K.; Shimizu, M.; Tateno, H.; Hirabayashi, J.; Ito, Y. A technique for removing tumourigenic pluripotent stem cells using rBC2LCN lectin. Regen. Ther. 2020, 14, 306–314. [Google Scholar] [CrossRef]
- Caruso, A.; Licenziati, S.; Corulli, M.; Canaris, A.D.; De Francesco, M.A.; Fiorentini, S.; Peroni, L.; Fallacara, F.; Dima, F.; Balsari, A.; et al. Flow cytometric analysis of activation markers on stimulated T cells and their correlation with cell proliferation. Cytometry 1997, 27, 71–76. [Google Scholar] [CrossRef]
- Shipkova, M.; Wieland, E. Surface markers of lymphocyte activation and markers of cell proliferation. Clin. Chim. Acta 2012, 413, 1338–1349. [Google Scholar] [CrossRef]
- Rea, I.M.; McNerlan, S.E.; Alexander, H.D. CD69, CD25, and HLA-DR activation antigen expression on CD3+ lymphocytes and relationship to serum TNF-alpha, IFN-gamma, and sIL-2R levels in aging. Exp. Gerontol. 1999, 34, 79–93. [Google Scholar] [CrossRef]
- Santis, A.G.; Campanero, M.R.; Alonso, J.L.; Tugores, A.; Alonso, M.A.; Yagüe, E.; Pivel, J.P.; Sánchez-Madrid, F. Tumor necrosis factor-alpha production induced in T lymphocytes through the AIM/CD69 activation pathway. Eur. J. Immunol. 1992, 22, 1253–1259. [Google Scholar] [CrossRef]
- D’Ambrosio, D.; Trotta, R.; Vacca, A.; Frati, L.; Santoni, A.; Gulino, A.; Testi, R. Transcriptional regulation of interleukin-2 gene expression by CD69-generated signals. Eur. J. Immunol. 1993, 23, 2993–2997. [Google Scholar] [CrossRef]
- Thèze, J.; Alzari, P.M.; Bertoglio, J. Interleukin 2 and its receptors: Recent advances and new immunological functions. Immunol. Today 1996, 17, 481–486. [Google Scholar] [CrossRef] [PubMed]
- Maino, V.C.; Suni, M.A.; Ruitenberg, J.J. Rapid flow cytometric method for measuring lymphocyte subset activation. Cytometry 1995, 20, 127–133. [Google Scholar] [CrossRef] [PubMed]
- Gerdes, J.; Lemke, H.; Baisch, H.; Wacker, H.H.; Schwab, U.; Stein, H. Cell cycle analysis of a cell proliferation-associated human nuclear antigen defined by the monoclonal antibody Ki-67. J. Immunol. 1984, 133, 1710–1715. [Google Scholar] [CrossRef]
- Cellerai, C.; Harari, A.; Vallelian, F.; Boyman, O.; Pantaleo, G. Functional and phenotypic characterization of tetanus toxoid-specific human CD4+ T cells following re-immunization. Eur. J. Immunol. 2007, 37, 1129–1138. [Google Scholar] [CrossRef]
- Miller, J.D.; van der Most, R.G.; Akondy, R.S.; Glidewell, J.T.; Albott, S.; Masopust, D.; Murali-Krishna, K.; Mahar, P.L.; Edupuganti, S.; Lalor, S.; et al. Human effector and memory CD8+ T cell responses to smallpox and yellow fever vaccines. Immunity 2008, 28, 710–722. [Google Scholar] [CrossRef] [Green Version]
- Sachsenberg, N.; Perelson, A.S.; Yerly, S.; Schockmel, G.A.; Leduc, D.; Hirschel, B.; Perrin, L. Turnover of CD4+ and CD8+ T lymphocytes in HIV-1 infection as measured by Ki-67 antigen. J. Exp. Med. 1998, 187, 1295–1303. [Google Scholar] [CrossRef] [PubMed]
- Doisne, J.-M.; Urrutia, A.; Lacabaratz-Porret, C.; Goujard, C.; Meyer, L.; Chaix, M.-L.; Sinet, M.; Venet, A. CD8+ T cells specific for EBV, cytomegalovirus, and influenza virus are activated during primary HIV infection. J. Immunol. 2004, 173, 2410–2418. [Google Scholar] [CrossRef] [PubMed] [Green Version]
- Gerdes, J. Ki-67 and other proliferation markers useful for immunohistological diagnostic and prognostic evaluations in human malignancies. Semin. Cancer Biol. 1990, 1, 199–206. [Google Scholar]
- Seo, S.H.; Kim, K.H.; Oh, S.H.; Choi, Y.; Ahn, K.J.; Lee, J.Y.; Lee, S.M.; Park, J.; Kim, W.G. Ki-67 labeling index as a prognostic marker in advanced stomach cancer. Ann. Surg. Treat. Res. 2019, 96, 27–33. [Google Scholar] [CrossRef]
- Fulawka, L.; Blaszczyk, J.; Tabakov, M.; Halon, A. Assessment of Ki-67 proliferation index with deep learning in DCIS (ductal carcinoma in situ). Sci. Rep. 2022, 12, 3166. [Google Scholar] [CrossRef] [PubMed]
- Allred, D.C.; Harvey, J.M.; Berardo, M.; Clark, G.M. Prognostic and predictive factors in breast cancer by immunohistochemical analysis. Mod. Pathol. 1998, 11, 155–168. [Google Scholar] [PubMed]
- Präbst, K.; Engelhardt, H.; Ringgeler, S.; Hübner, H. Basic Colorimetric Proliferation Assays: MTT, WST, and Resazurin. Methods Mol. Biol. 2017, 1601, 1–17. [Google Scholar] [CrossRef] [PubMed]
- Mosmann, T. Rapid colorimetric assay for cellular growth and survival: Application to proliferation and cytotoxicity assays. J. Immunol. Methods 1983, 65, 55–63. [Google Scholar] [CrossRef] [PubMed]
- Stockert, J.C.; Horobin, R.W.; Colombo, L.L.; Blázquez-Castro, A. Tetrazolium salts and formazan products in Cell Biology: Viability assessment, fluorescence imaging, and labeling perspectives. Acta Histochem. 2018, 120, 159–167. [Google Scholar] [CrossRef] [PubMed] [Green Version]
- Marks, D.C.; Belov, L.; Davey, M.W.; Davey, R.A.; Kidman, A.D. The MTT cell viability assay for cytotoxicity testing in multidrug-resistant human leukemic cells. Leuk. Res. 1992, 16, 1165–1173. [Google Scholar] [CrossRef]
- Berridge, M.V.; Herst, P.M.; Tan, A.S. Tetrazolium dyes as tools in cell biology: New insights into their cellular reduction. Biotechnol. Annu. Rev. 2005, 11, 127–152. [Google Scholar] [CrossRef]
- Ghasemi, M.; Turnbull, T.; Sebastian, S.; Kempson, I. The MTT Assay: Utility, Limitations, Pitfalls, and Interpretation in Bulk and Single-Cell Analysis. Int. J. Mol. Sci. 2021, 22, 12827. [Google Scholar] [CrossRef]

| Methods Compared | Types of Analysis | Stimulants | Groups | Observations | References |
|---|---|---|---|---|---|
| LPT, CFSE assay, and Ki-67+ expression | Correlation performed using SPSS | ConA, PHA, PWM, BCG, and C. albicans | 9–19 controls |
| [13] |
| LPT and VPD-450 | Wilcoxon signed rank test, Spearman’s rank correlation (non-parametric), and mean of control + x times SD | Hemagglutinin peptide pools of peptides | 4 controls (vaccinated) |
| [1] |
| LPT and MELISA® | Spearman’s rho correlation | Beryllium | 4 sarcoidosis patients | Strong/perfect correlation of 1.00 (p < 0.01) between beryllium SI of MELISA® and beryllium LPT | [42] |
| LPT and VPD-450 | Spearman’s rank correlation | Allogenic antigens, C. albicans, TT, and V. zoster virus | 3 controls | Good correlation between VPD-450 precursor frequency (%) and [3H] thymidine incorporation with allogenic (r = 0.91, p < 0.0001) and pathogen-derived antigens | [7] |
| LPT and FASCIA | Correlation was performed, but statistical test was unspecified | PHA, PWM, and ConA | 12–19 controls | Good correlation: r = 0.78 was observed with LPT-cpm and number of lymphoblasts with FASCIA for all stimuli | [40] |
| LPT and CFSE assay | Linear regression model was applied and Pearson’s correlation was calculated | PT antigen and FHA | 29 controls | Significant and strong correlation between % divided of CFSEdim and LPT-cpm with PT antigen (r = 0.691, p = 0.001), but not with FHA (r = 0.198, p = 0.430) | [30] |
| LPT and CFSE assay | Spearman’s rank correlation | Spontaneous proliferation | 45 HTLV-1-infected patients and 14 controls | Positive correlation was found between the division index of cells and [3H] thymidine incorporation (r = 0.84; p = 0.001), as well as between the percentage of divided cells and [3H] thymidine incorporation (r = 0.78; p = 0.004) | [31] |
| BrdU, Ki-67+ expression, and Oregon Green—a CFSE derivative | Spearman’s rank correlation | PPD and TB10.4 protein | 15 controls | Strong and significant correlation between Ki-67+ CD4+ T cell expression and BrdU incorporation with r = 0.8–0.9. | [43] |
| LPT and CFSE assay | Spearman’s rank correlation | PHA | 128 patients with various immunological disorders and 40 controls | Highest correlation of r = 0.807 with LPT-cpm was observed for analysis of % divided T cells (CD3+, but non-significant) and r = 0.776 (and significant), was observed with % divided total lymphocyte population | [32] |
| LPT and CFSE assay | McNemar and Fisher tests, kappa statistic, Bland–Altman, and mountain plots | Beryllium | 38 Be-hyper-sensitive (7/38 with CBD), 22 Be-sensitive, and ~12 controls |
| [33] |
| LPT and ELISPOT | Linear relation; analytic performance of both assays was evaluated using AUC of ROC curves | HER-2/neu, TT, and CMV | 27 breast cancer patients |
| [44] |
| Red fluorescent dye SNARF-1, LPT, and CFSE assay | Pearson correlation (parametric) | PHA or OKT3 monoclonal antibody | Controls |
| [34] |
| LPT and CFSE assay | Spearman’s rank correlation | Autologous Tregs | 11 multiple sclerosis patients and 5 controls | Significant and strong correlation between suppression levels of Tregs obtained by CFSE assay and [3H] thymidine incorporation (r = 0.91–0.92, p < 0.01) | [35] |
| LPT and CFSE assay | No direction comparison was made | antigen KLH—type of vaccine taken up by dendritic cells | 6 renal cell carcinoma patients | Consistent results observed with both tests | [36] |
| LPT and CFSE assay | Wilcoxon signed rank test and fold difference in sensitivity to antigen | Tt, GAD | 10 controls |
| [37] |
| LPT and BrdU assay | Pearson correlation | Anti-CD3/CD28 | 26 HIV-1-infected patients and 18 controls | Strong correlation observed for BrdU assay with LPT at r = 0.82, 0.83, and 0.96 with overall (HIV+ and HIV- individuals), HIV- individuals, and HIV+ individuals, respectively | [45] |
| LPT, CFSE assay, and CD69+ expression | Correlation was performed, but statistical test unspecified | PHA | 2 patients with T cell deficiency and 11 controls | CFSE-derived values correlated well (good correlation) with the peak [3H] thymidine uptake/cpm | [38] |
| LPT, CFSE assay, and CD69+ expression | Linear and polynomial fitted correlation | C. albicans | 6 patients with previous episodes of vaginal candidiasis (exposed), 3 patients with CRVVC, and 7 controls with undocumented Candida infection (unexposed) | Strong/close correlation observed with r2 = 0.93, 0.99, 0.95, and 0.82 when weighted division index was compared with % blasts, weighted % divided, division index, and CD69 increment, respectively | [39] |
| LPT, BrdU, MTT, and NAG assay | Correlation assessed by multilinear regression analysis | PHA | Controls | Strong correlation, r = 0.89 between OD of BrdU incorporation and LPT-cpm, while MTT test revealed higher SI values | [46] |
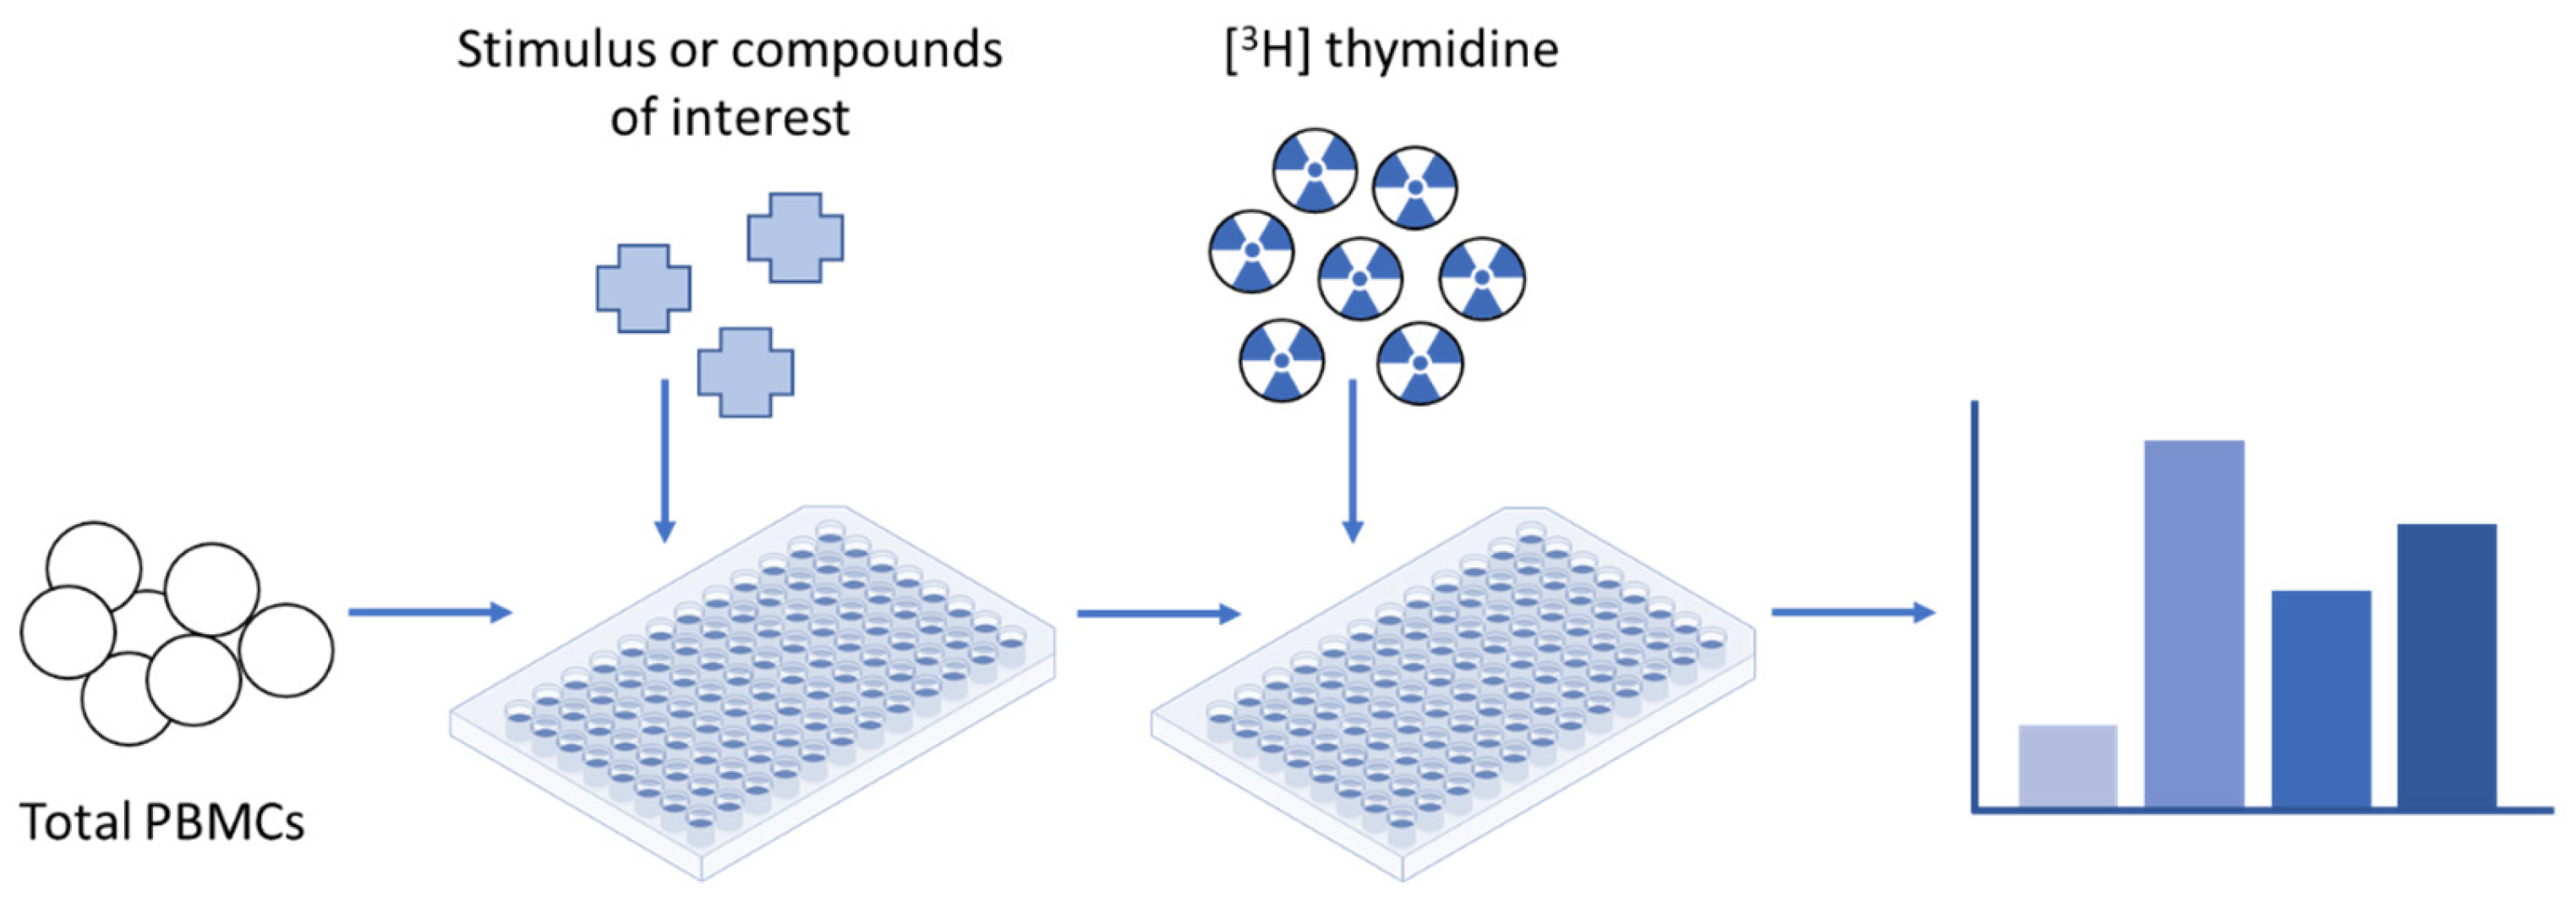
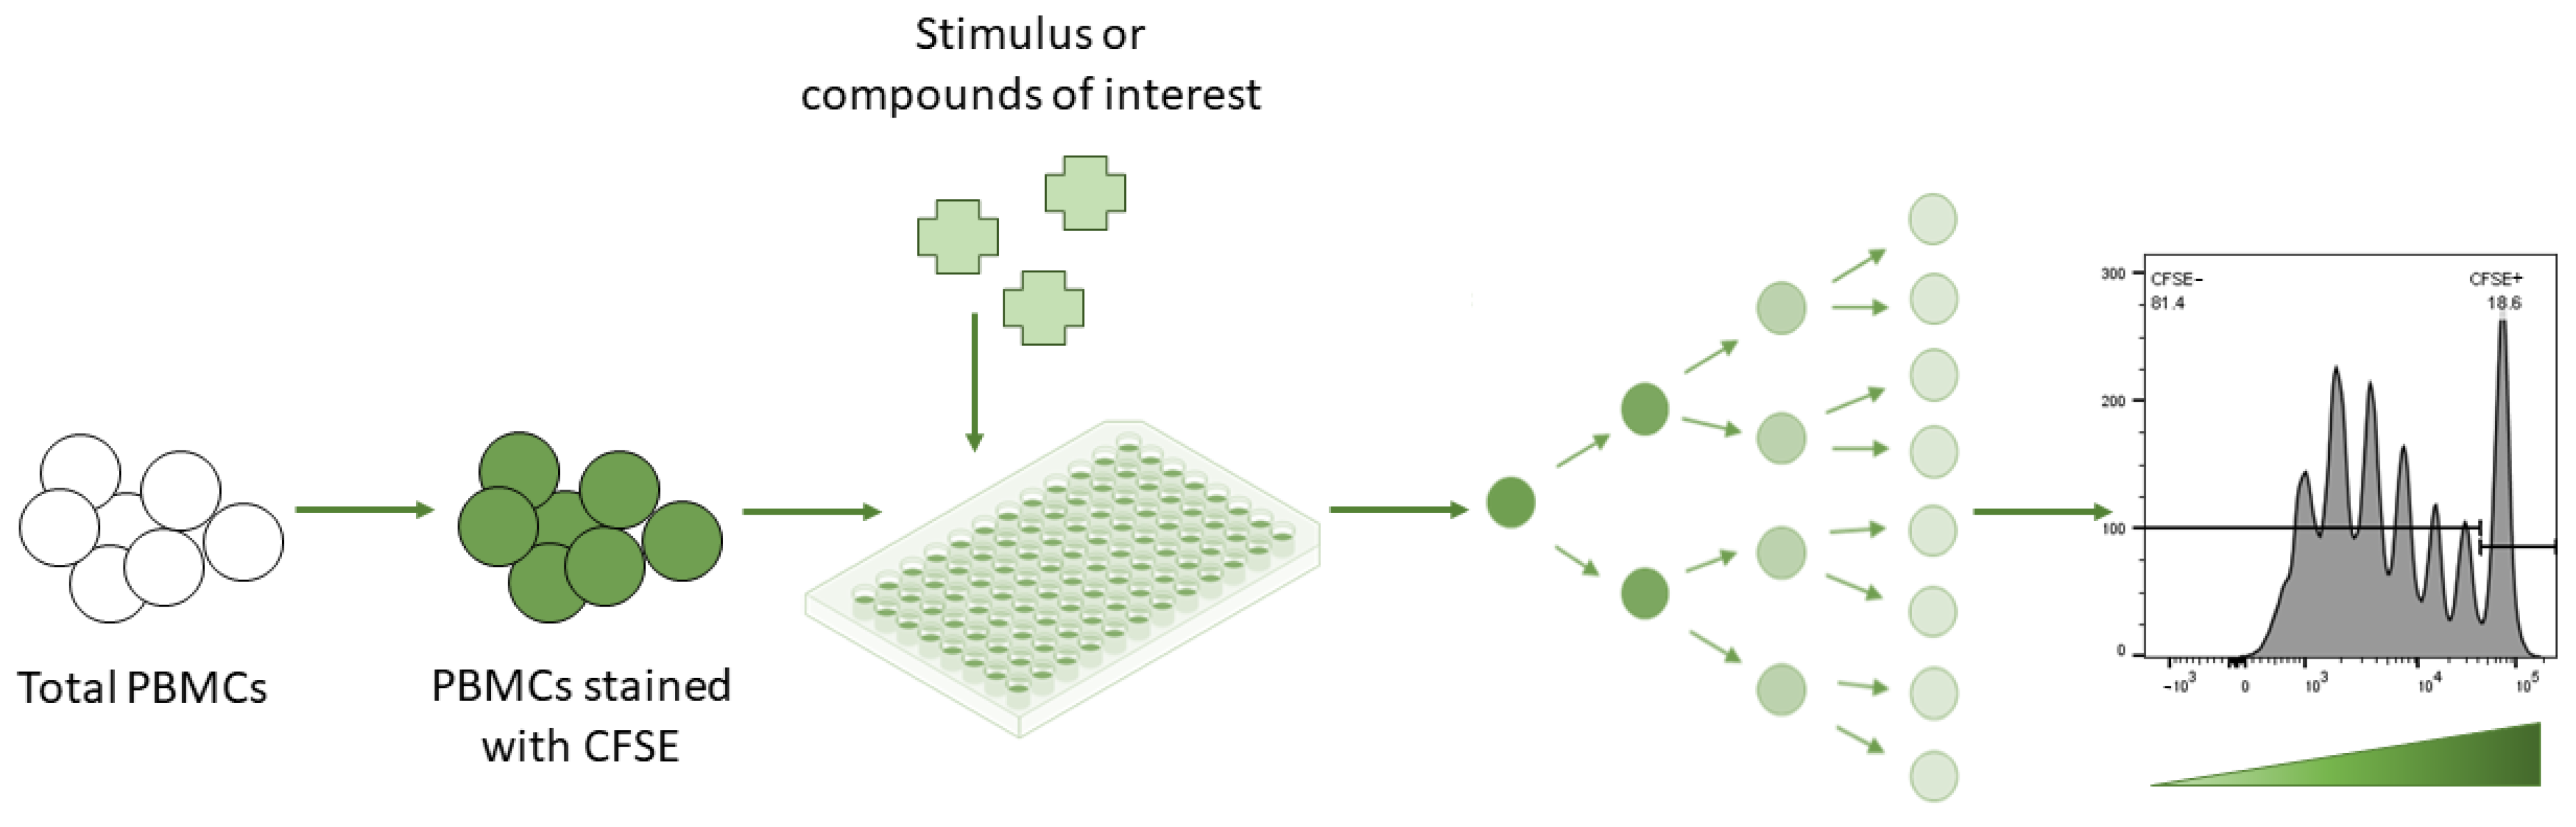
| [3H] Thymidine LPT | CFSE Assay |
|---|---|
| Radioactive reagents must be handled and disposed of with caution [60] | CFSE fluorescence precisely halves after each cell division in a highly predictable manner and is thus highly amenable to mathematical modelling [61] |
| Thymidine is measured by the scintillation counter per well of cells rather than per individual cell, so the assay reveals nothing about an individual cell’s division history [60] | CFSE is able to discriminate between the proliferation of regulatory T (Treg) and target cells in an experimental setting where Treg cell suppression capacity is measured by its potential to inhibit target cell proliferation [35] |
| No additional assays can be performed with or after [3H] thymidine incorporation, since it is an endpoint assay [60] | Several studies have shown that CFSE labelling can be toxic for cells [32,62], not just in terms of cell death, but also in terms of cell function—the ability of the cells to proliferate can be seriously compromised [61] |
| The inability to identify cells that have undergone numerous rounds of division [60] restricts clarity on the type of proliferating cells [63] | The use of total PBMCs could be theoretically more informative, since it will allow studying the response of different lymphocyte sub-populations [7] |
Disclaimer/Publisher’s Note: The statements, opinions and data contained in all publications are solely those of the individual author(s) and contributor(s) and not of MDPI and/or the editor(s). MDPI and/or the editor(s) disclaim responsibility for any injury to people or property resulting from any ideas, methods, instructions or products referred to in the content. |
© 2023 by the authors. Licensee MDPI, Basel, Switzerland. This article is an open access article distributed under the terms and conditions of the Creative Commons Attribution (CC BY) license (https://creativecommons.org/licenses/by/4.0/).
Share and Cite
Ganesan, N.; Ronsmans, S.; Hoet, P. Methods to Assess Proliferation of Stimulated Human Lymphocytes In Vitro: A Narrative Review. Cells 2023, 12, 386. https://doi.org/10.3390/cells12030386
Ganesan N, Ronsmans S, Hoet P. Methods to Assess Proliferation of Stimulated Human Lymphocytes In Vitro: A Narrative Review. Cells. 2023; 12(3):386. https://doi.org/10.3390/cells12030386
Chicago/Turabian StyleGanesan, Nirosha, Steven Ronsmans, and Peter Hoet. 2023. "Methods to Assess Proliferation of Stimulated Human Lymphocytes In Vitro: A Narrative Review" Cells 12, no. 3: 386. https://doi.org/10.3390/cells12030386
APA StyleGanesan, N., Ronsmans, S., & Hoet, P. (2023). Methods to Assess Proliferation of Stimulated Human Lymphocytes In Vitro: A Narrative Review. Cells, 12(3), 386. https://doi.org/10.3390/cells12030386