
1,25-Dihydroxyvitamin D Enhances the Regenerative Function of Lgr5+ Intestinal Stem Cells In Vitro and In Vivo


Abstract
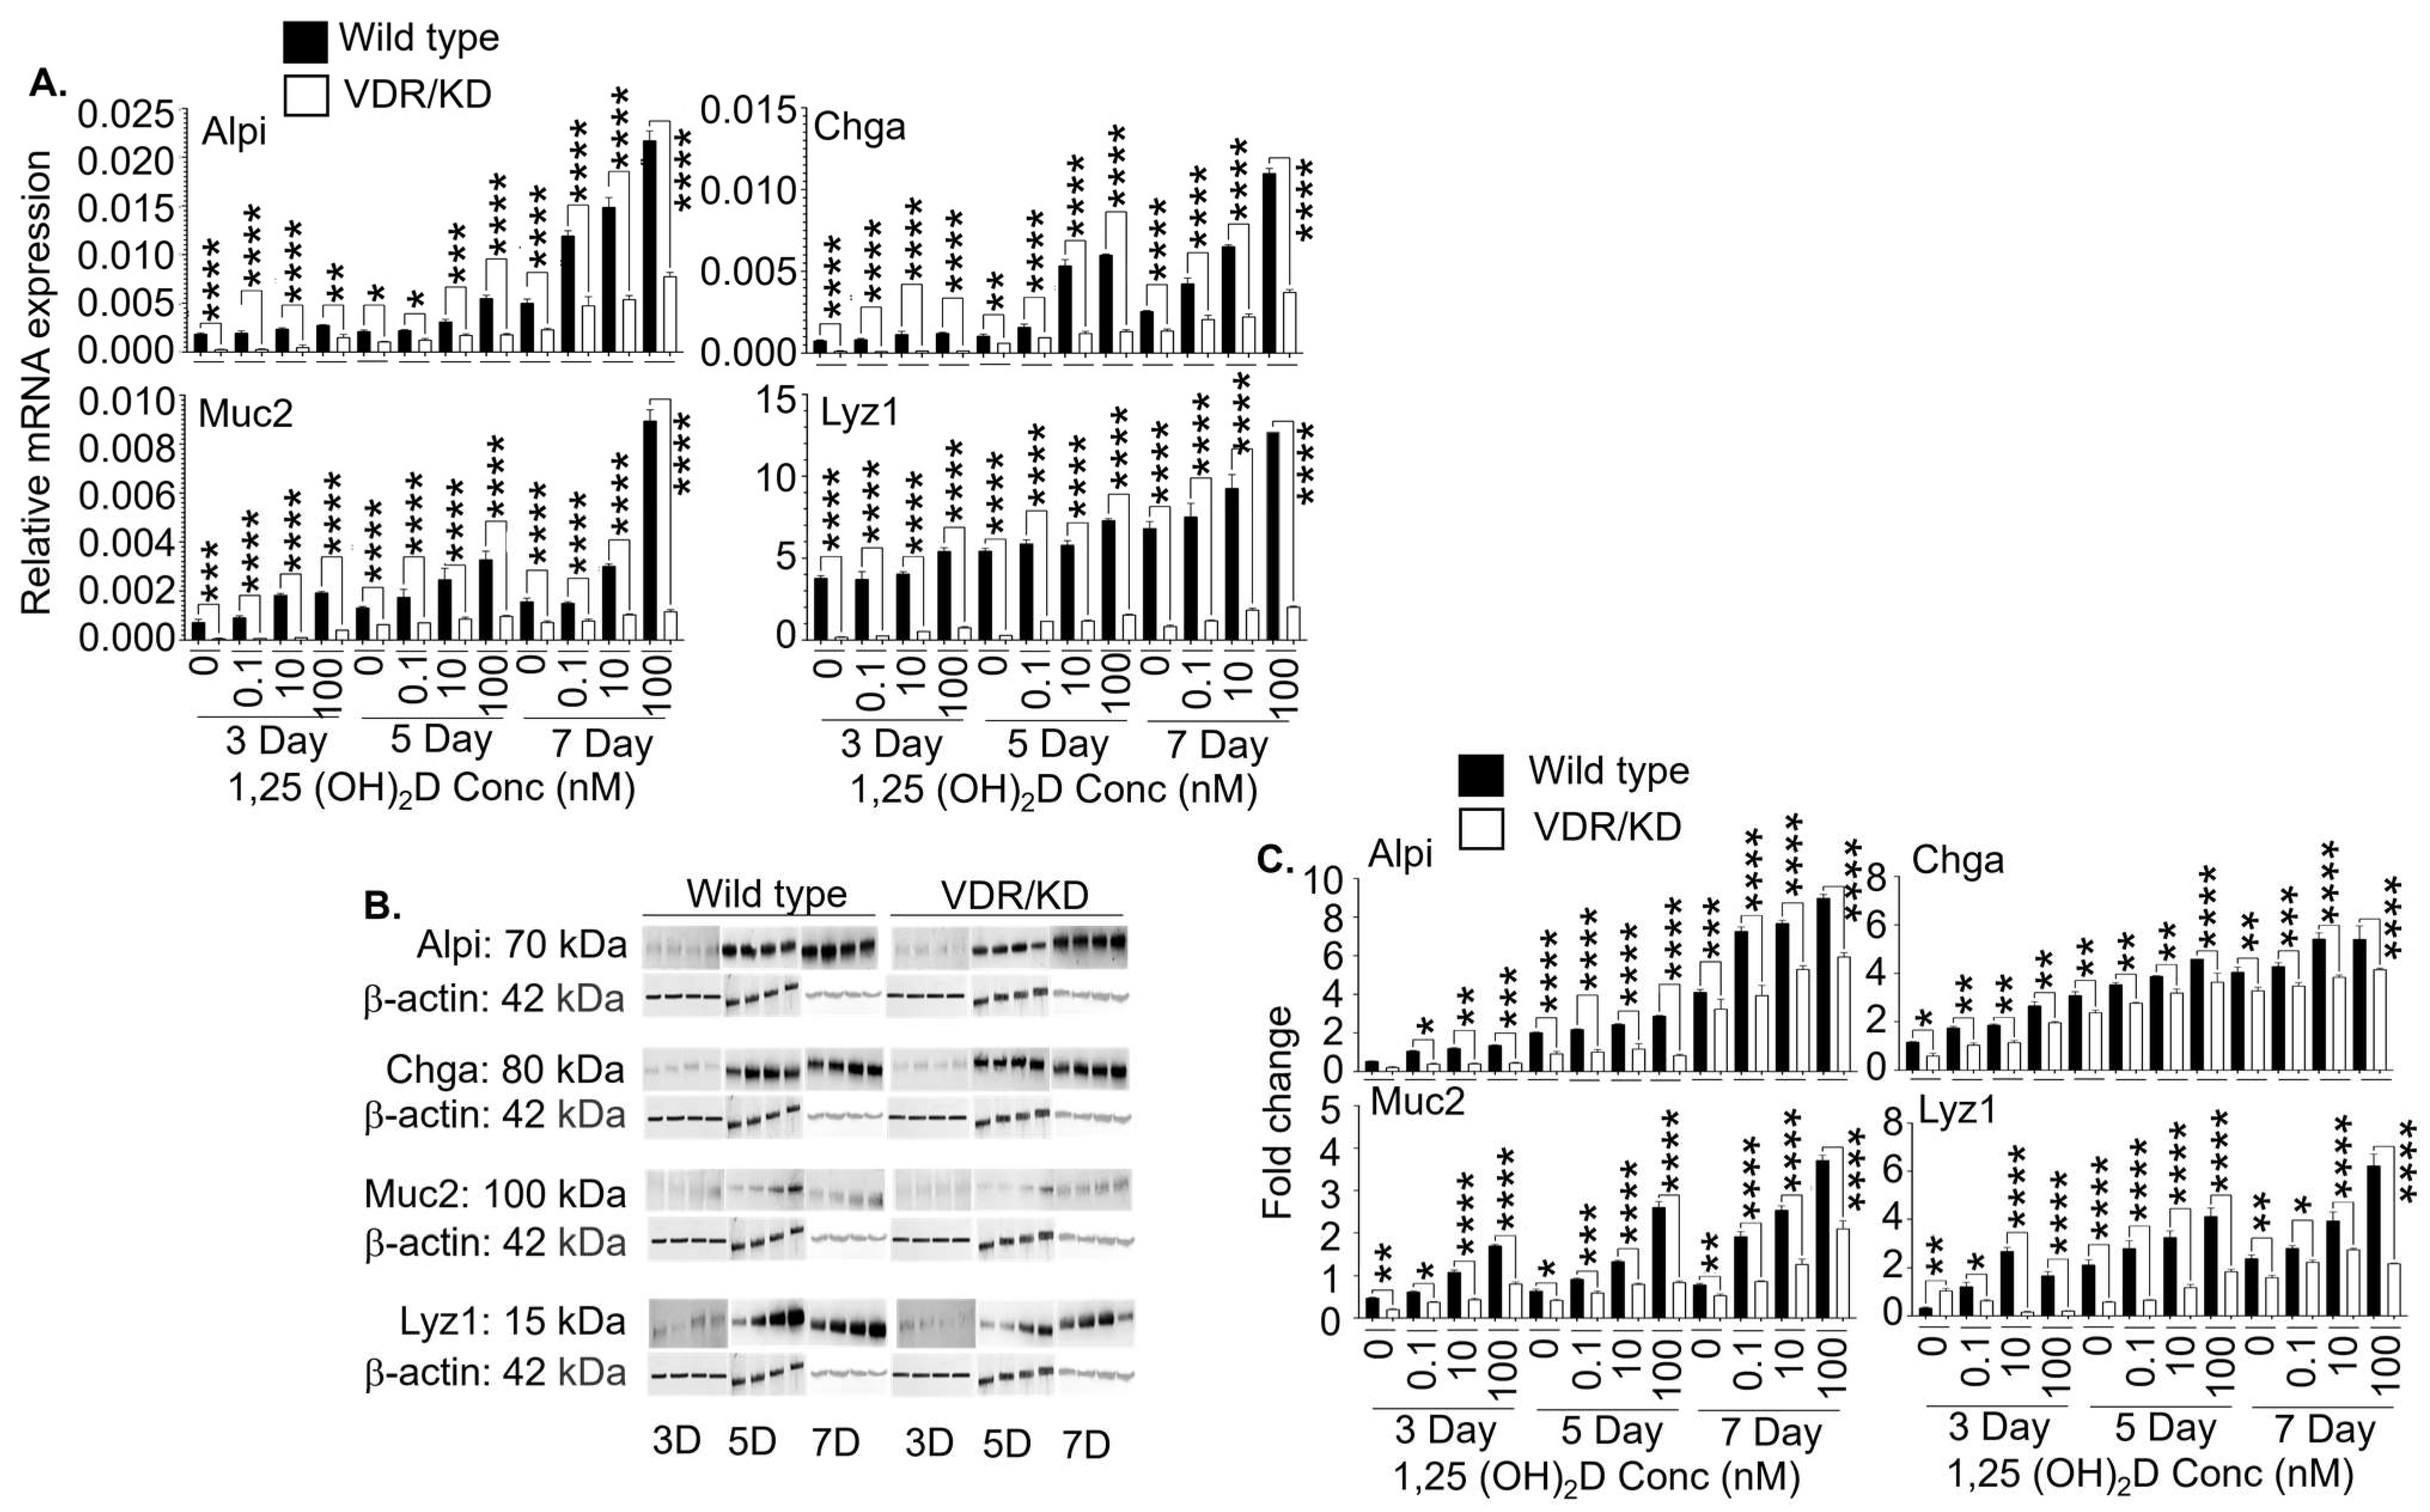
:
1. Introduction
2. Materials and Methods
2.1. Animal Subjects
2.2. Crypt Single-Cell Isolation
2.3. High-Purity Lgr5+ Single ISC Culture
2.4. Organoid Culture
2.5. Generation of VDR Knockdown ISC Lines
2.6. Plasmid Constructs
2.7. Preparation of Lentiviruses
2.8. Generation of Inflammation- and Gut-Homing Macrophages (CD11b+Gr1+) (MAC Cells) from Bone Marrow and Lentivirus Transduction
2.9. Experiments for Tracking Lgr5+ ISCs In Vivo
2.10. Experiments Using DC-CYP and DC-Ctr Cells
2.11. Induction and Treatment of Experimental Colitis
2.12. Histological Analysis
2.13. Immunocytochemistry Analysis
2.14. Flow Cytometry Analysis
2.15. Quantitative Real-Time RT-qPCR
2.16. Western Blot Analysis
2.17. Statistical Analysis
3. Results
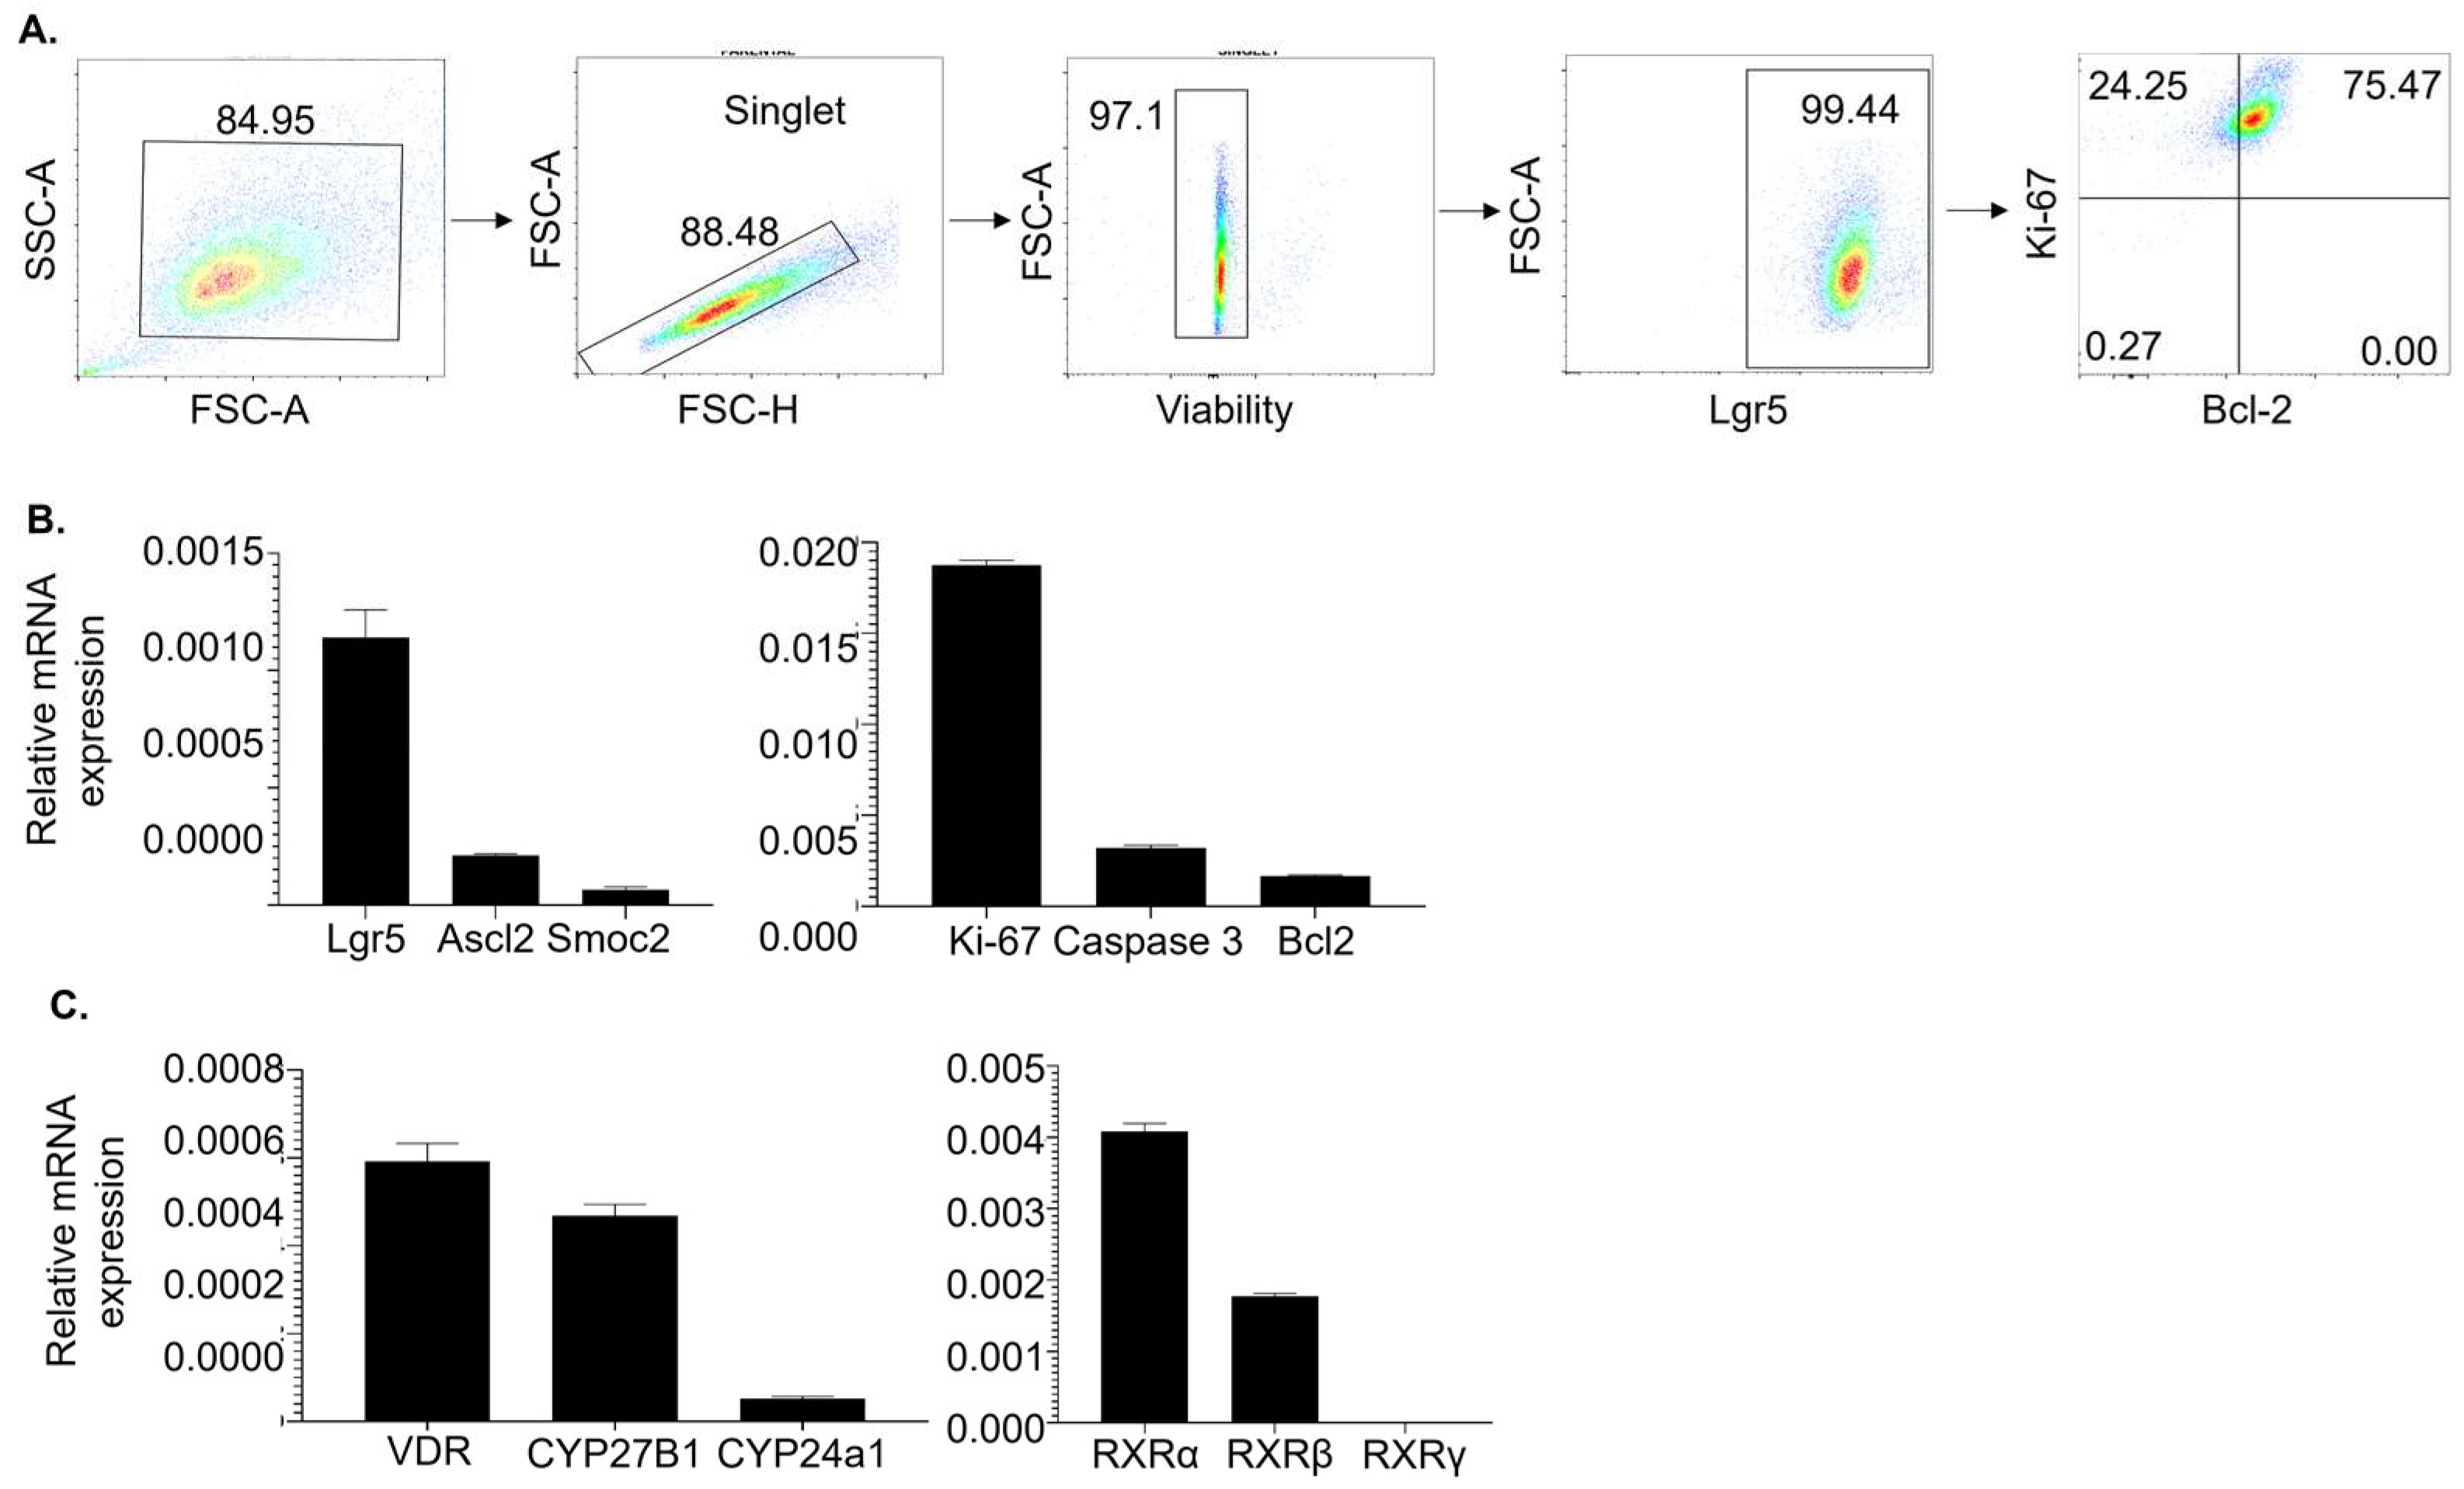
3.1. High-Purity Lgr5+ ISC Lines Express Stemness Markers and Molecules Necessary for 1,25(OH)2D Signaling
3.2. High-Purity Lgr5+ ISC Lines Initiate Differentiation after Removing Chemical Inhibitors (Valproic Acid and CHIR99021)
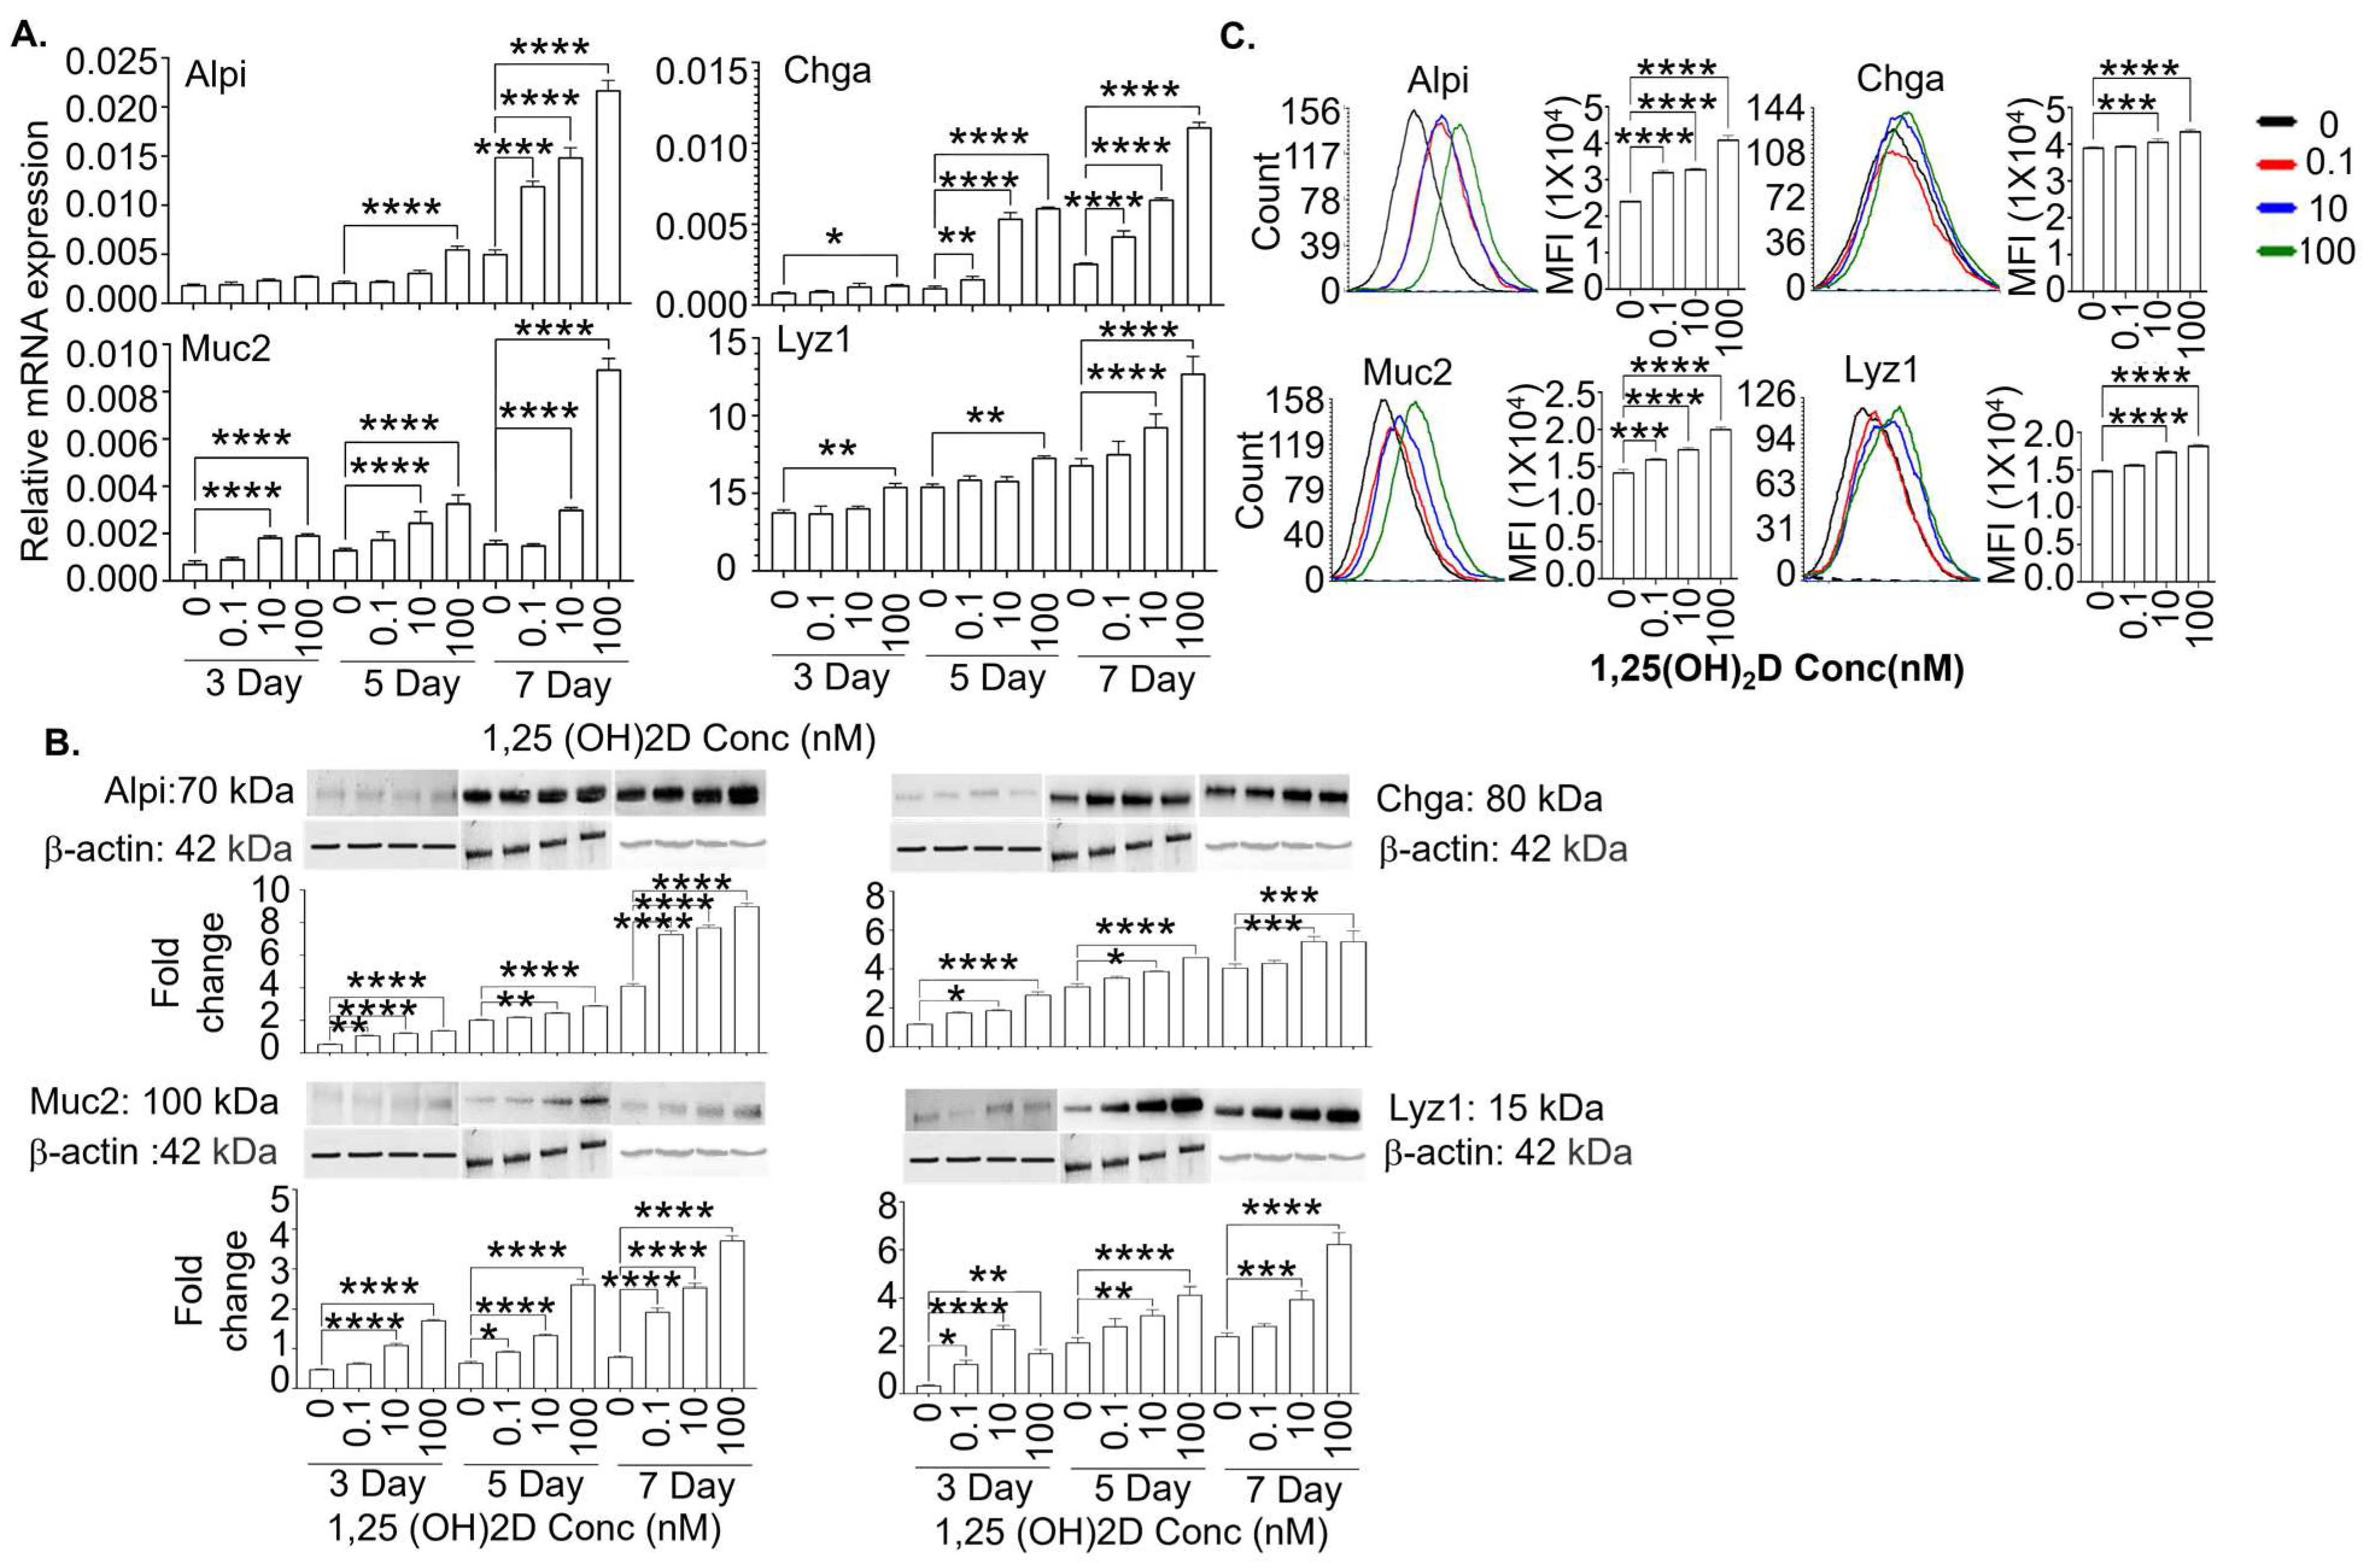
3.3. The 1,25(OH)2D at Concentrations Higher than Physiological Levels Strongly Enhances the Gene and Protein Expression of Mature Intestinal Epithelial Markers in the Lgr5+ ISC Lines in the Presence and Absence of Valproic Acid and CHIR99021
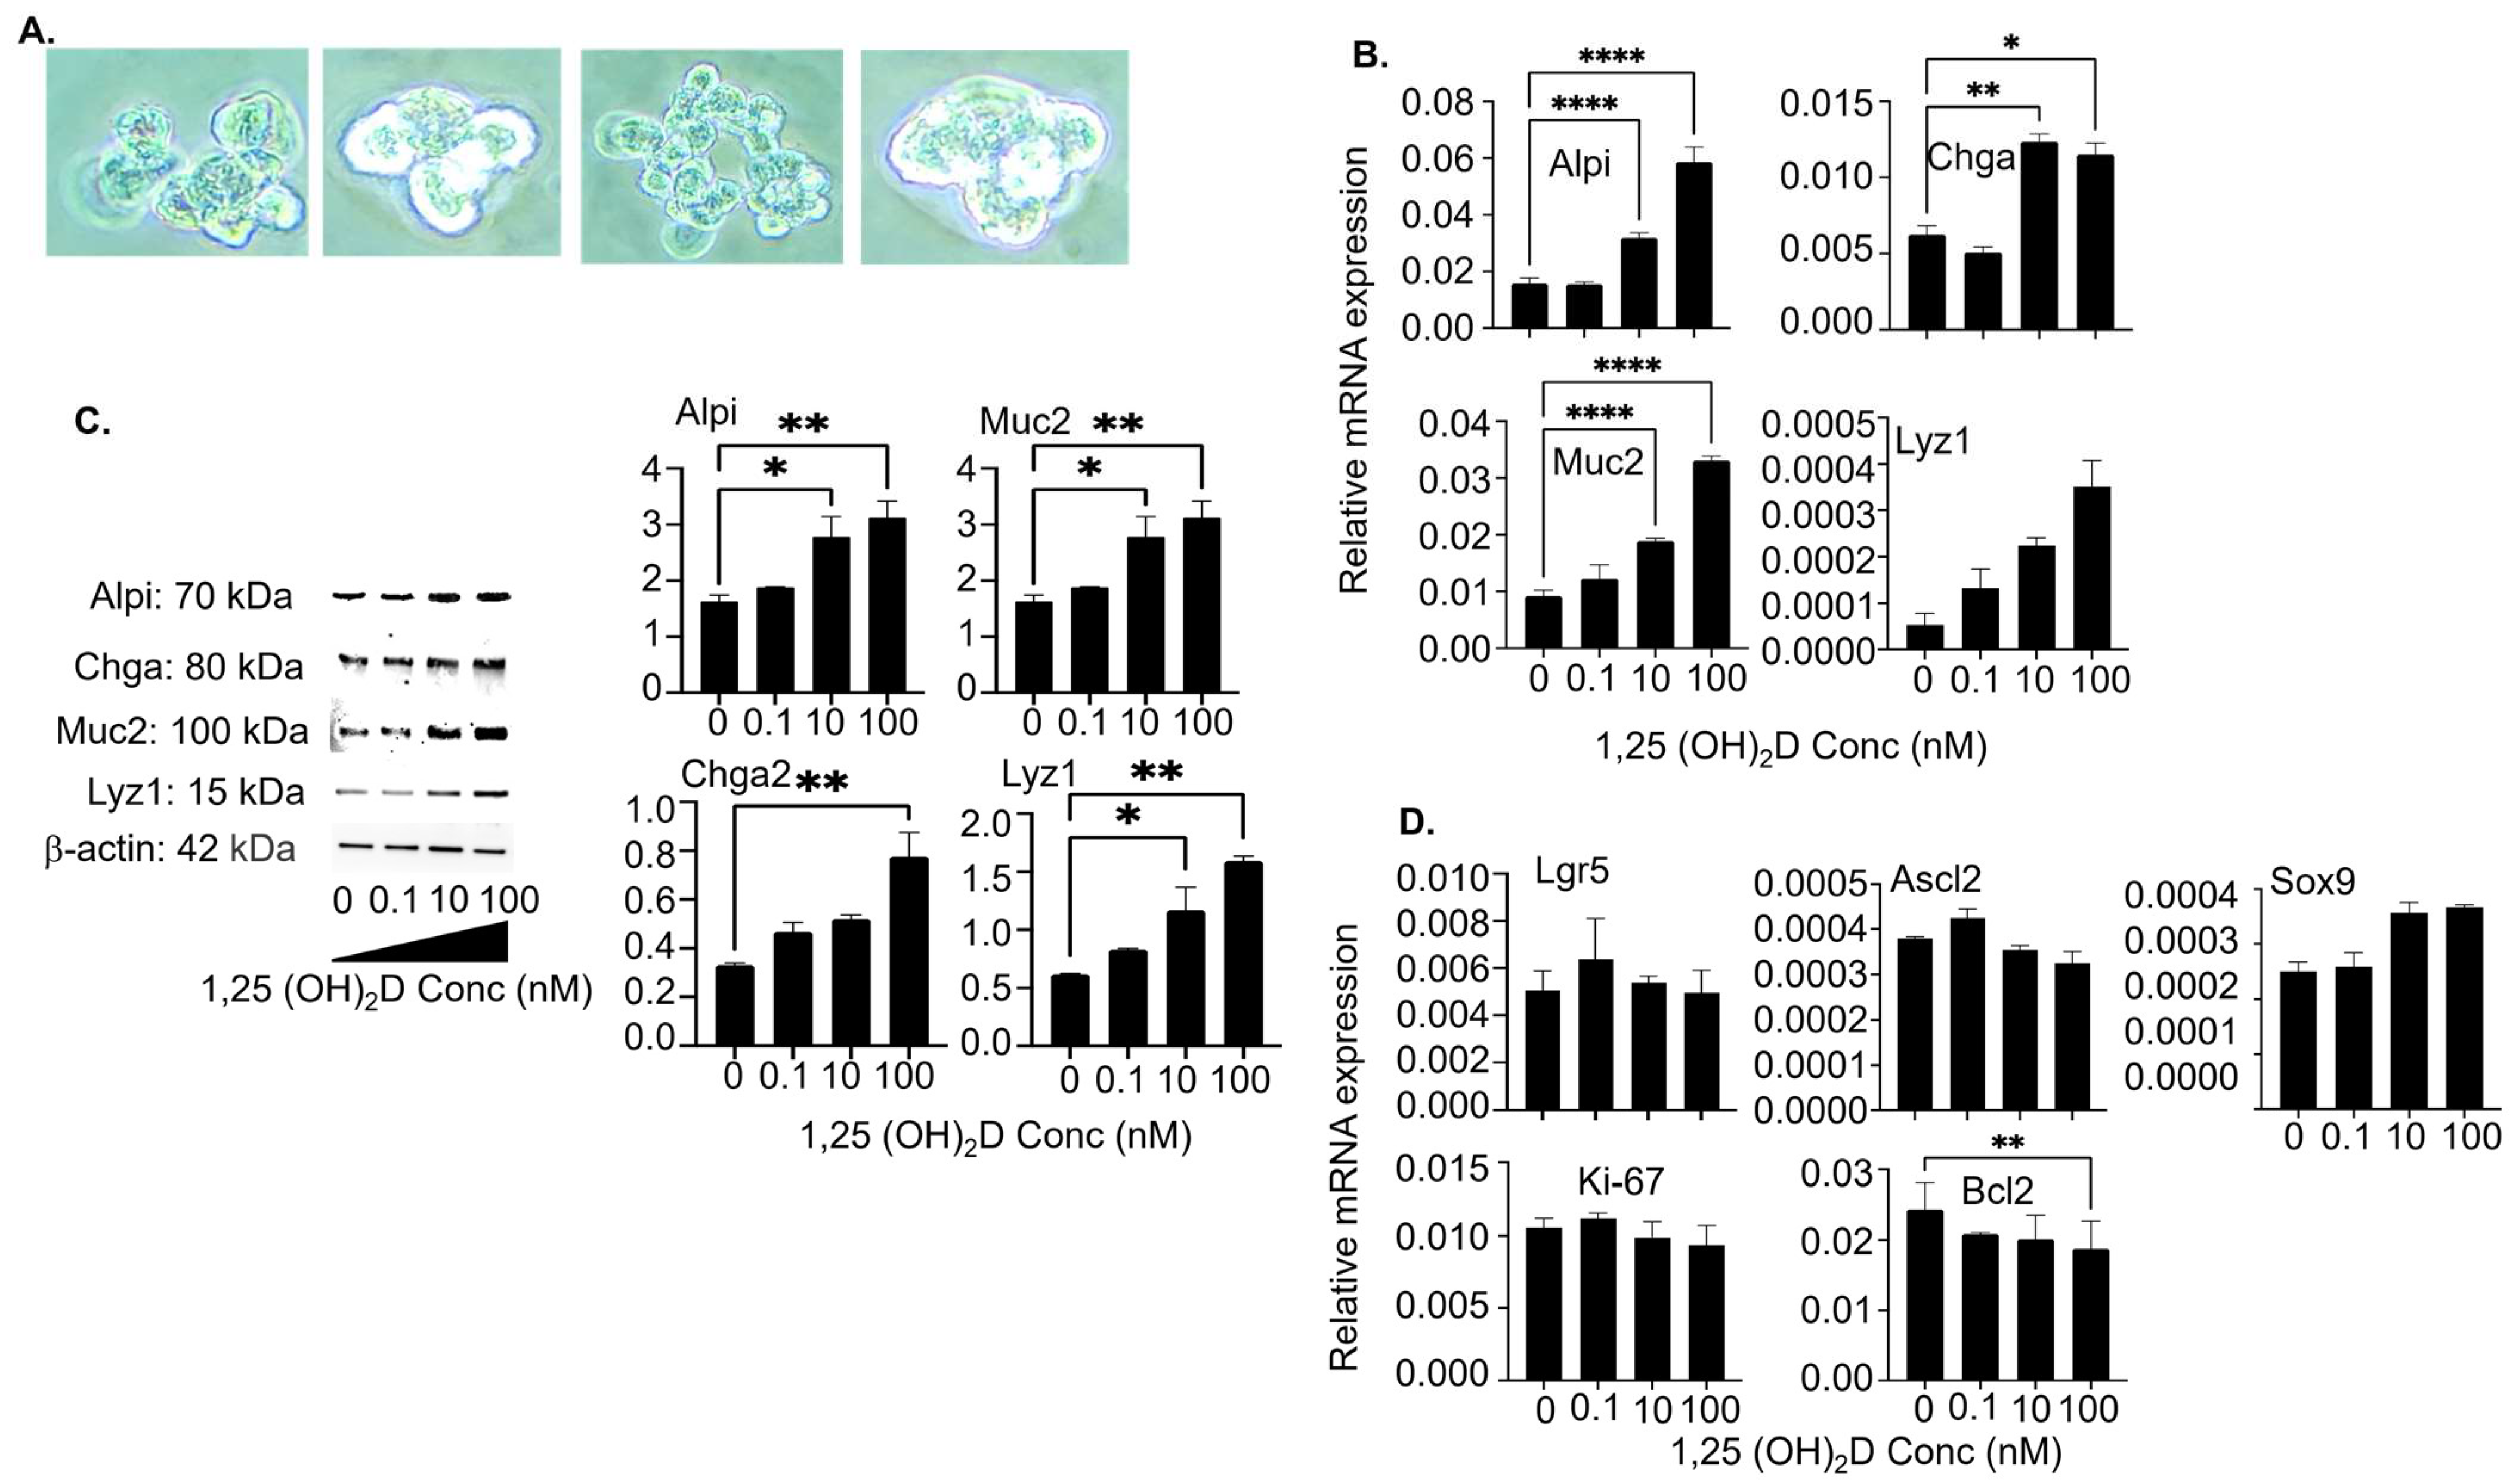
3.4. The 1,25(OH)2D at Concentrations Higher than Physiological Levels Vigorously Augments Mature Intestinal Epithelial Markers’ Gene and Protein Expression in Colon Organoid Cultures
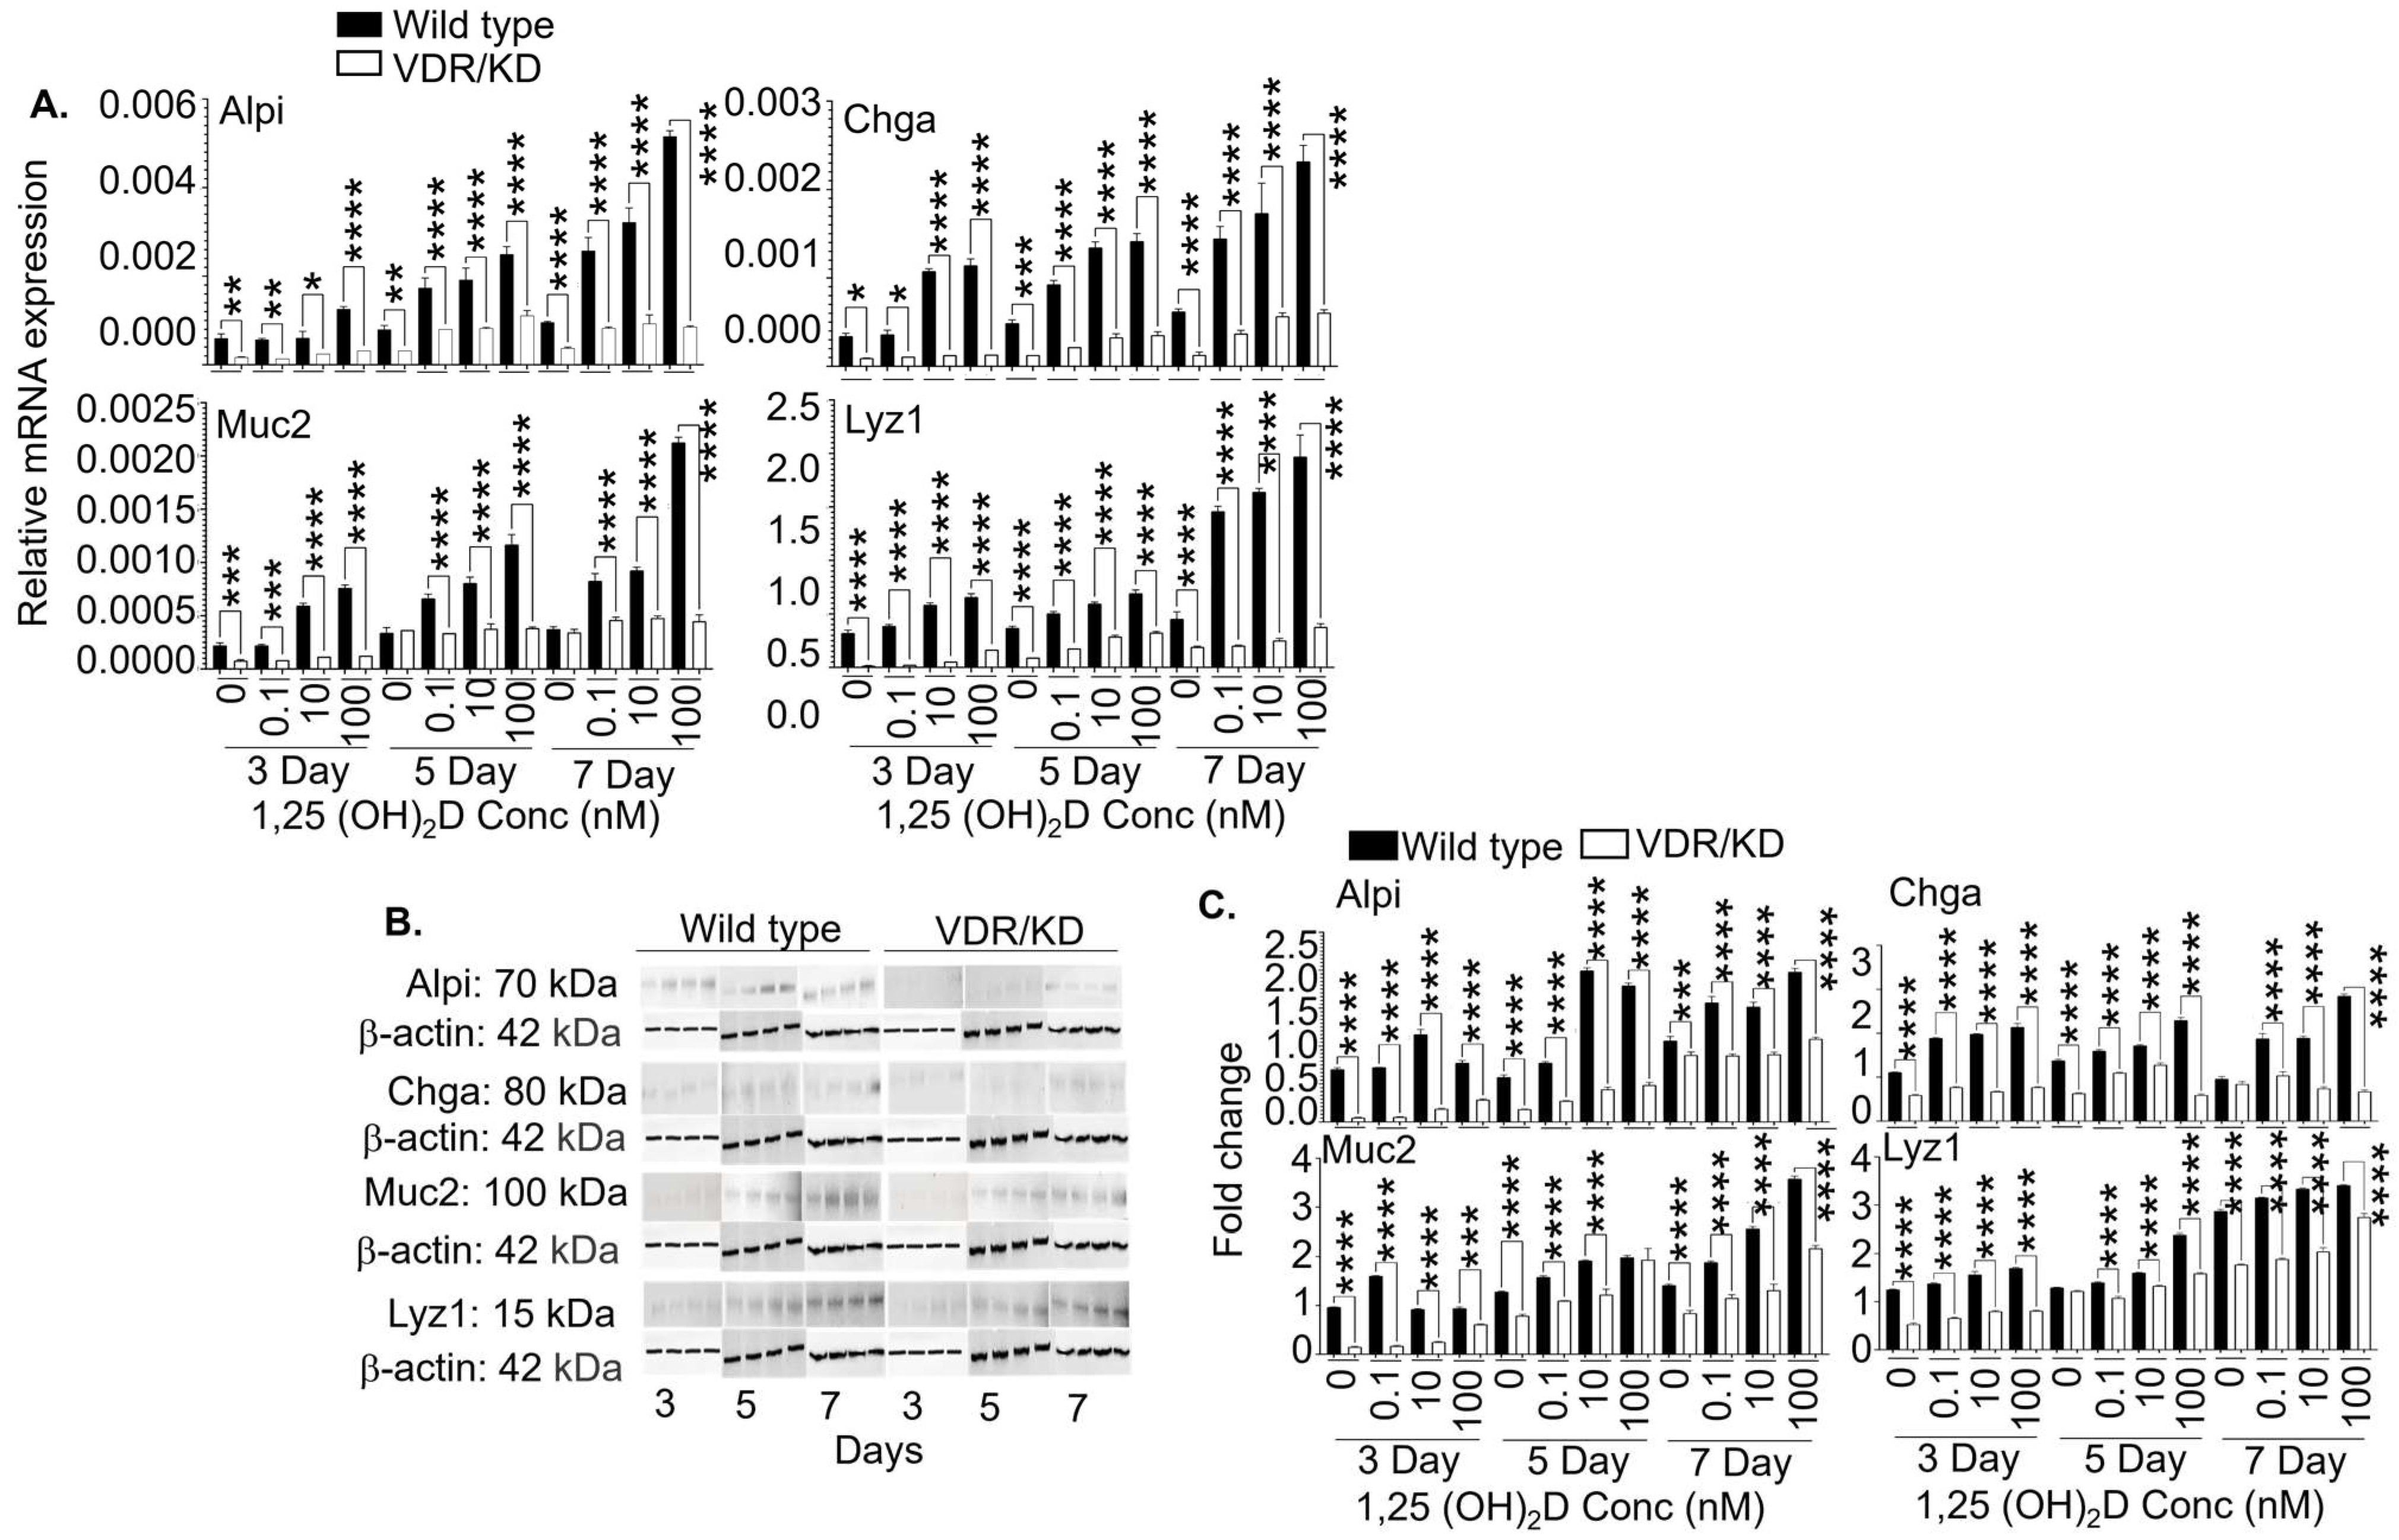
3.5. The 1,25(OH)2D’s Functions in Lgr5+ ISCs are Primarily Mediated by VDR
3.6. De Novo Synthesized Locally High 1,25(OH)2D Concentrations Modulate Local Vitamin D Metabolism
3.7. De Novo Synthesized Locally High 1,25(OH)2D Concentrations Enhance Lgr5+ ISC Differentiation In Vivo
4. Discussion
5. Conclusions
Supplementary Materials
Author Contributions
Funding
Institutional Review Board Statement
Informed Consent Statement
Data Availability Statement
Acknowledgments
Conflicts of Interest
References
- Ng, S.C.; Shi, H.Y.; Hamidi, N.; Underwood, F.E.; Tang, W.; Benchimol, E.I.; Panaccione, R.; Ghosh, S.; Wu, J.C.Y.; Chan, F.K.L.; et al. Worldwide incidence and prevalence of inflammatory bowel disease in the 21st century: A systematic review of population-based studies. Lancet 2017, 390, 2769–2778. [Google Scholar] [CrossRef] [PubMed]
- Michielan, A.; D’Inca, R. Intestinal Permeability in Inflammatory Bowel Disease: Pathogenesis, Clinical Evaluation, and Therapy of Leaky Gut. Mediat. Inflamm. 2015, 2015, 628157. [Google Scholar] [CrossRef] [PubMed]
- Cheng, Y.; Hall, T.R.; Xu, X.; Yung, I.; Souza, D.; Zheng, J.; Schiele, F.; Hoffmann, M.; Mbow, M.L.; Garnett, J.P.; et al. Targeting uPA-uPAR interaction to improve intestinal epithelial barrier integrity in inflammatory bowel disease. EBioMedicine 2022, 75, 103758. [Google Scholar] [CrossRef]
- Barker, N.; van Es, J.H.; Kuipers, J.; Kujala, P.; van den Born, M.; Cozijnsen, M.; Haegebarth, A.; Korving, J.; Begthel, H.; Peters, P.J.; et al. Identification of stem cells in small intestine and colon by marker gene Lgr5. Nature 2007, 449, 1003–1007. [Google Scholar] [CrossRef]
- Sato, T.; Vries, R.G.; Snippert, H.J.; van de Wetering, M.; Barker, N.; Stange, D.E.; van Es, J.H.; Abo, A.; Kujala, P.; Peters, P.J.; et al. Single Lgr5 stem cells build crypt-villus structures in vitro without a mesenchymal niche. Nature 2009, 459, 262–265. [Google Scholar] [CrossRef] [PubMed]
- Peregrina, K.; Houston, M.; Daroqui, C.; Dhima, E.; Sellers, R.S.; Augenlicht, L.H. Vitamin D is a determinant of mouse intestinal Lgr5 stem cell functions. Carcinogenesis 2015, 36, 25–31. [Google Scholar] [CrossRef] [PubMed]
- Xu, Y.; Baylink, D.J.; Cao, H.; Xiao, J.; Abdalla, M.I.; Wasnik, S.; Tang, X. Inflammation- and Gut-Homing Macrophages, Engineered to De Novo Overexpress Active Vitamin D, Promoted the Regenerative Function of Intestinal Stem Cells. Int. J. Mol. Sci. 2021, 22, 9516. [Google Scholar] [CrossRef]
- Hausler, D.; Torke, S.; Peelen, E.; Bertsch, T.; Djukic, M.; Nau, R.; Larochelle, C.; Zamvil, S.S.; Bruck, W.; Weber, M.S. High dose vitamin D exacerbates central nervous system autoimmunity by raising T-cell excitatory calcium. Brain 2019, 142, 2737–2755. [Google Scholar] [CrossRef]
- Hygum, K.; Wulff, C.N.; Harslof, T.; Boysen, A.K.; Rossen, P.B.; Langdahl, B.L.; Safwat, A.A. Hypercalcemia in metastatic GIST caused by systemic elevated calcitriol: A case report and review of the literature. BMC Cancer 2015, 15, 788. [Google Scholar] [CrossRef]
- Asonitis, N.; Angelousi, A.; Zafeiris, C.; Lambrou, G.I.; Dontas, I.; Kassi, E. Diagnosis, Pathophysiology and Management of Hypercalcemia in Malignancy: A Review of the Literature. Horm. Metab. Res. 2019, 51, 770–778. [Google Scholar] [CrossRef]
- Li, B.; Baylink, D.J.; Walter, M.H.; Lau, K.H.; Meng, X.; Wang, J.; Cherkas, A.; Tang, X.; Qin, X. Targeted 25-hydroxyvitamin D3 1alpha-hydroxylase adoptive gene therapy ameliorates dss-induced colitis without causing hypercalcemia in mice. Mol. Ther. J. Am. Soc. Gene Ther. 2015, 23, 339–351. [Google Scholar] [CrossRef] [PubMed]
- Kang, S.W.; Kim, S.H.; Lee, N.; Lee, W.W.; Hwang, K.A.; Shin, M.S.; Lee, S.H.; Kim, W.U.; Kang, I. 1,25-Dihyroxyvitamin D3 promotes FOXP3 expression via binding to vitamin D response elements in its conserved noncoding sequence region. J. Immunol. 2012, 188, 5276–5282. [Google Scholar] [CrossRef]
- Jeffery, L.E.; Burke, F.; Mura, M.; Zheng, Y.; Qureshi, O.S.; Hewison, M.; Walker, L.S.; Lammas, D.A.; Raza, K.; Sansom, D.M. 1,25-Dihydroxyvitamin D3 and IL-2 combine to inhibit T cell production of inflammatory cytokines and promote development of regulatory T cells expressing CTLA-4 and FoxP3. J. Immunol. 2009, 183, 5458–5467. [Google Scholar] [CrossRef]
- Nashold, F.E.; Nelson, C.D.; Brown, L.M.; Hayes, C.E. One calcitriol dose transiently increases Helios+ FoxP3+ T cells and ameliorates autoimmune demyelinating disease. J. Neuroimmunol. 2013, 263, 64–74. [Google Scholar] [CrossRef] [PubMed]
- Spach, K.M.; Nashold, F.E.; Dittel, B.N.; Hayes, C.E. IL-10 signaling is essential for 1,25-dihydroxyvitamin D3-mediated inhibition of experimental autoimmune encephalomyelitis. J. Immunol. 2006, 177, 6030–6037. [Google Scholar] [CrossRef] [PubMed]
- Li, C.H.; Zhang, J.; Baylink, D.J.; Wang, X.; Goparaju, N.B.; Xu, Y.; Wasnik, S.; Cheng, Y.; Berumen, E.C.; Qin, X.; et al. Dendritic cells, engineered to overexpress 25-hydroxyvitamin D 1alpha-hydroxylase and pulsed with a myelin antigen, provide myelin-specific suppression of ongoing experimental allergic encephalomyelitis. FASEB J. 2017, 31, fj.201601243R. [Google Scholar]
- Bartels, L.E.; Jorgensen, S.P.; Agnholt, J.; Kelsen, J.; Hvas, C.L.; Dahlerup, J.F. 1,25-dihydroxyvitamin D3 and dexamethasone increase interleukin-10 production in CD4+ T cells from patients with Crohn’s disease. Int. Immunopharmacol. 2007, 7, 1755–1764. [Google Scholar] [CrossRef]
- Xu, Y.; Cheng, Y.; Baylink, D.J.; Wasnik, S.; Goel, G.; Huang, M.; Cao, H.; Qin, X.; Lau, K.W.; Chan, C.; et al. In Vivo Generation of Gut-Homing Regulatory T Cells for the Suppression of Colitis. J. Immunol. 2019, 202, 3447–3457. [Google Scholar] [CrossRef]
- Ferreira, G.B.; Gysemans, C.A.; Demengeot, J.; da Cunha, J.P.; Vanherwegen, A.S.; Overbergh, L.; Van Belle, T.L.; Pauwels, F.; Verstuyf, A.; Korf, H.; et al. 1,25-Dihydroxyvitamin D3 promotes tolerogenic dendritic cells with functional migratory properties in NOD mice. J. Immunol. 2014, 192, 4210–4220. [Google Scholar] [CrossRef]
- Ferreira, G.B.; Vanherwegen, A.S.; Eelen, G.; Gutierrez, A.C.F.; Van Lommel, L.; Marchal, K.; Verlinden, L.; Verstuyf, A.; Nogueira, T.; Georgiadou, M.; et al. Vitamin D3 Induces Tolerance in Human Dendritic Cells by Activation of Intracellular Metabolic Pathways. Cell Rep. 2015, 10, 711–725. [Google Scholar] [CrossRef]
- Liu, W.; Chen, Y.; Golan, M.A.; Annunziata, M.L.; Du, J.; Dougherty, U.; Kong, J.; Musch, M.; Huang, Y.; Pekow, J.; et al. Intestinal epithelial vitamin D receptor signaling inhibits experimental colitis. J. Clin. Invest. 2013, 123, 3983–3996. [Google Scholar] [CrossRef]
- Zhang, Y.; Garrett, S.; Carroll, R.E.; Xia, Y.; Sun, J. Vitamin D receptor upregulates tight junction protein claudin-5 against colitis-associated tumorigenesis. Mucosal Immunol. 2022, 15, 683–697. [Google Scholar] [CrossRef] [PubMed]
- Chatterjee, I.; Zhang, Y.; Zhang, J.; Lu, R.; Xia, Y.; Sun, J. Overexpression of Vitamin D Receptor in Intestinal Epithelia Protects Against Colitis via Upregulating Tight Junction Protein Claudin 15. J. Crohns Colitis 2021, 15, 1720–1736. [Google Scholar] [CrossRef] [PubMed]
- Sun, J.; Zhang, Y.G. Vitamin D Receptor Influences Intestinal Barriers in Health and Disease. Cells 2022, 11, 1129. [Google Scholar] [CrossRef] [PubMed]
- Yan, K.S.; Chia, L.A.; Li, X.; Ootani, A.; Su, J.; Lee, J.Y.; Su, N.; Luo, Y.; Heilshorn, S.C.; Amieva, M.R.; et al. The intestinal stem cell markers Bmi1 and Lgr5 identify two functionally distinct populations. Proc. Natl. Acad. Sci. USA 2012, 109, 466–471. [Google Scholar] [CrossRef]
- Takeda, N.; Jain, R.; LeBoeuf, M.R.; Wang, Q.; Lu, M.M.; Epstein, J.A. Interconversion between intestinal stem cell populations in distinct niches. Science 2011, 334, 1420–1424. [Google Scholar] [CrossRef]
- Yousefi, M.; Li, N.; Nakauka-Ddamba, A.; Wang, S.; Davidow, K.; Schoenberger, J.; Yu, Z.; Jensen, S.T.; Kharas, M.G.; Lengner, C.J. Msi RNA-binding proteins control reserve intestinal stem cell quiescence. J. Cell Biol. 2016, 215, 401–413. [Google Scholar] [CrossRef]
- Ayyaz, A.; Kumar, S.; Sangiorgi, B.; Ghoshal, B.; Gosio, J.; Ouladan, S.; Fink, M.; Barutcu, S.; Trcka, D.; Shen, J.; et al. Single-cell transcriptomes of the regenerating intestine reveal a revival stem cell. Nature 2019, 569, 121–125. [Google Scholar] [CrossRef]
- Montgomery, R.K.; Carlone, D.L.; Richmond, C.A.; Farilla, L.; Kranendonk, M.E.; Henderson, D.E.; Baffour-Awuah, N.Y.; Ambruzs, D.M.; Fogli, L.K.; Algra, S.; et al. Mouse telomerase reverse transcriptase (mTert) expression marks slowly cycling intestinal stem cells. Proc. Natl. Acad. Sci. USA 2011, 108, 179–184. [Google Scholar] [CrossRef]
- Clevers, H. The Intestinal Crypt, A Prototype Stem Cell Compartment. Cell 2013, 154, 274–284. [Google Scholar] [CrossRef]
- O’Rourke, K.P.; Ackerman, S.; Dow, L.E.; Lowe, S.W. Isolation, Culture, and Maintenance of Mouse Intestinal Stem Cells. Bio Protoc. 2016, 6, e1733. [Google Scholar] [CrossRef]
- Ross, A.D.B.; Perrone, F.; Elmentaite, R.; Teichmann, S.A.; Zilbauer, M. Obtaining purified human intestinal epithelia for single-cell analysis and organoid culture. STAR Protoc. 2021, 2, 100597. [Google Scholar] [CrossRef]
- Van Neerven, S.M.; Ramadan, R.; van Driel, M.S.; Huels, D.J.; Vermeulen, L. Intestinal organoid co-culture protocol to study cell competition in vitro. STAR Protoc. 2022, 3, 101050. [Google Scholar] [CrossRef]
- Shen, Z.; Reznikoff, G.; Dranoff, G.; Rock, K.L. Cloned dendritic cells can present exogenous antigens on both MHC class I and class II molecules. J. Immunol. 1997, 158, 2723–2730. [Google Scholar] [CrossRef]
- Lee, H.W.; Yoon, S.Y.; Singh, T.D.; Choi, Y.J.; Lee, H.J.; Park, J.Y.; Jeong, S.Y.; Lee, S.W.; Ha, J.H.; Ahn, B.C.; et al. Tracking of dendritic cell migration into lymph nodes using molecular imaging with sodium iodide symporter and enhanced firefly luciferase genes. Sci. Rep. 2015, 5, 9865. [Google Scholar] [CrossRef]
- Okada, N.; Tsujino, M.; Hagiwara, Y.; Tada, A.; Tamura, Y.; Mori, K.; Saito, T.; Nakagawa, S.; Mayumi, T.; Fujita, T.; et al. Administration route-dependent vaccine efficiency of murine dendritic cells pulsed with antigens. Br. J. Cancer 2001, 84, 1564–1570. [Google Scholar] [CrossRef]
- Yin, X.; Farin, H.F.; van Es, J.H.; Clevers, H.; Langer, R.; Karp, J.M. Niche-independent high-purity cultures of Lgr5+ intestinal stem cells and their progeny. Nat. Methods 2014, 11, 106–112. [Google Scholar] [CrossRef]
- Van der Flier, L.G.; van Gijn, M.E.; Hatzis, P.; Kujala, P.; Haegebarth, A.; Stange, D.E.; Begthel, H.; van den Born, M.; Guryev, V.; Oving, I.; et al. Transcription factor achaete scute-like 2 controls intestinal stem cell fate. Cell 2009, 136, 903–912. [Google Scholar] [CrossRef]
- Munoz, J.; Stange, D.E.; Schepers, A.G.; van de Wetering, M.; Koo, B.K.; Itzkovitz, S.; Volckmann, R.; Kung, K.S.; Koster, J.; Radulescu, S.; et al. The Lgr5 intestinal stem cell signature: Robust expression of proposed quiescent ‘+4’ cell markers. EMBO J. 2012, 31, 3079–3091. [Google Scholar] [CrossRef]
- Goldberg, R.F.; Austen, W.G., Jr.; Zhang, X.; Munene, G.; Mostafa, G.; Biswas, S.; McCormack, M.; Eberlin, K.R.; Nguyen, J.T.; Tatlidede, H.S.; et al. Intestinal alkaline phosphatase is a gut mucosal defense factor maintained by enteral nutrition. Proc. Natl. Acad. Sci. USA 2008, 105, 3551–3556. [Google Scholar] [CrossRef]
- Facer, P.; Bishop, A.E.; Lloyd, R.V.; Wilson, B.S.; Hennessy, R.J.; Polak, J.M. Chromogranin: A newly recognized marker for endocrine cells of the human gastrointestinal tract. Gastroenterology 1985, 89, 1366–1373. [Google Scholar] [CrossRef]
- Van der Sluis, M.; De Koning, B.A.; De Bruijn, A.C.; Velcich, A.; Meijerink, J.P.; Van Goudoever, J.B.; Buller, H.A.; Dekker, J.; Van Seuningen, I.; Renes, I.B.; et al. Muc2-deficient mice spontaneously develop colitis, indicating that MUC2 is critical for colonic protection. Gastroenterology 2006, 131, 117–129. [Google Scholar] [CrossRef]
- Nakanishi, Y.; Reina-Campos, M.; Nakanishi, N.; Llado, V.; Elmen, L.; Peterson, S.; Campos, A.; De, S.K.; Leitges, M.; Ikeuchi, H.; et al. Control of Paneth Cell Fate, Intestinal Inflammation, and Tumorigenesis by PKClambda/iota. Cell Rep. 2016, 16, 3297–3310. [Google Scholar] [CrossRef]
- Lips, P. Relative value of 25(OH)D and 1,25(OH)2D measurements. J. Bone Miner. Res. 2007, 22, 1668–1671. [Google Scholar] [CrossRef]
- Wasnik, S.; Sharma, I.; Baylink, D.J.; Tang, X. Vitamin D as a Potential Therapy for Multiple Sclerosis: Where Are We? Int. J. Mol. Sci. 2020, 21, 3102. [Google Scholar] [CrossRef]
- Xu, Y.; Payne, K.; Pham, L.H.G.; Eunwoo, P.; Xiao, J.; Chi, D.; Lyu, J.; Campion, R.; Wasnik, S.; Jeong, I.S.; et al. A novel vitamin D gene therapy for acute myeloid leukemia. Transl. Oncol. 2020, 13, 100869. [Google Scholar] [CrossRef]
- Hii, C.S.; Ferrante, A. The Non-Genomic Actions of Vitamin D. Nutrients 2016, 8, 135. [Google Scholar] [CrossRef]
- Janjusevic, M.; Gagno, G.; Fluca, A.L.; Padoan, L.; Beltrami, A.P.; Sinagra, G.; Moretti, R.; Aleksova, A. The peculiar role of vitamin D in the pathophysiology of cardiovascular and neurodegenerative diseases. Life Sci. 2022, 289, 120193. [Google Scholar] [CrossRef]
- Lange, C.M.; Gouttenoire, J.; Duong, F.H.; Morikawa, K.; Heim, M.H.; Moradpour, D. Vitamin D receptor and Jak-STAT signaling crosstalk results in calcitriol-mediated increase of hepatocellular response to IFN-alpha. J. Immunol. 2014, 192, 6037–6044. [Google Scholar] [CrossRef]
- Blander, J.M. On cell death in the intestinal epithelium and its impact on gut homeostasis. Curr. Opin. Gastroenterol. 2018, 34, 413–419. [Google Scholar] [CrossRef]
- Wang, T.T.; Nestel, F.P.; Bourdeau, V.; Nagai, Y.; Wang, Q.; Liao, J.; Tavera-Mendoza, L.; Lin, R.; Hanrahan, J.W.; Mader, S.; et al. Cutting edge: 1,25-dihydroxyvitamin D3 is a direct inducer of antimicrobial peptide gene expression. J. Immunol. 2004, 173, 2909–2912. [Google Scholar] [CrossRef]
- Liu, P.T.; Stenger, S.; Li, H.; Wenzel, L.; Tan, B.H.; Krutzik, S.R.; Ochoa, M.T.; Schauber, J.; Wu, K.; Meinken, C.; et al. Toll-like receptor triggering of a vitamin D-mediated human antimicrobial response. Science 2006, 311, 1770–1773. [Google Scholar] [CrossRef]
- Probert, C. Commentary: Vitamin D supplementation in Crohn’s disease. Aliment. Pharmacol. Ther. 2020, 51, 201–202. [Google Scholar] [CrossRef]
- Guzman-Prado, Y.; Samson, O.; Segal, J.P.; Limdi, J.K.; Hayee, B. Vitamin D Therapy in Adults With Inflammatory Bowel Disease: A Systematic Review and Meta-Analysis. Inflamm. Bowel Dis. 2020, 26, 1819–1830. [Google Scholar] [CrossRef]
- Zepeda, M.; Perez, J.; Doepking, C. Vitamin D supplementation in inflammatory bowel disease: A narrative review. Medwave 2022, 22, e8536. [Google Scholar] [CrossRef]
- Gordon, R.J.; Wells, R.; Johansen, C.; Liu, S.; Dahlberg, S.E.; Snapper, S.B.; Rufo, P.A. Efficacy and safety of high dose cholecalciferol in patients with inflammatory bowel disease receiving infliximab. J. Pediatr. Gastroenterol. Nutr. 2022, 74, 476–483. [Google Scholar] [CrossRef]
- Shaikh, N.A.; Zhang, X.B.; Abdalla, M.I.; Baylink, D.J.; Tang, X. Enhancing Human Treg Cell Induction through Engineered Dendritic Cells and Zinc Supplementation. Crit. Rev. Immunol. 2024, 44, 37–52. [Google Scholar] [CrossRef]
- Tian, H.; Biehs, B.; Warming, S.; Leong, K.G.; Rangell, L.; Klein, O.D.; de Sauvage, F.J. A reserve stem cell population in small intestine renders Lgr5-positive cells dispensable. Nature 2011, 478, 255–259. [Google Scholar] [CrossRef]
- Sheng, X.; Lin, Z.; Lv, C.; Shao, C.; Bi, X.; Deng, M.; Xu, J.; Guerrero-Juarez, C.F.; Li, M.; Wu, X.; et al. Cycling Stem Cells Are Radioresistant and Regenerate the Intestine. Cell Rep. 2020, 32, 107952. [Google Scholar] [CrossRef]
- Fernandez-Barral, A.; Costales-Carrera, A.; Buira, S.P.; Jung, P.; Ferrer-Mayorga, G.; Larriba, M.J.; Bustamante-Madrid, P.; Dominguez, O.; Real, F.X.; Guerra-Pastrian, L.; et al. Vitamin D differentially regulates colon stem cells in patient-derived normal and tumor organoids. FEBS J. 2020, 287, 53–72. [Google Scholar] [CrossRef]
- Du, J.; Wei, X.; Ge, X.; Chen, Y.; Li, Y.C. Microbiota-Dependent Induction of Colonic Cyp27b1 Is Associated With Colonic Inflammation: Implications of Locally Produced 1,25-Dihydroxyvitamin D3 in Inflammatory Regulation in the Colon. Endocrinology 2017, 158, 4064–4075. [Google Scholar] [CrossRef] [PubMed]
- Wada, K.; Tanaka, H.; Maeda, K.; Inoue, T.; Noda, E.; Amano, R.; Kubo, N.; Muguruma, K.; Yamada, N.; Yashiro, M.; et al. Vitamin D receptor expression is associated with colon cancer in ulcerative colitis. Oncol. Rep. 2009, 22, 1021–1025. [Google Scholar] [CrossRef] [PubMed]
- Aita, R.; Aldea, D.; Hassan, S.; Hur, J.; Pellon-Cardenas, O.; Cohen, E.; Chen, L.; Shroyer, N.; Christakos, S.; Verzi, M.P.; et al. Genomic analysis of 1,25-dihydroxyvitamin D(3) action in mouse intestine reveals compartment and segment-specific gene regulatory effects. J. Biol. Chem. 2022, 298, 102213. [Google Scholar] [CrossRef] [PubMed]
- Meeker, S.; Seamons, A.; Maggio-Price, L.; Paik, J. Protective links between vitamin D, inflammatory bowel disease and colon cancer. World J. Gastroenterol. 2016, 22, 933–948. [Google Scholar] [CrossRef]


Disclaimer/Publisher’s Note: The statements, opinions and data contained in all publications are solely those of the individual author(s) and contributor(s) and not of MDPI and/or the editor(s). MDPI and/or the editor(s) disclaim responsibility for any injury to people or property resulting from any ideas, methods, instructions or products referred to in the content. |
© 2024 by the authors. Licensee MDPI, Basel, Switzerland. This article is an open access article distributed under the terms and conditions of the Creative Commons Attribution (CC BY) license (https://creativecommons.org/licenses/by/4.0/).
Share and Cite
Shaikh, N.A.; Liu, C.; Yin, Y.; Baylink, D.J.; Tang, X. 1,25-Dihydroxyvitamin D Enhances the Regenerative Function of Lgr5+ Intestinal Stem Cells In Vitro and In Vivo. Cells 2024, 13, 1465. https://doi.org/10.3390/cells13171465
Shaikh NA, Liu C, Yin Y, Baylink DJ, Tang X. 1,25-Dihydroxyvitamin D Enhances the Regenerative Function of Lgr5+ Intestinal Stem Cells In Vitro and In Vivo. Cells. 2024; 13(17):1465. https://doi.org/10.3390/cells13171465
Chicago/Turabian StyleShaikh, Nisar Ali, Chenfan Liu, Yue Yin, David J. Baylink, and Xiaolei Tang. 2024. "1,25-Dihydroxyvitamin D Enhances the Regenerative Function of Lgr5+ Intestinal Stem Cells In Vitro and In Vivo" Cells 13, no. 17: 1465. https://doi.org/10.3390/cells13171465