Article

Selective Targeting of α4β7/MAdCAM-1 Axis Suppresses Fibrosis Progression by Reducing Proinflammatory T Cell Recruitment to the Liver

1
Division of Experimental Pathology, Department of Pathology, University of Pittsburgh School of Medicine, Pittsburgh, PA 15261, USA
2
Pittsburgh Liver Research Center, University of Pittsburgh, Pittsburgh, PA 15261, USA
3
Division of Anatomic Pathology, Department of Pathology, University of Pittsburgh School of Medicine, Pittsburgh, PA 15261, USA
4
Division of Gastroenterology, Hepatology and Nutrition, Department of Medicine, University of Pittsburgh School of Medicine, Pittsburgh, PA 15261, USA
*
Author to whom correspondence should be addressed.
These authors contributed equally to this work.
Cells 2024, 13(9), 756; https://doi.org/10.3390/cells13090756
Submission received: 30 January 2024 / Revised: 24 April 2024 / Accepted: 25 April 2024 / Published: 27 April 2024

Abstract

:
Integrin α4β7+ T cells perpetuate tissue injury in chronic inflammatory diseases, yet their role in hepatic fibrosis progression remains poorly understood. Here, we report increased accumulation of α4β7+ T cells in the liver of people with cirrhosis relative to disease controls. Similarly, hepatic fibrosis in the established mouse model of CCl4-induced liver fibrosis was associated with enrichment of intrahepatic α4β7+ CD4 and CD8 T cells. Monoclonal antibody (mAb)-mediated blockade of α4β7 or its ligand mucosal addressin cell adhesion molecule (MAdCAM)-1 attenuated hepatic inflammation and prevented fibrosis progression in CCl4-treated mice. Improvement in liver fibrosis was associated with a significant decrease in the infiltration of α4β7+ CD4 and CD8 T cells, suggesting that α4β7/MAdCAM-1 axis regulates both CD4 and CD8 T cell recruitment to the fibrotic liver, and α4β7+ T cells promote hepatic fibrosis progression. Analysis of hepatic α4β7+ and α4β7- CD4 T cells revealed that α4β7+ CD4 T cells were enriched for markers of activation and proliferation, demonstrating an effector phenotype. The findings suggest that α4β7+ T cells play a critical role in promoting hepatic fibrosis progression, and mAb-mediated blockade of α4β7 or MAdCAM-1 represents a promising therapeutic strategy for slowing hepatic fibrosis progression in chronic liver diseases.

1. Introduction

Wound healing and repair are fundamental biological processes critical to maintaining tissue architecture and restoring organ homeostasis following injury [1]. Protracted injury, however, can dysregulate this process resulting instead in excessive extracellular matrix deposition and tissue scarring or fibrosis. Progressive fibrosis is characteristic of advanced chronic liver diseases (CLDs), including alcoholic and nonalcoholic steatohepatitis as well as viral and autoimmune hepatitis [2,3,4]. Chronic unresolved fibrosis can lead to cirrhosis, the 11th leading cause of global deaths and a major risk factor for developing hepatocellular carcinoma (HCC), which is among the top 20 causes of death worldwide. Consequently, therapeutic strategies to stop progression of fibrosis are urgently needed.
The inflammatory response to liver injury, essential for resolution of injury and tissue repair, is a highly regulated process where both the initiation and resolution of inflammation are mediated by the liver-resident and liver-recruited immune cells. Chronic injury, however, leads to a perpetuation of hepatic inflammation characterized by sustained infiltration of immune cells to the liver and maintenance of fibrogenic pathways. While the liver-resident macrophages or Kupffer cells (KCs) play a key role in the initiation of inflammation, recent data show that they are depleted in the advanced stages of CLD. Ultimately, the recruited proinflammatory immune cells, including cells of both myeloid and lymphoid origin, play a more prominent role in fibrosis progression, making them an interesting target for therapeutic approaches to address fibrosis progression [5].
Immune cell recruitment to the liver following injury is mediated by chemokines and cytokines released by damaged hepatocytes, activated KCs as well as HSC-derived myofibroblasts. Recently, we demonstrated that the heterodimeric integrin receptor α4β7 expressed on T cells and its ligand, mucosal addressin cell adhesion molecule (MAdCAM)-1, expressed on endothelial cells, drive hepatic inflammation in NASH by promoting recruitment of α4β7+ CD4 T cells to the liver [6]. The α4β7/MAdCAM-1 axis is also implicated in promoting hepatic inflammation in chronic inflammatory liver diseases and primary sclerosing cholangitis (PSC), and upregulation of MAdCAM-1 expression is reported in the liver of most CLD patients [7,8,9,10]. Despite strong evidence suggesting that the α4β7/MAdCAM-1 axis is influential in CLD, the role of α4β7/MAdCAM-1 axis in promoting hepatic fibrosis progression remains poorly delineated.
In the current study, using an established model of CCl4-induced liver fibrosis, we show a critical role of α4β7+ CD4 and α4β7+ CD8 T cells in promoting hepatic fibrosis progression. Our findings suggest that blocking α4β7/MAdCAM-1-mediated recruitment of α4β7+ T cells to the liver may represent a novel therapeutic strategy to slow or prevent fibrosis progression in CLD.

2. Methods

2.1. Mouse Studies

Animal studies were performed in accordance with ethical guidelines and regulations set forth by the University of Pittsburgh Institutional Animal Care and Use Committee (IACUC) and conform to Association for Assessment and Accreditation of Laboratory Animal Care (AAALAC) standards for humane treatment of laboratory animals. All experimental protocols and procedures were reviewed and approved by IACUC (approval number 21079689; PHS Assurance Number: D16-00118). All animal protocols and methods are reported in accordance with ARRIVE (Animal Research: Reporting of In Vivo Experiments) guidelines (https://arriveguidelines.org; accessed on 12 December 2023). The mice were housed and cared for at the University of Pittsburgh Division of Animal Resources. The University of Pittsburgh is in compliance with state and federal Animal Welfare Acts. Age- and sex-matched littermates were used for all experiments at 8–10 wk of age. Adult male C57BL/6J mice were obtained from The Jackson Laboratory (Bar Harbor, ME, USA).

2.2. Mouse Model of Liver Fibrosis and α4β7 and MAdCAM-1 Antibody Treatment

To induce hepatic fibrosis, eight-week-old male mice were randomized to receive twice-weekly oral gavage of CCl4 (2 mL/kg CCl4 in 1:1 v/v olive oil) or an equal volume of olive oil for six weeks. After 2 weeks of CCl4 treatment, a randomized cohort of mice received twice-weekly intraperitoneal injections of 8 mg/kg α4β7 mAb (DATK32; Bioxcell, West Lebanon, NH, USA) or MAdCAM-1 mAb (MECA-367; Bioxcell, West Lebanon, NH, USA), or rat IgG2a isotype antibody (Bioxcell, West Lebanon, NH, USA) for four weeks.

2.3. Human Tissue

For this study, de-identified, fixed explanted liver tissues from people receiving orthotopic liver transplantation for decompensated liver cirrhosis were obtained from the Clinical Biospecimen Repository and Processing Core at Pittsburgh Liver Research Centre (CBRPC). Liver tissue from tumor-adjacent parenchyma of people with hepatocellular carcinoma was used as control. Study was approved by the University of Pittsburgh Institutional Review Board (IRB) Office of Research protection and procedures were carried out in accordance with relevant guidelines and regulations (IRB approval number: STUDY20010114, study title: Non-Neoplastic Liver Diseases). Informed consent was waived by the University of Pittsburgh IRB.

2.4. Histopathology

Histopathological analyses, including hematoxylin and eosin (H&E) and Sirius Red staining, were conducted on formalin-fixed liver tissue sections as previously reported [11]. Photomicrographs of the histologic sections were obtained by using a Zeiss Light Microscope (Zeiss, Jena, Germany). Morphometric quantification of Sirius Red-stained collagen-positive regions was performed using ImageJ software version 1.54g [12].

2.5. Immunofluorescence Microscopy

Immunofluorescence (IF) microscopy was conducted on liver cryosections as previously reported [11]. The IF images were visualized and obtained by using an Axioskop 2 plus microscope (Zeiss, Jena, Germany). Following antibodies were used for mouse tissue: α4β7/LPAM1 (cat. no. 120702; clone: MECA-367; Biolegend, San Diego, CA, USA), aSMA (cat. no. MA1-06110; ThermoFisher Scientific, Waltham, MA, USA), MAdCAM1 (cat. no. 16-5997-85; ThermoFisher Scientific, Waltham, MA, USA). Following antibodies were used for human tissue: α4β7/LPAM1 (cat. no. DDX1434P-100; clone: 11D9.03; Novus Biologicals, Centennial, CO, USA)) and CD3 (cat. no. ab135372; Abcam, Waltham, MA, USA).

2.6. Serological Analysis

Serum alanine aminotransferase (ALT) and aspartate aminotransferase (AST) concentrations were measured using an AST and ALT Activity Assay Kit (Sigma-Aldrich, St. Louis, MO, USA).

2.7. Flow Cytometric Analysis

Livers perfused with 1X PBS (Thermo Fisher Scientific, Waltham, MA, USA) were digested with 2 mg/mL type IV collagenase (Worthington, NY, USA) to obtain single-cell suspensions and the lymphocytes were enriched by Percoll gradient centrifugation as described previously [11]. Enriched lymphocytes were stained with fluorochrome-conjugated antibodies and fixable viability stain (BD Biosciences, San Jose, CA, USA), and samples were acquired on a Cytek Aurora Spectral Cytometer (Cytek Biosciences, Bethesda, MD, USA) equipped with five lasers. Data were analyzed using FlowJo software v X.10 (Tree Star, Inc., Ashland, OR, USA) as described previously [11]. Total numbers were computed by multiplying a proportion of specific populations by the total number of enriched lymphocytes/liver. Fluorochrome-conjugated antibodies against CD45 (30-F11), CD3 (17A2), CD4 (RM4-5), CD8 (53-6.7), CD44 (IM7), CD69 (H1.2F3), Tbet (4B10), α4β7 (LPAM-1; DATK32) and Ly6C (AL-21) were purchased from BD Biosciences (San Jose, CA, USA). Fluorochrome-conjugated antibodies against Foxp3 (FJK-16s), Ki67 (SolA15), NK1.1 (PK136), F4/80 (BM8), CD11b (M1/70), Ly6G (RB6-8C5) and Live/Dead Aqua were purchased form ThermoFisher Scientific (Waltham, MA, USA).

2.8. Quantitative Real-Time PCR

Isolation of total RNA from liver, cDNA synthesis and qRT-PCR were performed as previously described [11]. Data were normalized to 18S rRNA and data are presented as fold change in gene expression compared to controls.

2.9. Statistical Analysis

Two-tailed Student’s t test was employed to compare mean differences between two groups. One-way ANOVA in conjunction with post hoc analysis for multiple group comparison was employed to investigate statistical differences between multiple groups. A p value < 0.05 was considered statistically significant. Data shown are representative of 3 independent experiments. Statistical analyses were performed using GraphPad Prism 8.0 (GraphPad Software, Boston, MA, USA) software.

3. Results

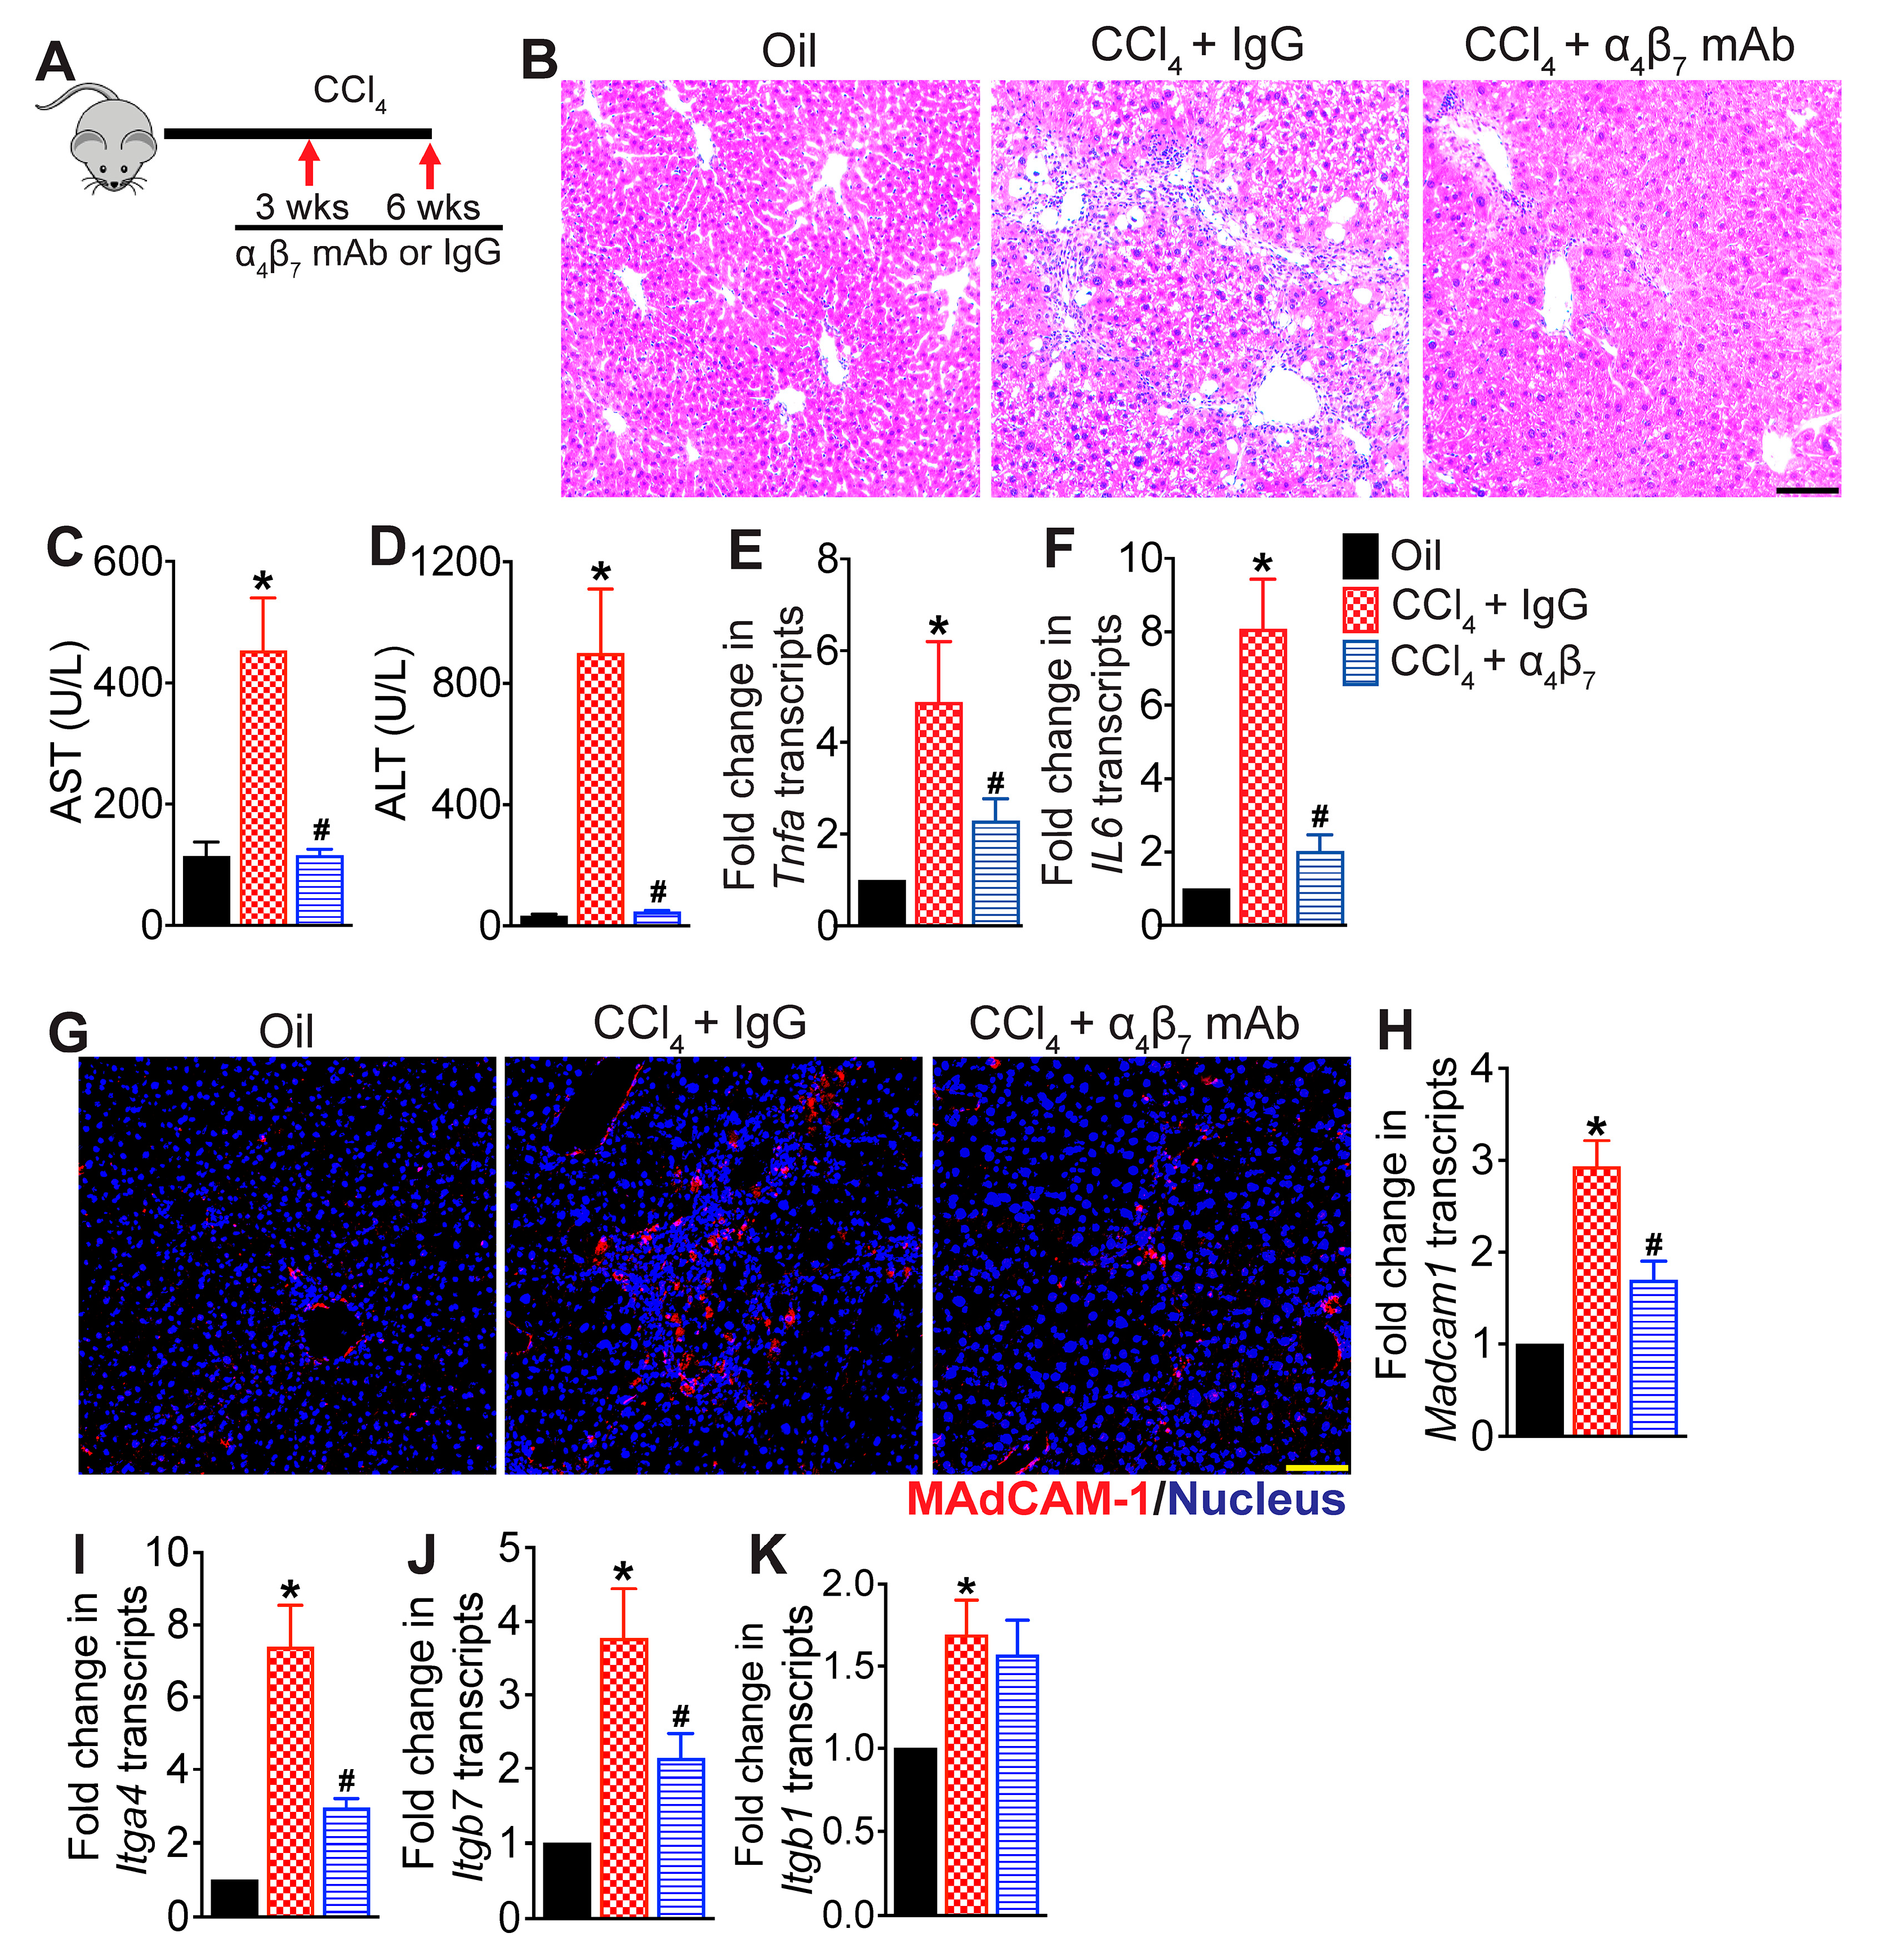
3.1. Integrin α4β7 Blockade Attenuates CCl4-Induced Hepatic Inflammation

We recently demonstrated that blocking α4β7+ T cell recruitment to the liver reduces hepatic injury in a murine model of NASH [6]. To determine whether α4β7+ T cells play a role in promoting hepatic fibrosis, we used an established mouse model of liver fibrosis to investigate whether blocking recruitment of α4β7+ T cells would be effective in decreasing hepatic fibrosis progression (Figure 1A). Mice were treated with CCl4 for six weeks to induce hepatic fibrosis. Mice administered the vehicle, olive oil, served as controls. A cohort of CCl4-treated mice received α4β7 mAb for four weeks starting at week three. Mice treated with IgG isotype antibody served as controls (CCl4 + IgG). As shown in Figure 1B, CCl4 + IgG-treated mice experienced severe liver injury indicated by increased infiltration of immune cells, steatosis and necrotic hepatocytes relative to vehicle controls. Increased liver injury in CCl4 + IgG-treated mice was further corroborated by high serum aspartate aminotransferase (AST) and alanine aminotransferase (ALT) levels relative to vehicle controls (Figure 1C,D). Transcript levels of key pro-inflammatory cytokines, tumor necrosis factor-α (Tnfa) and interleukin IL-6 (IL6), were also significantly upregulated in the livers of CCl4 + IgG-treated mice relative to controls, indicative of severe hepatic inflammation (Figure 1E,F). Immunofluorescence microscopic analysis of liver tissue sections revealed higher MAdCAM-1 expression in the livers of CCl4 + IgG-treated mice relative to controls (Figure 1G). This was further corroborated by a significant increase in Madcam1 transcripts in the livers of CCl4 + IgG-treated mice relative to controls (Figure 1H). Transcript levels of the integrin monomers integrin subunit α4 (Itga4), integrin subunit β1 (Itgb1) and integrin subunit β7 (Itgb7) were also significantly upregulated in the livers of CCl4 + IgG-treated mice relative to controls, implicating a role of α4β7/MAdCAM-1 axis in CCl4-induced hepatic inflammation and injury.
In contrast, histological analysis of liver tissue sections from CCl4 + α4β7-mAb-treated mice revealed substantial improvement in hepatic inflammation as evidenced by reduced infiltration of immune cells and reduced tissue injury (Figure 1B). The marked attenuation of liver injury in CCl4 + α4β7-mAb-treated mice was further substantiated by significantly reduced serum ALT and AST levels (Figure 1C,D). Compared to IgG controls, α4β7 mAb treatment significantly reduced transcript levels of key pro-inflammatory cytokines, Tnfa and IL6, in the liver (Figure 1E,F). This correlated with a marked decrease in hepatic Madcam1 expression in α4β7 mAb-treated mice relative to IgG controls (Figure 1G,H). Treatment with α4β7 mAb also significantly reduced transcript levels of integrins Itga4 and Itgb7, but not Itgb1 (Figure 1I–K). Collectively, these results demonstrate that α4β7 blockade protected mice from CCl4-induced hepatic inflammation and injury.

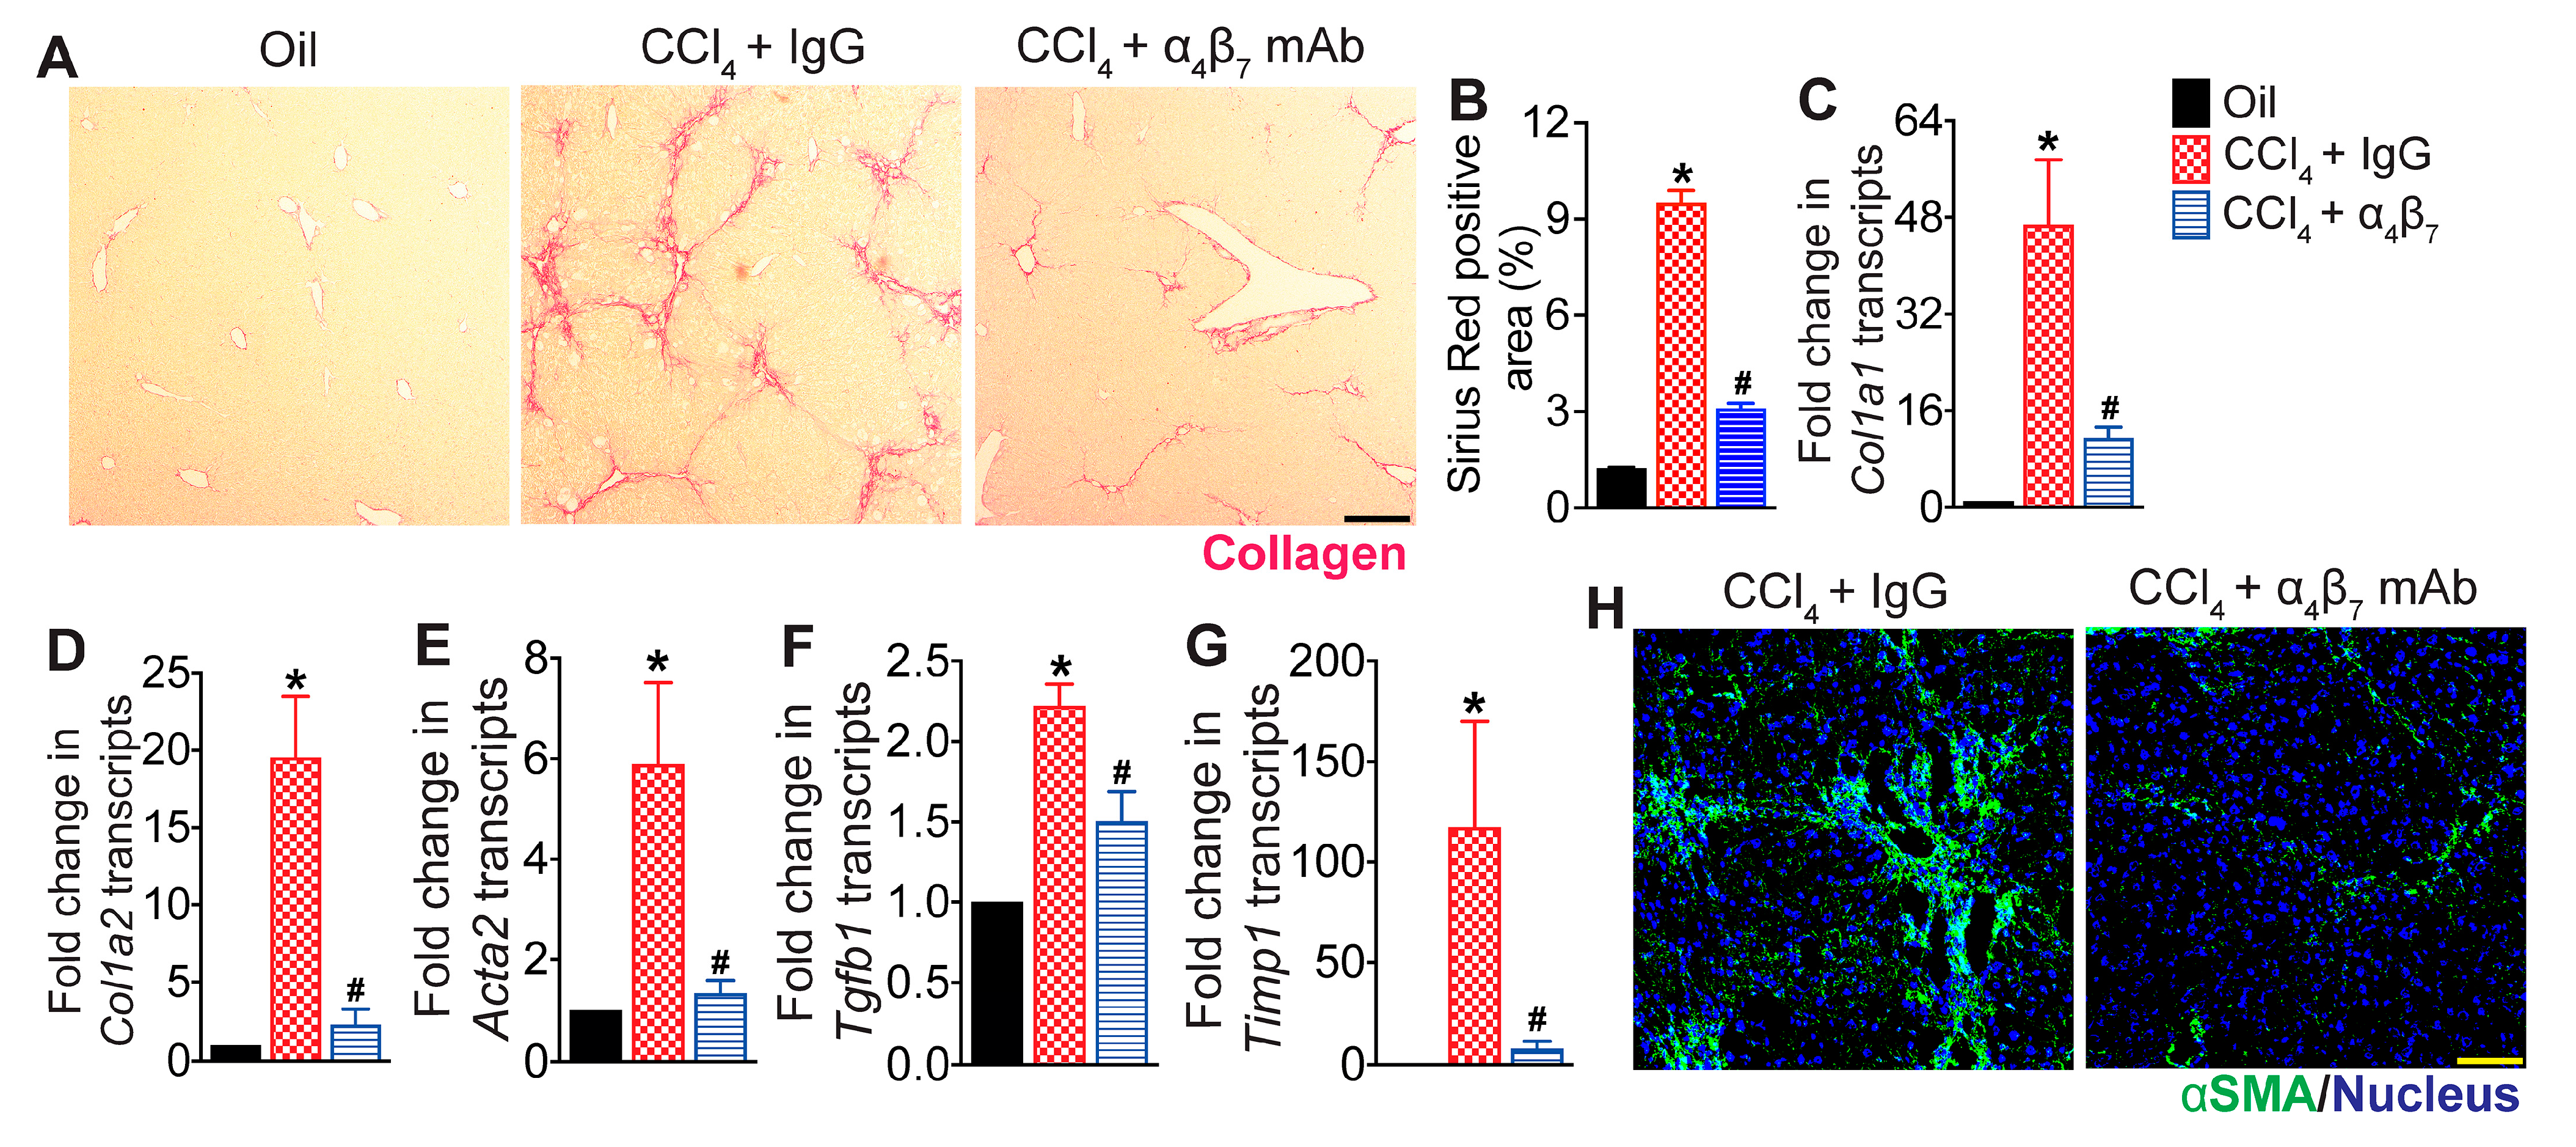
3.2. Integrin α4β7 Blockade Reduces Hepatic Fibrosis Progression

To determine the effect of α4β7 blockade on hepatic fibrosis, liver tissue sections were stained with Sirius Red to assess collagen deposition, while transcript levels of key molecules associated with hepatic fibrogenesis were quantified by qRT-PCR. As shown in Figure 2A,B, CCl4 treatment induced severe hepatic fibrosis, indicated by increased collagen deposition in the livers of CCl4 + IgG-treated mice compared to vehicle controls. The transcript levels of fibrogenesis marker α-smooth muscle actin (αSMA, encoded by Acta2), a key marker of hepatic stellate cell (HSC) activation, collagen I (Col1a1 and Col1a2), transforming growth factor-β1 (Tgfb1) and tissue inhibitor of metalloproteinse-1 (Timp1) were also significantly elevated in the CCl4 + IgG-treated mice relative to controls (Figure 2C–G). Treatment with α4β7 mAb reduced hepatic fibrosis reflected by decreased collagen deposition in the liver and significant reduction in the transcript levels of Acta2, Col1a1, Col1a2, Tgfb1 and Timp1 (Figure 2A–G). These results were further corroborated by confocal imaging of αSMA-stained liver tissue sections, demonstrating significant inhibition of HSC activation evidenced by reduced hepatic αSMA-expressing HSCs following α4β7 mAb treatment (Figure 2H). Taken together, these results demonstrate that α4β7 blockade attenuates CCl4-induced hepatic fibrosis.

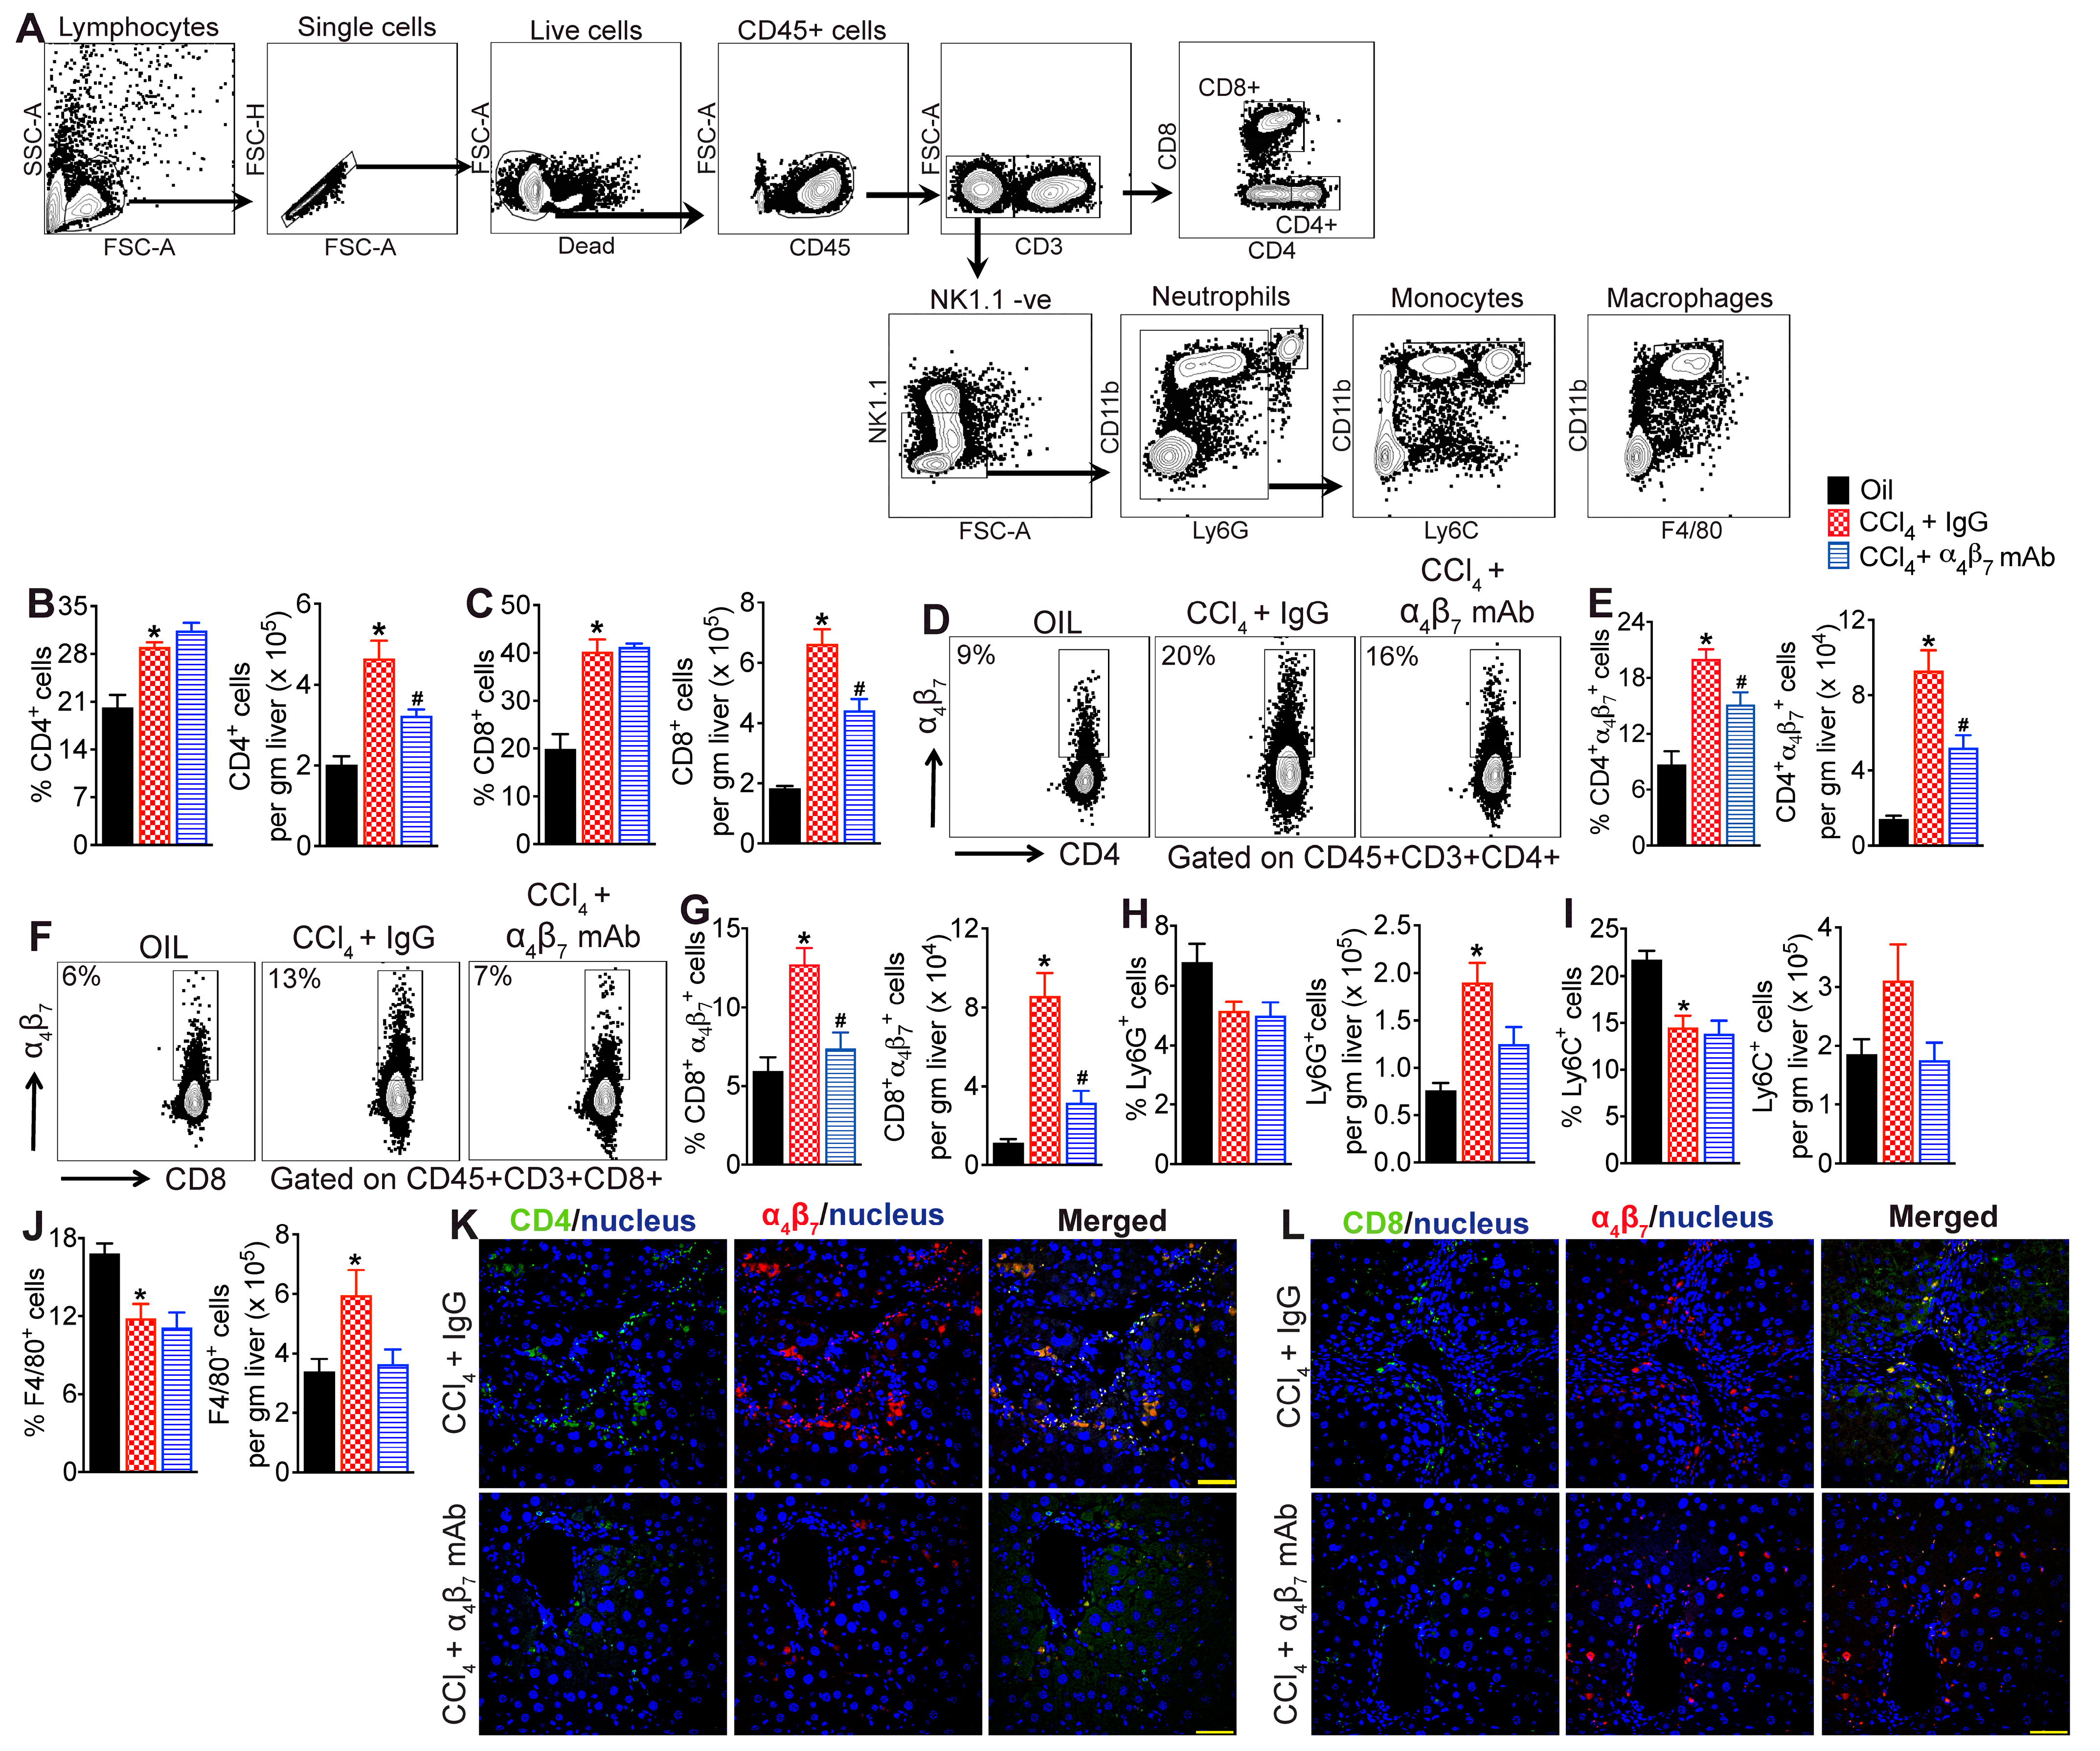
3.3. α4β7 mAb Treatment Reduces Accumulation of α4β7+ T Cells in the Fibrotic Liver

To determine whether α4β7 mAb treatment reduces hepatic inflammation and fibrosis in CCl4-treated mice by decreasing the recruitment of α4β7+ immune cells to the liver, we assessed hepatic immune cell infiltrates using flow cytometry (Figure 3A). Phenotypic analysis of intrahepatic lymphocytes revealed significant enrichment of CD4 and CD8 T cells in the livers of CCl4 + IgG-treated mice compared to vehicle controls (Figure 3B,C). Interestingly, significantly higher percentages and total numbers of CD4 and CD8 T cells in the livers of CCl4 + IgG-treated mice were positive for the expression of α4β7 (Figure 3D–G). Treatment with α4β7 mAb significantly reduced intrahepatic α4β7+ CD4 and CD8 T cells in CCl4-treated mice compared to IgG controls (Figure 3D–G). Treatment with α4β7 mAb also significantly reduced the total number but not the percentage of CD4 and CD8 T cells in the livers of CCl4-treated mice compared to IgG controls, suggesting a net decrease in T cell populations in the livers of α4β7 mAb-treated mice (Figure 3B,C). Analysis of intrahepatic innate immune cells revealed reduction in frequencies but increase in the total numbers of neutrophils (CD3-NK1.1-Ly6G+ leukocytes), monocytes (CD3-NK1.1-Ly6G-Ly6C+ leukocytes) and macrophages (CD3-NK1.1-Ly6G-F4/80+ leukocytes) in the livers of CCl4 + IgG-treated mice compared to vehicle controls (Figure 3H–J). Treatment with α4β7 mAb reduced the total numbers of intrahepatic neutrophils, monocytes and macrophages but the reduction in the myeloid subsets did not reach statistical significance (Figure 3H–J). No changes in the percentages of intrahepatic neutrophils, monocytes or macrophages were observed between CCl4 + IgG-treated mice relative to CCl4 + α4β7 mAb-treated mice (Figure 3H–J). Colocalization studies revealed increased infiltration of α4β7+ CD4 and CD8 T cells in the livers of CCl4 + IgG-treated mice relative to vehicle controls (Figure 3K,L). Notably, higher accumulation of α4β7+ CD4 and CD8 T cells were observed in the fibrotic septa of the liver. Treatment with α4β7 mAb markedly decreased the infiltration of α4β7+ CD4 and CD8 T cells in the liver relative to IgG-treated mice, demonstrating that α4β7 blockade reduces α4β7+ T cell recruitment to the fibrotic liver (Figure 3K,L). Collectively, these findings indicate that α4β7 regulates recruitment and accumulation of CD4 and CD8 T cells in the fibrotic liver.

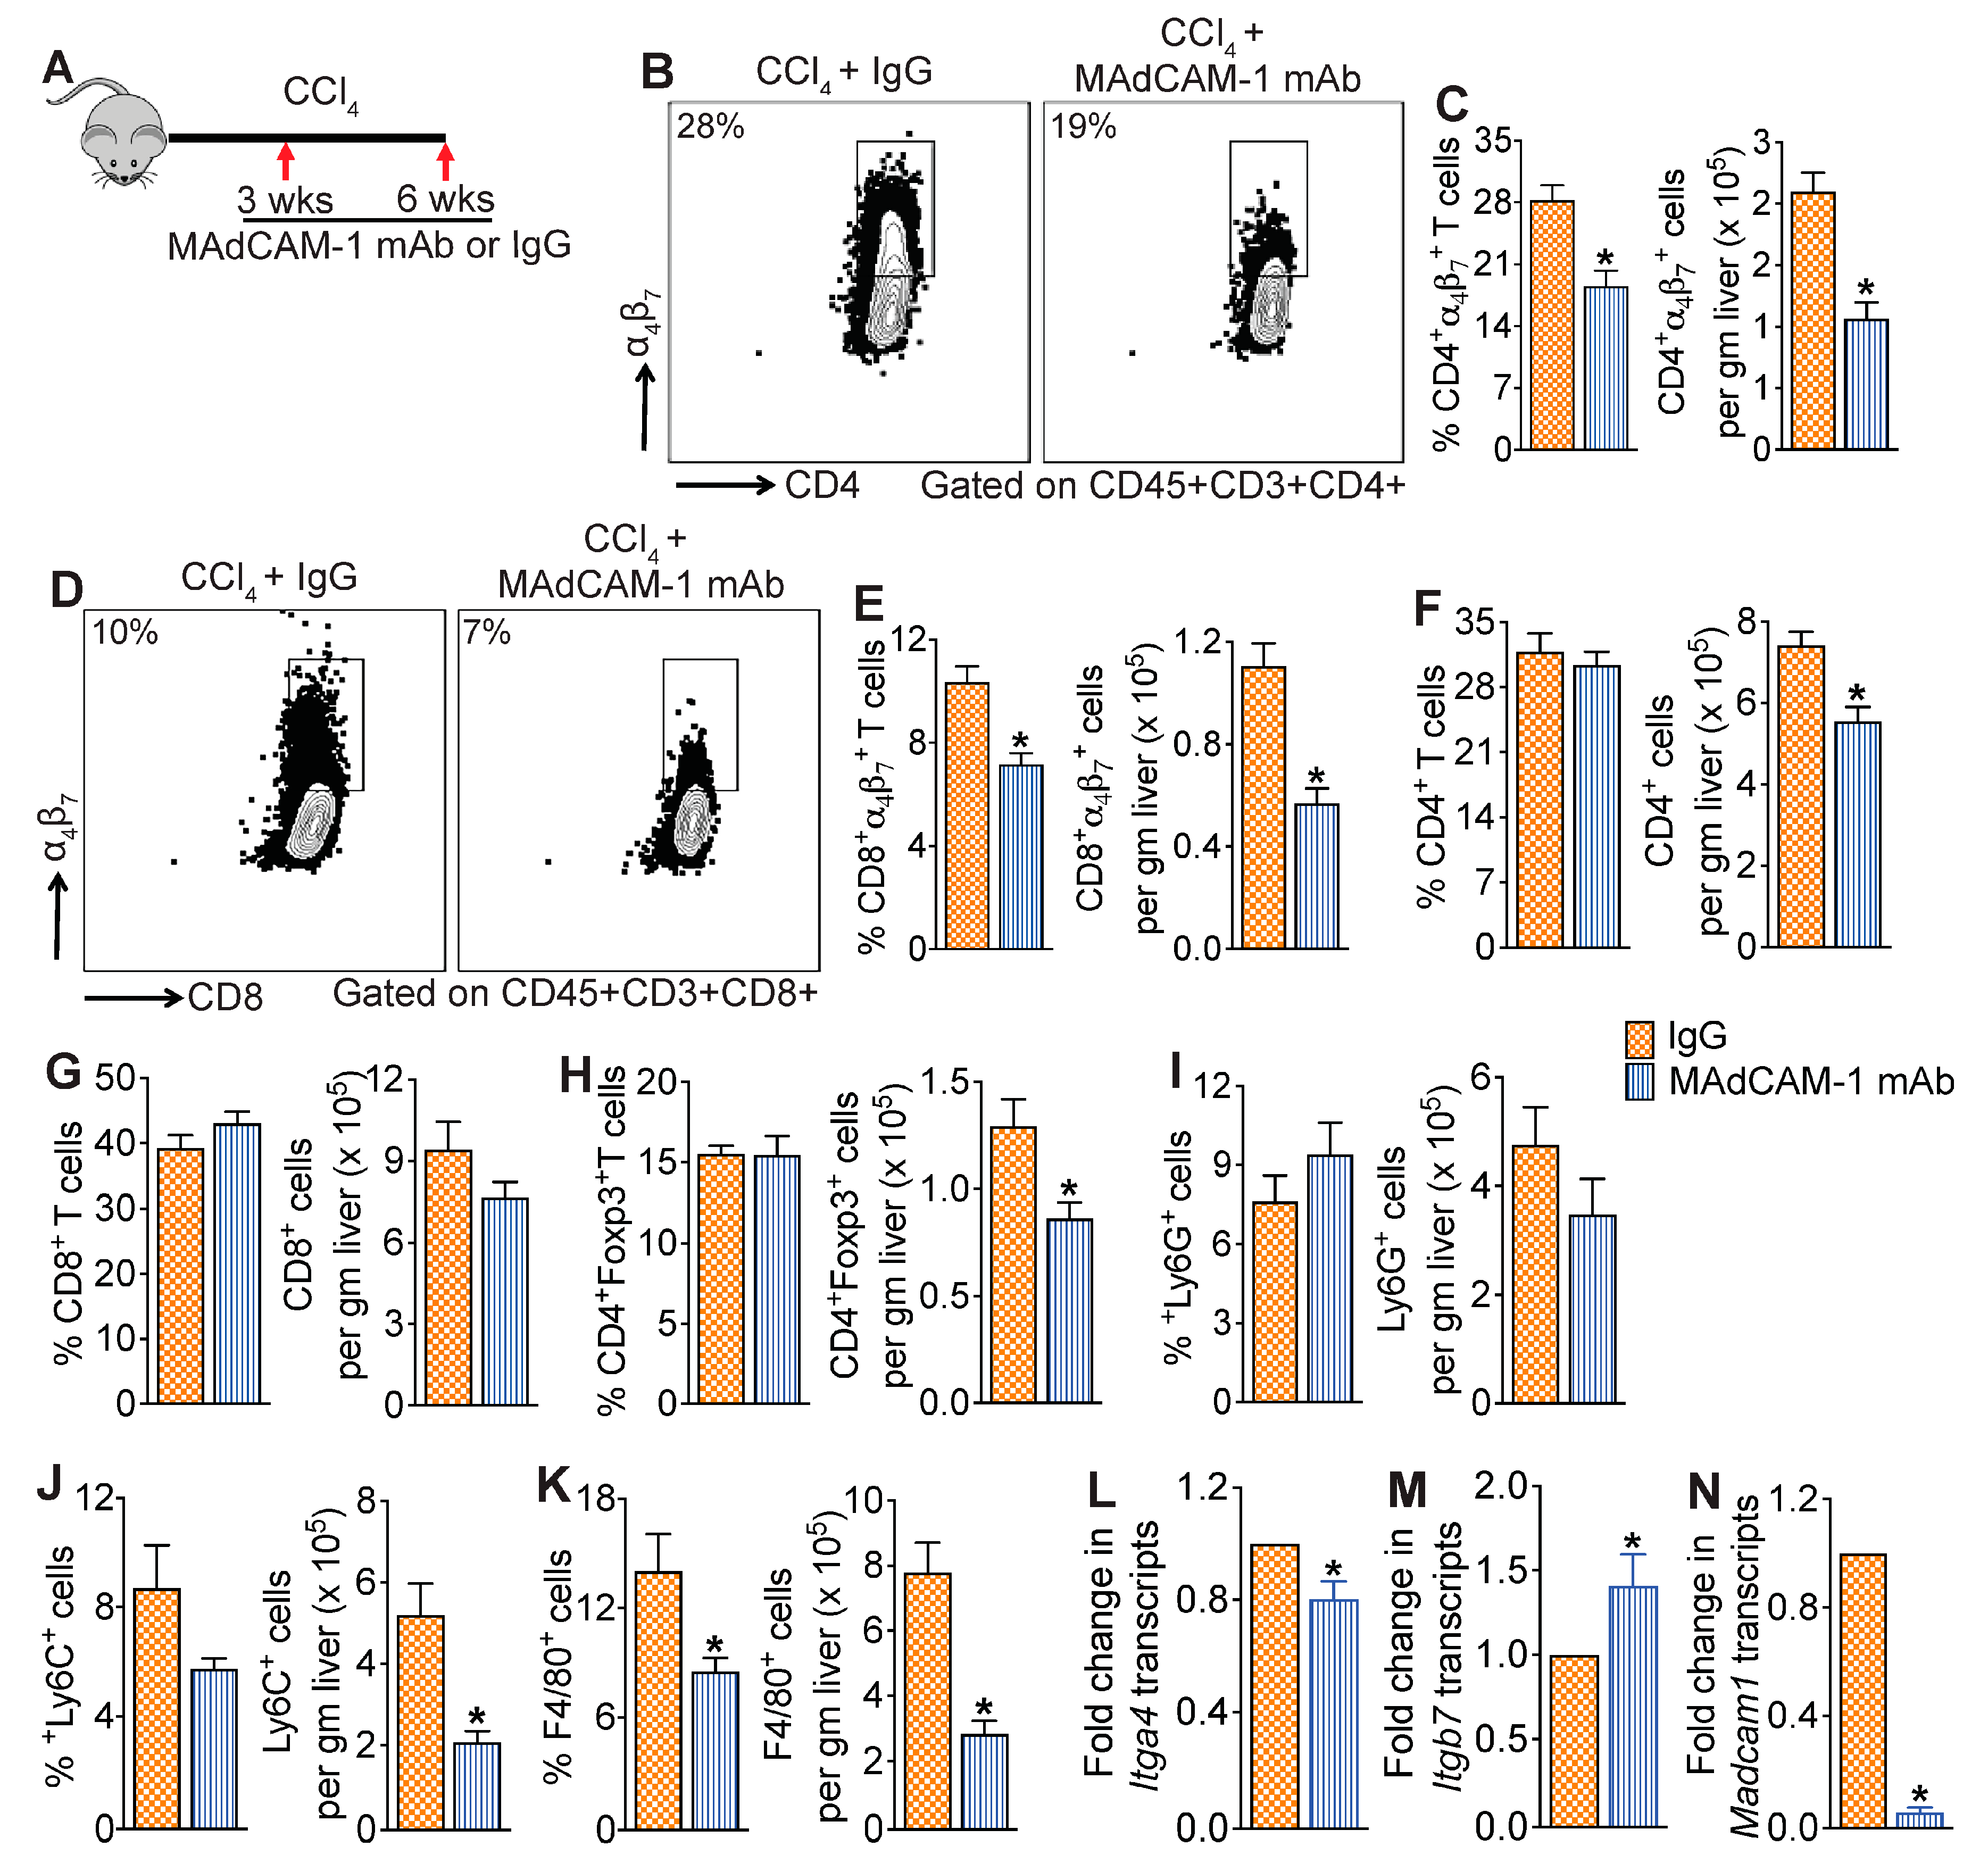
3.4. MAdCAM-1 Blockade Reduces CCl4-Induced Hepatic Infiltration of α4β7+ T Cells

To determine if MAdCAM-1 blockade has a similar impact on hepatic α4β7+ T cell recruitment in CCl4-treated mice and ultimately attenuates liver injury, a cohort of the CCl4-treated mice was treated with MAdCAM-1 mAb for four weeks. Mice treated with IgG isotype served as controls (Figure 4A). As shown in Figure 4B–E, four weeks of MAdCAM-1 mAb treatment significantly decreased intrahepatic α4β7+ CD4 and CD8 T cells in the CCl4 + MAdCAM-1 mAb-treated mice relative to IgG controls. Treatment with MAdCAM-1 mAb did not impact the frequency but reduced total CD4 T cell numbers (Figure 4F). No differences in the percentage and total number of CD8 T cells in the livers were observed in CCl4 + MAdCAM-1 mAb-treated mice relative to IgG controls (Figure 4G). Treatment with MAdCAM-1 mAb furthermore did not impact the frequency but reduced the total number of Foxp3+ T regulatory cells (Tregs) in the liver (Figure 4H). Analysis of intrahepatic innate immune cells revealed significant reduction in the frequency and total number of macrophages and monocytes, but not neutrophils, in the livers of CCl4 + MAdCAM-1 mAb-treated mice relative to IgG controls (Figure 4I–K). Treatment with MAdCAM-1 mAb significantly decreased the transcript levels of Itga4 and Madcam1, but increased Itgb7 transcripts, in the CCl4-treated mice relative to IgG controls (Figure 4L–N). These findings demonstrate that, similar to α4β7, MAdCAM-1 blockade also reduces the recruitment of α4β7+ T cells to the fibrotic liver, suggesting a role for the α4β7/MAdCAM-1 axis in regulating the recruitment of α4β7+ T cells to the fibrotic liver.

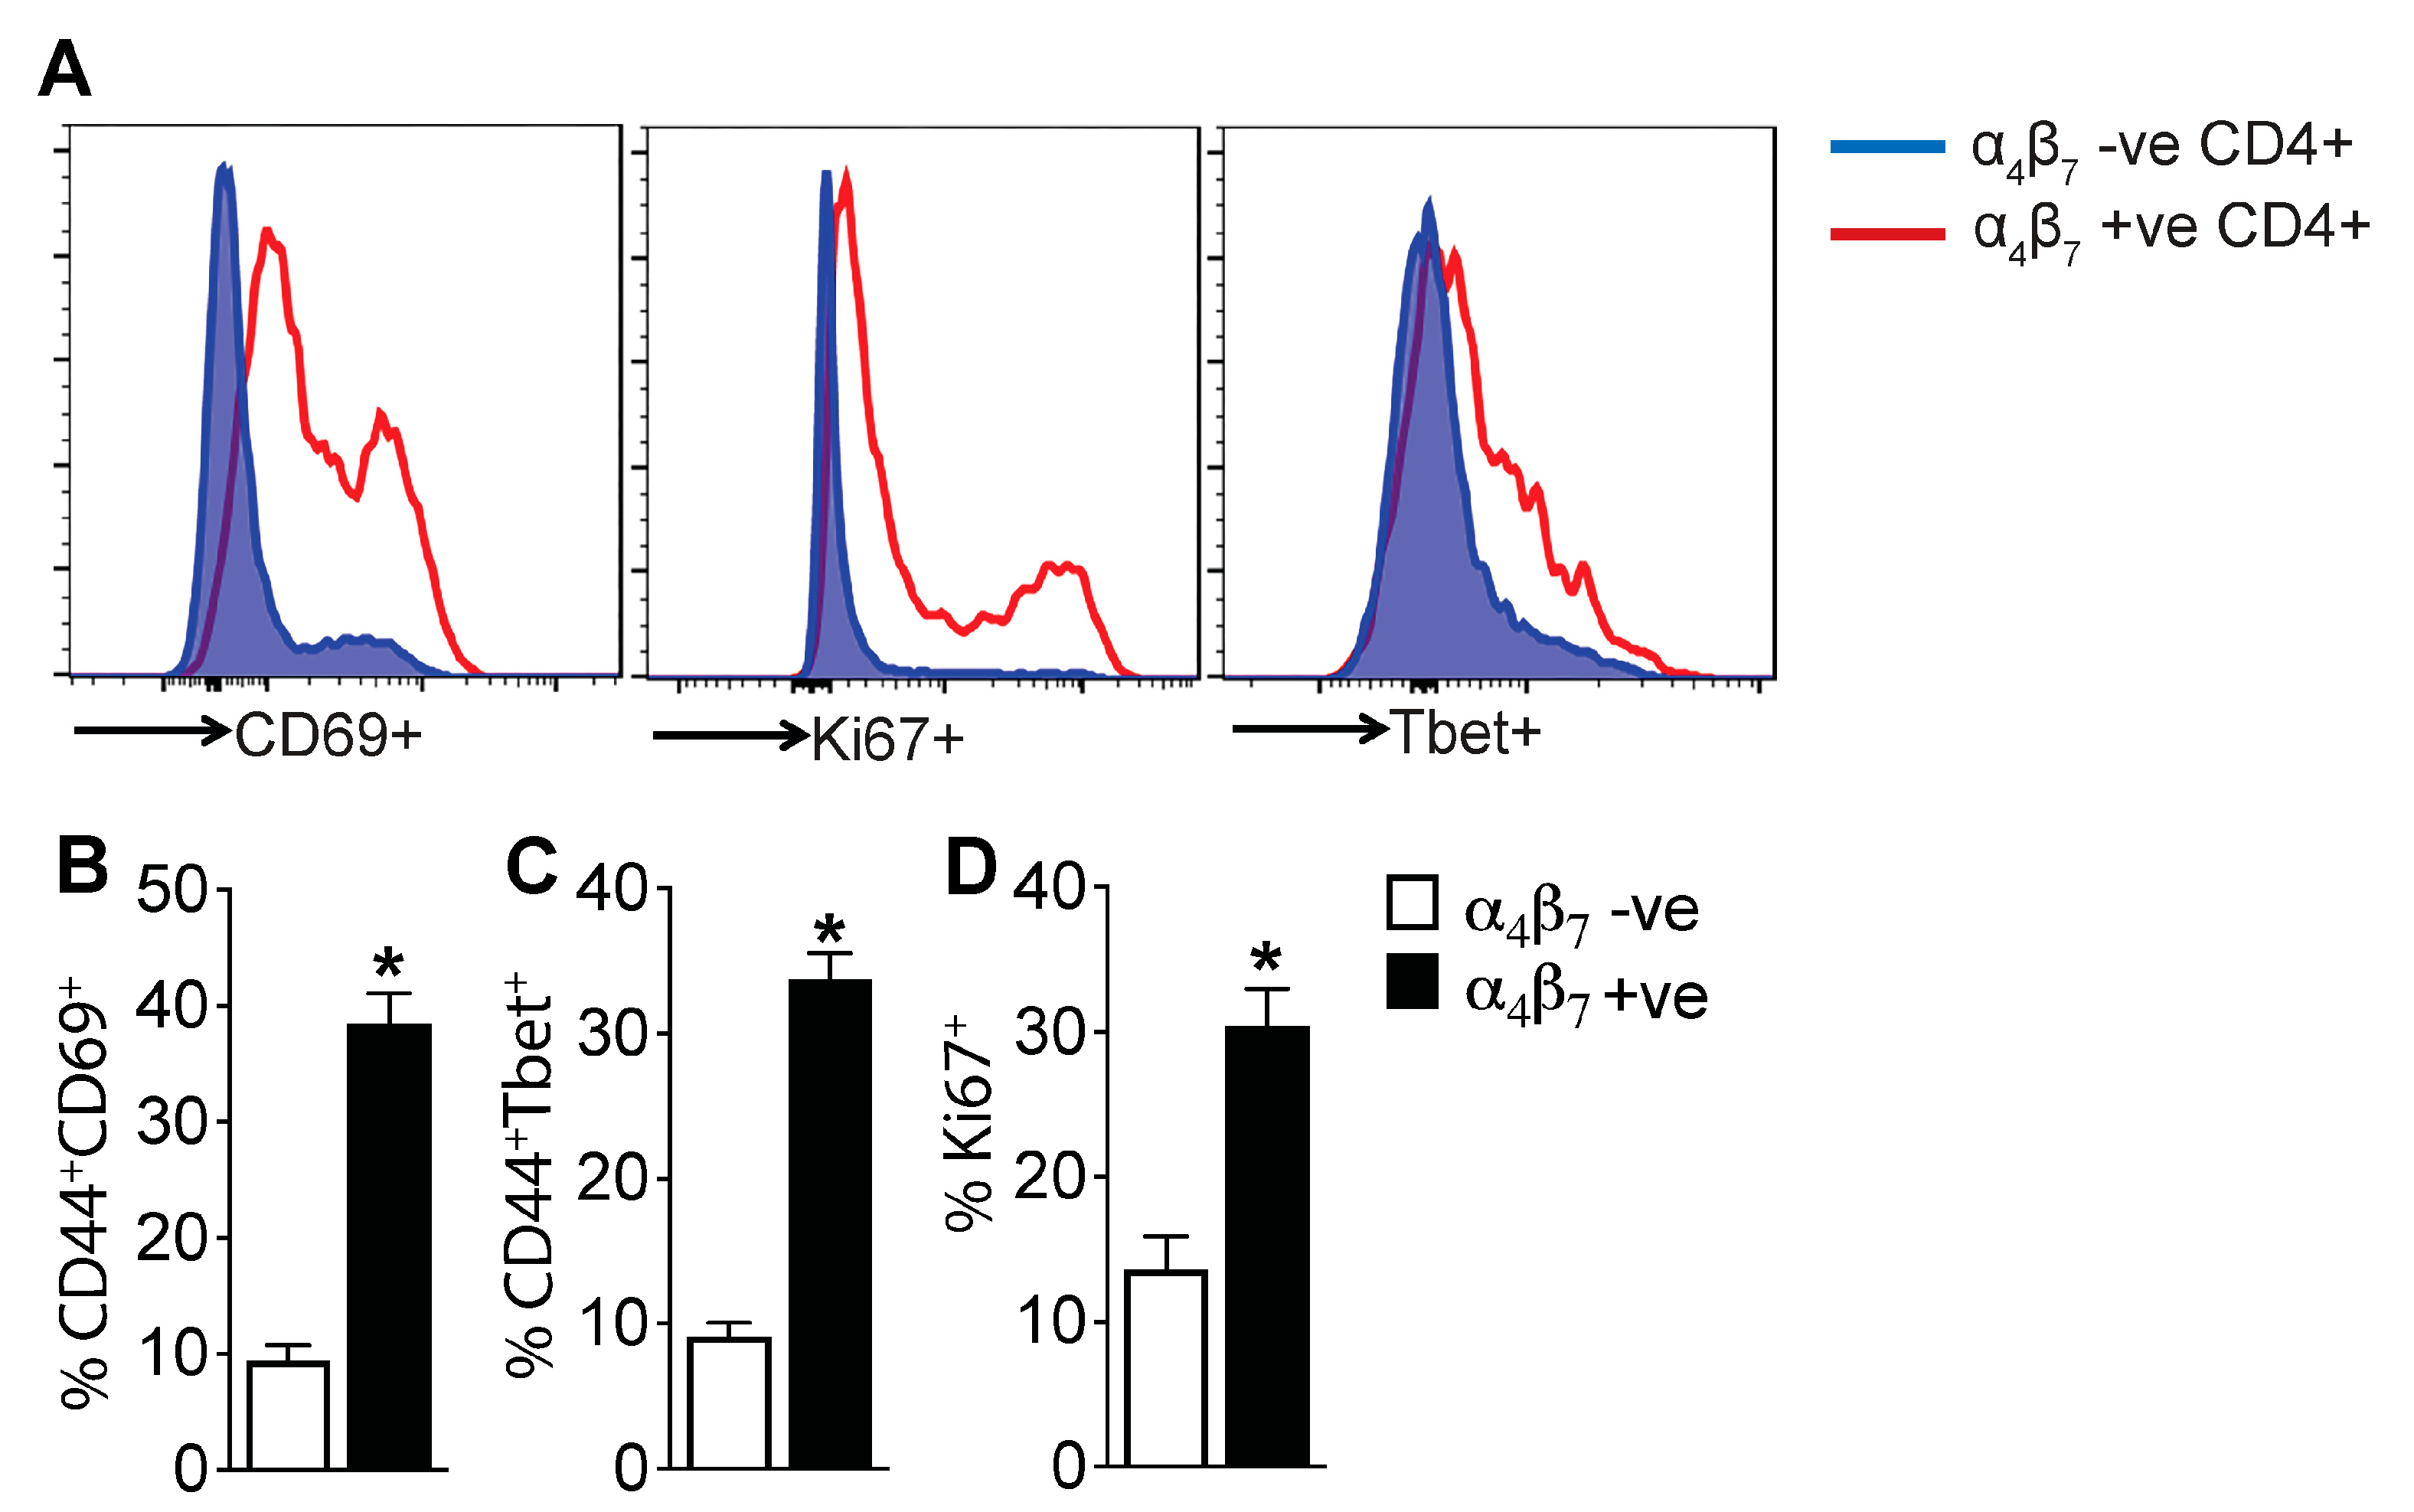
3.5. α4β7+ CD4 T Cells Are Enriched for Markers of Activation and Proliferation, Demonstrating an Effector Phenotype

To determine the function of α4β7+ CD4 T cells, we assessed the expression of T cell activation and proliferation markers in α4β7+ and α4β7- CD4 T cell subsets in the liver of CCl4 + IgG-treated mice. Our analysis revealed that a significantly higher frequency of α4β7+ CD4 T cells expressed the T cell activation marker CD44, acute T cell activation marker CD69, the Th1 transcriptional factor driving IFN production Tbet and the cell proliferation marker Ki67 compared to the α4β7- CD4 T cells (Figure 5A–D). These data suggest that α4β7+ CD4 T cells comprise effector T cells with capacity for proliferation and cytokine production.

3.6. MAdCAM-1 Blockade Attenuates CCl4-Induced Hepatic Injury and Fibrosis

Given the inhibitory effect of MAdCAM-1 blockade on the CCl4-induced recruitment of immune cells to the liver, we examined whether MAdCAM-1 blockade reduced CCl4-induced liver injury. Histological analysis of H&E-stained liver tissue sections revealed a notable decrease in hepatic inflammation and injury in CCl4 + MAdCAM-1-mAb-treated mice relative to the CCl4 + IgG-treated mice (Figure 6A). Improvement in hepatic injury in CCl4 + MAdCAM-1-mAb-treated mice was confirmed by decreased serum ALT levels (Figure 6B). Treatment with MAdCAM-1-mAb significantly decreased the transcript levels of Tgfb1 and IL6, but not Tnfa (Figure 6C–E). Treatment with MAdCAM-1 mAb decreased hepatic fibrosis, indicated by marked decrease in the deposition of hepatic collagen in the Sirius Red-stained liver tissue sections (Figure 6F–G). Transcript levels of key molecules associated with fibrogenesis of the liver, Acta2, Timp1, Col1a1 and Col1a2 were significantly lower in the MAdCAM-1-mAb-treated mice relative to IgG controls (Figure 6H–K). These data demonstrate that MAdCAM-1 blockade attenuates CCl4-induced hepatic inflammation and fibrosis.

3.7. Increased Infiltration of α4β7+ T Cells in the Livers of NASH- and ASH-Associated Cirrhosis Patients

To determine whether α4β7+ T cells are also involved in hepatic inflammation and fibrosis in people with end-stage liver disease, we probed liver tissue sections obtained from 10 people with NASH-associated cirrhosis and 10 people with ASH-associated cirrhosis for the presence of α4β7+ T cells using confocal laser scanning microscopy. Liver tissue from tumor-adjacent parenchyma was used as control (n = 10 people). Staining of liver tissue sections with α4β7 and CD3 antibodies revealed higher infiltration of α4β7 and CD3 double-positive T cells and the formation of large inflammatory aggregates of α4β7+ T cells in the livers of people with NASH- and ASH-associated cirrhosis (Figure 6L,M). Interestingly, higher inflammatory aggregates of α4β7+CD3+ T cells were observed in the fibrotic septa of livers from people with NASH-associated cirrhosis compared to those with ASH-associated cirrhosis (Figure 6L,M). Collectively, these findings suggest the involvement of α4β7+ T cells in people with end-stage liver disease.

4. Discussion

Immune cells recruited to the injured liver are the primary instigators of sustained chronic inflammation and resulting fibrosis [13,14,15,16], yet we lack complete understanding of the molecular mechanisms involved in immune cell recruitment and the role of various immune cell subsets in promoting hepatic fibrosis. In this study, we report the involvement of the α4β7/MAdCAM-1 axis in the recruitment of α4β7+ T cells to the fibrotic liver, highlighting their pivotal role in promoting hepatic fibrosis progression. Our clinical findings revealing the presence of inflammatory aggregates of α4β7+ T cells in the livers of individuals with cirrhosis strongly indicate their involvement in human liver injury. Furthermore, our data indicating larger inflammatory aggregates of α4β7+ T cells in NASH-associated cirrhosis compared to ASH-associated cirrhosis suggest a potential heightened role of these cells in contributing to liver injury in NASH-associated cirrhosis. These findings, combined with previous reports on the α4β7/MAdCAM-1 axis in regulating T cell recruitment in various CLDs, underscore the critical contribution of α4β7+ T cells to hepatic inflammation and fibrosis progression in CLD [8,10,17,18].
Our findings from an established mouse model of liver fibrosis recapitulated our clinical findings by demonstrating that α4β7+ T cells are actively recruited to the fibrotic liver and α4β7+ T cells contribute to driving hepatic fibrosis progression in this model. Our results align with previous studies that reported protective effects against diet-induced non-alcoholic steatohepatitis (NASH) in mice lacking whole-body expression of MAdCAM-1 or treated with α4β7 or MAdCAM-1 mAbs [6,19]. Additionally, whole-body knockout mice lacking MAdCAM-1 or β7 have been shown to be protected from concavalin A-induced hepatitis [20]. In contrast, whole-body β7 knockout mice have been shown to exhibit enhanced susceptibility to diet-induced NASH [19]. These discrepancies may be attributed to inherent defects in the development of gut-associated lymphoid tissue in β7 knockout mice, making data interpretation more complex [21,22]. These conflicting findings also emphasize the limitations of relying solely on whole-body knockout mouse models in functional research, as non-specific phenotypes can often be overlooked. It should be noted that the α4β7 mAb we used for our studies is a highly specific antibody that specifically binds to a conformational epitope accessible only in the α4β7 heterodimer [23,24,25]. The specificity of this antibody has been extensively evaluated across various experimental and clinical contexts, and the humanized version of the α4β7 monoclonal antibody has been recognized as an effective treatment for inflammatory bowel disease [24,25,26,27]. Furthermore, we demonstrate that treatment with MAdCAM-1 mAb also protects mice from CCl4-induced liver fibrosis by blocking α4β7+ T cell recruitment to the liver. These findings not only underscore the significance of the α4β7/MAdCAM-1 axis in modulating T cell recruitment to the liver but also highlight the critical role played by α4β7+ T cells in promoting hepatic fibrosis.
Notably, α4β7 and MAdCAM-1 blockade also reduced monocyte recruitment to the fibrotic liver. While this could be a secondary effect of reduced hepatic inflammation in the mAb-treated mice, a more profound reduction in monocyte recruitment in the MAdCAM-1 mAb-treated mice suggest that MAdCAM-1 mAb may have a direct effect of monocyte recruitment to the liver. It is known that MAdCAM-1 not only binds to α4β7 through its immunoglobin superfamily (IgSF) domain, but it can also bind to L-selectin through its mucin-like region [28,29,30]. Since L-selectin is highly expressed on peripheral monocytes, it is possible that MAdCAM-1 mAb may have blocked MAdCAM-1/L–selectin-mediated recruitment of monocytes to the liver. However, further in-depth studies are needed to determine the contribution of MAdCAM-1/L–selectin axis in monocyte recruitment to the fibrotic liver.
Our findings that α4β7/MAdCAM-1 axis regulate CD4 T cell recruitment to the fibrotic liver adds to our previously reported role of this axis in regulating CD4 T cell recruitment to the NASH liver [6]. Consistent with earlier reports, our results confirmed that a significant proportion of α4β7+ CD4 T cells are effector T cells [31,32]. Effector CD4 T cells are known to contribute to hepatic inflammation and fibrosis through the secretion of proinflammatory and profibrotic cytokines. Their activation leads to the stimulation of both innate and adaptive immune cells, thereby perpetuating the inflammatory and fibrotic processes within the liver [33,34,35]. In contrast, regulatory T cells expressing the transcription factor Foxp3 have been recognized for their ability to suppress immune responses and promote tissue repair [36]. In our study, we found that the α4β7/MAdCAM-1 axis specifically targets the recruitment of α4β7+ effector CD4 T cells to the fibrotic liver, while sparing the migration of Foxp3+ Tregs. This selectivity in blocking effector CD4 T cell recruitment while preserving the presence of immunomodulatory Tregs may have played a crucial role in the effectiveness of α4β7 and MAdCAM-1 mAbs in suppressing hepatic fibrosis.
The involvement of CD8 T cells in tissue injury and fibrosis is of particular importance as antigen-specific or bystander activation of CD8 T cells can promote tissue injury by cytolysis of damaged cells or exacerbate inflammation by producing proinflammatory cytokines including TNF-α, INF-γ, IL-13, and IL-4 [37,38,39,40,41], which promote recruitment of proinflammatory immune cells to the injured tissue. Our data provide evidence supporting the role of the α4β7/MAdCAM-1 axis in regulating the recruitment of CD8 T cells to the liver. Specifically, we demonstrate that a significant subset of CD8 T cells in the fibrotic liver express α4β7. We demonstrate that blocking antibodies against α4β7 and MAdCAM-1 that reduce recruitment of α4β7+ CD8 T cells to the liver improves CCL4-induced hepatic fibrosis. These findings expand upon the previously reported roles of the α4β7/MAdCAM-1 axis in regulating CD4 T cell homing to the liver in NASH [6] and PSC [18]. Furthermore, our findings suggest that α4β7-expressing CD8 T cells play a prominent role in promoting hepatic fibrosis in CLD. However, considering previous reports that CD8 T cells play a protective role during hepatic injury resolution by eliminating activated HSCs [42], and their dysfunction at the advanced stages of CLD exacerbate disease progression [43,44], further comprehensive investigations are needed to understand the specific functions of different CD8 T cell subsets in promoting and regressing hepatic fibrosis in CLD.
In conclusion, our findings shed light on the crucial role of the α4β7/MAdCAM-1 axis in regulating hepatic fibrosis and highlight the potential therapeutic strategy of utilizing mAbs targeting integrin α4β7 or MAdCAM-1 to treat inflammation and fibrosis in CLD.

Author Contributions

Conceptualization: R.R.; Methodology: R.R., S.S.I., B.G., R.P.R., D.R., P.B.P., S.C., A.C., S.S., S.L. and A.D.S.; Investigation: B.G., S.S.I., R.P.R., D.R. and P.B.P.; Visualization: R.R., B.G., R.P.R., D.R., S.S.I., S.L. and P.B.P.; Funding Acquisition: R.R.; Project Administration: R.R., B.G. and R.P.R.; Supervision: R.R.; Writing—Original Draft: B.G. and R.R.; Writing—Review and Editing: R.R., S.S.I., A.D.S. and S.P.M. All authors have read and agreed to the published version of the manuscript.

Funding

The research reported in this publication was supported by the National Institute of Diabetes and Digestive and Kidney Diseases of the National Institutes of Health under award number K01DK110264 and R01DK124351 to RR; R01DK62277, R01DK100287 and Endowed Chair for Experimental Pathology to SPM; and R56AI150409 and RF1AG06001 to SSI. This research project was also supported in part by the University of Pittsburgh Clinical Biospecimen Processing and Repository Core and Advanced Cell and Tissue imaging Centre of the Pittsburgh Liver Research Centre supported by NIH/NIDDK Digestive Disease Research Core Center grant P30DK120531 and the University of Pittsburgh Unified Flow Core through the resources provided.

Institutional Review Board Statement

Study was approved by the University of Pittsburgh Institutional Review Board (IRB) Office of Research protection and procedures were carried out in accordance with relevant guidelines and regulations (IRB approval number: STUDY20010114, study title: Non-Neoplastic Liver Diseases).

Informed Consent Statement

Informed consent was waived by the University of Pittsburgh IRB.

Data Availability Statement

All data generated or analyzed are included in this published article.

Acknowledgments

This research project was also supported in part by the University of Pittsburgh Clinical Biospecimen Processing and Repository Core and Advanced Cell and Tissue imaging Centre of the Pittsburgh Liver Research Centre and the University of Pittsburgh Unified Flow Core through the resources provided.

Conflicts of Interest

All authors declare no conflicting interests.

References

  1. Koyama, Y.; Brenner, D.A. Liver inflammation and fibrosis. J. Clin. Investig. 2017, 127, 55–64. [Google Scholar] [CrossRef] [PubMed]
  2. Lackner, C.; Tiniakos, D. Fibrosis and alcohol-related liver disease. J. Hepatol. 2019, 70, 294–304. [Google Scholar] [CrossRef] [PubMed]
  3. Alkhouri, N.; McCullough, A.J. Noninvasive Diagnosis of NASH and Liver Fibrosis Within the Spectrum of NAFLD. Gastroenterol. Hepatol. (N. Y.) 2012, 8, 661–668. [Google Scholar] [PubMed]
  4. Pinzani, M.; Rombouts, K.; Colagrande, S. Fibrosis in chronic liver diseases: Diagnosis and management. J. Hepatol. 2005, 42, S22–S36. [Google Scholar] [CrossRef]
  5. Wen, Y.; Lambrecht, J.; Ju, C.; Tacke, F. Hepatic macrophages in liver homeostasis and diseases-diversity, plasticity and therapeutic opportunities. Cell. Mol. Immunol. 2021, 18, 45–56. [Google Scholar] [CrossRef] [PubMed]
  6. Rai, R.P.; Liu, Y.; Iyer, S.S.; Liu, S.; Gupta, B.; Desai, C.; Kumar, P.; Smith, T.; Singhi, A.D.; Nusrat, A.; et al. Blocking integrin α4β7-mediated CD4 T cell recruitment to the intestine and liver protects mice from western diet-induced non-alcoholic steatohepatitis. J. Hepatol. 2020, 73, 1013–1022. [Google Scholar] [CrossRef] [PubMed]
  7. Ala, A.; Brown, D.; Khan, K.; Standish, R.; Odin, J.A.; Fiel, M.I.; Schiano, T.D.; Hillan, K.J.; Rahman, S.A.; Hodgson, H.J.F.; et al. Mucosal Addressin Cell Adhesion Molecule (MAdCAM-1) Expression Is Upregulated in the Cirrhotic Liver and Immunolocalises to the Peribiliary Plexus and Lymphoid Aggregates. Dig. Dis. Sci. 2013, 58, 2528–2541. [Google Scholar] [CrossRef]
  8. Grant, A.J.; Lalor, P.F.; Hübscher, S.G.; Briskin, M.; Adams, D.H. MAdCAM-1 expressed in chronic inflammatory liver disease supports mucosal lymphocyte adhesion to hepatic endothelium (MAdCAM-1 in chronic inflammatory liver disease). J. Hepatol. 2001, 33, 1065–1072. [Google Scholar] [CrossRef] [PubMed]
  9. Borchers, A.T.; Shimoda, S.; Bowlus, C.; Keen, C.L.; Gershwin, M.E. Lymphocyte recruitment and homing to the liver in primary biliary cirrhosis and primary sclerosing cholangitis. Semin. Immunopathol. 2009, 31, 309–322. [Google Scholar] [CrossRef]
  10. Graham, J.J.; Mukherjee, S.; Yuksel, M.; Mateos, R.S.; Si, T.; Huang, Z.; Huang, X.; Abu Arqoub, H.; Patel, V.; McPhail, M.J.; et al. Aberrant hepatic trafficking of gut-derived T cells is not specific to primary sclerosing cholangitis. J. Hepatol. 2022, 75, 518–530. [Google Scholar] [CrossRef]
  11. Rahman, K.; Desai, C.; Iyer, S.S.; Thorn, N.E.; Kumar, P.; Liu, Y.; Smith, T.; Neish, A.S.; Li, H.; Tan, S.; et al. Loss of Junctional Adhesion Molecule a Promotes Severe Steatohepatitis in Mice on a Diet High in Saturated Fat, Fructose, and Cholesterol. Gastroenterology 2016, 151, 733–746.e12. [Google Scholar] [CrossRef] [PubMed]
  12. Schneider, C.A.; Rasband, W.S.; Eliceiri, K.W. NIH Image to ImageJ: 25 Years of image analysis. Nat. Methods 2012, 9, 671–675. [Google Scholar] [CrossRef]
  13. Karlmark, K.R.; E Wasmuth, H.; Trautwein, C.; Tacke, F. Chemokine-directed immune cell infiltration in acute and chronic liver disease. Expert Rev. Gastroenterol. Hepatol. 2008, 2, 233–242. [Google Scholar] [CrossRef] [PubMed]
  14. Karlmark, K.R.; Weiskirchen, R.; Zimmermann, H.W.; Gassler, N.; Ginhoux, F.; Weber, C.; Merad, M.; Luedde, T.; Trautwein, C.; Tacke, F. Hepatic recruitment of the inflammatory Gr1+monocyte subset upon liver injury promotes hepatic fibrosis. J. Hepatol. 2009, 50, 261–274. [Google Scholar] [CrossRef] [PubMed]
  15. Pellicoro, A.; Ramachandran, P.; Iredale, J.P.; Fallowfield, J.A. Liver fibrosis and repair: Immune regulation of wound healing in a solid organ. Nat. Rev. Immunol. 2014, 14, 181–194. [Google Scholar] [CrossRef]
  16. Kisseleva, T.; Brenner, D. Molecular and cellular mechanisms of liver fibrosis and its regression. Nat. Rev. Gastroenterol. Hepatol. 2021, 18, 151–166. [Google Scholar] [CrossRef]
  17. Hillan, K.J.; Hagler, K.E.; MacSween, R.N.M.; Ryan, A.M.; Renz, M.E.; Chiu, H.H.; Ferrier, R.K.; Bird, G.L.; Dhillon, A.P.; Ferrell, L.D.; et al. Expression of the mucosal vascular addressin, MAdCAM-1, in inflammatory liver disease. Liver Int. 1999, 19, 509–518. [Google Scholar] [CrossRef]
  18. de Krijger, M.; Wildenberg, M.E.; de Jonge, W.J.; Ponsioen, C.Y. Return to sender: Lymphocyte trafficking mechanisms as contributors to primary sclerosing cholangitis. J. Hepatol. 2019, 71, 603–615. [Google Scholar] [CrossRef]
  19. Drescher, H.K.; Schippers, A.; Clahsen, T.; Sahin, H.; Noels, H.; Hornef, M.; Wagner, N.; Trautwein, C.; Streetz, K.L.; Kroy, D.C. β7-Integrin and MAdCAM-1 play opposing roles during the development of non-alcoholic steatohepatitis. J. Hepatol. 2017, 66, 1251–1264. [Google Scholar] [CrossRef]
  20. Schippers, A.; Hübel, J.; Heymann, F.; Clahsen, T.; Eswaran, S.; Schlepütz, S.; Püllen, R.; Gaßler, N.; Tenbrock, K.; Tacke, F.; et al. MAdCAM-1/α4β7 Integrin-Mediated Lymphocyte/Endothelium Interactions Exacerbate Acute Immune-Mediated Hepatitis in Mice. Cell. Mol. Gastroenterol. Hepatol. 2021, 11, 1227–1250.e1. [Google Scholar] [CrossRef]
  21. Wagner, N.; Löhler, J.; Kunkel, E.J.; Ley, K.; Leung, E.; Krissansen, G.; Rajewsky, K.; Muller, W. Critical role for β7 integrins in formation of the gut-associated lymphoid tissue. Nature 1996, 382, 366–370. [Google Scholar] [CrossRef]
  22. Sun, H.; Lagarrigue, F.; Gingras, A.R.; Fan, Z.; Ley, K.; Ginsberg, M.H. Transmission of integrin β7 transmembrane domain topology enables gut lymphoid tissue development. J. Cell Biol. 2018, 217, 1453–1465. [Google Scholar] [CrossRef]
  23. Tidswell, M.; Pachynski, R.; Wu, S.W.; Qiu, S.Q.; Dunham, E.; Cochran, N.; Briskin, M.J.; Kilshaw, P.J.; Lazarovits, A.I.; Andrew, D.P.; et al. Structure-function analysis of the integrin beta 7 subunit: Identification of domains involved in adhesion to MAdCAM-1. J. Immunol. 1997, 159, 1497–1505. [Google Scholar] [CrossRef]
  24. Soler, D.; Chapman, T.; Yang, L.-L.; Wyant, T.; Egan, R.; Fedyk, E.R. The Binding Specificity and Selective Antagonism of Vedolizumab, an Anti-α4β7 Integrin Therapeutic Antibody in Development for Inflammatory Bowel Diseases. J. Pharmacol. Exp. Ther. 2009, 330, 864–875. [Google Scholar] [CrossRef]
  25. Lazarovits, A.I.; A Moscicki, R.; Kurnick, J.T.; Camerini, D.; Bhan, A.K.; Baird, L.G.; Erikson, M.; Colvin, R.B. Lymphocyte activation antigens. I. A monoclonal antibody, anti-Act I, defines a new late lymphocyte activation antigen. J. Immunol. 1984, 133, 1857–1862. [Google Scholar] [CrossRef]
  26. Ley, K.; Rivera-Nieves, J.; Sandborn, W.J.; Shattil, S. Integrin-based therapeutics: Biological basis, clinical use and new drugs. Nat. Rev. Drug Discov. 2016, 15, 173–183. [Google Scholar] [CrossRef]
  27. Arijs, I.; De Hertogh, G.; Lemmens, B.; Van Lommel, L.; De Bruyn, M.; Vanhove, W.; Cleynen, I.; Machiels, K.; Ferrante, M.; Schuit, F.; et al. Effect of vedolizumab (anti-α4β7-integrin) therapy on histological healing and mucosal gene expression in patients with UC. Gut 2018, 67, 43–52. [Google Scholar] [CrossRef]
  28. Bargatze, R.F.; Jutila, M.A.; Butcher, E.C. Distinct roles of L-selectin and integrins alpha 4 beta 7 and LFA-1 in lymphocyte homing to Peyer’s patch-HEV in situ: The multistep model confirmed and refined. Immunity 1995, 3, 99–108. [Google Scholar] [CrossRef]
  29. Briskin, M.J.; McEvoy, L.M.; Butcher, E.C. MAdCAM-1 has homology to immunoglobulin and mucin-like adhesion receptors and to IgA1. Nature 1993, 363, 461–464. [Google Scholar] [CrossRef]
  30. Berg, E.L.; McEvoy, L.M.; Berlin, C.; Bargatze, R.F.; Butcher, E.C. L-selectin-mediated lymphocyte rolling on MAdCAM-1. Nature 1993, 366, 695–698. [Google Scholar] [CrossRef]
  31. Wittner, M.; Schlicker, V.; Libera, J.; Bockmann, J.-H.; Horvatits, T.; Seiz, O.; Kummer, S.; Manthey, C.F.; Hüfner, A.; Kantowski, M.; et al. Comparison of the integrin α4β7 expression pattern of memory T cell subsets in HIV infection and ulcerative colitis. PLOS ONE 2019, 14, e0220008. [Google Scholar] [CrossRef]
  32. Kurmaeva, E.; Lord, J.D.; Zhang, S.; Bao, J.R.; Kevil, C.G.; Grisham, M.B.; Ostanin, D.V. T cell-associated α4β7 but not α4β1 integrin is required for the induction and perpetuation of chronic colitis. Mucosal Immunol. 2014, 7, 1354–1365. [Google Scholar] [CrossRef] [PubMed]
  33. Ramadori, P.; Kam, S.; Heikenwalder, M. T cells: Friends and foes in NASH pathogenesis and hepatocarcinogenesis. J. Hepatol. 2022, 75, 1038–1049. [Google Scholar] [CrossRef] [PubMed]
  34. Chang, J.T.; Wherry, E.J.; Goldrath, A.W. Molecular regulation of effector and memory T cell differentiation. Nat. Immunol. 2014, 15, 1104–1115. [Google Scholar] [CrossRef]
  35. Lee, H.-G.; Cho, M.-J.; Choi, J.-M. Bystander CD4+ T cells: Crossroads between innate and adaptive immunity. Exp. Mol. Med. 2020, 52, 1255–1263. [Google Scholar] [CrossRef]
  36. Campbell, C.; Rudensky, A. Roles of Regulatory T Cells in Tissue Pathophysiology and Metabolism. Cell Metab. 2020, 31, 18–25. [Google Scholar] [CrossRef]
  37. Neurath, M.F. Cytokines in inflammatory bowel disease. Nat. Rev. Immunol. 2014, 14, 329–342. [Google Scholar] [CrossRef]
  38. Kopf, M.; Bachmann, M.F.; Marsland, B.J. Averting inflammation by targeting the cytokine environment. Nat. Rev. Drug Discov. 2010, 9, 703–718. [Google Scholar] [CrossRef] [PubMed]
  39. Fuschiotti, P.; Larregina, A.T.; Ho, J.; Feghali-Bostwick, C.; Medsger, T.A., Jr. Interleukin-13-producing CD8+ T cells mediate dermal fibrosis in patients with systemic sclerosis. Arthritis Rheum. 2013, 65, 236–246. [Google Scholar] [CrossRef]
  40. Fuschiotti, P. Current perspectives on the role of CD8+ T cells in systemic sclerosis. Immunol. Lett. 2018, 195, 55–60. [Google Scholar] [CrossRef]
  41. Nakamura, K.; Amakawa, R.; Takebayashi, M.; Son, Y.; Miyaji, M.; Tajima, K.; Nakai, K.; Ito, T.; Matsumoto, N.; Zen, K.; et al. IL-4-producing CD8+ T cells may be an immunological hallmark of chronic GVHD. Bone Marrow Transplant. 2005, 36, 639–647. [Google Scholar] [CrossRef] [PubMed]
  42. Koda, Y.; Teratani, T.; Chu, P.-S.; Hagihara, Y.; Mikami, Y.; Harada, Y.; Tsujikawa, H.; Miyamoto, K.; Suzuki, T.; Taniki, N.; et al. CD8+ tissue-resident memory T cells promote liver fibrosis resolution by inducing apoptosis of hepatic stellate cells. Nat. Commun. 2021, 12, 1–15. [Google Scholar] [CrossRef] [PubMed]
  43. Ma, J.; Zheng, B.; Goswami, S.; Meng, L.; Zhang, D.; Cao, C.; Li, T.; Zhu, F.; Ma, L.; Zhang, Z.; et al. PD1Hi CD8+ T cells correlate with exhausted signature and poor clinical outcome in hepatocellular carcinoma. J. Immunother. Cancer 2019, 7, 1–15. [Google Scholar] [CrossRef] [PubMed]
  44. Collier, J.L.; Weiss, S.A.; Pauken, K.E.; Sen, D.R.; Sharpe, A.H. Not-so-opposite ends of the spectrum: CD8+ T cell dysfunction across chronic infection, cancer and autoimmunity. Nat. Immunol. 2021, 22, 809–819. [Google Scholar] [CrossRef] [PubMed]
Figure 1. Integrin α4β7 blockade attenuates CCl4-induced hepatic inflammation: (A) Schematic of study design. Liver fibrosis was induced by oral administration of CCl4 for six weeks. Mice treated with CCl4 for six weeks received α4β7 mAb or IgG isotype antibody for four weeks starting at week three (n = 8 mice per group). Mice administered the vehicle, olive oil, served as controls (n = 5 mice per group). (B) Representative photomicrographs of hematoxylin and eosin (H&E)-stained liver tissue sections (n = 5–8 mice per group). Scale bar 100 µm. (C,D) Serum AST (p < 0.0001) and ALT (p < 0.0001) levels (n = 5–8 mice per group). (E,F) Expression of key molecules associated with hepatic inflammation, Tnfa (p < 0.03) and IL6 (p < 0.002), in the liver (n = 5 mice per group). (G) Representative confocal images of MAdCAM-1 (red) immunofluorescence in the liver. Nuclei are stained with DAPI (blue). Scale bar 200 µm. (HK) Expression of Madcam-1 (p < 0.0003) and integrins α4, Itga4 (p < 0.0003), β7, Itgb7 (p < 0.005) and β1, Itgb1 (p < 0.04) in the liver (n = 5 mice per group). Data are presented as mean ± SEM. Asterisks indicate significant differences (p < 0.05) between oil and IgG isotype controls. Hashtags indicate significant differences (p < 0.05) between IgG and α4β7 mAb treatments.
Cells 13 00756 g001
Figure 2. Integrin α4β7 blockade attenuates CCl4-induced hepatic fibrosis progression: (A) Representative photomicrographs of Sirius Red-stained liver tissue sections. Liver fibrosis was induced by oral administration of CCl4 for six weeks. Mice treated with CCl4 for six weeks received α4β7 mAb or IgG isotype antibody for four weeks starting at week three (n = 8 mice per group). Mice administered the vehicle, olive oil, served as controls (n = 5 mice per group). Scale bar 100 µm. (B) Quantitative analysis of Sirius Red-stained liver tissue sections (p < 0.0001, n = 5–8 mice per group). (CG) Expression of fibrosis markers Col1a1 (p < 0.003), Col1a2 (p < 0.001), Acta2 (p < 0.02), Tgfb1 (p < 0.0002) and Timp1 (p < 0.03) in the liver (n = 5–8 mice per group). (H) Representative confocal images of αSMA (green) and DAPI (blue) immunofluorescence in the liver (n = 5 mice per group). Scale bar 200 µm. Data are presented as mean ± SEM. Asterisks indicate significant differences (p < 0.05) between oil and IgG isotype controls. Hashtags indicate significant differences (p < 0.05) between IgG and α4β7 mAb treatments.
Cells 13 00756 g002
Figure 3. Integrin α4β7 mAb treatment reduces CCl4-induced infiltration of α4β7+ T cells in the liver (A) Gating strategy used to identify intrahepatic lymphoid and myeloid cell subsets. (B,C) Percentage and total number of CD4 (percentage, p < 0.001; total number p < 0.001) and CD8 (percentage, p < 0.004; total number p < 0.001) T cells in the liver. Mice treated with CCl4 for six weeks received α4β7 mAb or IgG isotype for four weeks starting at week three (n = 8 mice per group). Mice administered the vehicle, olive oil, served as controls (n = 5 mice per group). (DG) Representative flow plots show percent of α4β7+ CD4 and CD8 T cells, and bar graphs show percentage and total number of α4β7+ CD4 (percentage, p < 0.0002; total number p < 0.0001) and CD8 (percentage, p < 0.002; total number p < 0.0001) T cells in the liver (n = 5–8 mice per group). (HJ) Percentage and total number of neutrophils (CD3-NK1.1-CD11b+Ly6G+ cells; percentage, p < 0.09; total number p < 0.00007), monocytes (CD3- NK1.1-CD11b+Ly6G-Ly6C+ cells; percentage, p < 0.002; total number p < 0.12) and macrophages (CD3- NK1.1-CD11b+Ly6G-F4/80+ cells; percentage, p < 0.01; total number p < 0.04) in the liver (n = 5–8 mice per group). (K,L) Representative confocal images of (K) α4β7 (red) and CD4 (green) and (L) α4β7 (red) and CD8 (green) immunofluorescence in the liver. Nuclei are stained with DAPI (blue, n = 5 mice per group). Scale bar: 400 µm. Data are presented as mean ± SEM. Asterisks indicate significant differences (p < 0.05) between oil and CCl4 + IgG isotype controls. Hashtags indicate significant differences (p < 0.05) between IgG and α4β7 mAb treatments.
Cells 13 00756 g003
Figure 4. MAdCAM-1 blockade reduces CCl4-induced infiltration of α4β7+ T cells in the liver: (A) Schematic of study design. Mice treated with CCl4 for six weeks received MAdCAM-1 mAb or IgG isotype antibody for four weeks starting at week three (n = 8 mice per group). (BE) Representative flow plots show percent of α4β7+ CD4 and CD8 T cells, and bar graphs show percentage and total number of α4β7+ CD4 (percentage, p < 0.009; total number p < 0.002) and CD8 (percentage, p < 0.008; total number p < 0.002) T cells in the liver (n = 8 mice per group). (FH) Percentage and total number of CD4 (percentage, p < 0.6; total number p < 0.001) and CD8 (percentage, p < 0.4; total number p < 0.2) T cells, and Foxp3+ CD4 T cells (percentage, p < 0.9; total number p < 0.01) in the liver (n = 8 mice per group). (IK) Percentage and total number of neutrophils (percentage, p < 0.2; total number p < 0.2), monocytes (percentage, p < 0.1; total number p < 0.001) and macrophages (percentage, p < 0.01; total number p < 0.001) in the liver. (LN) Expression of integrins α4, Itga4 (p < 0.004) and β7, Itga7 (p < 0.02) and Madcam-1 (p < 0.0001) in the liver (n = 5 mice per group). Data are presented as mean ± SEM. Asterisks indicate significant differences (p < 0.05) between IgG and MAdCAM-1 mAb treatments.
Cells 13 00756 g004
Figure 5. α4β7+ CD4 T cells are enriched for markers of activation and proliferation, demonstrating an effector phenotype: (A) Representative histograms show median fluorescence intensity of stated markers in the liver of mice treated with CCl4 for six weeks. Gated on CD45+CD3+CD4+ cells. Mice were treated with IgG during the final four weeks (n = 5 mice per group). Bar graphs show percentage of α4β7+ and α4β7- CD4 T cells expressing (B) T cell activation markers CD44 and CD69 (p < 0.008), (C) Th1 cell marker Tbet (p < 0.008) and (D) proliferation marker Ki67 (p < 0.0006) in the liver (n = 5 mice per group). Data are presented as mean ± SEM. Asterisks indicate significant differences (p < 0.05) between α4β7+ and α4β7- CD4 T cells.
Cells 13 00756 g005
Figure 6. MAdCAM-1 blockade attenuates hepatic inflammation and fibrosis progression: (A) Representative photomicrographs of hematoxylin and eosin (H&E)-stained liver tissue sections. Mice treated with CCl4 for six weeks received MAdCAM-1 mAb (n = 8 mice per group) or IgG isotype antibody (n = 5 mice per group) for four weeks starting at week three. Scale bar: 100 µm. (B) Serum ALT level (p < 0.02, n = 5–8 mice per group). (CE) Expression of key molecules associated with hepatic inflammation: Tgfb (p < 0.0008), Tnfa (p < 0.2) and IL6 (p < 0.02) (n = 5 mice per group). (F,G) Representative photomicrographs of Sirius Red-stained liver tissue sections and quantitative analysis of Sirius Red-stained liver tissue sections (p < 0.0001, n = 5 mice per group). Scale bar: 100 µm. (HK) Expression of key fibrosis markers, Acta2 (p < 0.002), Timp1 (p < 0.04), Col1a1 (p < 0.0008) and Col1a2 (p < 0.0001), in the liver (n = 5 mice per group). Data are presented as mean ± SEM. Hashtags indicate significant differences (p < 0.05) between IgG and MAdCAM-1 mAb treatments. (L) Representative photomicrographs of Sirius Red-stained liver tissue sections from disease controls and people with nonalcoholic steatohepatitis (NASH)- and alcoholic steatohepatitis (ASH)-associated cirrhosis (n = 10 subjects per group). Scale bar: 100 µm. (M) Representative confocal images of CD3 (red), α4β7 (green) and DAPI (blue) immunofluorescence in the liver tissue sections. Scale bar: 200 µm. Insets show zoomed-in view of the region in white dotted box. White arrowheads, CD3 T cells. Yellow arrowheads, α4β7+ CD3 T cells (n = 10 subjects per group).
Cells 13 00756 g006
Disclaimer/Publisher’s Note: The statements, opinions and data contained in all publications are solely those of the individual author(s) and contributor(s) and not of MDPI and/or the editor(s). MDPI and/or the editor(s) disclaim responsibility for any injury to people or property resulting from any ideas, methods, instructions or products referred to in the content.

