Article

Impact of a High-Fat Diet on the Gut Microbiome: A Comprehensive Study of Microbial and Metabolite Shifts During Obesity

Department of Pharmaceutical Sciences, College of Pharmacy, The University of Tennessee Health Science Center, 881 Madison Avenue, Memphis, TN 38163, USA
*
Author to whom correspondence should be addressed.
Cells 2025, 14(6), 463; https://doi.org/10.3390/cells14060463
Submission received: 20 February 2025 / Revised: 14 March 2025 / Accepted: 18 March 2025 / Published: 20 March 2025
(This article belongs to the Section Cellular Pathology)

Abstract

:
Over the last few decades, the prevalence of metabolic diseases such as obesity, diabetes, non-alcoholic fatty liver disease, hypertension, and hyperuricemia has surged, primarily due to high-fat diet (HFD). The pathologies of these metabolic diseases show disease-specific alterations in the composition and function of their gut microbiome. How HFD alters the microbiome and its metabolite to mediate adipose tissue (AT) inflammation and obesity is not well known. Thus, this study aimed to identify the changes in the gut microbiome and metabolomic signatures induced by an HFD to alter obesity. To explore the changes in the gut microbiota and metabolites, 16S rRNA gene amplicon sequencing and metabolomic analyses were performed after HFD and normal diet (ND) feeding. We noticed that, at taxonomic levels, the number of operational taxonomic units (OTUs), along with the Chao and Shannon indexes, significantly shifted in HFD-fed mice compared to those fed a ND. Similarly, at the phylum level, an increase in Firmicutes and a decrease in Bacteroidetes were noticed in HFD-fed mice. At the genus level, an increase in Lactobacillus and Ruminococcus was observed, while Allobaculum, Clostridium, and Akkermansia were markedly reduced in the HFD group. Many bacteria from the Ruminococcus genus impair bile acid metabolism and restrict weight loss. Firmicutes are efficient in breaking down complex carbohydrates into short-chain fatty acids (SCFAs) and other metabolites, whereas Bacteroidetes are involved in a more balanced or efficient energy extraction. Thus, an increase in Firmicutes over Bacteroidetes enhances the absorption of more calories from food, which may contribute to obesity. Taken together, the altered gut microbiota and metabolites trigger AT inflammation, which contributes to metabolic dysregulation and disease progression. Thus, this study highlights the potential of the gut microbiome in the development of therapeutic strategies for obesity and related metabolic disorders.

Graphical Abstract

1. Introduction

Over the past century, clinical microbiology has focused primarily on studying pathogens, but the significance of the commensal microorganisms that inhabit different body regions is becoming increasingly recognized [1,2]. The gut microbiome comprises living microorganisms often addressed as the “second human genome”. The gut microbiome comprises living microorganisms often addressed as the "second human genome" because of its potential role in navigating human health and influencing the body’s energy equilibrium [3]. Any dysregulation in energy intake and expenditure can be a major cause of obesity and related comorbidities [4]. Obesity is a growing health concern and requires attention due to its pandemic status in the modern world. Obesity is shaped by several factors, including genetics, eating habits, levels of physical activity, and gut microbiota, which all influence host metabolism as well as obesity [5,6].
Evidence has demonstrated that the transfer of gut microbiota from obese mice to germ-free mice on a standard diet induces obesity [7]. Nonetheless, the quantitative contribution of the gut microbiota to the host’s energy balance remains elusive. An imbalance in intestinal microbes can disrupt the function of gut barriers and gut-associated lymphoid tissues, allowing bacterial components to cross the intestinal wall to trigger the production of inflammatory cytokines and lead to insulin resistance and several metabolic diseases. Typically, the microbiome’s composition in obese individuals differs significantly from that in non-obese people, as shown in the genera Akkermansia, Faecalibacterium, Oscillibacter, and Alistipes, which are reduced in obese individuals [8,9]. These bacteria play crucial roles in maintaining gut health, gut barrier function, and producing anti-inflammatory mediators. On the contrary, HFDs often promote the growth of potentially harmful bacteria and fungi, including species from the genera Dorea and Candida, respectively [10]. The overgrowth of these bacteria can compromise the integrity of gut barrier function, allowing harmful bacterial components to trigger systemic inflammation and contribute to metabolic disorders such as insulin resistance and obesity [11].
Different lifestyles influence the microbiome by altering homeostasis and various diets, distinctly shaping the structure of gut microbiota [12]. HFDs can assist the growth of a mucus-degrading microbiome, whereas a fiber-rich diet reduces the prevalence of mucus-degrading microbes and promotes the growth of fiber-degrading SCFA-producing bacteria, thereby supporting mucosal barrier functions [13,14]. It has been shown that gut microbiota regulates energy and microorganisms’ ability to ferment dietary polysaccharides [15]. The production of SCFAs by the gut microbiota is heavily dependent on the composition and type of dietary fibers present in the diet [16]. Further, SCFAs have been shown to be involved in lipogenesis [17]. Additionally, SCFAs can attenuate the fasting-induced adipocyte factor (FIAF), which limits lipoprotein lipase (LPL), leading to triglyceride accumulation in host adipocytes [7]. Gut microbiota may also play a role in metabolic disturbances seen in obesity by initiating systemic inflammation [18] and LPS from gut microbiota and binding to toll-like receptors (TLRs), mainly TLR4 [19]. TLRs are well-known immune transmembrane proteins that can upregulate inflammatory cytokines and chemokines [20]. It has been shown that alterations in Akkermansia muciniphila induce the genetic expression of gut mucosal tight-junction proteins [21].
Recent advancements in next-generation sequencing (NGS) technologies have facilitated the detailed analysis of diverse gut microbiota, addressing the gap in microbiota studies traditionally reliant on culture-based methods. The Human Microbiome Project, led by the National Institutes of Health, identified over 70 bacterial phyla, with the majority belonging to Actinobacteria, Bacteroidetes, Firmicutes, and Proteobacteria [22]. Studies in the past suggested that imbalance in Bacteroidetes and Firmicutes in the intestinal tract of mice causes the ineffective absorption of carbohydrates and ultimately results in obesity [23]. Despite a lot of evidence, there are still gaps in our understanding of the role of gut microbiota in the development of obesity and how it mediates AT inflammation. In this study, we examined how a normal diet (ND) and an HFD modulate the gut microbiota populations which in turn alter AT inflammation and obesity. Using the 16S rRNA gene sequencing technique, we assessed the changes in gut microbiota in response to both HFD and ND in relation to the development and progression of obesity.

2. Materials and Methods

2.1. Animal and Diet Formulas

We purchased 6-to-8-week-old wild-type mice from Jackson Laboratories (Bar Harbor, ME, USA). The mice were housed under temperature-controlled conventional conditions for one week at the University of Tennessee Health Science Center (UTHSC)’s animal facility for acclimatization under a normal light/dark cycle before starting the experiment. This study was performed under a protocol (23-0451) from the UTHSC Institutional Animal Care and Use Committee (IACUC). The handling of mice and experimental methods were performed in such a way as to minimize pain and discomfort. Based on similar weights, mice were randomly divided into two experimental groups of 5 mice each (n = 5). One group of mice received a 10% Kcal normal diet (ND) or a 60% kcal high-fat diet (HFD) (Research Diets, New Brunswick, NJ, USA) for 8 weeks. The details of the diets are described below.
The HFD contained 26.2% proteins, 26.3% carbohydrates, and 34.9% fats (Research Diets, D12492). The ingredients were the following: casein, 80 mesh (200 g); L-Cystine (3 g); corn starch (0 g); maltodextrin 10 (125 g); sucrose (68.8 g); cellulose (Solka FLOC BW200, 50 g); soybean oil (25 g); lard (245 g); mineral mix, S10026 (10 g); dicalcium phosphate (13 g); calcium carbonate (5.5 g); potassium citrate 1 H2O (16.5 g); vitamin mix (V10001, 10 g); choline bitartrate (2 g); and FD&C Blue Dye #1 (0.05 g).
The ND contained 19.2% proteins, 67.3% carbohydrates, and 4.3% fats (Research Diets, D12450J). The ingredients were the following: casein, 30 mesh (200 g); L-Cystine (3 g); corn starch (506.2 g); maltodextrin 10 (125 g); sucrose (68.8 g); cellulose (BW200, 50 g); soybean oil (25 g); lard (20 g); mineral mix, S10026 (10 g); dicalcium phosphate (13 g); calcium carbonate (5.5 g); potassium citrate 1 H2O (16.5 g); vitamin mix (V10001, 10 g); choline bitartrate (2 g); FD&C Yellow Dye #5 (0.04 g); and FD&C Blue Dye #1 (0.01 g).

2.2. Fecal Sample Collection and DNA Isolation

Mice fecal samples were collected in 2 mL Eppendorf tubes after 8 weeks of ND and HFD feeding from all mice individually. During the collection of feces, all the animals were kept in a single cage to avoid intragroup cross-contamination. The sample was kept on ice and then stored at −80 °C until further analysis. A frozen aliquot (200 mg) of each fecal sample was used for extracting genomic DNA. According to the manufacturer’s instructions, DNA was extracted using a Qiagen QIAamp DNA Stool Mini Kit (Qiagen, Valencia, CA, USA, Cat. No.: 51604). DNA concentration and quality were measured using a nanodrop instrument (Thermo Scientific, Waltham, MA, USA). Extracted DNA was stored at −80 °C until further analysis. The DNA samples were sent to Novogene by our collaborator (Dr. Joseph F. Pierre, Ph.D., University of Wisconsin, Madison, WI, USA) for RNA library preparation and transcriptome sequencing on the HiSeq 2500 platform (Illumina, San Diego, CA, USA).

2.3. Bacterial Amplicon Sequencing and Statistical Analysis

We sent our sample to the Argonne National Laboratory (Chicago, IL, USA) for sequencing using an Illumina MiSeq DNA platform and a 150-nucleotide paired-end read length. The data were analyzed at UTHSC by the program Quantitative Insights into Microbial Ecology (QIIME), as described in [24]. The changes in bacterial structure were assessed through 16S rRNA V4–V5 amplicon sequencing, which enclosed a 12 bp barcode and Illumina 3′ adaptor sequences. The operational taxonomic units (OTUs) at 96% sequence similarities using open-reference OTU picking against the GreenGenes database (v13.8) were used for analysis. We further used all statistical analyses using the Calypso software (v8.84), as described in [25], with a minimum of 5000 sequences per sample. Some used reagents were also surveyed as sequencing controls, which failed to produce any amplification. The Shannon and Simpson indexes were used to analyze the alpha (α)-diversity changes in the microbiome. We also used beta (β)-diversity analysis via the Bray–Curtis method, as appearing as principal coordinate analysis (PCoA). Further, we used an unbiased analysis to generate a heatmap of the 100 most abundant microbial taxa, as calculated by Spearman’s rank correlation coefficients. The linear discriminant analysis (LDA)’s effect size (LEfSe) was calculated for significantly enriched taxa in both groups. We used Phylogenetic Investigation of Communities by Reconstruction of Unobserved States (PICRUSt) and predicted the metabolite pathways calculated by Spearman’s rank correlation coefficient, presented on a heatmap of the 100 most abundant pathways. Regression analyses of key operational taxonomic units (OTUs) with significant correlation were performed with multivariate analysis by linear models (MaAsLins) with 0.05 false discovery rate significance thresholding and 0.0001 minimum feature relative abundance filtering, similarly to [26]. In all experimental analyses, we used t-tests and ANOVA for all the comparisons in all bar charts at all levels of analysis.

3. Results

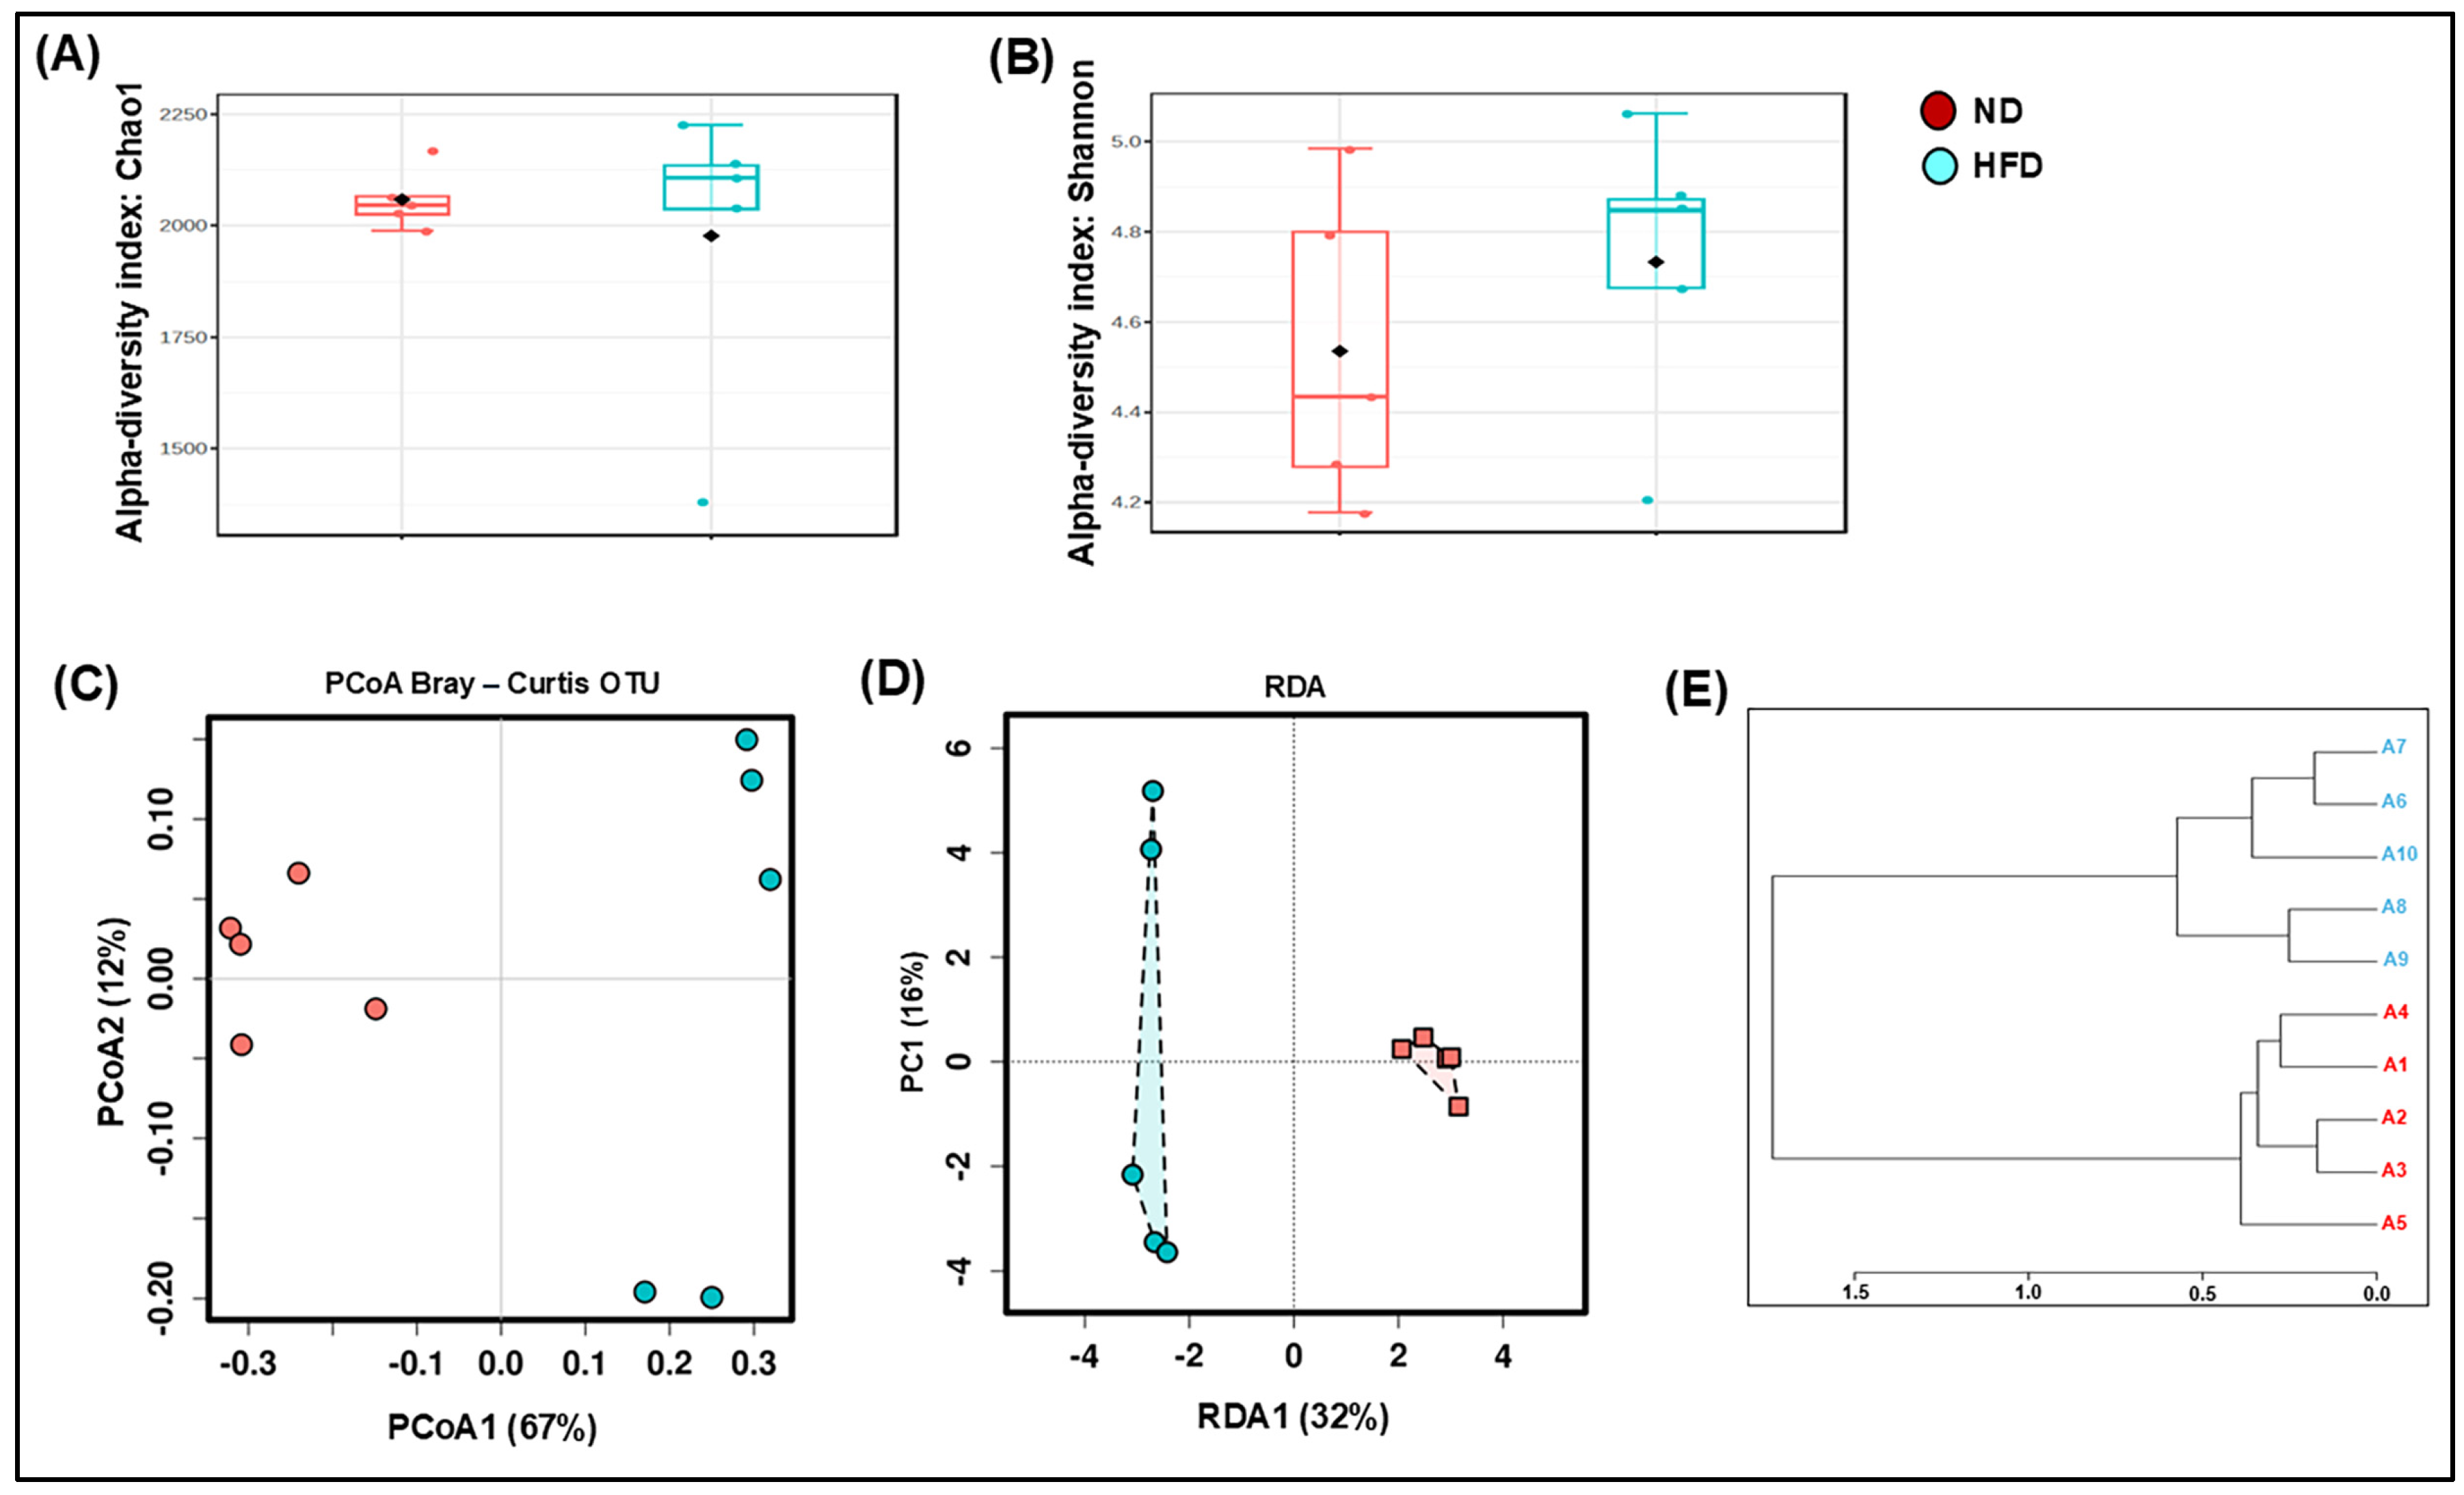
3.1. HFD Dysregulates the Composition and Decreases the Richness of the Gut Microbiota

A healthy microbiota is rich and varied, but factors like diet, stress, and pollutants can alter this imbalance. We investigated the effect of an HFD on the composition of the gut microbiota in mice by conducting 16S rDNA sequencing on mice fecal samples. We noticed that HFD consumption slightly decreased the bacterial richness compared to ND (Choa1; Figure 1A). However, the HFD-fed mice showed a slightly higher microbial diversity compared to those fed an ND, as indicated in the Shannon index (Figure 1B). Next, we analyzed β-diversity across two experimental groups, and principal component analysis (PCA) revealed a clear separation between the gut microbiota of mice fed an ND and those fed an HFD. On the principal coordinate analysis (PCoA) axis, both groups were situated in separate areas, indicating a change in the overall structure of the gut microbiota following HFD feeding. Bray–Curtis dissimilarity calculated the dissimilarity between two samples based on the counts of different species or features present in each sample. We noticed a significant difference in the gut microbiota composition according to the Bray–Curtis model (Figure 1C), as well as differences in the microbiome population in the samples in the same group in the case of the HFD and ND groups (Figure 1D). However, HFD feeding did not cause a notable change in the taxonomic diversity, which was analyzed by an unweighted paired-group method with an arithmetic mean (UPGMA) (Figure 1E). Taken together, our data indicated that the HFD modulated richness, α-, and β-diversity compared to the ND.

3.2. Modulation of Microbial Taxonomic Profiling in HFD-Fed Mice

The predominant components of the gut microbiota at the phylum level are Firmicutes, Bacteroidetes, Actinobacteria, and Proteobacteria. HFD consumption has been shown to induce obesity, which leads to the development of chronic disease, resulting from differential alteration in the microbiota, specifically a decrease in Bacteroidetes and an increase in Firmicutes [27]. Obesity studies have documented an increased abundance of Firmicutes concomitant with a reduction in Bacteroidetes [28]. In contrast to these findings, several studies reported no changes in this parameter and even documented a decreased Firmicutes/Bacteroidetes ratio in obese animals and humans [29,30,31]. Specifically, in most studies, individuals exhibiting lower bacterial diversity compared to lean individuals imply the presence of other compositional changes at the family, genus, or species level that may hold greater significance than the Firmicutes/Bacteroidetes ratio [32]. The previously reported discrepancies could be attributed to variations in sample processing and data analysis, such as differences in DNA extraction methods, the choice of primers for the amplified 16S rRNA region, sequencing techniques, and bioinformatic approaches, including the taxonomy database and assignment algorithms used [33,34]. In addition, the sample storage and DNA isolation method can influence the microbiota profile between studies [33,35]. The elevated Firmicutes/Bacteroidetes ratio did not correlate with the production of SCFAs observed in obese individuals, and Bacteroidetes predominantly produced acetate and propionate [36]. In the present study, the abundance of Firmicutes and Proteobacteria increased significantly, while the abundance of Bacteroidetes decreased in the HFD group compared to the ND group (Figure 2A). We also noticed a change in the diversity of major gut microbiota at the genus level (Figure 2B,C). At the genus level, abundance was measured with the total sum scaling (TSS) method, and it clearly showed a significant decrease in Allobaculum and Akkermansia in the HFD group compared to the ND group. Allobaculum, a genus of SCFA-producing bacteria, has been associated with improvements in obesity, such as reduced body weight and diminished low-grade inflammation, as well as better insulin resistance management. Additionally, a decrease in the Akkermansia population is inversely related to adiposity and fat accumulation in animals, increasing with intestinal mucin as the major precursor of carbon and nitrogen. Taken together, we noticed that HFD modulates Firmicutes and Proteobacteria while altering Allobaculum and Akkermansia in the HFD group, which might be involved in AT inflammation during obesity.

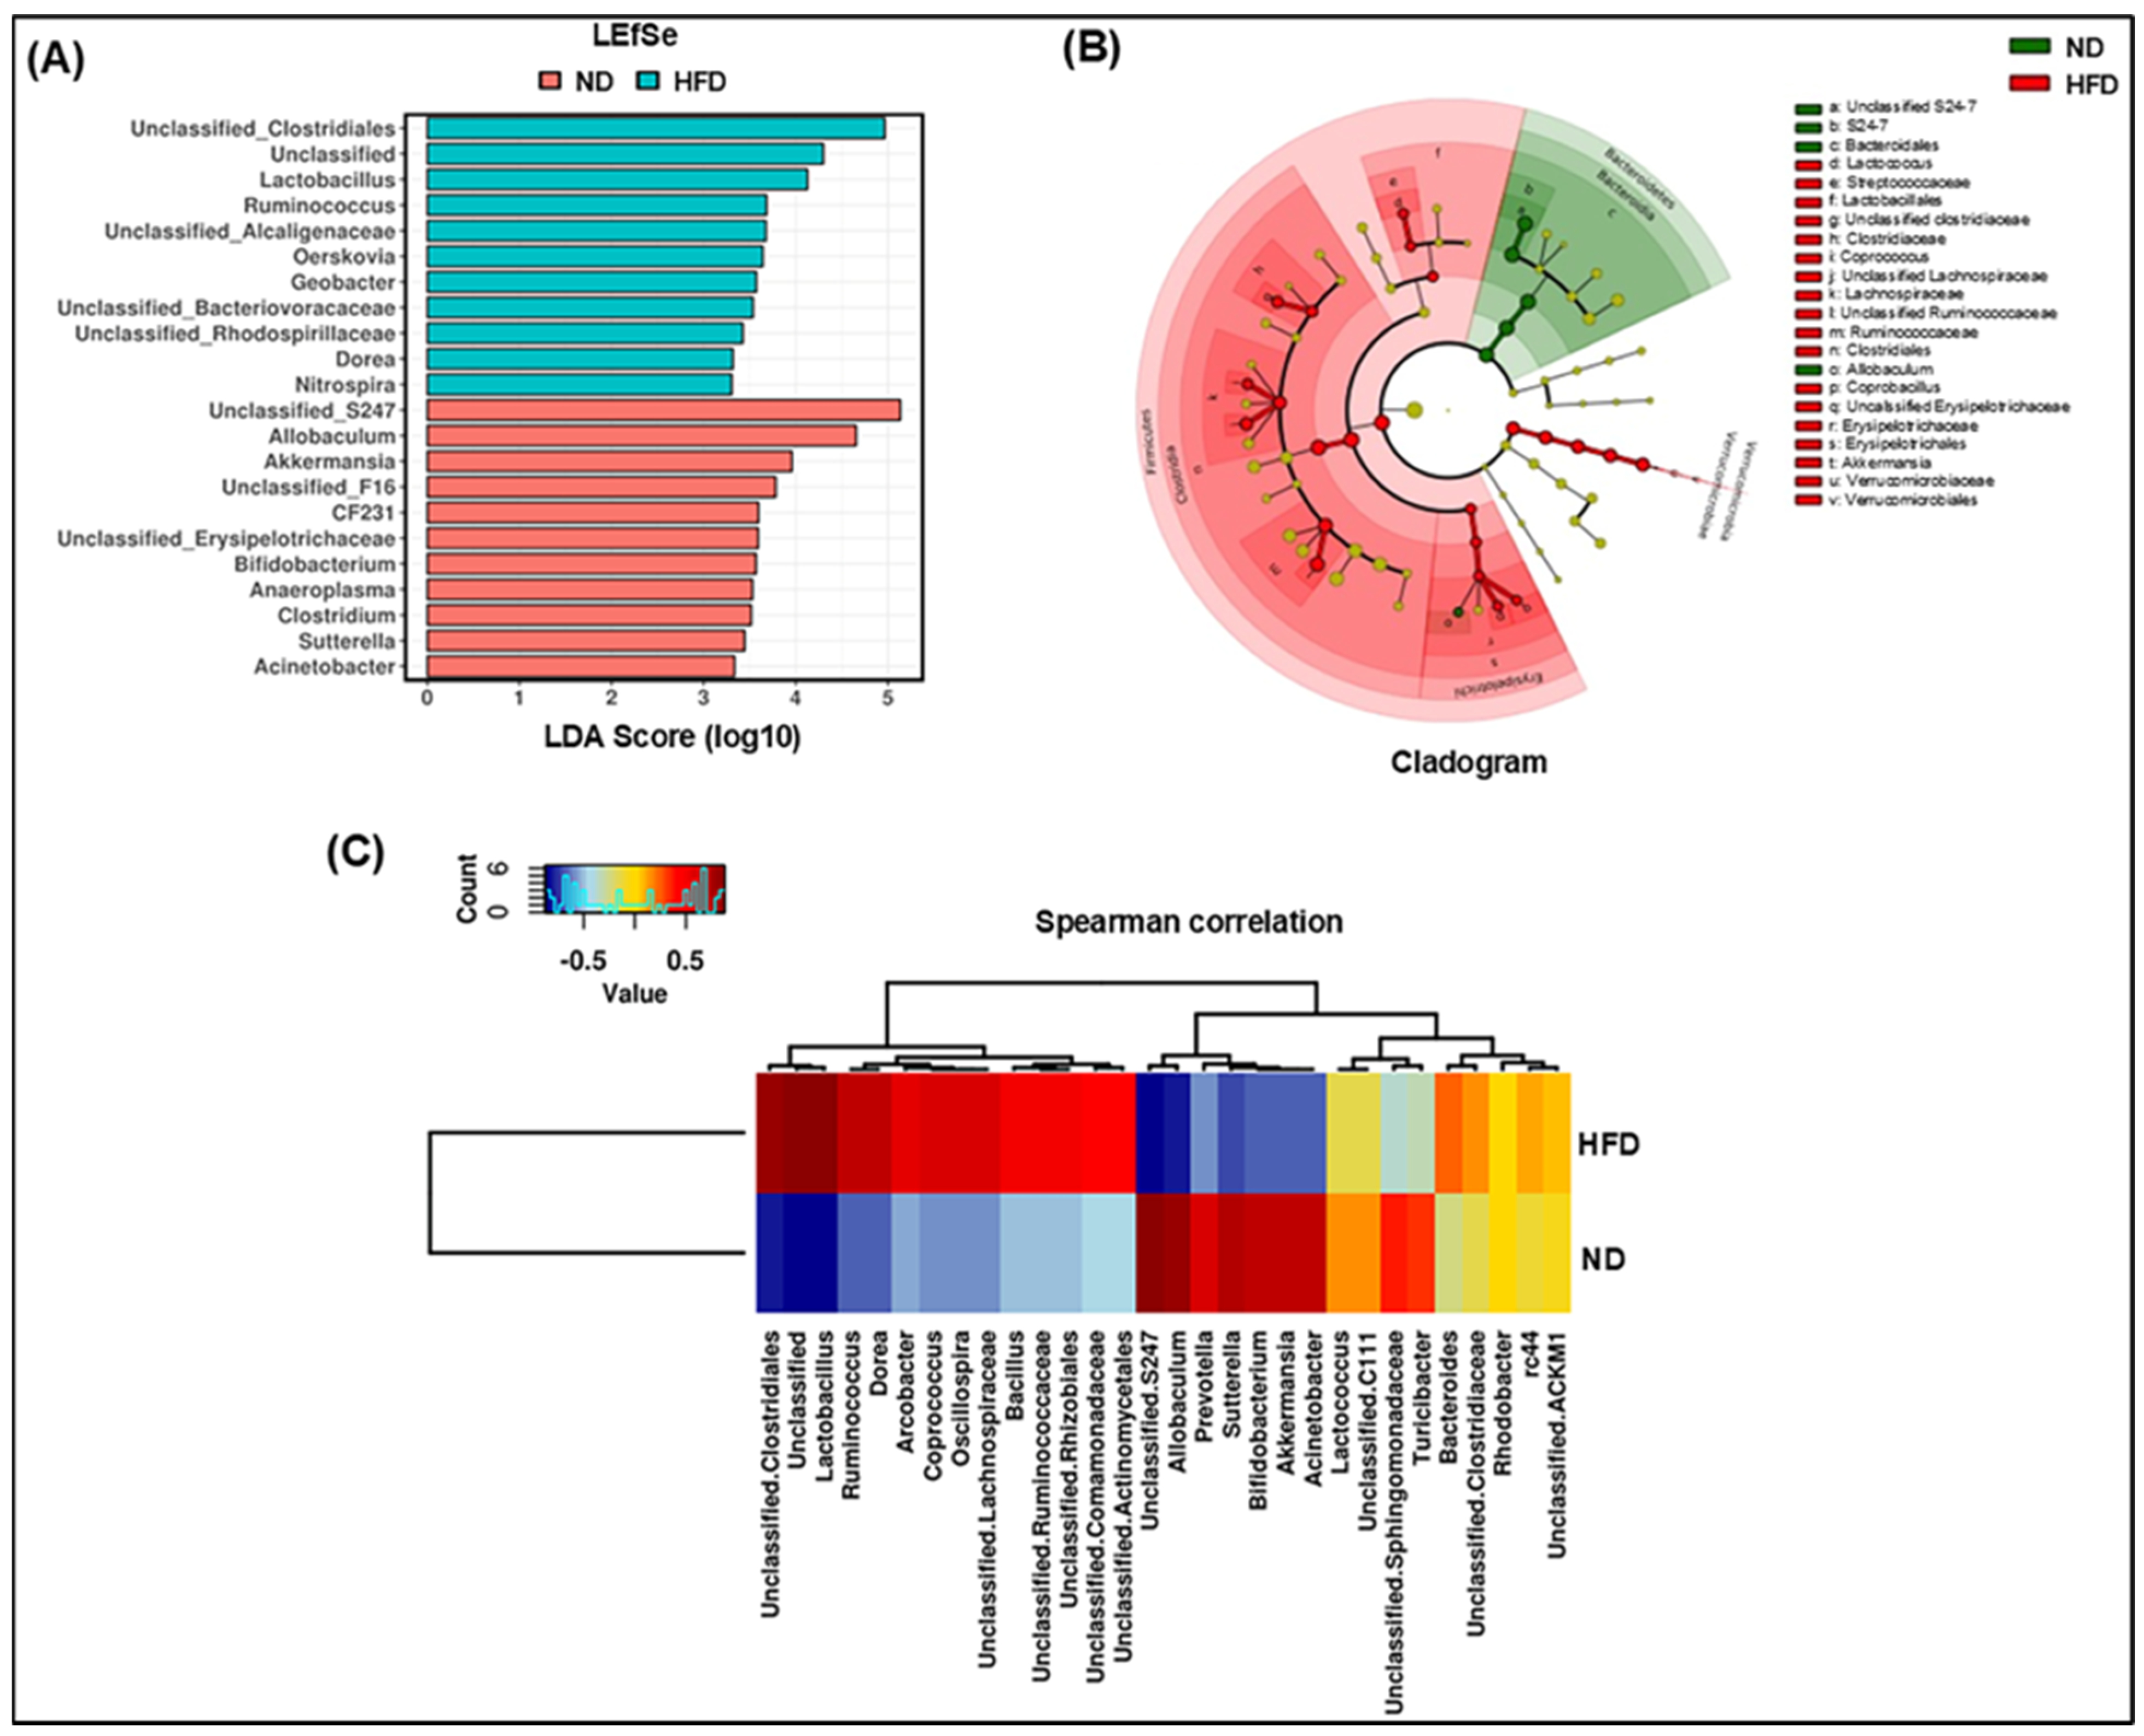
3.3. Specific Phylotype Alteration in the Fecal Microbiome in HFD-Fed Mice

Lactobacillus, associated with obesity and metabolic diseases, had a higher abundance in the stool samples collected from obese individuals. On the contrary, this genus was found in a low abundance in the commensal gut microbiota [37]. Further, Akkermansia was a highly abundant taxon in the ND group; however, Lactobacillus and Ruminococcus exhibited greater prominence in the HFD group in this study. To identify the alteration in leading bacteria, we employed linear discriminant analysis (LDA) and effect size (LEfSe) analysis to examine the varying levels of dominant microbiota in each group (Figure 3A,B). Figure 3 depicts a total of 22 different taxa, split into 2 groups, with 11 phylotypes as key biomarkers of notable gut microbiota in each of the ND and HFD groups (Figure 3A). The cladogram showing the gut microbiota of primary bacteria exhibited an obvious disparity in the taxa between the HFD and ND groups (Figure 3B). At the phylum level, Bacteroidetes and Firmicutes in the ND and HFD groups were notably enriched and distinct, but at the class level, Bacteroidia, Clostridia, and Erysipelotrichia distinctly varied between different groups. At the family level, the abundance of Muribaculaceae, also known as S24-7, was significantly diverse in the ND group, whereas Streptococcaceae, Clostridiaceae, Lachnospiraceae, Ruminococcaceae, and Erysipelotrichaceae were the diverse population in HFD group. At the genus level, the abundance of unclassified Muribaculaceae and Allobaculum was unique in the ND group, but Lactococcus and unclassified Erysipelotrichaceae were enhanced populations in the HFD group. The heatmap of Spearman’s correlation analysis between the gut microbiome of ND- and HFD-fed mice also showed a strong correlation between 30 taxa (Figure 3C). Taken together, we noticed a significant increase in Arcobacter, Coprococcus, Oscillospira, and Lactobacillus in HFD-fed mice compared to those fed an ND.

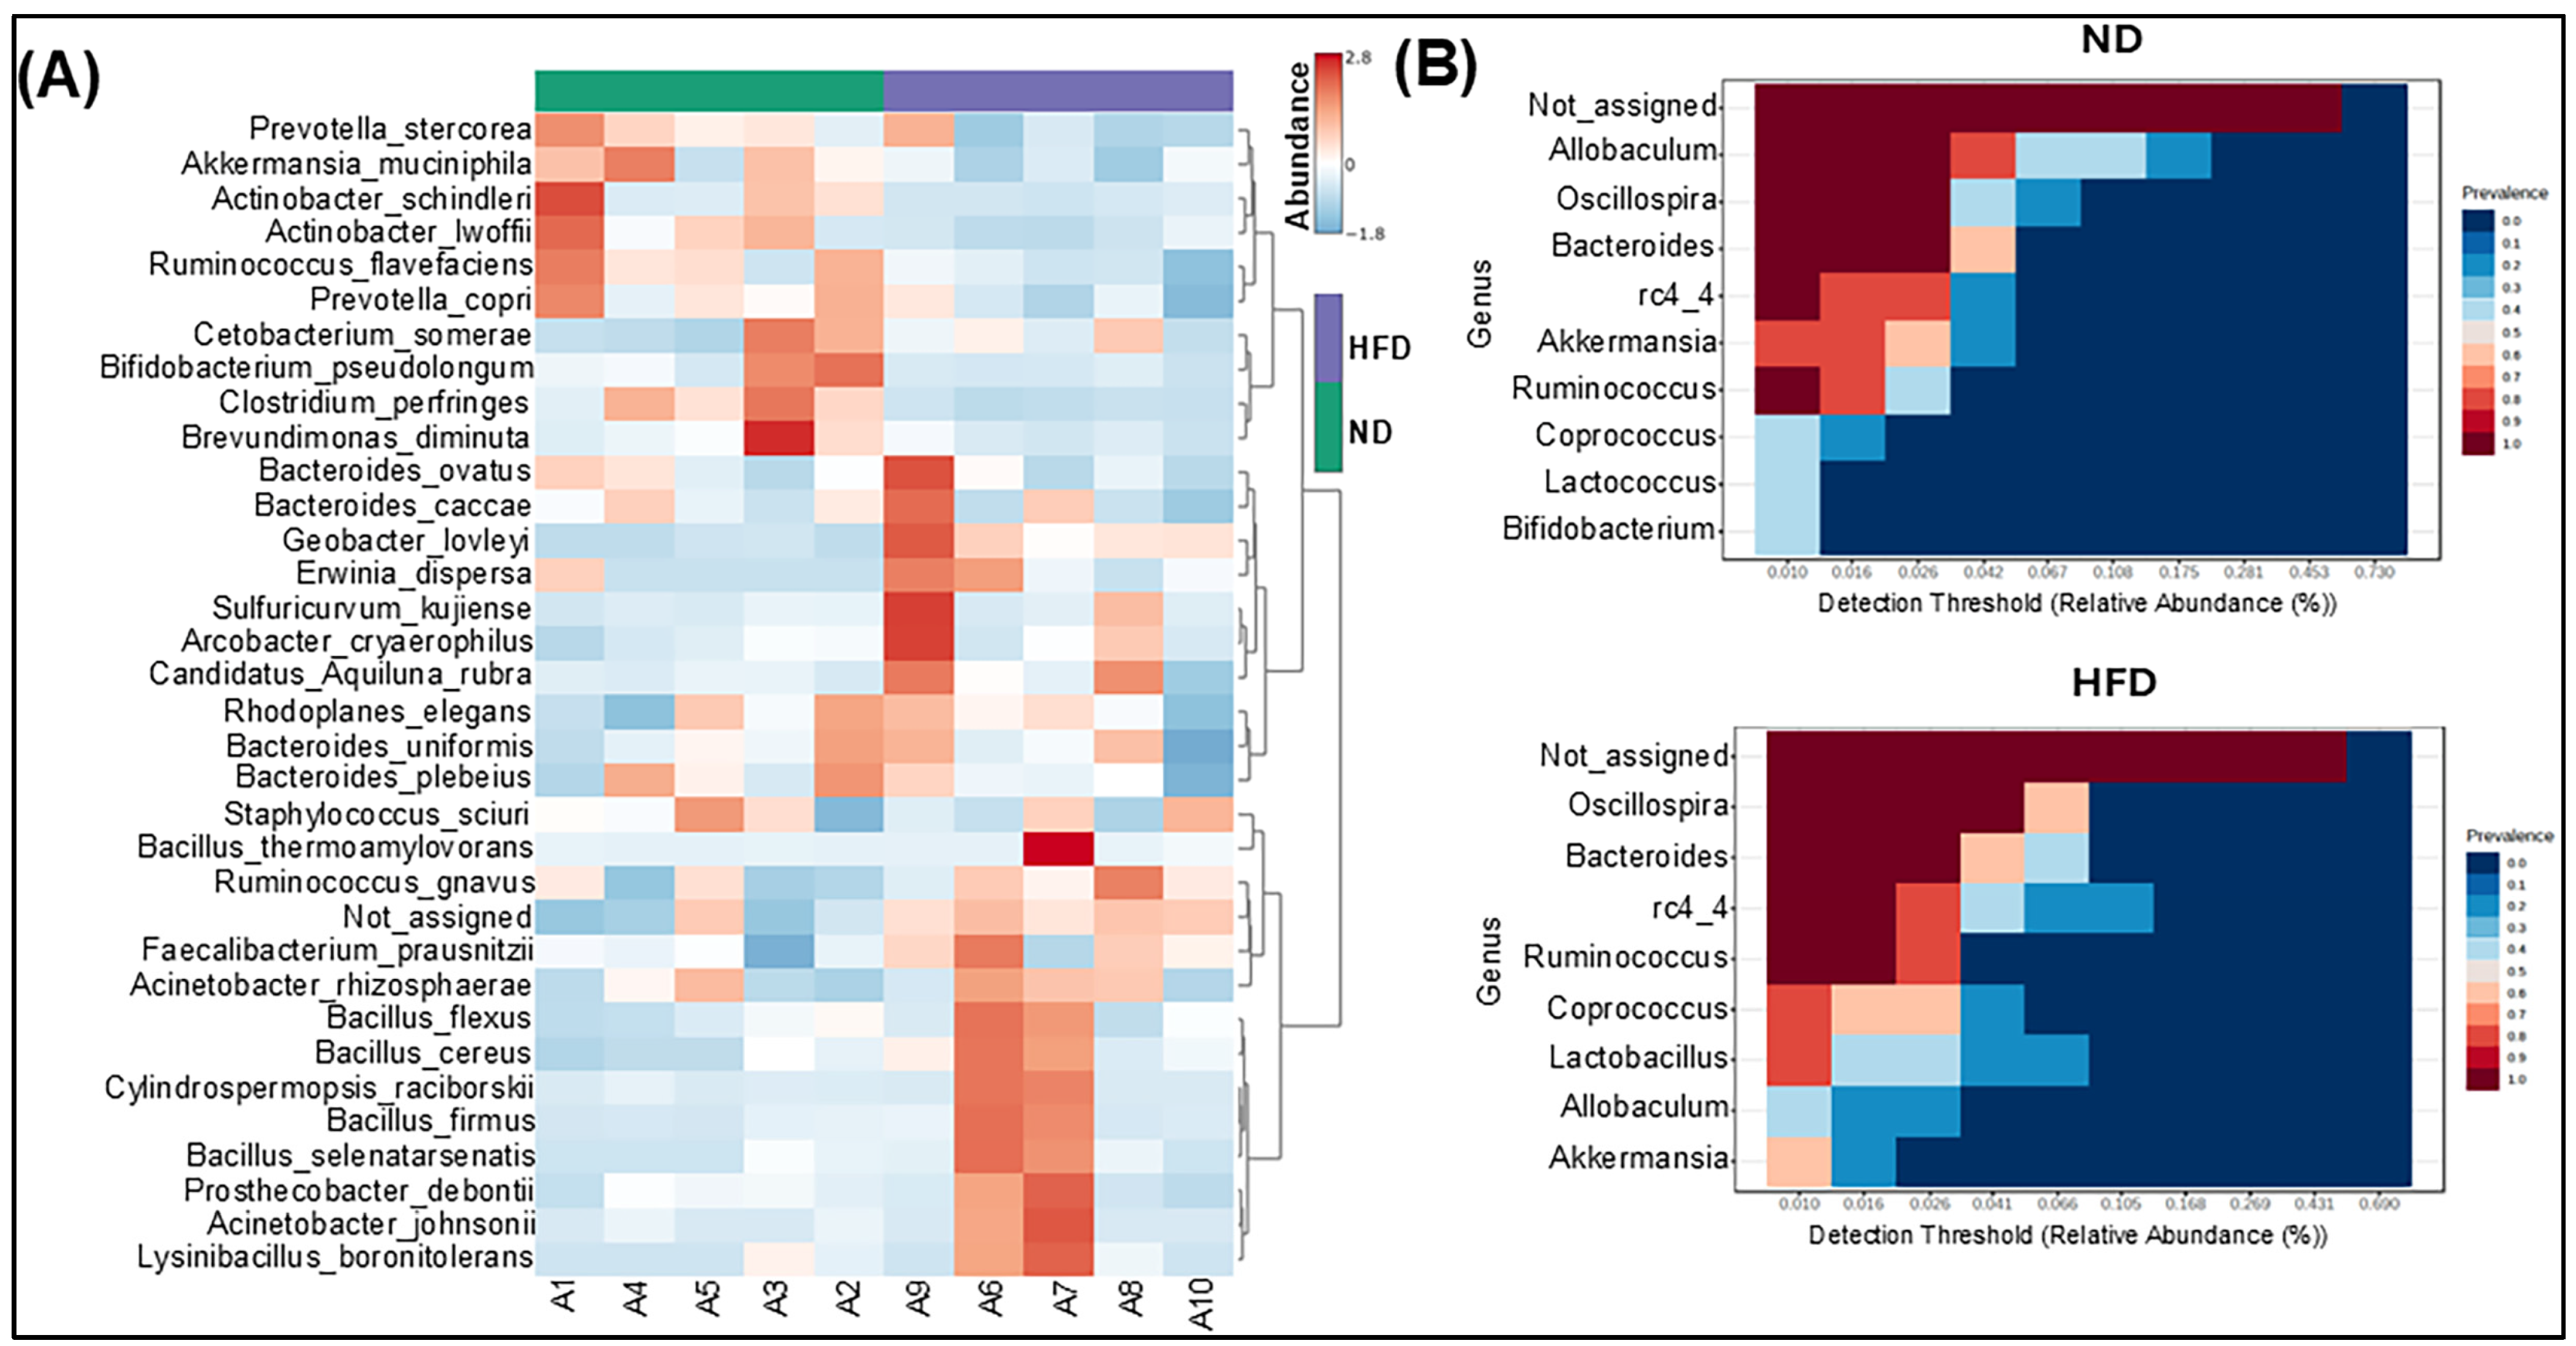
3.4. HFD Differentially Modulates Bacterial Populations

Next, hierarchical clustering, coupled with a heatmap analysis, was conducted to unveil the unique characteristics of the significantly diverse bacterial species based on the abundance of the identified bacteria in the ND and HFD groups. We noticed that the abundance of Akkermansia muciniphilla, Actinobacter lwoffii, Clostridrium perfringens, and Rhodoplanes elegans was downregulated in the HFD groups compared to those fed an ND. On the contrary, HFD feeding upregulated the abundance of Faecalibacterium prausnitzii, Actinobacter rhizosphaerae, Bacillus cereus, Bacillus selenatarsenatis, and Actinobacter johnsonii compared to ND feeding (Figure 4A). We utilized the detection threshold graph to filter and represent only the bacterial genera to ensure that the focus was on the most significantly changed microbiota (Figure 4B). The prevalence value was set from 0 to 1: the higher the value, the higher the prevalence of the sample. However, setting a threshold might have also excluded some significant taxa having low abundance, which could be subjected to further analysis. In our study, only those genera with relative abundances exceeding the threshold of 0.1% were shown, making it easier to identify the dominant and relevant taxa within the microbial community. Overall, HFD feeding showed a significant depletion of commensal gut bacterial species compared to ND-fed experimental animals, which might be the reason for sustained obesity and AT inflammation after HFD feeding.

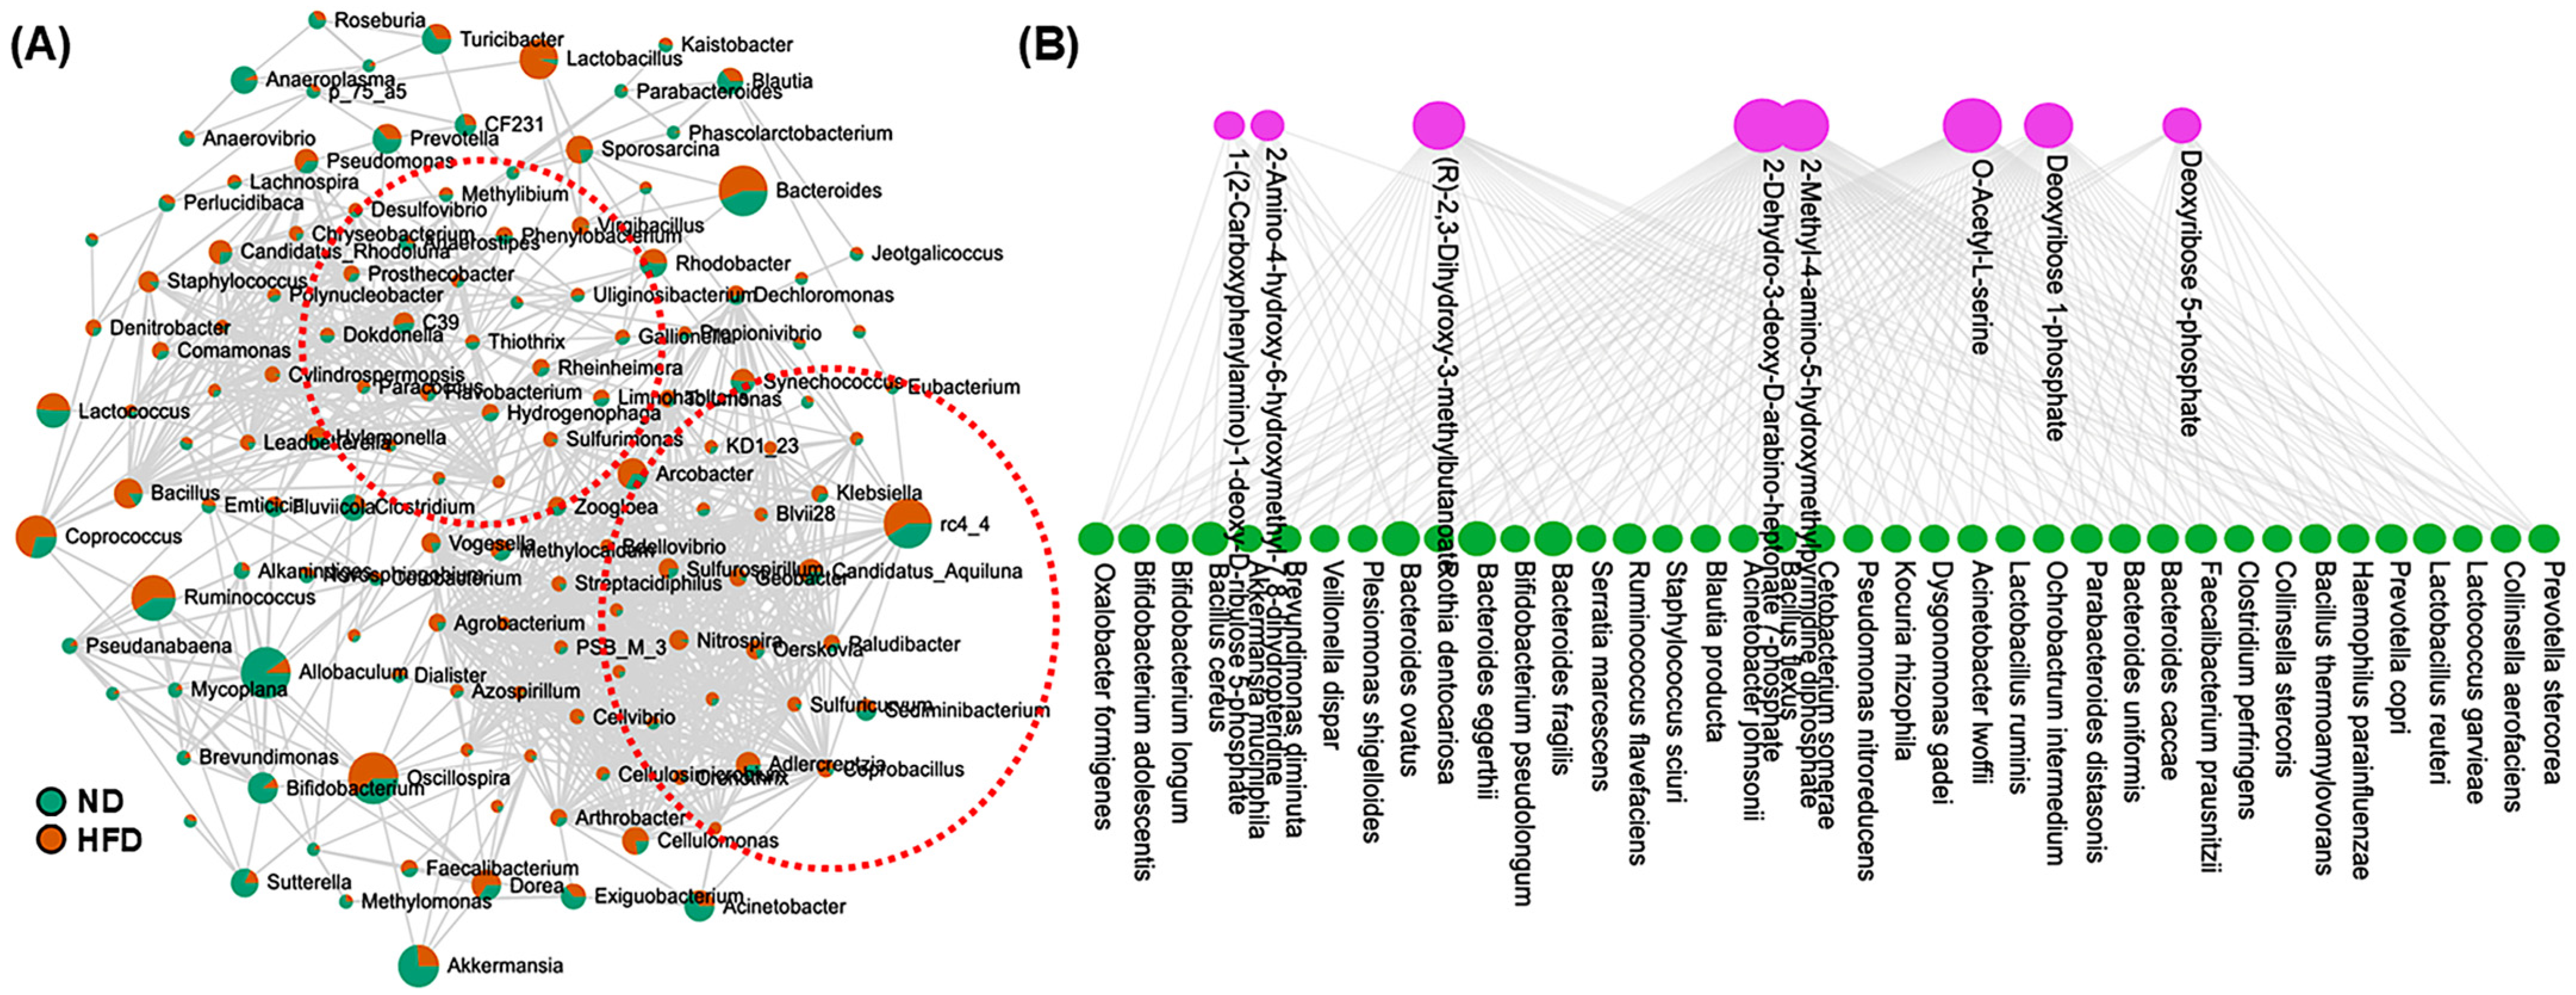
3.5. Correlation and Functional Enrichment Analysis of Microbiome–Metabolite Interaction

The human gut microbiome plays an important role in fatty acid and lipid metabolism, significantly impacting host health. Particularly, Bacteroidetes and Firmicutes phyla play a crucial role in breaking down complex lipids and synthesizing essential fatty acids [38]. A novel study has reported a decrease in Turicibacter after HFD feeding [39]. Monosaturated fatty acids (MUFAs) are considered beneficial for health, and Tunicibacter is reported to have a positive correlation with MUFAs [40]. These microbes produce metabolites like short-chain fatty acids (SCFAs) and bile acids, which ultimately maintain lipid metabolism and energy homeostasis. To demonstrate the dysregulation of the gut microbiota population, we performed a Taxon Set Enrichment Analysis (TSEA) to demonstrate insights into ecological dynamics or functional relevance. In this study, most of the prominently enriched or depleted taxa were represented, and correlation analysis was performed (Figure 5A). HFD feeding significantly upregulated the Sporosarcina population compared to ND-fed mice. Interestingly, despite the significant increase in the Firmicutes phylum with HFD feeding, the abundance of Turicibacter, a genus within this phylum, was notably reduced in our study.
The enriched KEGG (Kyoto Encyclopedia of Genes and Genomes) pathways in the microbiome’s metabolic pathway were studied to represent the functional processes significantly over-represented in a microbial community after HFD feeding. Lipid metabolism in the microbiome can influence the host’s lipid profiles, impacting conditions such as cardiovascular disease, obesity, and inflammation [41]. We identified 10 microbiota-perturbed pathways under HFD-fed conditions (Table 1). Our analysis included a significant change in many pathways related to amino acid and lipid metabolism, including the pentose phosphate pathway, phenylalanine, tyrosine, and tryptophan biosynthesis, valine, leucine, and isoleucine biosynthesis, thiamine metabolism, folate biosynthesis, etc. The bipartite network graph below depicts the microbe–metabolite interactions through a functional enrichment analysis (Figure 5B). The graph illustrates the bacterial species contributing to the production or modification of specific metabolites. This can help identify key microbial players in particular metabolic pathways. For instance, “2-Dehydro-3-deoxy-D-arabino-heptonate” and “Deoxyribose 1-phosphate” appear to have significant interactions with multiple bacterial species. Some bacterial species, such as Bifidobacterium longum and Prevotella stercorea, are connected to different metabolites, indicating their crucial role in microbial metabolism. Many bacterial species are also found to be associated with 2-Methyl-4-amino-5-hydroxymethylpyrimidine diphosphate. Overall, these findings highlight specific bacterial taxa and their associated metabolites that contribute to inflammation, insulin resistance, or energy balance.

4. Discussion

The human gut microbiome has become a widely investigated research area and is increasingly recognized as a significant contributor to various host metabolic disorders, such as obesity, type 2 diabetes (T2D), non-alcoholic fatty liver, and cardiovascular disease [42]. Several studies have shown differential changes in alpha- and beta-diversity of the gut microbiota due to HFD feeding [43]. A low alpha-diversity is often indicative of a dysbiotic gut microbiome and is clinically associated with conditions such as obesity [44]. Although a clear definition of a “healthy gut microbiota” remains elusive, numerous disease conditions have been linked to microbiota compositions that differ from those of healthy control groups [45]. Research indicates that the microbiota associated with obesity is more efficient at extracting energy from one’s diet, suggesting its pivotal role in the storage of excessive energy [3]. HFDs have consistently been shown to modulate gut microbial composition in humans [46]. The gut microbes may influence fat metabolism indirectly through intestinal signaling regulated by SCFAs and lactate, such as butyrate, acetate, and propionate, which are produced through the fermentation of carbohydrates and serve both as energy sources and signaling molecules for the host [17]. In this study, we observed that HFD feeding reduced the richness of the gut microbiota population while increasing its diversity and caused a higher abundance of Firmicutes compared to ND feeding. Further, the total sum scaling (TSS) analysis revealed a significant decrease in the Akkermansia and Allobaculum populations in the HFD group compared to the group fed ND. Our linear discriminant analysis also showed a decreased abundance of butyrate-producing Muribaculaceae in the HFD group. Taken together, our studies highlight that HFD modulates α-diversity and β-diversity of the gut microbiome and facilitates the growth of obesity-promoting microbiota and, therefore, obesity itself.
As a prominent mucin utilizer, Akkermansia muciniphila has gained significant attention as a potential next-generation probiotic and is considered crucial for maintaining the intestinal epithelial barrier [47,48]. A recent clinical trial demonstrated that a 3-month oral administration of Akkermansia muciniphila in obese patients is safe and well tolerated. Supplementation with Akkermansia muciniphila leads to reductions in body weight and improvements in liver function and inflammation, as evidenced by a double-blind, randomized human study [49]. Our study corroborates this finding, as we noticed a depleted population of Akkermansia in the HFD group compared to the ND group. The Muribaculaceae family, a prominent member of the Bacteroides genus, was found to have a significant negative correlation with the risk of obesity. Regarding Muribaculaceae, novel data on the diversity, ecology, and description of the bacterial family S24-7 have been reported [50]. It has been shown that early-life gut microbiome modulation alters gut responses, contributing to accelerated and enhanced T1D development [51].
Our findings demonstrate a significant decrease in Muribaculaceae under HFD feeding, which supports the above finding about its role in obesity and metabolic diseases.
In the past, it was established that changes in the microbiome modulate inflammation [52]. Chronic low-grade inflammation is a hallmark of different metabolic diseases, including obesity, T2D, and non-alcoholic fatty liver disease [53,54]. During obesity, the rapid expansion of adipose tissues leads to hypoxic conditions and releases pro-inflammatory cytokines and chemokines. This subsequently triggers the infiltration of various immune cells, including macrophages and T cells, secreting pro-inflammatory cytokines like tumor necrosis factor (TNF), interleukin-1 beta (IL-1β), and IL-6 [55,56]. We noticed an increased abundance of Ruminococcus gnavus in the hierarchical clustering heatmap in our study. This species is correlated with an increased expression of haptoglobin in normal-weight and overweight individuals [57]. Haptoglobin can attract monocytes/macrophages by interacting with chemokine receptor 2 (CCR2), a process mediated by MAPK phosphorylation [58]. Haptoglobin levels rise in white adipose tissues with weight gain, activating macrophages and triggering the release of TNF-α and IL-6 [59]. It has been observed that the MAPK p38 inhibitor reduces the phosphorylation of CCAAT/enhancer-binding protein (C/EBP)-α, peroxisome proliferator-activated receptor-γ (PPAR-γ) and its downstream effector, activating transcription factor-2 (ATF-2) [60]. HFD feeding not only alters gut microbiota composition and induces functional changes in the intestinal barrier but can also facilitate low-grade inflammation in the small intestine by leaking LPS, ultimately causing systemic inflammation [61]. Further, LPS is involved in the transition from M2 to M1 macrophages, the latter of which accelerates inflammatory responses in adipose tissues. Additionally, LPS may activate caspase-4/5/11 signaling, leading to cell death in adipocytes [62]. In mice, the inflammatory caspases-1 and -11 play a critical role as key mediators of septic shock in vivo [63,64]. Caspase-11 has been identified as a pivotal regulator of non-canonical inflammasome activation, accelerating the release of IL-1α in response to intracellular LPS and Gram-negative bacteria. It also plays a critical role in inducing inflammasome-associated cell death [65,66]. Based on amino acid sequences, caspase-4 and caspase-5 are considered the potential human orthologues of murine caspase-11, and previous studies have identified caspase-4 and caspase-5 as critical downstream targets of LPS activation in human monocytes. Further, caspase-5 specifically contributes to the release of IL-1α and IL-1β, but not IL-6, from LPS-stimulated monocytes [67]. The infiltration of macrophages, along with the upregulation of TNF-α, NF-κB, and IL-6, further promotes inflammation in adipose tissue [68,69]. In this study, we found a dramatic increase in the population of several LPS-producing microbiomes at the genus level, including Klebsiella and Pseudomonas, which are well reported to produce LPS [70,71]. Lactobacillus has been claimed to be an obesity-associated taxon, with higher abundance observed in the stool of patients with obesity and metabolic diseases. In our correlation analysis using TESA, we found a remarkable increase in Lactobacillus. This probiotic genus, derived from food, exhibits relatively low prevalence and abundance in the commensal gut microbiota [37]. Gut dysbiosis has been linked to several pathological conditions of the gastrointestinal tract, including diarrhea and irritable bowel syndrome, as well as other immune system-related disorders like inflammatory bowel diseases and rheumatoid arthritis [72,73]. Evidence indicates that systemic inflammatory mediators from dysbiotic bacteria impair the blood-brain barrier’s integrity and facilitate neuroinflammation and neurodegeneration, which ultimately lead to the development of Alzheimer’s disease [74]. Several studies have demonstrated a direct and indirect relationship between the gut microbiota population with the development and progression of several cancers. HFD consumption is well reported to promote colorectal cancer (CRC), and multiple studies have shown that altered adipokines, bile acids, and, most importantly, gut microbiota dysbiosis contribute to CRC development [75,76]. Patients with advanced-stage breast cancer often show a greater abundance of Clostridium and Lachnospiraceae species in their feces compared to those with early-stage breast cancer, pointing to the connection between gut microbiota and the progression of breast cancer [77].
Exploring the correlation between dysregulated gut microbes and metabolites is important for alterations in obesity and HFD-induced diabetes. Our microbe metabolite interaction study identified several potential metabolites connected to several bacterial species. An imbalance in “good” and “bad” gut microbiota resulted in a depletion of bacterial metabolites like SCFAs and activated the HFD–gut microbiota–butyrate–insulin resistance pathway in diabetes induced by HFD [78,79]. In our study, we noticed an increase in Ruminococcus, a species that might be responsible for the degradation of polysaccharides and fibers. Further, we found a significant increase in Firmicutes at the phylum level in mice following a high-fat diet (HFD), a finding which had been previously demonstrated in other animal and human studies [80]. Firmicutes are the main functional population extracting energy from dietary carbohydrates, and this enhanced energy harvest leads to caloric absorption and, ultimately, weight gain [81]. Our enriched KEGG pathway analysis showed 10 significantly enriched metabolic pathways after HFD feeding. Cysteine and methionine metabolism and phenylalanine, tyrosine, and tryptophan biosynthesis were found to be increased in our KEGG pathway analysis. Valine, leucine, and isoleucine are collectively known as branched-chain amino acids, which are essential in metabolic processes but, at higher levels, can cause insulin resistance and obesity [82]. In our study, we found the valine, leucine, and isoleucine biosynthesis pathway to be one of the most significantly enriched metabolic pathways after HFD administration. Considering all these findings, understanding these complex microbial interactions is essential for developing targeted interventions to mitigate obesity and inflammation by aiming at the gut microbiota and their metabolites.

5. Conclusions

High-fat diets (HFDs) have been identified as a primary risk factor for several autoimmune and metabolic diseases. This study provides valuable insights into the dysbiosis of gut microbiota and the alterations in metabolites induced by HFDs. An HFD promotes the development of a gut microbiome that enhances energy extraction from the diet, thereby contributing to obesity, AT inflammation, and metabolic diseases. We found a notable dysregulation in major bacterial populations at different taxonomical levels, including increased levels of Firmicutes and depleted populations of Bacteroidetes in HFD-fed mice. Additionally, Akkermansia and Allobaculum were also found to be decreased in our study. It is feasible to alleviate the symptoms of obesity and metabolic diseases by utilizing probiotics to modify the composition of the gut microbiota. There is substantial evidence that the gut microbiota’s composition and their metabolites influence the development of obesity and related diseases. Therefore, targeting the composition of the gut microbiota and the metabolites generated by dietary interventions and medications offers potential strategies for treating and preventing metabolic diseases. In the future, the field of microbiota research will offer novel insights into microbiota–host interactions and pave the way for the development of therapeutic approaches for obesity and its associated complications.

Author Contributions

M.A.A.M. performed all experiments, data curation, and data analysis and wrote the first draft of the manuscript; A.R. participated in the experiments and made the figures; M.M. participated in the experiments and reviewed and edited the manuscript; and U.P.S. conceived the idea and edited the manuscript. All authors have read and agreed to the published version of the manuscript.

Funding

Grants from the National Institutes of Health (NIH) (NIAID R01 AI140405) to the U.S. at UTHSC in Memphis, TN, supported this study.

Institutional Review Board Statement

The University of Tennessee Health Science Center (UTHSC) Institutional Animal Care and Use Committee (IACUC) approved the protocol number (UPS 23-0450) for all animal experimentation used in this study. All animal studies and procedures were performed in such a way as to minimize pain and discomfort to mice. The experimental design was conducted with extreme consideration for reducing animal numbers and suffering from pain. All laboratory personnel involved in the mice studies were trained in animal care and handling to ensure that the highest standards of animal welfare and ethical conduct were maintained throughout the research period.

Informed Consent Statement

All the authors involved in this study have approved the manuscript’s publication.

Data Availability Statement

The raw data of this manuscript will be made available to the public by the authors, without any reservation.

Conflicts of Interest

All the authors declare that they have no competing interests that could have influenced this study and have not been involved with any study sponsors.

References

  1. Raoult, D.; Fournier, P.E.; Drancourt, M. What does the future hold for clinical microbiology? Nat. Rev. Microbiol. 2004, 2, 151–159. [Google Scholar] [PubMed]
  2. Lepage, P.; Leclerc, M.C.; Joossens, M.; Mondot, S.; Blottière, H.M.; Raes, J.; Ehrlich, D.; Doré, J. A metagenomic insight into our gut’s microbiome. Gut 2013, 62, 146–158. [Google Scholar] [CrossRef]
  3. Turnbaugh, P.J.; Ley, R.E.; Mahowald, M.A.; Magrini, V.; Mardis, E.R.; Gordon, J.I. An obesity-associated gut microbiome with increased capacity for energy harvest. Nature 2006, 444, 1027–1031. [Google Scholar] [PubMed]
  4. Blüher, M. Obesity: Global epidemiology and pathogenesis. Nat. Rev. Endocrinol. 2019, 15, 288–298. [Google Scholar]
  5. Gu, Y.; Liu, C.; Zheng, N.; Jia, W.; Zhang, W.; Li, H. Metabolic and gut microbial characterization of obesity-prone mice under a high-fat diet. J. Proteome Res. 2019, 18, 1703–1714. [Google Scholar]
  6. Reddon, H.; Guéant, J.-L.; Meyre, D. The importance of gene–environment interactions in human obesity. Clin. Sci. 2016, 130, 1571–1597. [Google Scholar]
  7. Backhed, F.; Ding, H.; Wang, T.; Hooper, L.; Koh, G.Y.; Nagy, A.; Semenkovich, C.; Gordon, J. The gut microbiota as an environmental factor that regulates fat storage. Proc. Natl. Acad. Sci. USA 2004, 101, 15718–15723. [Google Scholar] [CrossRef]
  8. Thingholm, L.B.; Rühlemann, M.C.; Koch, M.; Fuqua, B.; Laucke, G.; Boehm, R.; Bang, C.; Franzosa, E.A.; Hübenthal, M.; Rahnavard, A. Obese individuals with and without type 2 diabetes show different gut microbial functional capacity and composition. Cell Host Microbe 2019, 26, 252–264.e210. [Google Scholar]
  9. Turnbaugh, P.J.; Hamady, M.; Yatsunenko, T.; Cantarel, B.L.; Duncan, A.; Ley, R.E.; Sogin, M.L.; Jones, W.J.; Roe, B.A.; Affourtit, J.P. A core gut microbiome in obese and lean twins. Nature 2009, 457, 480–484. [Google Scholar]
  10. Zheng, R.; Xiang, X.; Shi, Y.; Xie, J.; Xing, L.; Zhang, T.; Zhou, Z.; Zhang, D. Gut microbiota and mycobiota change with feeding duration in mice on a high-fat and high-fructose diet. BMC Microbiol. 2024, 24, 504. [Google Scholar]
  11. Secchiero, P.; Rimondi, E.; Marcuzzi, A.; Longo, G.; Papi, C.; Manfredini, M.; Fields, M.; Caruso, L.; Di Caprio, R.; Balato, A. Metabolic Syndrome and Psoriasis: Pivotal Roles of Chronic Inflammation and Gut Microbiota. Int. J. Mol. Sci. 2024, 25, 8098. [Google Scholar] [CrossRef] [PubMed]
  12. Sonnenburg, J.L.; Bäckhed, F. Diet–microbiota interactions as moderators of human metabolism. Nature 2016, 535, 56–64. [Google Scholar] [PubMed]
  13. Desai, M.S.; Seekatz, A.M.; Koropatkin, N.M.; Kamada, N.; Hickey, C.A.; Wolter, M.; Pudlo, N.A.; Kitamoto, S.; Terrapon, N.; Muller, A. A dietary fiber-deprived gut microbiota degrades the colonic mucus barrier and enhances pathogen susceptibility. Cell 2016, 167, 1339–1353.e1321. [Google Scholar]
  14. Kelly, C.J.; Zheng, L.; Campbell, E.L.; Saeedi, B.; Scholz, C.C.; Bayless, A.J.; Wilson, K.E.; Glover, L.E.; Kominsky, D.J.; Magnuson, A. Crosstalk between microbiota-derived short-chain fatty acids and intestinal epithelial HIF augments tissue barrier function. Cell Host Microbe 2015, 17, 662–671. [Google Scholar]
  15. Khan, M.J.; Gerasimidis, K.; Edwards, C.A.; Shaikh, M.G. Role of gut microbiota in the aetiology of obesity: Proposed mechanisms and review of the literature. J. Obes. 2016, 2016, 7353642. [Google Scholar]
  16. Bliss, D.Z.; Weimer, P.J.; Jung, H.-J.G.; Savik, K. In vitro degradation and fermentation of three dietary fiber sources by human colonic bacteria. J. Agric. Food Chem. 2013, 61, 4614–4621. [Google Scholar]
  17. Koh, A.; De Vadder, F.; Kovatcheva-Datchary, P.; Bäckhed, F. From dietary fiber to host physiology: Short-chain fatty acids as key bacterial metabolites. Cell 2016, 165, 1332–1345. [Google Scholar]
  18. Pindjakova, J.; Sartini, C.; Lo Re, O.; Rappa, F.; Coupe, B.; Lelouvier, B.; Pazienza, V.; Vinciguerra, M. Gut dysbiosis and adaptive immune response in diet-induced obesity vs. systemic inflammation. Front. Microbiol. 2017, 8, 1157. [Google Scholar]
  19. Cani, P.D.; Amar, J.; Iglesias, M.A.; Poggi, M.; Knauf, C.; Bastelica, D.; Neyrinck, A.M.; Fava, F.; Tuohy, K.M.; Chabo, C. Metabolic endotoxemia initiates obesity and insulin resistance. Diabetes 2007, 56, 1761–1772. [Google Scholar]
  20. Frost, R.A.; Nystrom, G.J.; Lang, C.H. Lipopolysaccharide regulates proinflammatory cytokine expression in mouse myoblasts and skeletal muscle. Am. J. Physiol.-Regul. Integr. Comp. Physiol. 2002, 283, R698–R709. [Google Scholar] [PubMed]
  21. Li, J.; Lin, S.; Vanhoutte, P.M.; Woo, C.W.; Xu, A. Akkermansia muciniphila protects against atherosclerosis by preventing metabolic endotoxemia-induced inflammation in Apoe−/− mice. Circulation 2016, 133, 2434–2446. [Google Scholar] [PubMed]
  22. Brooks, S.P.; McAllister, M.; Sandoz, M.; Kalmokoff, M. Culture-independent phylogenetic analysis of the faecal flora of the rat. Can. J. Microbiol. 2003, 49, 589–601. [Google Scholar]
  23. Li, M.; Gu, D.; Xu, N.; Lei, F.; Du, L.; Zhang, Y.; Xie, W. Gut carbohydrate metabolism instead of fat metabolism regulated by gut microbes mediates high-fat diet-induced obesity. Benef. Microbes 2014, 5, 335–344. [Google Scholar] [PubMed]
  24. Kuczynski, J.; Stombaugh, J.; Walters, W.A.; Gonzalez, A.; Caporaso, J.G.; Knight, R. Using QIIME to analyze 16S rRNA gene sequences from microbial communities. Curr. Protoc. Bioinform. 2011, 36, 10.7.1–10.7.20. [Google Scholar] [CrossRef]
  25. Zakrzewski, M.; Proietti, C.; Ellis, J.J.; Hasan, S.; Brion, M.-J.; Berger, B.; Krause, L. Calypso: A user-friendly web-server for mining and visualizing microbiome–environment interactions. Bioinformatics 2017, 33, 782–783. [Google Scholar]
  26. Xc, M. Dysfunction of the intestinal microbiome in inflammatory bowel disease and treatment. Genome Biol. 2012, 13, R79. [Google Scholar]
  27. Murphy, E.A.; Velazquez, K.T.; Herbert, K.M. Influence of high-fat diet on gut microbiota: A driving force for chronic disease risk. Curr. Opin. Clin. Nutr. Metab. Care 2015, 18, 515–520. [Google Scholar]
  28. Ley, R.E.; Turnbaugh, P.J.; Klein, S.; Gordon, J.I. Human gut microbes associated with obesity. Nature 2006, 444, 1022–1023. [Google Scholar]
  29. Zhang, H.; DiBaise, J.K.; Zuccolo, A.; Kudrna, D.; Braidotti, M.; Yu, Y.; Parameswaran, P.; Crowell, M.D.; Wing, R.; Rittmann, B.E. Human gut microbiota in obesity and after gastric bypass. Proc. Natl. Acad. Sci. USA 2009, 106, 2365–2370. [Google Scholar]
  30. Duncan, S.H.; Lobley, G.; Holtrop, G.; Ince, J.; Johnstone, A.; Louis, P.; Flint, H.J. Human colonic microbiota associated with diet, obesity and weight loss. Int. J. Obes. 2008, 32, 1720–1724. [Google Scholar]
  31. Schwiertz, A.; Taras, D.; Schäfer, K.; Beijer, S.; Bos, N.A.; Donus, C.; Hardt, P.D. Microbiota and SCFA in lean and overweight healthy subjects. Obesity 2010, 18, 190–195. [Google Scholar] [CrossRef]
  32. Aguirre, M.; Venema, K. Does the gut microbiota contribute to obesity? Going beyond the gut feeling. Microorganisms 2015, 3, 213–235. [Google Scholar] [CrossRef]
  33. Lozupone, C.A.; Stombaugh, J.; Gonzalez, A.; Ackermann, G.; Wendel, D.; Vázquez-Baeza, Y.; Jansson, J.K.; Gordon, J.I.; Knight, R. Meta-analyses of studies of the human microbiota. Genome Res. 2013, 23, 1704–1714. [Google Scholar]
  34. Liu, Z.; DeSantis, T.Z.; Andersen, G.L.; Knight, R. Accurate taxonomy assignments from 16S rRNA sequences produced by highly parallel pyrosequencers. Nucleic Acids Res. 2008, 36, e120. [Google Scholar]
  35. Choo, J.M.; Leong, L.E.; Rogers, G.B. Sample storage conditions significantly influence faecal microbiome profiles. Sci. Rep. 2015, 5, 16350. [Google Scholar]
  36. Fei, N.; Zhao, L. An opportunistic pathogen isolated from the gut of an obese human causes obesity in germfree mice. ISME J. 2013, 7, 880–884. [Google Scholar] [PubMed]
  37. Rastogi, S.; Singh, A. Gut microbiome and human health: Exploring how the probiotic genus Lactobacillus modulate immune responses. Front. Pharmacol. 2022, 13, 1042189. [Google Scholar]
  38. Conlon, M.A.; Bird, A.R. The impact of diet and lifestyle on gut microbiota and human health. Nutrients 2014, 7, 17–44. [Google Scholar] [CrossRef]
  39. Velazquez, K.T.; Enos, R.T.; Bader, J.E.; Sougiannis, A.T.; Carson, M.S.; Chatzistamou, I.; Carson, J.A.; Nagarkatti, P.S.; Nagarkatti, M.; Murphy, E.A. Prolonged high-fat-diet feeding promotes non-alcoholic fatty liver disease and alters gut microbiota in mice. World J. Hepatol. 2019, 11, 619–637. [Google Scholar] [CrossRef]
  40. Wolters, M.; Ahrens, J.; Romaní-Pérez, M.; Watkins, C.; Sanz, Y.; Benítez-Páez, A.; Stanton, C.; Günther, K. Dietary fat, the gut microbiota, and metabolic health–A systematic review conducted within the MyNewGut project. Clin. Nutr. 2019, 38, 2504–2520. [Google Scholar]
  41. Matey-Hernandez, M.L.; Williams, F.M.; Potter, T.; Valdes, A.M.; Spector, T.D.; Menni, C. Genetic and microbiome influence on lipid metabolism and dyslipidemia. Physiol. Genom. 2018, 50, 117–126. [Google Scholar] [CrossRef]
  42. Fan, Y.; Pedersen, O. Gut microbiota in human metabolic health and disease. Nat. Rev. Microbiol. 2021, 19, 55–71. [Google Scholar]
  43. Li, Y.; Liu, Q.; Peng, C.; Ruan, B. Both gut microbiota and differentially expressed proteins are relevant to the development of obesity. BioMed Res. Int. 2020, 2020, 5376108. [Google Scholar]
  44. de Noronha, S.I.R.; de Moraes, L.A.G.; Hassell, J.E., Jr.; Stamper, C.E.; Arnold, M.R.; Heinze, J.D.; Foxx, C.L.; Lieb, M.M.; Cler, K.E.; Karns, B.L. High-fat diet, microbiome-gut-brain axis signaling, and anxiety-like behavior in male rats. Biol. Res. 2024, 57, 23. [Google Scholar]
  45. Scheithauer, T.P.; Dallinga-Thie, G.M.; de Vos, W.M.; Nieuwdorp, M.; van Raalte, D.H. Causality of small and large intestinal microbiota in weight regulation and insulin resistance. Mol. Metab. 2016, 5, 759–770. [Google Scholar]
  46. David, L.A.; Maurice, C.F.; Carmody, R.N.; Gootenberg, D.B.; Button, J.E.; Wolfe, B.E.; Ling, A.V.; Devlin, A.S.; Varma, Y.; Fischbach, M.A. Diet rapidly and reproducibly alters the human gut microbiome. Nature 2014, 505, 559–563. [Google Scholar]
  47. Derrien, M.; Vaughan, E.E.; Plugge, C.M.; de Vos, W.M. Akkermansia muciniphila gen. nov., sp. nov., a human intestinal mucin-degrading bacterium. Int. J. Syst. Evol. Microbiol. 2004, 54, 1469–1476. [Google Scholar] [CrossRef] [PubMed]
  48. Luo, Y.; Lan, C.; Li, H.; Ouyang, Q.; Kong, F.; Wu, A.; Ren, Z.; Tian, G.; Cai, J.; Yu, B. Rational consideration of Akkermansia muciniphila targeting intestinal health: Advantages and challenges. npj Biofilms Microbiomes 2022, 8, 81. [Google Scholar]
  49. Depommier, C.; Everard, A.; Druart, C.; Plovier, H.; Van Hul, M.; Vieira-Silva, S.; Falony, G.; Raes, J.; Maiter, D.; Delzenne, N.M. Supplementation with Akkermansia muciniphila in overweight and obese human volunteers: A proof-of-concept exploratory study. Nat. Med. 2019, 25, 1096–1103. [Google Scholar]
  50. Lagkouvardos, I.; Lesker, T.R.; Hitch, T.C.; Gálvez, E.J.; Smit, N.; Neuhaus, K.; Wang, J.; Baines, J.F.; Abt, B.; Stecher, B. Sequence and cultivation study of Muribaculaceae reveals novel species, host preference, and functional potential of this yet undescribed family. Microbiome 2019, 7, 28. [Google Scholar] [CrossRef]
  51. Zhang, X.-S.; Li, J.; Krautkramer, K.A.; Badri, M.; Battaglia, T.; Borbet, T.C.; Koh, H.; Ng, S.; Sibley, R.A.; Li, Y. Antibiotic-induced acceleration of type 1 diabetes alters maturation of innate intestinal immunity. eLife 2018, 7, e37816. [Google Scholar]
  52. Mousavinasab, F.; Karimi, R.; Taheri, S.; Ahmadvand, F.; Sanaaee, S.; Najafi, S.; Halvaii, M.S.; Haghgoo, A.; Zamany, M.; Majidpoor, J. Microbiome modulation in inflammatory diseases: Progress to microbiome genetic engineering. Cancer Cell Int. 2023, 23, 271. [Google Scholar] [PubMed]
  53. Saltiel, A.R.; Olefsky, J.M. Inflammatory mechanisms linking obesity and metabolic disease. J. Clin. Investig. 2017, 127, 1–4. [Google Scholar] [PubMed]
  54. Brunner, K.T.; Henneberg, C.J.; Wilechansky, R.M.; Long, M.T. Nonalcoholic fatty liver disease and obesity treatment. Curr. Obes. Rep. 2019, 8, 220–228. [Google Scholar] [PubMed]
  55. Netea, M.G.; Balkwill, F.; Chonchol, M.; Cominelli, F.; Donath, M.Y.; Giamarellos-Bourboulis, E.J.; Golenbock, D.; Gresnigt, M.S.; Heneka, M.T.; Hoffman, H.M. A guiding map for inflammation. Nat. Immunol. 2017, 18, 826–831. [Google Scholar]
  56. Chawla, A.; Nguyen, K.D.; Goh, Y.S. Macrophage-mediated inflammation in metabolic disease. Nat. Rev. Immunol. 2011, 11, 738–749. [Google Scholar]
  57. Zacarías, M.F.; Collado, M.C.; Gomez-Gallego, C.; Flinck, H.; Aittoniemi, J.; Isolauri, E.; Salminen, S. Pregestational overweight and obesity are associated with differences in gut microbiota composition and systemic inflammation in the third trimester. PLoS ONE 2018, 13, e0200305. [Google Scholar] [CrossRef]
  58. Maffei, M.; Funicello, M.; Vottari, T.; Gamucci, O.; Costa, M.; Lisi, S.; Viegi, A.; Ciampi, O.; Bardi, G.; Vitti, P. The obesity and inflammatory marker haptoglobin attracts monocytes via interaction with chemokine (CC motif) receptor 2 (CCR2). BMC Biol. 2009, 7, 87. [Google Scholar]
  59. Chiellini, C.; Santini, F.; Marsili, A.; Berti, P.; Bertacca, A.; Pelosini, C.; Scartabelli, G.; Pardini, E.; Lopez-Soriano, J.; Centoni, R. Serum haptoglobin: A novel marker of adiposity in humans. J. Clin. Endocrinol. Metab. 2004, 89, 2678–2683. [Google Scholar]
  60. Perumal, N.L.; Mufida, A.; Yadav, A.K.; Son, D.-G.; Ryoo, Y.-W.; Kim, S.-A.; Jang, B.-C. Suppression of Lipid Accumulation in the Differentiation of 3T3-L1 Preadipocytes and Human Adipose Stem Cells into Adipocytes by TAK-715, a Specific Inhibitor of p38 MAPK. Life 2023, 13, 412. [Google Scholar] [CrossRef]
  61. Luck, H.; Tsai, S.; Chung, J.; Clemente-Casares, X.; Ghazarian, M.; Revelo, X.S.; Lei, H.; Luk, C.T.; Shi, S.Y.; Surendra, A. Regulation of obesity-related insulin resistance with gut anti-inflammatory agents. Cell Metab. 2015, 21, 527–542. [Google Scholar]
  62. Tanaka, M. Molecular mechanism of obesity-induced adipose tissue inflammation; the role of Mincle in adipose tissue fibrosis and ectopic lipid accumulation. Endocr. J. 2020, 67, 107–111. [Google Scholar] [PubMed]
  63. Wang, S.; Miura, M.; Jung, Y.-K.; Zhu, H.; Li, E.; Yuan, J. Murine caspase-11, an ICE-interacting protease, is essential for the activation of ICE. Cell 1998, 92, 501–509. [Google Scholar] [PubMed]
  64. Kang, S.; Wang, S.; Kuida, K.; Yuan, J. Distinct downstream pathways of caspase-11 in regulating apoptosis and cytokine maturation during septic shock response. Cell Death Differ. 2002, 9, 1115–1125. [Google Scholar]
  65. Kayagaki, N.; Wong, M.T.; Stowe, I.B.; Ramani, S.R.; Gonzalez, L.C.; Akashi-Takamura, S.; Miyake, K.; Zhang, J.; Lee, W.P.; Muszyński, A. Noncanonical inflammasome activation by intracellular LPS independent of TLR4. Science 2013, 341, 1246–1249. [Google Scholar]
  66. Hagar, J.A.; Powell, D.A.; Aachoui, Y.; Ernst, R.K.; Miao, E.A. Cytoplasmic LPS activates caspase-11: Implications in TLR4-independent endotoxic shock. Science 2013, 341, 1250–1253. [Google Scholar]
  67. Viganò, E.; Diamond, C.E.; Spreafico, R.; Balachander, A.; Sobota, R.M.; Mortellaro, A. Human caspase-4 and caspase-5 regulate the one-step non-canonical inflammasome activation in monocytes. Nat. Commun. 2015, 6, 8761. [Google Scholar]
  68. Al Bander, Z.; Nitert, M.D.; Mousa, A.; Naderpoor, N. The gut microbiota and inflammation: An overview. Int. J. Environ. Res. Public Health 2020, 17, 7618. [Google Scholar] [CrossRef]
  69. Ghanim, H.; Abuaysheh, S.; Sia, C.L.; Korzeniewski, K.; Chaudhuri, A.; Fernandez-Real, J.M.; Dandona, P. Increase in plasma endotoxin concentrations and the expression of Toll-like receptors and suppressor of cytokine signaling-3 in mononuclear cells after a high-fat, high-carbohydrate meal: Implications for insulin resistance. Diabetes Care 2009, 32, 2281–2287. [Google Scholar]
  70. Yu, Z.; Chen, W.; Zhang, L.; Chen, Y.; Chen, W.; Meng, S.; Lu, L.; Han, Y.; Shi, J. Gut-derived bacterial LPS attenuates incubation of methamphetamine craving via modulating microglia. Brain Behav. Immun. 2023, 111, 101–115. [Google Scholar]
  71. Mohr, A.E.; Crawford, M.S.; Jasbi, P.; Fessler, S.; Sweazea, K.L. Lipopolysaccharide and the gut microbiota: Considering structural variation. FEBS Lett. 2022, 596, 849–875. [Google Scholar] [PubMed]
  72. Carding, S.; Verbeke, K.; Vipond, D.T.; Corfe, B.M.; Owen, L.J. Dysbiosis of the gut microbiota in disease. Microb. Ecol. Health Dis. 2015, 26, 26191. [Google Scholar] [PubMed]
  73. Hills, R.D.; Pontefract, B.A.; Mishcon, H.R.; Black, C.A.; Sutton, S.C.; Theberge, C.R. Gut microbiome: Profound implications for diet and disease. Nutrients 2019, 11, 1613. [Google Scholar] [CrossRef]
  74. Sochocka, M.; Donskow-Łysoniewska, K.; Diniz, B.S.; Kurpas, D.; Brzozowska, E.; Leszek, J. The gut microbiome alterations and inflammation-driven pathogenesis of Alzheimer’s disease—A critical review. Mol. Neurobiol. 2019, 56, 1841–1851. [Google Scholar]
  75. O’Keefe, S.J.; Li, J.V.; Lahti, L.; Ou, J.; Carbonero, F.; Mohammed, K.; Posma, J.M.; Kinross, J.; Wahl, E.; Ruder, E. Fat, fibre and cancer risk in African Americans and rural Africans. Nat. Commun. 2015, 6, 6342. [Google Scholar]
  76. Sánchez-Alcoholado, L.; Ordóñez, R.; Otero, A.; Plaza-Andrade, I.; Laborda-Illanes, A.; Medina, J.A.; Ramos-Molina, B.; Gómez-Millán, J.; Queipo-Ortuño, M.I. Gut microbiota-mediated inflammation and gut permeability in patients with obesity and colorectal cancer. Int. J. Mol. Sci. 2020, 21, 6782. [Google Scholar] [CrossRef] [PubMed]
  77. Luu, T.H.; Michel, C.; Bard, J.-M.; Dravet, F.; Nazih, H.; Bobin-Dubigeon, C. Intestinal proportion of Blautia sp. is associated with clinical stage and histoprognostic grade in patients with early-stage breast cancer. Nutr. Cancer 2017, 69, 267–275. [Google Scholar]
  78. Qin, J.; Li, Y.; Cai, Z.; Li, S.; Zhu, J.; Zhang, F.; Liang, S.; Zhang, W.; Guan, Y.; Shen, D. A metagenome-wide association study of gut microbiota in type 2 diabetes. Nature 2012, 490, 55–60. [Google Scholar]
  79. Karlsson, F.H.; Tremaroli, V.; Nookaew, I.; Bergström, G.; Behre, C.J.; Fagerberg, B.; Nielsen, J.; Bäckhed, F. Gut metagenome in European women with normal, impaired and diabetic glucose control. Nature 2013, 498, 99–103. [Google Scholar]
  80. Ley, R.E.; Bäckhed, F.; Turnbaugh, P.; Lozupone, C.A.; Knight, R.D.; Gordon, J.I. Obesity alters gut microbial ecology. Proc. Natl. Acad. Sci. USA 2005, 102, 11070–11075. [Google Scholar]
  81. Blaut, M. Gut microbiota and energy balance: Role in obesity. Proc. Nutr. Soc. 2015, 74, 227–234. [Google Scholar] [PubMed]
  82. Yu, D.; Richardson, N.E.; Green, C.L.; Spicer, A.B.; Murphy, M.E.; Flores, V.; Jang, C.; Kasza, I.; Nikodemova, M.; Wakai, M.H. The adverse metabolic effects of branched-chain amino acids are mediated by isoleucine and valine. Cell Metab. 2021, 33, 905–922.e906. [Google Scholar] [PubMed]
Figure 1. Effect of HFD supplementation on overall presentations of the gut microbiota structure (n = 5). Alpha-diversity was estimated with the Chao1 index (A) and Shannon index (B) on raw OTU abundance in ND- and HFD-fed subjects. Principal coordinate analysis (PCoA) was conducted on bacterial beta-diversity based on the Bray–Curtis dissimilarity of gut microbial populations by relative abundance (C), the results were based on the weighted UniFrac distance of bacterial communities from different regions (D). This was followed by taxonomic diversity, analyzed by the unweighted paired-group method with an arithmetic mean (UPGMA) (E). ND-fed subjects are shown in red, while HFD-fed animals are shown in blue.
Cells 14 00463 g001
Figure 2. Relative abundance of bacteria at the phyla and genus level (n = 5). Relative abundance of community at the phylum level (A). Changes in abundance of dominant community at the genus level in ND- and HFD-fed mice (B). The relative abundance of bacterial genera in different fecal samples is visualized by bar plots. Each bar represents a subject, and each colored box is a bacterial genus. The height of a color box demonstrates the relative abundance of that organism within the sample (C). A t-test was performed to assess the significance of the indicated classes. The bars represent the mean ± SEM and exact p-values are indicated in the text (* p < 0.05; ** p < 0.01; and *** p < 0.001).
Cells 14 00463 g002
Figure 3. ND and HFD resulted in different gut microbial clusters and different dominant bacteria in the fecal sample. In this study, 16S rRNA sequencing from the fecal samples was performed, and OTU data were subjected to a linear discriminant effect size (LEfSe) analysis (A). The cladogram represents the phylogenetic relationship of significant OTUs associated with each group (B). The heatmap of Spearman’s correlation analysis of relative abundances in the gut microbiome between ND and HFD groups is also shown above (C). For LefSe data, the alpha factorial Kruskal–Wallis test among classes was set to 0.05, and the threshold on the logarithmic LDA score for discriminative features was set to 3.
Cells 14 00463 g003
Figure 4. Differentially abundant genera and species in ND and HFD groups: heatmap of the proportion of OTUs determined to be dominant bacteria, with rows clustered by microbiota similarity according to the Euclidean distance, and columns clustered by OTUs occurring more often together (A); and core microbiome showing genera detected in high fractions in ND and HFD groups (B).
Cells 14 00463 g004
Figure 5. Correlation analysis of gut microbiome between ND and HFD groups and microbiome–metabolite interactions. Gut microbiome correlation network for genus classification is shown in (A). The nodes represented the taxa at the genus level according to the relative content between ND and HFD groups. The green color in the nodes represents the ND group, whereas the red color in the nodes represents the HFD group. The edges represent correlations between the taxon pairs. Interaction between gut microbiota at the species level and specific microbiota is shown in (B), in a diagram illustrating significant microbiome–metabolite associations. The nodes represent microbial taxa (green) and metabolites (purple), while the edges indicate significant positive correlations.
Cells 14 00463 g005
Table 1. Enriched KEGG pathways.
Metabolic Pathway (KEGG)TotalExpectedHitsp-ValueFDRFeatures
Pentose phosphate pathway350.045320.0008530.156C00672
Phenylalanine, tyrosine, and tryptophan biosynthesis350.045320.0008530.156C00673
Sulfur relay system110.014210.01421C01302
Valine, leucine, and isoleucine biosynthesis230.029810.02941C04272
Pantothenate and CoA biosynthesis280.036210.03571C04272
Thiamine metabolism310.040110.03941C04752
Sulfur metabolism330.042710.04191C00979
Zeatin biosynthesis390.050510.04941C00979
Folate biosynthesis570.073810.07151C01300
Cysteine and methionine metabolism630.081510.07871C00979
KEGG pathways were explored using Gene set enrichment analysis (GSEA) 2.0. Each metabolite pathway shows the p-value after the false discovery rate (FDR) and other features. For each pathway, an FDR is analyzed, and the value represents the statistical significance of the enrichment. By using GSEA user guidelines, our experimental condition suggested a threshold of significance FDR #0.05. Due to the exploratory nature of this study, we took a more conservative approach to the threshold of significance (FDR# 0.01). Leading-edge analysis was also used in case of overlapping of various pathways.
Disclaimer/Publisher’s Note: The statements, opinions and data contained in all publications are solely those of the individual author(s) and contributor(s) and not of MDPI and/or the editor(s). MDPI and/or the editor(s) disclaim responsibility for any injury to people or property resulting from any ideas, methods, instructions or products referred to in the content.

