1. Introduction
Vesicle fusion is a critical event in the life of every cell: protein sorting, membrane assembly, mitosis, ER/Golgi trafficking and secretion depend upon it. It is the basis of hormone and neurotransmitter release, though there is not yet a deep understanding of the functional pathway of vesicle fusion events at the level of physical forces involved in the mechanism of release.
It has been suggested that vesicle swelling is involved in the exocytotic process [
1,
2,
3]. In secretory vesicles, a specific set of ion channels expressed in the membrane has been proposed to contribute to the secretory granule swelling [
4,
5,
6,
7,
8]. In isolated zymogen granules from exocrine pancreas and parotid glands, Cl
2 and K
+ ion channels have been found expressed and shown to be involved in swelling [
9]. Gαi3 protein has been suggested as major regulator of the swelling process since it is implicated in the regulation of both channels [
6,
10,
11,
12,
13,
14,
15,
16,
17,
18]. Similarly, Go protein has been identified at the synaptic vesicle membrane and is involved in swelling induced by active mastoparan—an amphiphilic tetradecapeptide from wasp venom—which has been demonstrated to activate the GTPase activity of Go/i proteins [
19,
20,
21].
During the secretory process, the general assumption is that increase in vesicle volume is required for the expulsion of intravesicular content. Vesicle swelling implies rapid water entry into the vesicle, likely triggered by a local osmotic gradient. Worthy of interest, members of the aquaporin water channel family have been identified in zymogen granules in rat pancreatic acinar cells (AQP1) [
4], in secretory granules in rat parotid acinar cells (AQP5) [
22] in synaptic vesicles from rat brain (AQP1 and AQP6) [
5] and in intracellular vesicles in rat kidney (AQP6) [
23]. These observations suggest that AQPs in secretory granules and vesicles may mediate their volume regulation [
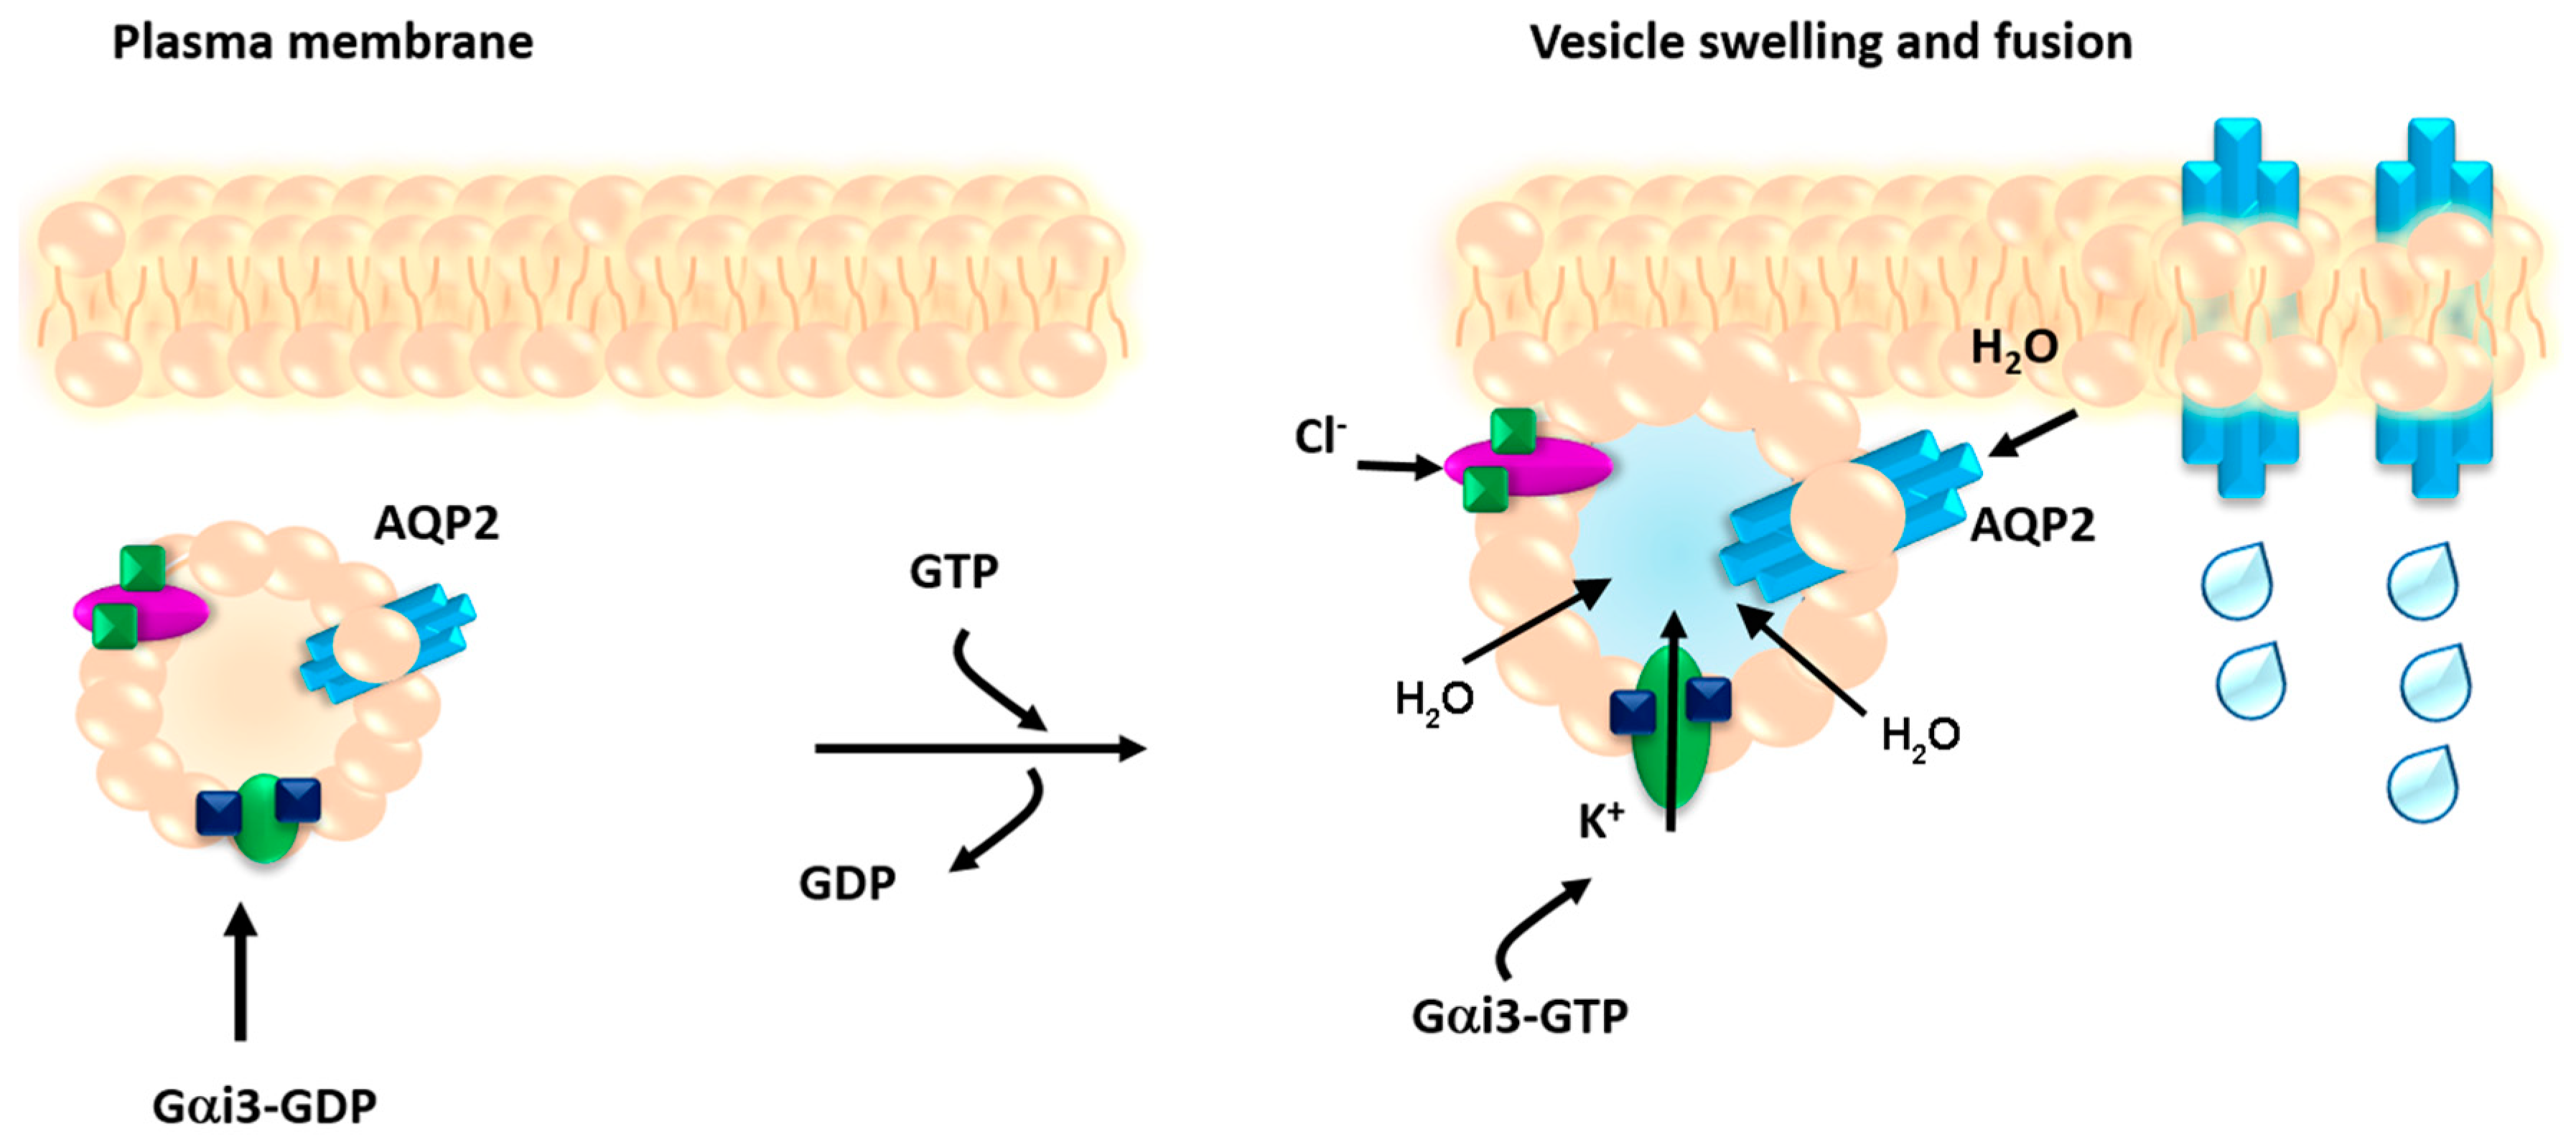
24]. The proposed hypothesis for regulation of secretory vesicle swelling and fusion to the plasma membrane implies that the Gi protein expressed on the vesicle membrane activates associated Cl
2 and K
+ channels causing ion entry, thus creating an osmotic gradient resulting in AQP-mediated water flow into the vesicle lumen resulting in vesicle swelling and subsequent fusion at the plasma membrane [
6].
Among the known aquaporins, the vasopressin-sensitive AQP2 is also expressed in intracellular vesicles that traffic to the apical membrane in response to vasopressin stimulation a process essential to maintain water homeostasis. Specifically, in renal collecting duct principal cells, the primary cellular targets of vasopressin are V2 receptors coupled to adenylyl cyclase via the cholera toxin-sensitive G protein Gs; activation of this pathway leads to an increase in intracellular cAMP levels and activation of cAMP-dependent protein kinase. The signalling cascade activated by vasopressin includes AQP2 phosphorylation, intracellular calcium mobilization and RhoA dependent actin depolymerization, playing a key role in the translocation of AQP2 bearing vesicles and insertion of the AQP2 water channel into the apical membrane [
25,
26,
27].
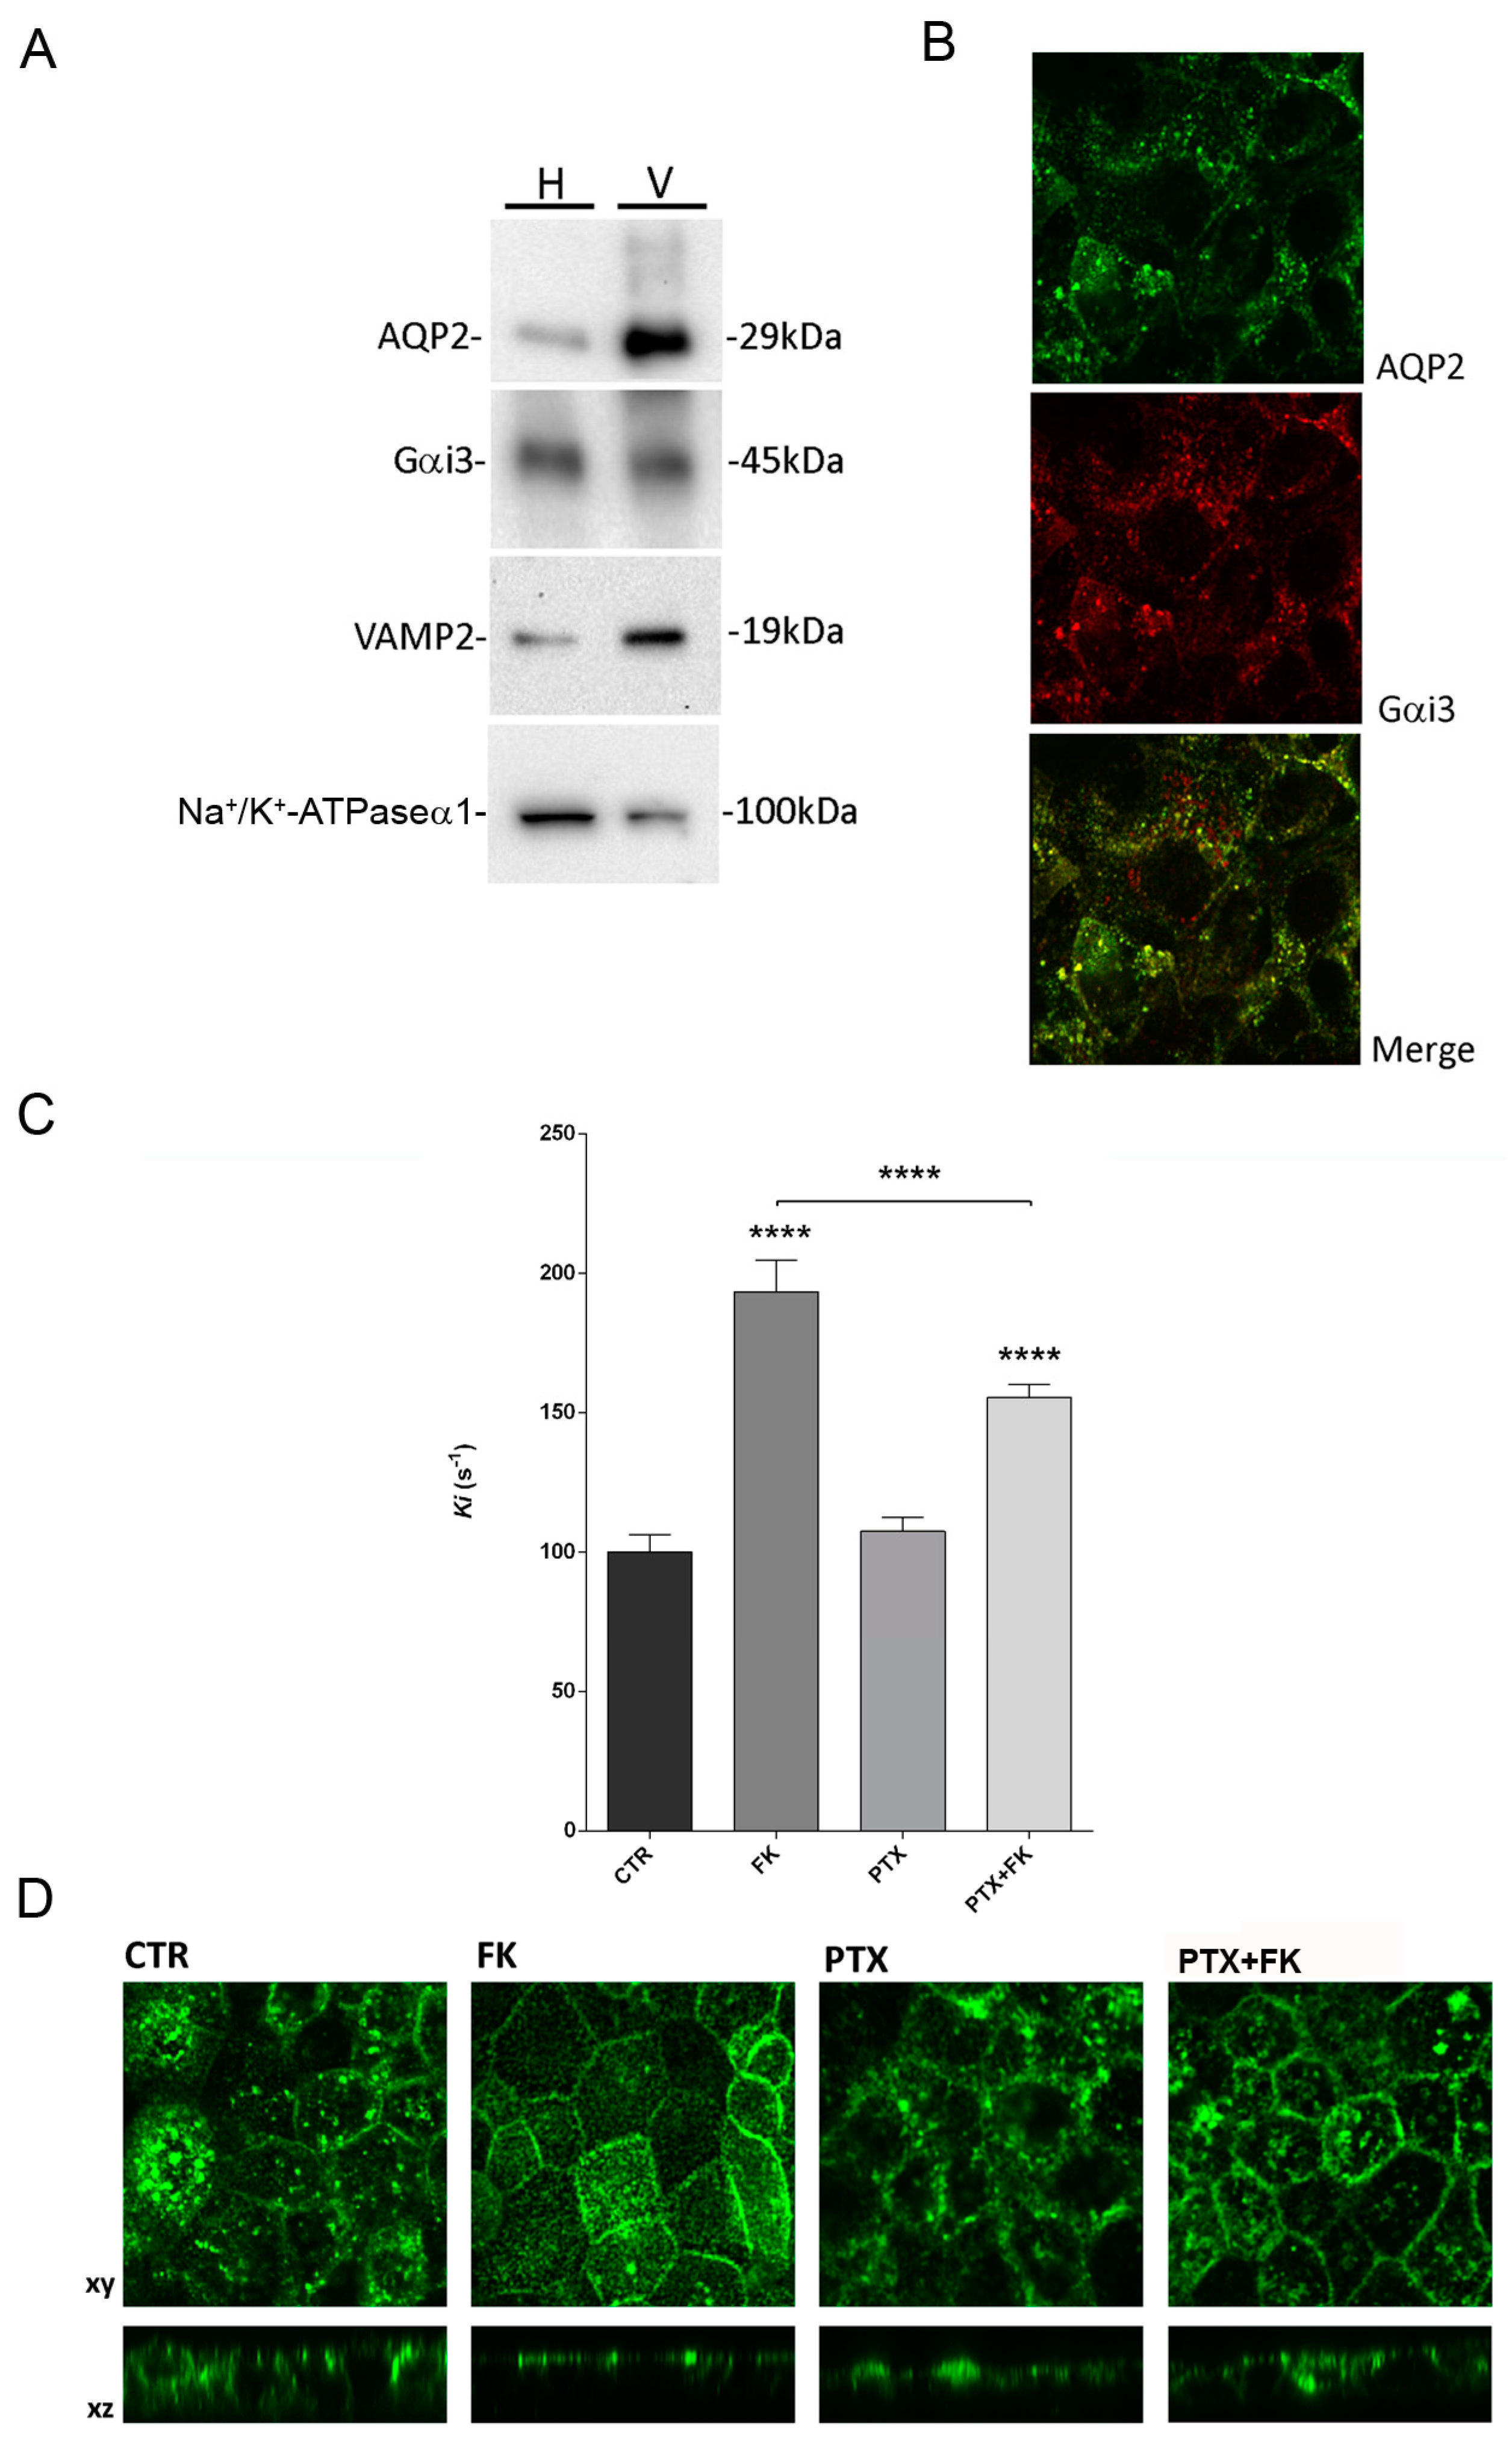
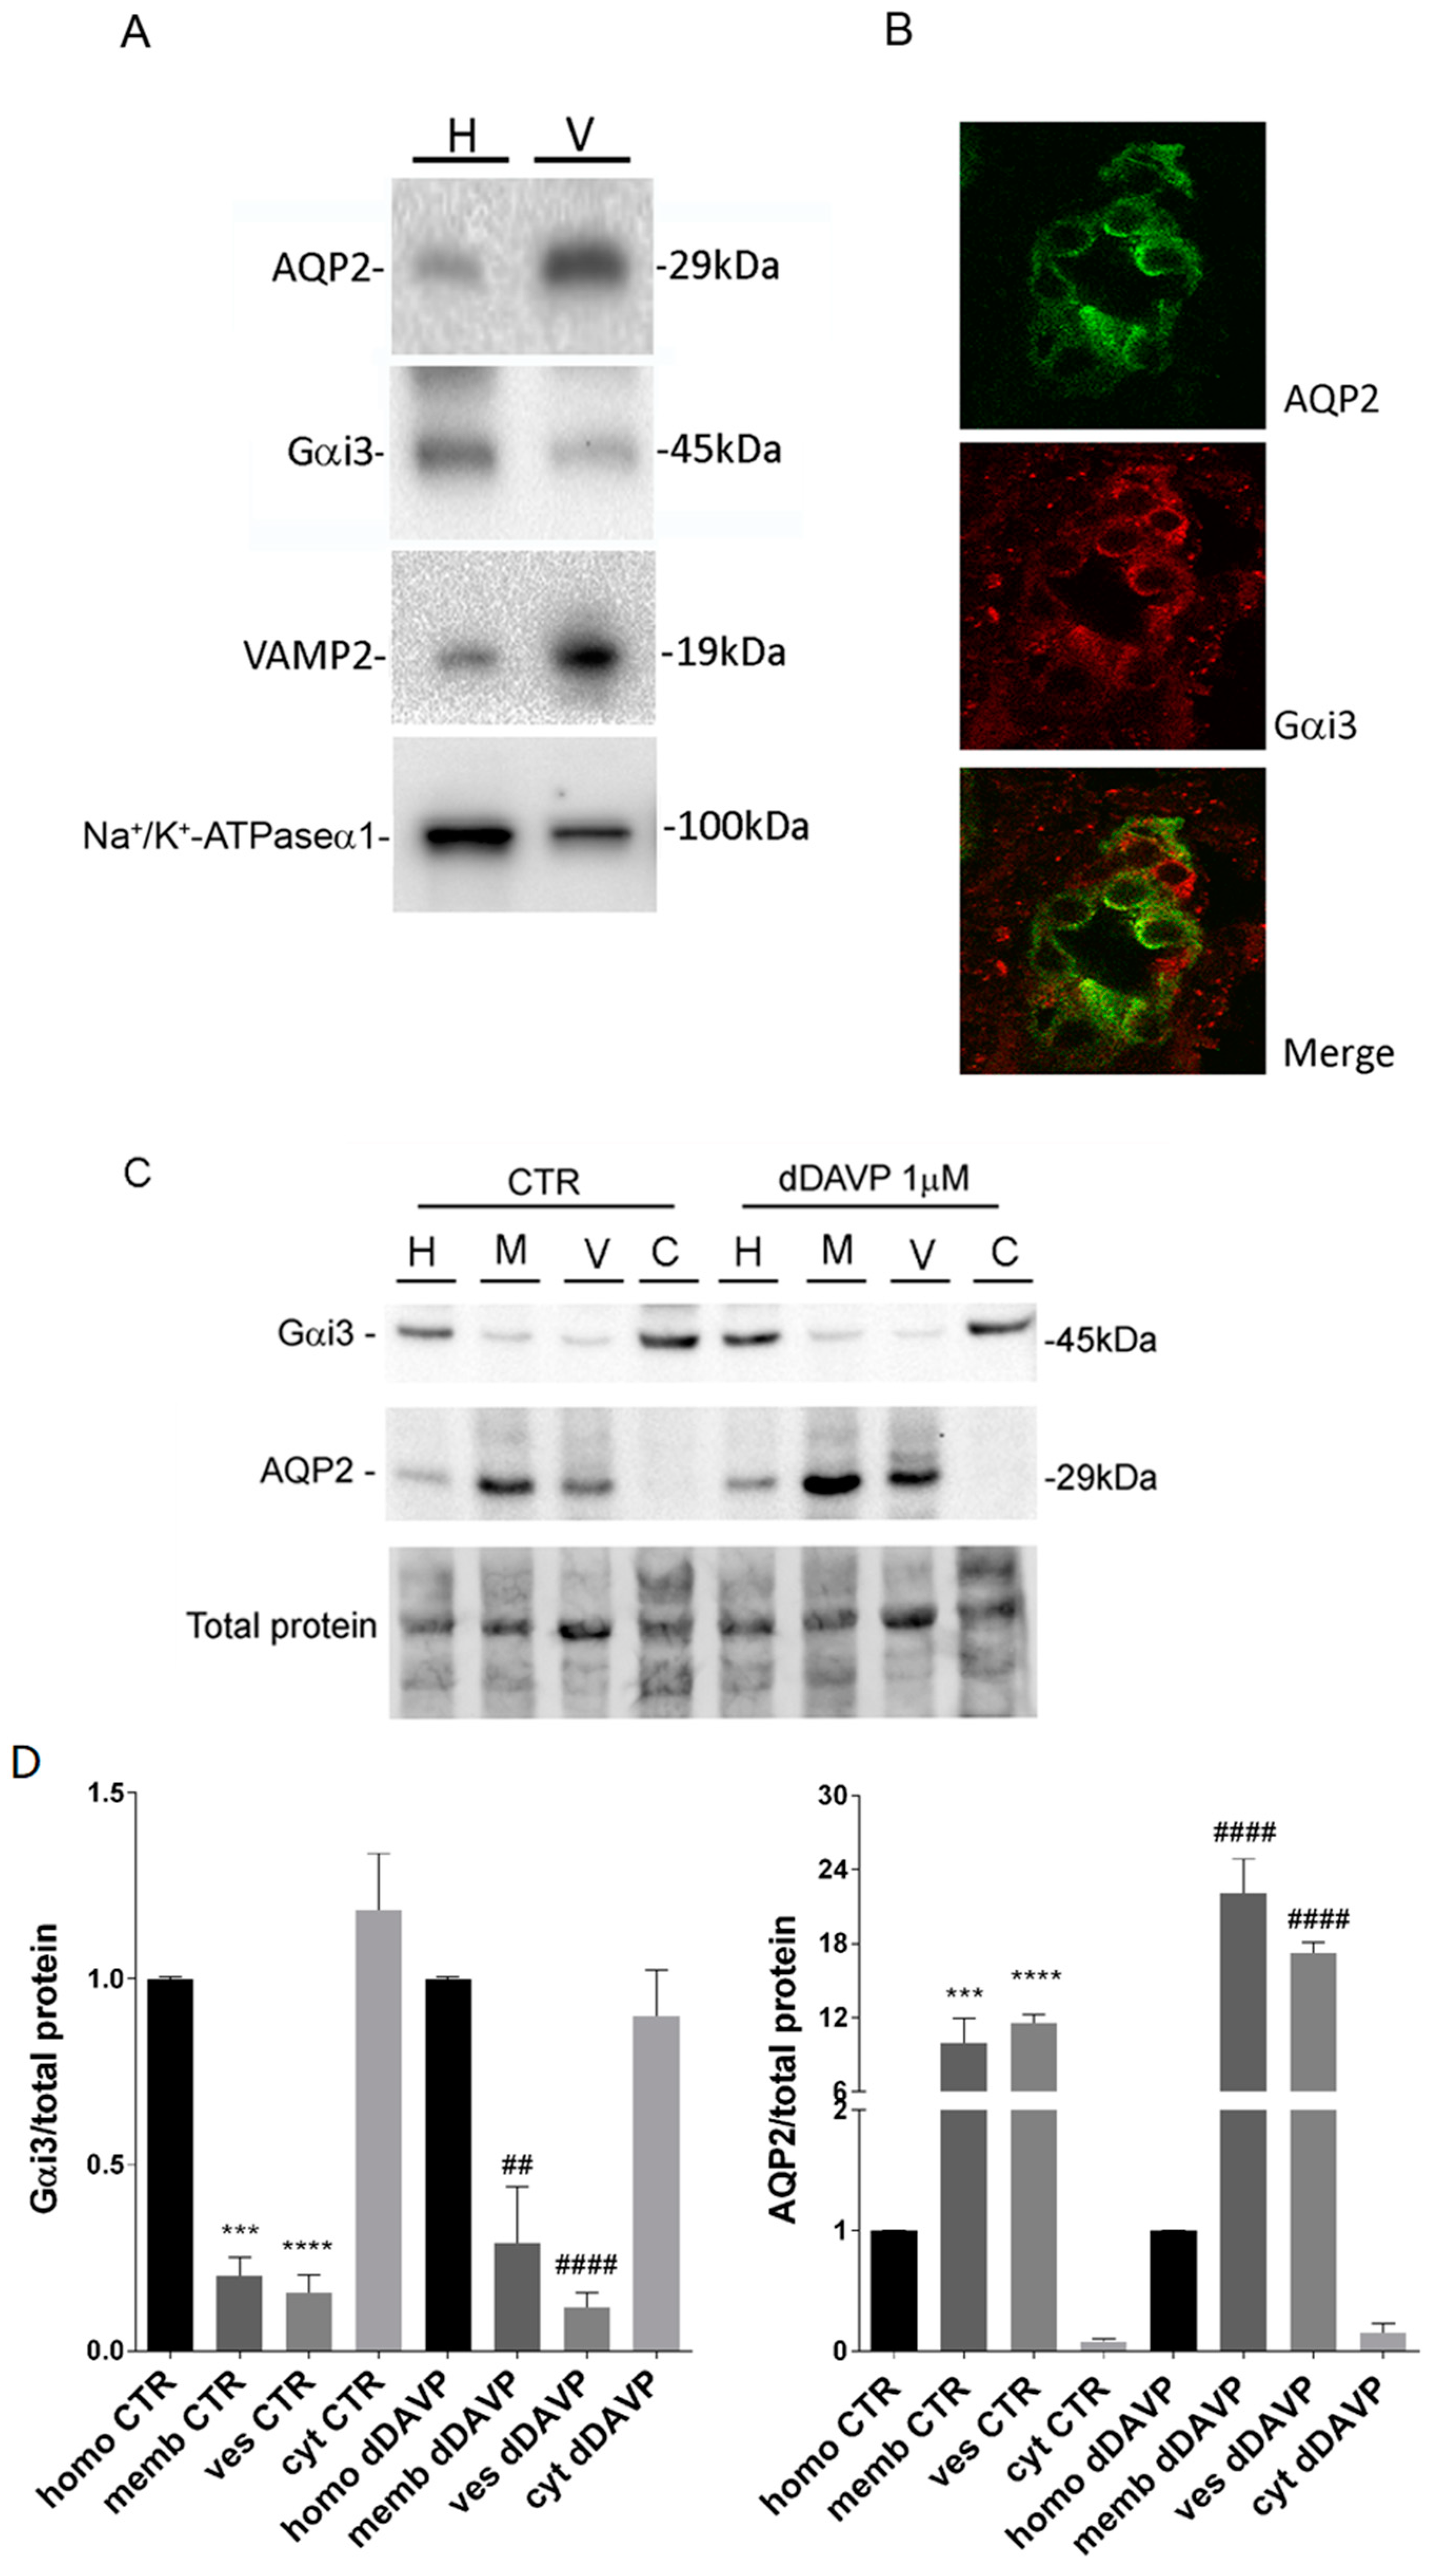
While AQP2 vesicles do not secrete their content our previous study demonstrated that, as for secretory vesicles, a member of the Gi family, Gαi3, is co-expressed with AQP2 in subapical vesicles and is required for fusion [
28]. In fact, treatment of collecting duct cells with pertussis toxin (PTX) which ADP-ribosylates and thereby uncouples G proteins of the Gi and Go types from their cognate receptors, inhibited both the vasopressin-induced increase in water permeability and the redistribution of AQP2 from an intracellular compartment to the apical membrane [
28]. This finding suggest the hypothesis that Gαi3 might regulate an ion channel gating promoting osmotic AQP2 vesicle swelling and fusion to the plasma membrane.
The present study was therefore undertaken to address the question of whether vesicle swelling is also a prerequisite for fusion of AQP2 vesicles committed to insert a channel into the plasma membrane.
2. Materials and Methods
2.1. Materials
Calcein green-AM was obtained from Life Technologies (Monza, Italy). 4,4′-Diisothiocyanatostilbene-2,2′-disulfonic acid disodium salt (DIDS), quinidine, mercury(II) chloride, desmopressin (dDAVP) and Protein A-Sepharose® from Staphylococcus aureus were purchased from Sigma (Sigma-Aldrich, Milan, Italy). Forskolin was obtained from Fermentek Biotechnology (Jerusalem, Israel). Pertussis Toxin was purchased from Enzo Life Sciences Biotechnology (Farmingdale, NY, USA). Biocytin Hydrazide and streptavidin beads were purchased from EZ-Link® Pierce (Rockford, IL, USA).
2.2. Antibodies
AQP2 was detected using a specific antibody (C-tail Ab) raised against a synthetic peptide corresponding to the last 15 C-terminal amino-acids of human AQP2 [
29]. Monoclonal Gαi3 antibody recognizing amino-acid 339–354 at the C-terminus was purchased from Santa Cruz Biotechnology (Dallas, TX, USA). Anti-Potassium Channel TASK-2 (Kcnk5) was bought from Sigma. Anti-Na
+/K
+-ATPase subunit alpha 1 (clone C464.6) was from Millipore (Milano, Italy). Antibody anti-ClC-K (#ACL004) was from Alomone Labs (Jerusalem, Israel). Antibody against VAMP2 was a kind gift from Professor J.E. Pessin [
30]. Secondary goat-anti-rabbit-IgG and anti-mouse-IgG antibodies conjugated to Alexa Fluor 488 were from Molecular Probes, Eugene, OR, USA.
2.3. Cell Culture
Mouse Cortical Collecting Duct cells (MCD4), stably expressing human AQP2, generated as described elsewhere [
31], were grown in Dulbecco’s modified Eagle’s medium (DMEM/F12) supplemented with 5% fetal bovine serum, 2 mM
l-glutamine, 100 i.u./mL penicillin, 100 µg/mL streptomycin and 5 µM dexamethasone at 37 °C in 5% CO
2.
2.4. Preparation of Membrane Vesicles
Vesicles were prepared from rat kidney papillae or MCD4 cells. The inner medulla from rat kidney slices were excised and cut in small pieces. These pieces or MCD4 cells were homogenized manually with a mini-potter in ice-cold Isolation medium (220 mM mannitol, 70 mM sucrose, 5 mM EGTA, 1 mM EDTA, 20 mM Tris-HCl pH 7.4). Nuclei and mitochondria enriched fractions were removed by centrifugation at 8000× g for 20 min while membrane was removed by centrifugation at 17,000× g for 1 h. The supernatant was spun at 200,000× g in a Beckman Rotor TLA 120.1 for 1 h at 4 °C. The final pellet, enriched in intracellular vesicles, was gently resuspended in Isolation medium using a 30-gauge needle and used for experiments.
2.5. Gel Electrophoresis and Western Blotting
Proteins were separated on 10% or 13% bis-tris acrylamide gels under reducing conditions. Protein bands were electrophoretically transferred onto Immobilon-P membranes (Millipore Corporate Headquarters, Billerica, MA, USA) for Western blot analysis, blocked in TBS-Tween-20 containing 3% BSA and incubated with primary antibodies overnight. Immunoreactive bands were detected with secondary antibody conjugated to horseradish peroxidase (HRP) obtained from Santa Cruz Biotechnologies (Tebu Bio, Milan, Italy). Membranes were developed using SuperSignal West Pico Chemiluminescent Substrate (Pierce, Rockford, IL, USA) with Chemidoc System (Bio-Rad Laboratories, Milan, Italy). Representative figures are shown. Densitometry analysis was performed with Scion Image. Data are summarized in histograms with GraphPad Prism (Graphpad Software Inc. La Jolla, CA, USA).
2.6. Immunofluorescence
MCD4 cells were grown on polyester Transwell inserts and incubated in the absence or in the presence of PTX (2 µg/mL) for 3 h at 37 °C and either stimulated with 100 µM forskolin for 30 min or left under basal conditions and then fixed using 4% paraformaldehyde in phosphate-buffered saline (PBS). To test the effect of quinidine, in a set of experiments cells were preincubated with 10 µM quinidine for 45 min before stimulation with forskolin. Cells were permeabilized with 0.1% Triton X-100 in PBS for 5 min and nonspecific binding sites were blocked with 1% bovine serum albumin in PBS at room temperature for 1 h. Cells were then incubated with specific antibodies for 2 h at 37 °C. After washing in PBS, cells were incubated with the appropriate fluorescent secondary antibodies for 30 min at room temperature, washed in PBS and mounted on glass slides with Mowiol.
For protein localization in renal tissue, rat kidneys were fixed by immersion in 4% paraformaldehyde in PBS at 4 °C overnight, cryopreserved in 30% sucrose in PBS for 12 h and then embedded in optimal cutting temperature medium. Sections, 5 μm thick, were prepared using a cryostat (CM 1900; Leica, Germany) collected at −20 °C and stored on positively charged glass slides (Thermo Scientific, Waltham, MA, USA). Serial sections, were rehydrated and subjected to immunofluorescence analysis. Nonspecific binding sites were blocked with 1% bovine serum albumin in phosphate-buffered saline (PBS) for 30 min at room temperature. Sections were then incubated with the primary antibodies AQP2 and Gαi3 overnight at 4 °C in saturation buffer. After washing in PBS, sections were incubated with the appropriate AlexaFluor-conjugated secondary antibodies (Life Technologies) for 30 min at room temperature washed and mounted onto glass slides with Mowiol.
Confocal images were obtained with a confocal microscope (TSC-SP2, Leica; Wetzlar, Germany).
2.7. Water Permeability Video Imaging Measurements
Osmotic water permeability was measured by Video Imaging experiments. MCD4 cells were grown on 40 mm glass coverslips and loaded with 10 µM membrane permeable Calcein green-AM for 45 min at 37 °C, 5% CO2 in DMEM. Cells were incubated in the absence or presence of PTX (2 µg/mL) for 3 h at 37 °C and either stimulated with Forskolin (100 µM) for 30 min or left under basal conditions.
Alternatively, cells were grown as described before and were left under basal condition or stimulated with 100 µM Forskolin for 30 min, 10 µM quinidine for 45 min or 100 µM Forskolin and 10 µM quinidine.
The coverslips with dye-loaded cells were mounted in a perfusion chamber (FCS2 Closed Chamber System, BIOPTECHS, Butler, PA, USA) and measurements were performed using an inverted microscope (Nikon Eclipse TE2000-S microscope) equipped for single cell fluorescence measurements and imaging analysis. The sample was illuminated through a 40× oil immersion objective (numerical aperture NA = 1.30). The Calcein Green-AM loaded sample was excited at 490 nm. Emitted fluorescence was passed through a dichroic mirror, filtered at 515 nm (Omega Optical, Brattleboro, VT, USA) and captured by a cooled ECCD camera (CoolSNAP HQ, Photometrics, Tucson, AZ, USA). Fluorescence measurements, following iso- (290 mOsm; 140 mM NaCl, 5 mM KCl, 1 mM MgCl2, 1 mM CaCl2, 10 mM Hepes, 5 mM Glucose) or hyperosmotic (460 mOsm; isoosmotic solution added with 135 mM Mannitol) solutions, were carried out using Metafluor software v7.8.1.0 (Molecular Devices, MDS Analytical Technologies, Toronto, ON, Canada). The time course of cell shrinkage was measured as time constant (Ki, s−1), a parameter directly correlated to membrane water permeability. Statistical Analysis Data are reported as mean values ± S.E.Ms.
Statistical analysis was performed by one-way ANOVA (Analysis of Variance) followed by Newman-Keuls Multiple Comparison test with P.
2.8. Fluorescence Vesicles Swelling Assay
A fluorescence based assay of vesicles volume changes was carried out using a benchtop fluorescence plate reader with integrated liquid handling (FlexStation 3, Molecular Devices, MDS Analytical Technologies, San Jose, CA, USA) equipped to analyse real time fluorescence kinetic data in the 96-well format. The instrument consists of an incubated cabinet with fluorometer and integrated 96 channel pipettor which can transfer compounds from one microplate to the assay plate, allowing rapid kinetic assays.
A 96-well black walled microplate (Corning-Costar Corp., Corning, NY, USA) was pre-treated with Cultrex Basement Membrane Extract (BME) at 37 °C for 1 h to form a reconstituted basement membrane, then the excess was removed and vesicles (1 µg/µL) were seeded in the wells and incubated at 37 °C for 1 h. After that, the wells were washed with PBS to remove the unattached vesicles, replaced with K-MES buffer (100 mM Mes, 25 mM KCl, pH 6.5) and incubated with 67 µM R18 (Octadecyl Rhodamine B chloride, Biotium, Fremont, CA, USA) for 5 min at 37 °C. After rinsing in K-MES buffer, the 96-well plate was transferred into the plate-reader for the fluorescence assay. Fluorescence signal from vesicles, labelled with R18 at self-quenching concentration, was excited at 560 nm and detected at 590 nm. Fluorescence in each well was recorded continuously for 25 s (baseline), then for 50 s after rapid automated addition of 20 µM of Mas7 (diluted in K-MES). R18 fluorescence signal is directly related to vesicles volume changes.
Data acquisition was performed using SoftMax Pro software v5.3 (Molecular Devices, MDS Analytical Technologies, San Jose, CA, USA) and the data were analysed with Prism software (GraphPad software, San Diego, CA, USA). The time constant of vesicle volume variation was obtained by fitting the data to an exponential function.
2.9. Electron Microscopy
For electron microscopy, re-suspended vesicle fractions were fixed in 2.5% glutaraldehyde in 0.1 M in PBS, at pH 7.4, for 2 h at 4 °C. A drop of 5 μL of vesicle fractions were put on clean Parafilm and the grids (Formvar-carbon coated, 200 mesh Ni), were floated on the drop with their coated side facing the suspension for 10 min. The grids were transferred first to the drops of washing buffer PBS for 3 min and subsequently on the fresh drops of distillated water and washed for 4 min. For contrast enhancement, the grids were put on the 50 μL drop of 2% uranyl acetate. After the excess fluid was blotted from the grids by filter paper they were observed under an electron microscope.
2.10. Atomic Force Microscopy
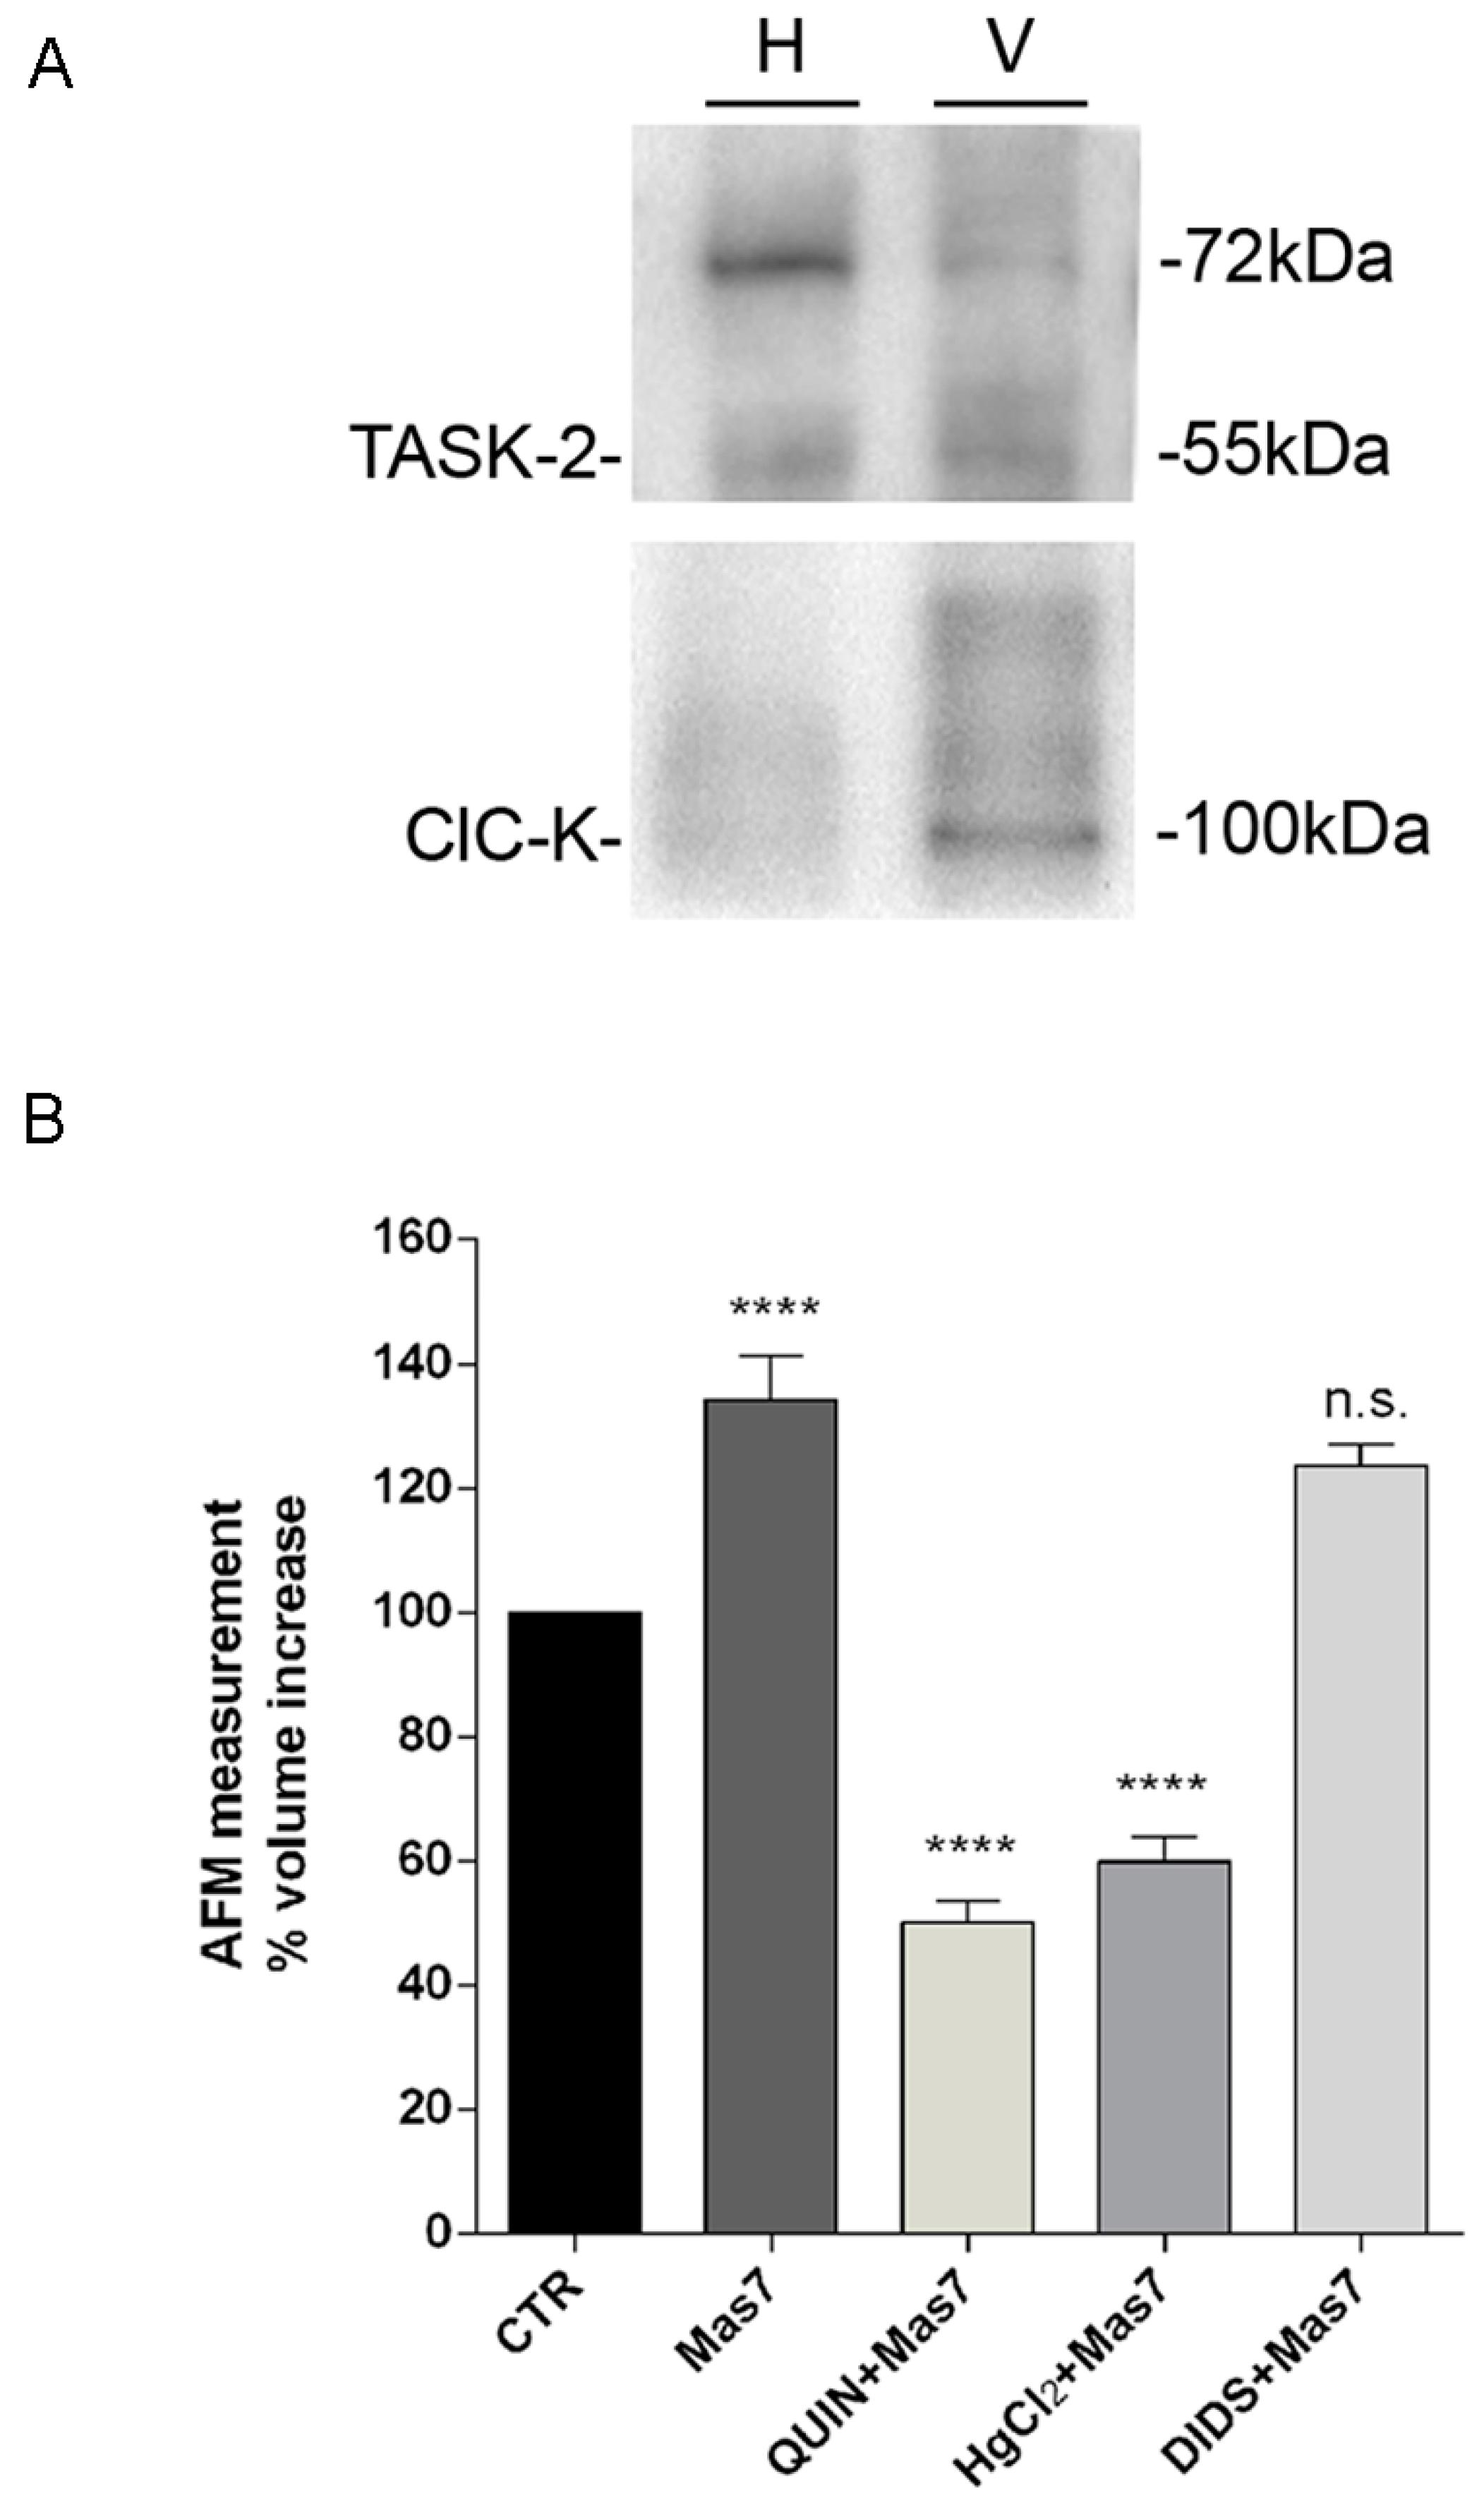
AFM was used to obtain images of the vesicles topography. In an AFM a very sharp tip, attached to a flexible lever, interacts with the sample surface providing information on its morphology. Data were acquired using a Multimode VIII equipped with a Nanoscope V controller (Bruker) with the probe and the sample immersed in liquid. The AFM was operated in tapping mode with a lever oscillating at a frequency of 7 kHz (k = 0.24 N/m, SNL-10 Bruker, Berlin, Germany) to avoid sample damage. Few drops of a solution containing isolated vesicles were placed on freshly cleaved mica. The mica disk was placed in a humid chamber for 15 min to allow the vesicles to deposit. Then, the sample was washed with K-MES buffer to remove the unattached vesicles and was placed on the AFM stage. Vesicles were left under basal condition using K-MES buffer (100 mM Mes, 25 mM KCl, pH 6,5), or pre-treated with quinidine (0.5 mM) or DIDS (10 µM) or HgCl2 (0.3 mM) for 3 min and the sample topography was imaged. These images were considered as control images, then Mas7 (20 µM diluted in K-MES) was added and the same area on the sample was imaged to evaluate variations in the topography. An ‘ad hoc‘ algorithm was elaborated to analyse the same area before and after the addition of a given drug and calculation of each vesicle diameter, height and volume.
The structural features of each individual vesicle (centroid, isocontours elliptically shaped, volume, diameter, amplitude) were obtained by least-squares fitting of the AFM data using a two-dimensional elliptical Gaussian function:
where Z
0 is the baseline, A is the height of the peak, (x
0, y
0) is the centroid position of the vesicle, (α
x, α
y) represent the standard deviation of the peak and cor is the cross-correlation term respectively. The cor parameter ranges between −1 to 1 and is related to the asymmetry of the vesicle: a centro-symmetric vesicle has a cor value equal to zero. The vesicle profile estimation, by a two-dimensional elliptical Gaussian non-linear fit function, allows volume calculation of each vesicle using the following expression:
2.11. Membrane Fusion Assay
Membrane fusion assay was performed as described [
32]. Briefly, vesicles (120 μg) were resuspended in 600 μL of K-MES buffer (100 mM Mes, 25 mM KCl, pH 6.5) and incubated with 2 µL of a 20 mM stock solution of R18 (Octadecyl Rhodamine B chloride) for 5 min at 37 °C. The mixture was centrifuged at 900×
g for 10 min and the obtained pellet was resuspended in 400 μL of K-MES buffer. Thus, fluorescence signal from vesicles, labelled with R18 at self-quenching concentration, was recorded using a fluorimeter (RF-5301PC, Shimadzu Corporation, Kyoto, Japan) at excitation and emission wavelengths of 560 and 590 nm, respectively.
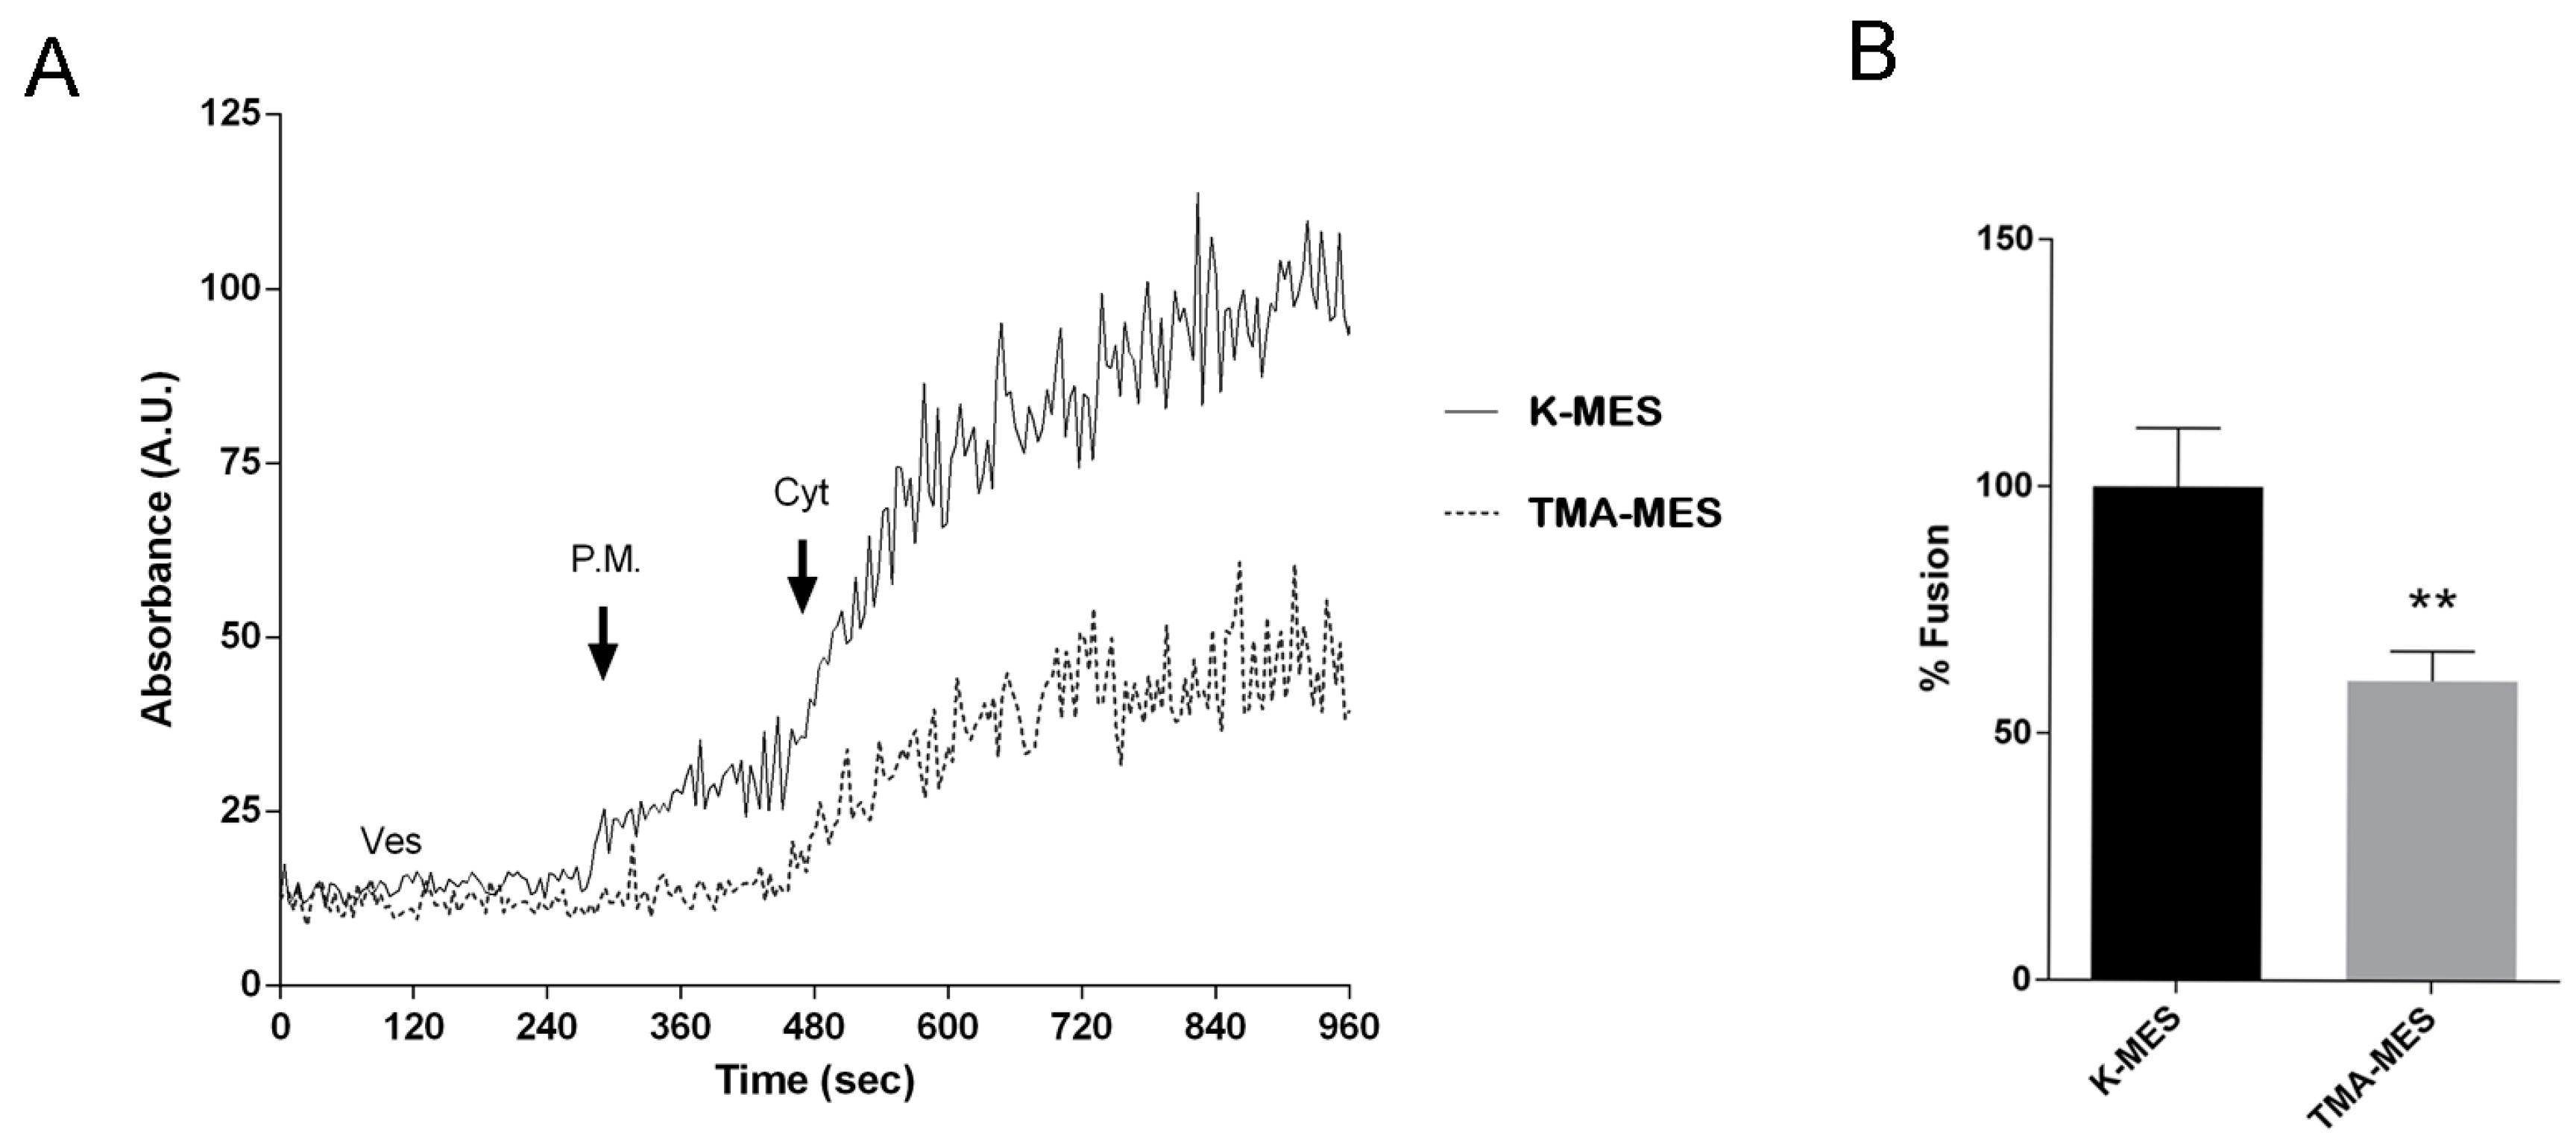
After 2 min vesicles were left under basal condition or incubated with 0.3 mM HgCl2 or 0.5 mM quinidine for 3 min under continuous stirring. Later, unlabelled plasma membrane (20 μg) fractions were added and fluorescence was recorded for additional 2 min under continuous stirring. Addition of cytosol (200 μg) lead to an increase of fusion due to a relief of R18 self-quenching and an increase of fluorescence signal.
To test whether chemical K+ gradient is the driving force promoting vesicle swelling as a consequence of TASK-2 gating, a set of experiments have been performed in TMA-MES buffer (100 mM MES, 25 mM Tetramethylammonium chloride, pH 6.5) instead of K-MES thus with a solution having the same osmolality as K-MES in which K+ ions have been substituted with TMA. This substitution abrogates the inwards K+ gradient (from outside to the vesicle lumen).
2.12. Apical Surface Biotinylation
MCD4 cells were cultured on 6-well filters for 4 days and were left under basal condition or stimulated with 100 µM Forskolin for 30 min, 10 µM quinidine for 45 min or 100 µM Forskolin and 10 µM quinidine.
Cells were washed thoroughly with ice cold Coupling Buffer (0.1 M NaPO3, 0.15 M NaCl in PBS, pH 7.2) before being subjected to oxidation with Na-meta-periodate 20 mM in Coupling Buffer for 30 min on ice in the dark. Following three rounds of washing with Coupling Buffer, cell surface glycoproteins were labelled with 5 mM Biocytin Hydrazide (EZ-Link® Pierce) for 30 min.
The biotinylation buffer was removed, cells were incubated with Quenching Solution (50 mM NH4Cl in PBS, pH 7.2) for 5 min and washed three times with Coupling Buffer. Cells were solubilized with lysis buffer (1% Triton-X 100, 0.01% SDS in PBS), in the presence of proteases (1 mM PMSF, 2 mg/mL leupeptin and 2 mg/mL pepstatin A) and phosphatases (10 mM NaF and 1 mM sodium orthovanadate) inhibitors. The lysates were homogenized using ultrasonic homogenizer at 40 Hz for 20 s and centrifuged at 12,000× g for 20 min. An aliquot of the supernatants (20 μL) was diluted in Laemmli buffer while the remaining biotinylated proteins were pulled down with immobilized streptavidin beads for 1 h under rotation at 4 °C. The complexes were washed 3 times with wash Buffer (0.5% Triton-X 100, 0.01% SDS in PBS), denatured in Laemmli buffer for 10 min at 95 °C and analysed by SDS-PAGE and immunoblotted.
2.13. 1H-NMR Spectroscopy
NMR measurements were performed on a Bruker AVANCE 300 Wide Bore spectrometer (Berlin, Germany) working at 300 MHz on
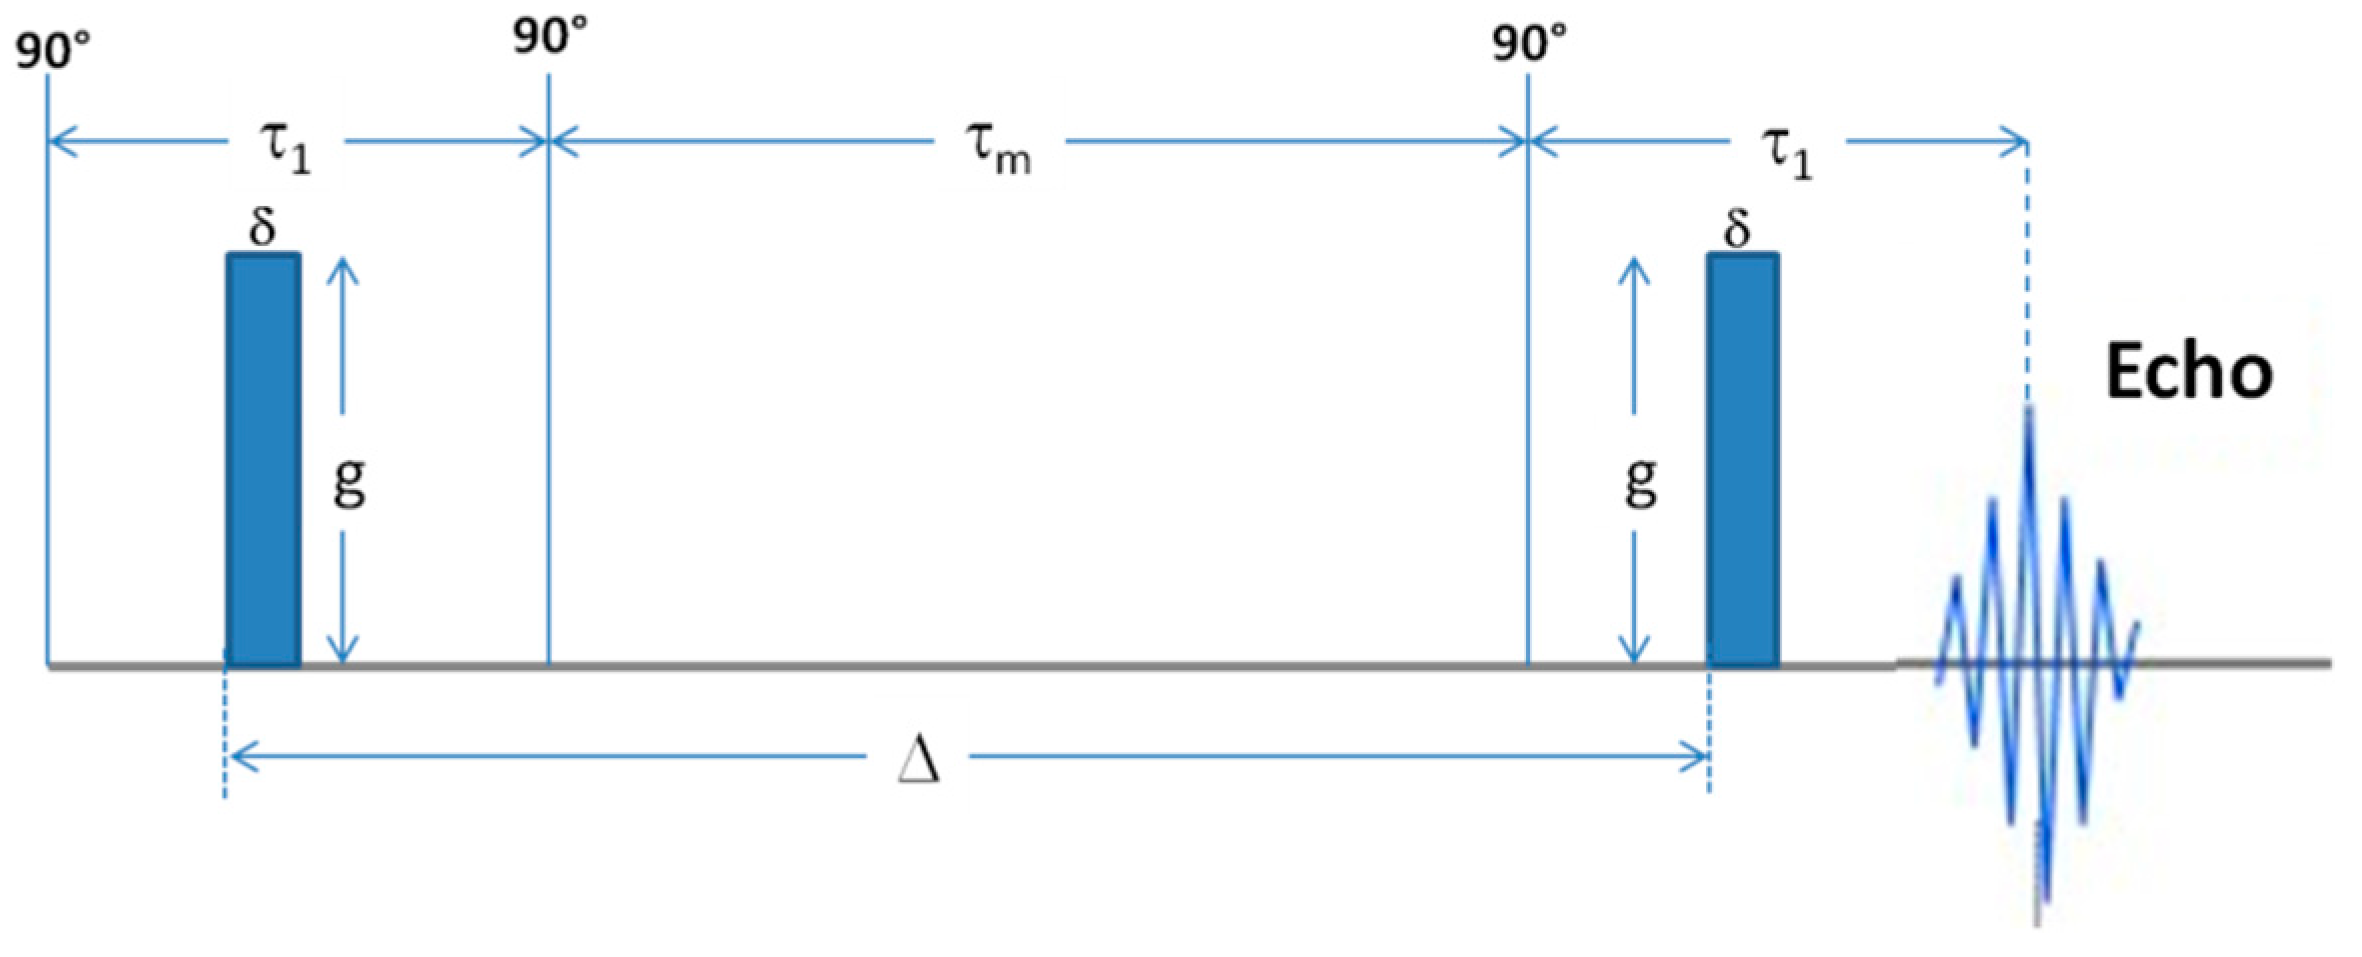
1H. The employed probe was a Diff30 Z-diffusion 30 G/cm/A multinuclear with substitutable RF inserts, suitable to measure the self-diffusion coefficients by the Pulsed Field Gradient (PFG) method. Specifically, the PFG-stimulated-echo (PFG-STE) sequence (see
Scheme 1) [
33], used in this work, consists of three 90° rf pulses (π/2-τ
1-π/2-τ
m-π/2) and two gradient pulses (with magnitude g, duration δ and time delay Δ) that are applied after the first and the third rf pulses, respectively. The echo is found at time τ = 2τ
1 + τ
m.
The FT echo decays were analysed by means of the relevant Stejskal–Tanner expression:
I and I0 represent the intensity/area of a selected resonance peak in the presence and in absence of gradients, respectively. β is the field gradient parameter, defined as ; D is the measured self-diffusion coefficient. For the samples analyzed, the used experimental parameters were Δ = 20 ms, δ = 1 ms and the gradient amplitude, g, varied from 10 to 300 G cm−1 incremented in 10 steps. The number of scans was 8. Based on the repeatability of the measurements and on the very low standard deviation of the fitting curve, the uncertainty on the self-diffusion measurements is less than 0.5%.
1H spectra were obtained by applying the Fourier transform to the resulting free-induction decay (FID) of a single π/2 pulse sequence, with a pulse length of 10 µs. The spin-lattice relaxation time (T1) was also measured by the inversion recovery sequence to set the delay time after each acquisition scan. T1 was find to be quite long, that is, 2.3 s, however, to quickly conduct diffusion measurements, a delay time of 3 s was used. Spectra and diffusion measurements were performed at RT on the vesicles sample before the addition of the Mas7 and soon after. Spectra were referenced against pure water set at 0 ppm and were acquired with the same number of scans (8 scans), in order to compare their intensities. The process was followed for more than one hour.
Isolated vesicle suspension was prepared and allowed to sediment in ice, the supernatant removed to achieve a very dense vesicle suspension for NMR analysis. About 200 µL of vesicles suspension was inserted into the 5 mm NMR tube using a syringe; 1H spectra and diffusion measurements were acquired (data at time t = 0); next 25 µL of Mas7 (20 μM) was added in the tube and gently mixed with a syringe. A proton spectrum was acquired and a D measurement was recorded very quickly (data at time t = 1 min). D measurements and spectra acquisitions were executed in succession for circa 60 min.
2.14. Measurement of Intravesicular K+ Concentration
To measure intravesicular K+ concentration, 400 μL of vesicle suspension (containing 940 μg of proteins) were spun at 200,000× g in a Beckman Rotor TLA 120.1 for 1 h at 4 °C. Pelletted vesicles were resuspended in distilled water and sonicated at 60 Hz for 20 s, to disrupt vesicular structure. The suspension was spun at 200,000× g for 1h at 4 °C, to remove the membrane vesicles and the obtained supernatant (at final volume of 1 mL with distilled water), was used to measure the intravesicular K+ concentration.
The determination of K
+ in the samples was carried out utilizing Inductively Coupled Plasma Mass Spectrometry (Elan DRC-e ICP-MS instrument Perkin-Elmer SCIEX, Norwalk, CT, USA). The sample delivery system was as previously described [
34]. Quantitative analysis was performed processing the calibration curve of K
+. Briefly, 250 µL of sample was transferred into a graduate polypropylene test tube, diluted to 50 mL with ultrapure water and stabilized with HNO
3 65%. Blank was prepared in the same way. The calibration standards were prepared by dilution of a Multielement Calibration Standard 3 containing Potassium at 10 mg/L. The calibration curve of potassium was obtained processing six points at different concentration in the calibration range of 10–2000 µg/L. The HNO
3 65% used for the preparation of samples and calibration standards was Suprapur (Merck, Darmstadt, Germany). The water, with a resistivity of 18.2 MΩcm, was obtained from a Milli-Q plus system (Millipore, Bedford, MA, USA). The multielement calibration standard used was PerkinElmer Pure Plus (USA).
The number of vesicles present in the sample was calculated according to the estimation that that the weight of a vesicle is composed of 1/3 protein, 1/3 lipid, water and so forth [
35]. Since 1 gr of vesicles contains about 10
17 vesicles, 940 μg of vesicles contain 9.40 × 10
13 vesicles. Based on AFM study, the estimated volume of 1 vesicle is 1.13 × 10
−16 mL, then 9.40 × 10
13 vesicles have a total volume of 0.0106 × 10
−3 L. Correlating this value with the measured K
+ μM obtained by Inductively Coupled Plasma Mass Spectrometry, an estimated intravesicular K
+ concentration of 5.3 mM is obtained.
2.15. Statistical Analysis
All values are reported as means ± S.E.Ms. Statistical analysis was performed by one-way ANOVA followed by Newman-Keuls Multiple Comparison test with * p < 0.05 were considered statistically different. When applicable, paired t-test student was also used.
4. Discussion
In renal collecting duct principal cells, AQP2 vesicles traffic from an intracellular pool and fuse to the apical plasma membrane in response to vasopressin, resulting in water reabsorption from the lumen, a mechanism essential to fine tune water permeability and regulate water homeostasis [
25,
26,
27].
The central hypothesis that is addressed in this study is whether, AQP2 vesicles, an example of non-secretory vesicles committed to insert a channel into the plasma membrane need to swell to facilitate the water channel incorporation into the membrane. Through an interdisciplinary approach, we report here the first evidence that AQP2 vesicle swell in response to activation of a Gi protein-regulated K+ channel, that we tentatively identified as Gαi3 and TASK-2 respectively. For this purpose, we have combined high resolution AFM dynamic imaging, a fluorescence-based assay of vesicle volume changes, NMR spectroscopy to measure water self-diffusion coefficient and a fluorimetric cell-free fusion assay.
The first evidence that secretory vesicles undergo an increase in their volume during exocytosis have been provided in different studies published in the early 1990s in mast cells [
30,
49,
50,
51]. From these studies, it was concluded that swelling of secretory granules could serve as dual purpose of promoting fusion and rapid release of granule contents.
Subsequently, other studies have reported evidence that secretory vesicles swell as a consequence of ion and water entry into the vesicle and the resultant pressure generated promotes the discharge of the intravesicular contents to the outside. Of interest, those studies showed that aquaporins, in conjunction with selected ion channels present at the secretory vesicle membrane, regulate the vesicle volume through GTP-binding proteins [
5,
6,
8,
52,
53,
54]. Collectively, these observations elucidated some molecular mechanisms of secretory vesicles swelling supporting the view that this process is required for intravescicular release during secretion.
In our present contribution this concept is revisited, since we show for the first time that AQP2 bearing vesicles subjected to regulated exocytosis upon vasopressin action, swell in response to activation of a Gi protein, Gαi3 that regulates TASK-2 (K+ channels) co-expressed with the AQP2, in isolated AQP2 vesicles.
We provide here evidence that exposure of intact mouse collecting duct MCD4 cells to pertussis toxin (PTX), which ADP-ribosylates and thereby uncouples G proteins of the Gi and Go types from their cognate receptors, inhibited both the cAMP-induced increase in water permeability and the redistribution of AQP2 from an intracellular compartment to the apical membrane, confirming our previous data obtained in rabbit CD8 renal cells [
28].
Based on these findings, we determined the functional role of Gαi3 in regulating MCD4 water permeability focusing on a putative role in regulation of vesicle swelling as prerequisite for targeting AQP2 to the plasma membrane. We found that isolated AQP2 vesicles from the inner medulla of rat kidney, swell rapidly in response to the Gαi agonist mastoparan which has been demonstrated to activate the GTPase activity of Go/i proteins [
19,
20,
21], suggesting rapid water gating into AQP2 vesicles. The purity of the AQP2 vesicles was determined by the enriched presence of VAMP2 immunoreactivity in isolated vesicles compared to the homogenate.
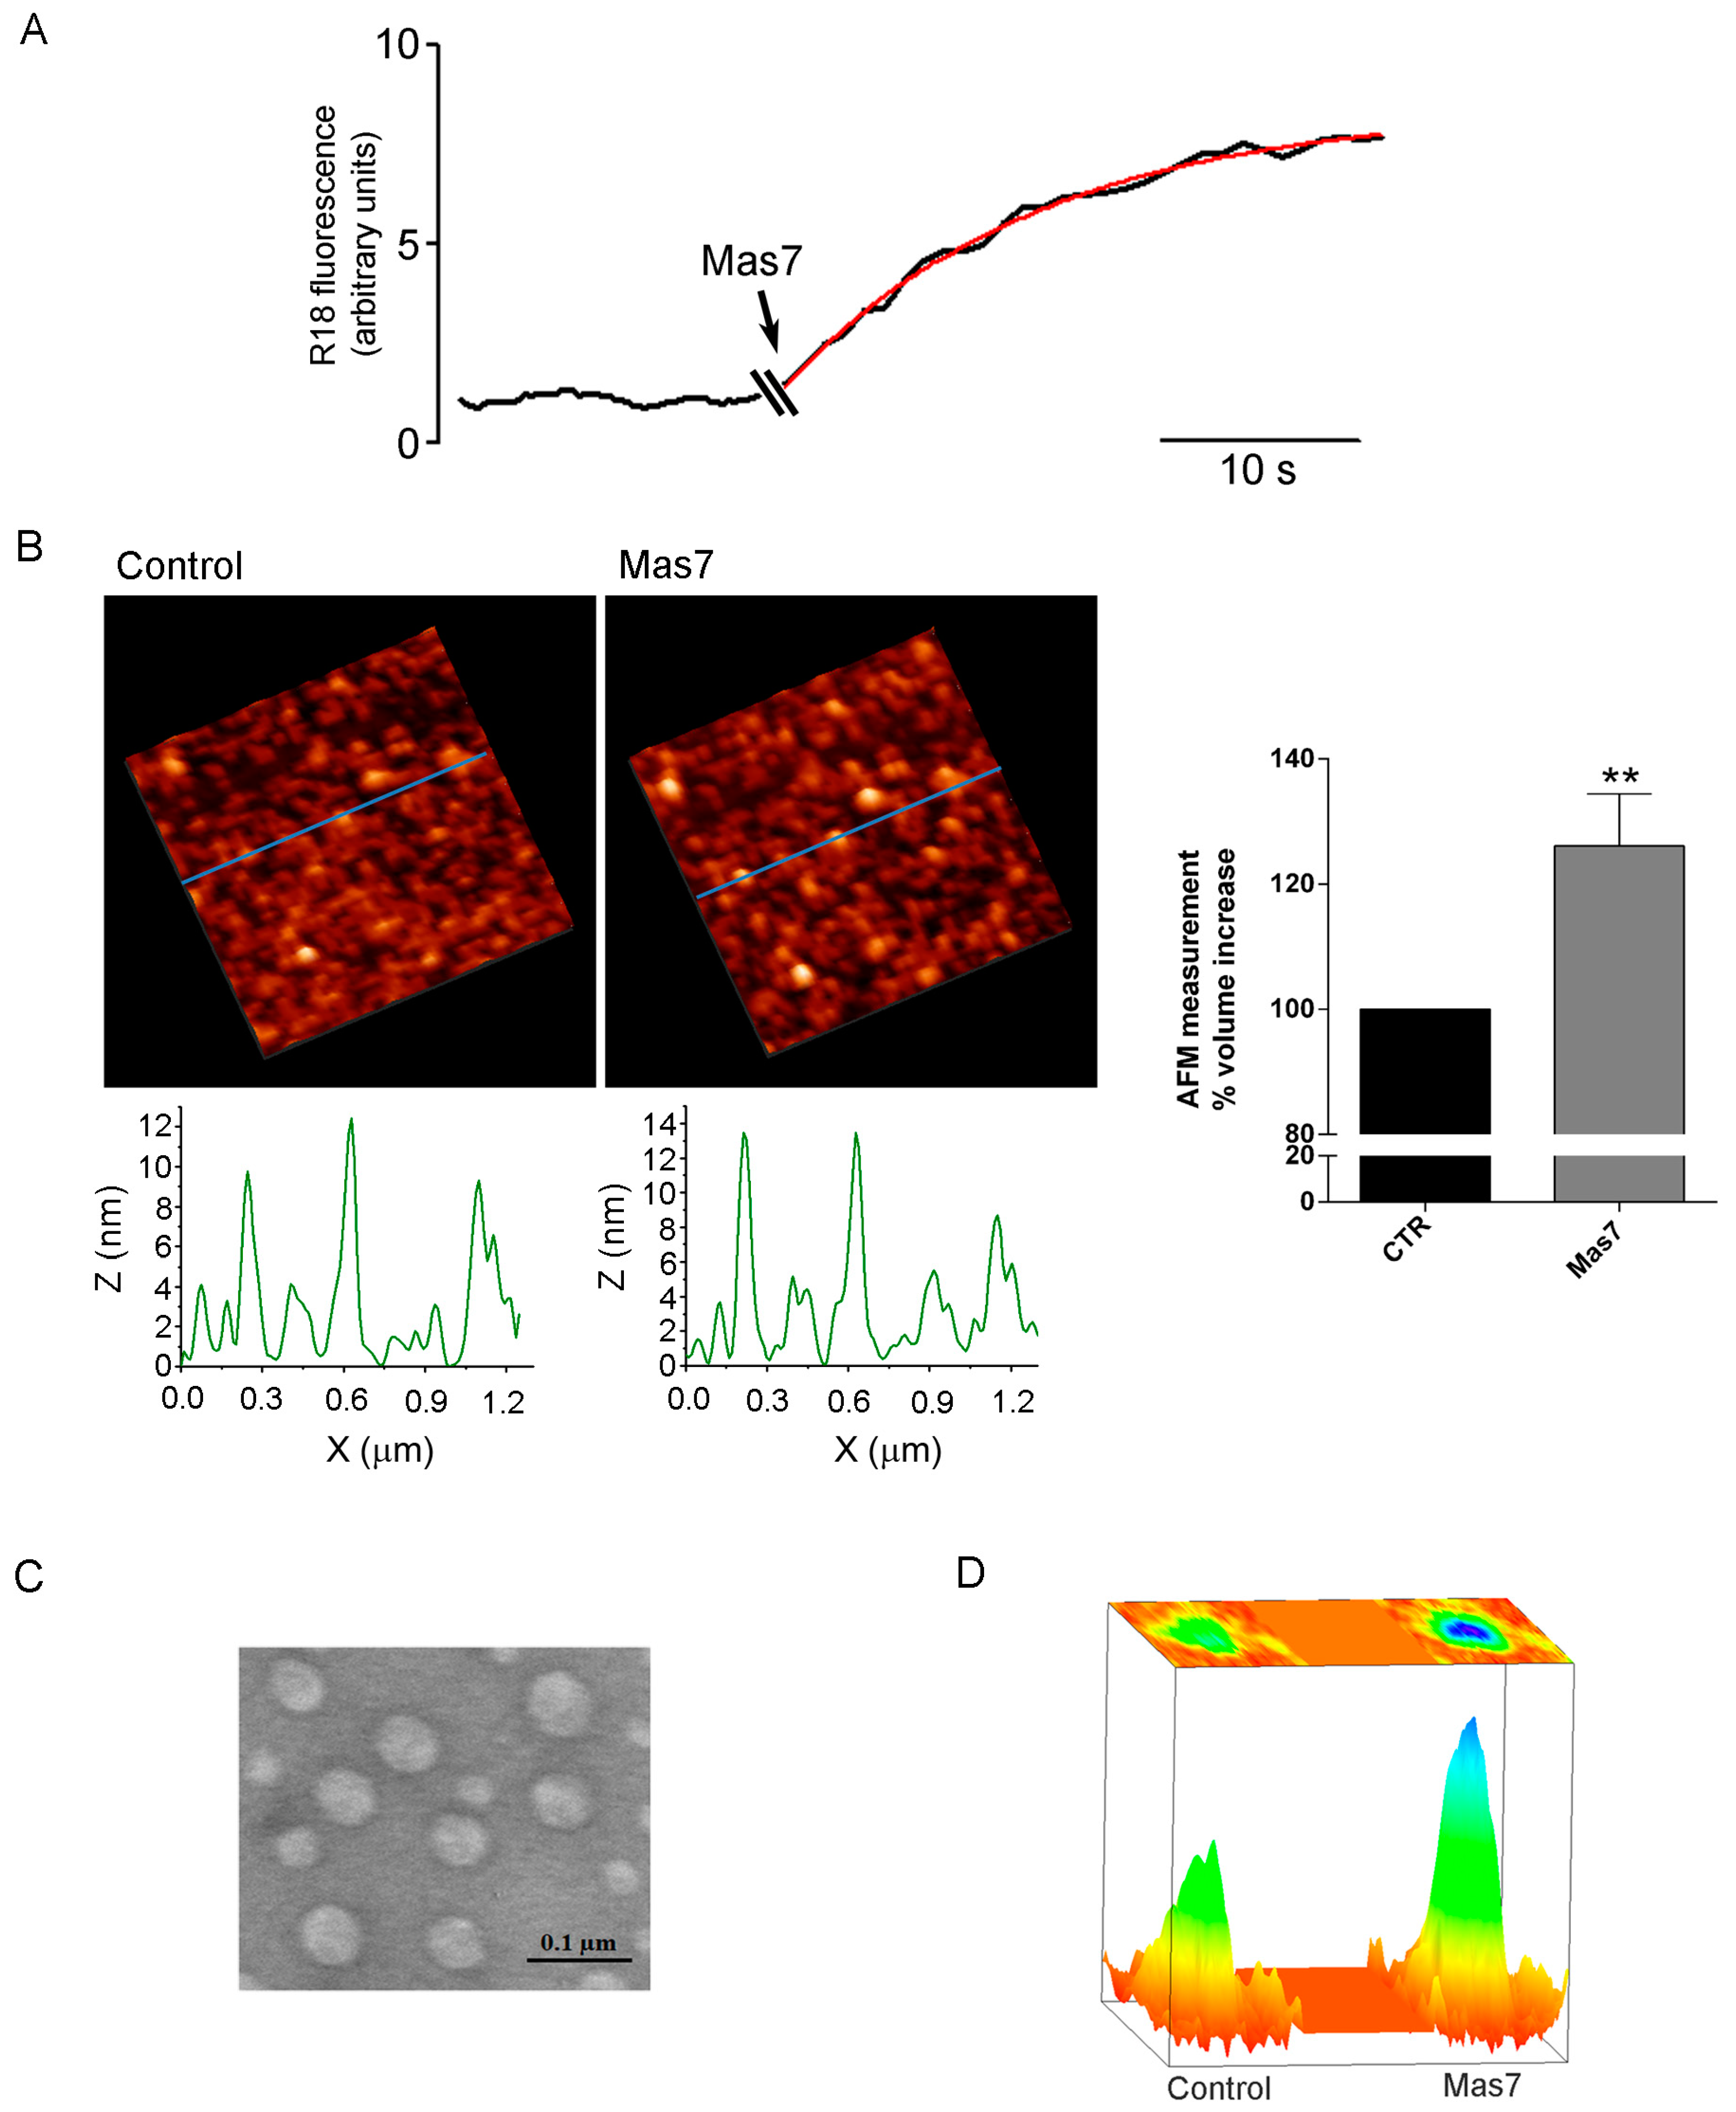
Three different biophysical techniques have been applied to demonstrate AQP2 vesicle swelling in response to the Gαi agonist mastoparan. First, a fluorescence-based assay was used, allowing to record the fluorescence signal from vesicles labelled with the R18 probed at self-quenching concentration. R18 probe has been shown to be a reliable tool for investigating of lipid mixing of synaptosomal [
55], pancreatic zymogen granules [
18] and AQP2 vesicles [
32] membranes in vitro. We observed that AQP2 vesicles swell in response to the Gαi agonist mastoparan, within 30 s. While this technique allowed the simultaneous evaluation, in real time, of fluorescence signals from a large number of vesicles plated in multiwells, next, swelling was monitored at single vesicle level at nanoscale resolution using high resolution dynamic imaging with AFM. Imaging before and after treatment with the Gαi agonist mastoparan demonstrated a significant increase both in diameter (from 58.0 ± 5.9 nm to 67.1 ± 7.3 nm,
n = 16) and height (from 23.7 ± 2.4 nm to 25.4 ± 2.1 nm,
n = 16) leading to calculated increase in total volume of about 34%. Since 5% is the commonly assumed limit of stretchability, to support nearly 35% volume increase, the presence of actin cytoskeleton may provide additional resistance to swelling. Indeed, the presence of actin inside the vesicles were confirmed in AQP2 vesicles (data not shown). Moreover, we cannot exclude that vesicles may not be unilamellar or may have invaginations since by electron microscopy we could not appreciate these aspects because of not sufficient sensitivity.
While vesicle volume increase has been proposed to be required for fractional release of intravesicular contents from cells during secretion, to our knowledge this is the first evidence that a non-secretory vesicle swell upon Gαi activation associated to the vesicle.
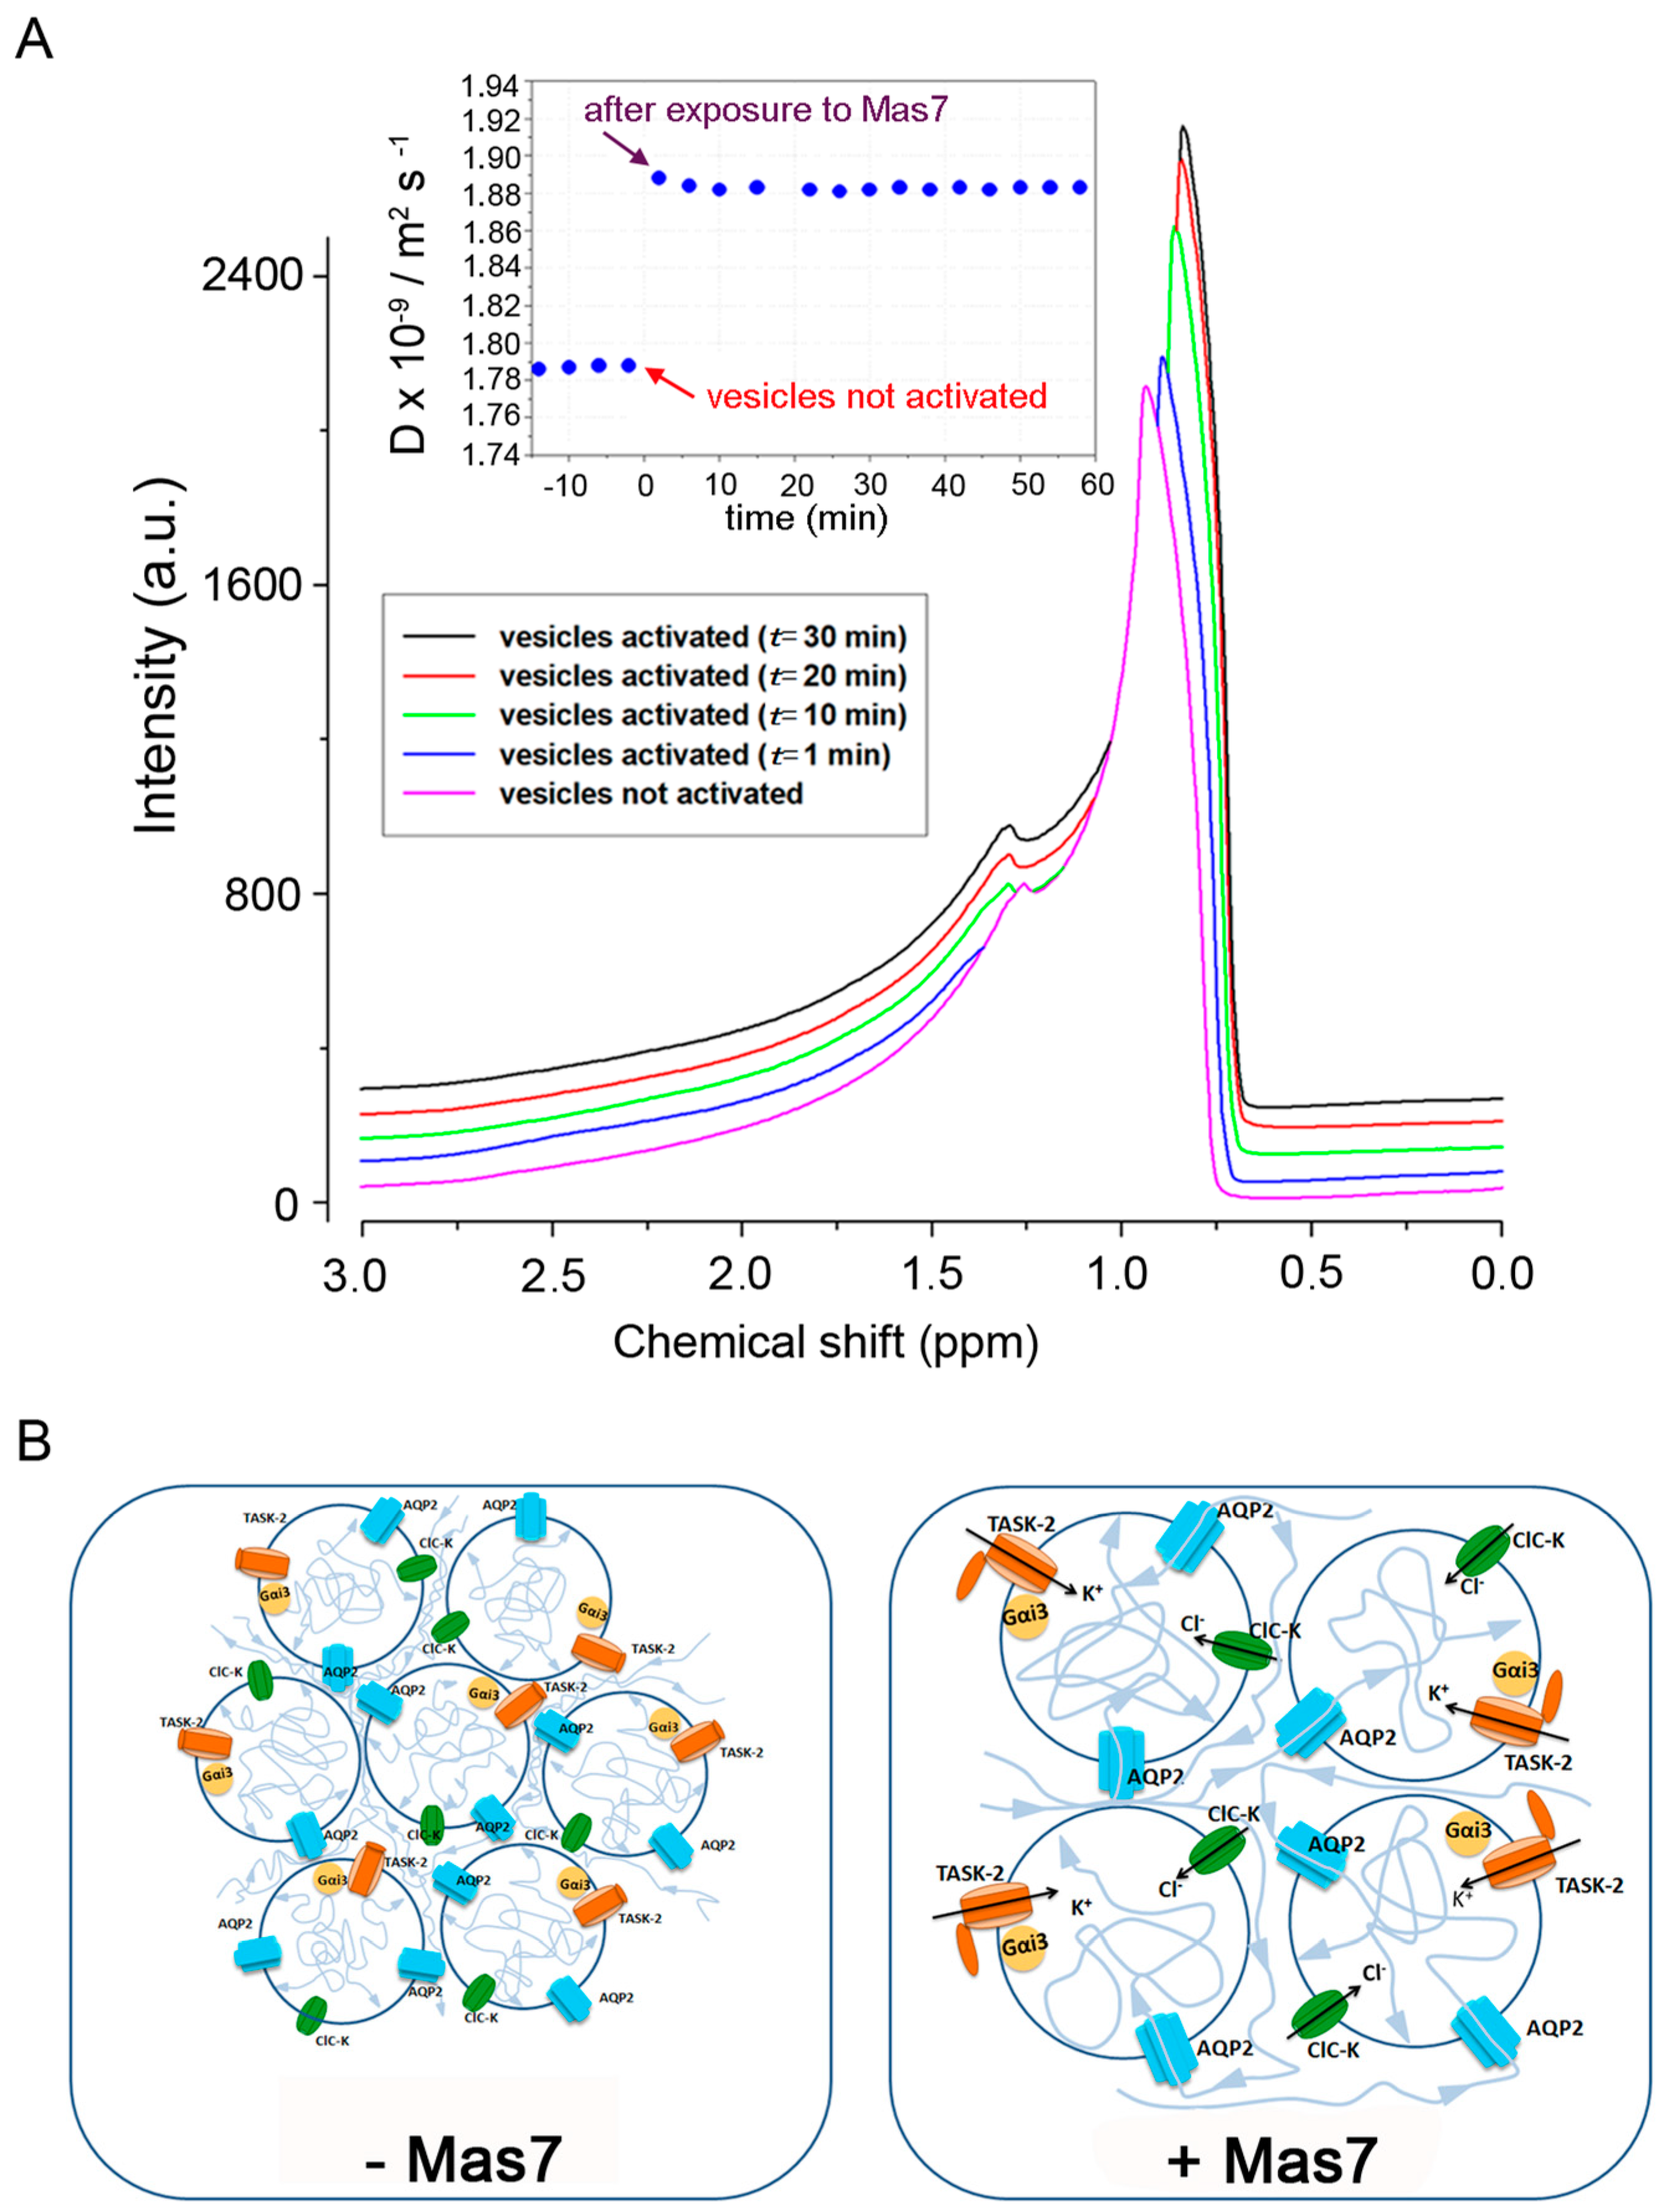
Moreover, a non-invasive technique to investigate water transport across membranes, the NMR-diffusometry, was applied in this study to investigate water diffusion in response to Gi activation with mastoparan. Water self-diffusion coefficient (D) provides information on the dynamic and structure of nano-assemblies in aqueous solutions and was found significantly increased (about 6%, from 1.787 (± 0.002) × 10
−9 m
2 s
−1 to 1.885 (± 0.003) × 10
−9 m
2 s
−1), after AQP2 vesicle exposure to mastoparan. This effect can be due to a double phenomenon: first, taking into account that we are actually observing the mobility of water external to the vesicles, an increase in the average vesicle volume reduces the packing, therefore, water mobility is expected to be less convoluted with respect to that occurring under control conditions, since more empty spaces and less contorted path are created, consequently D increases; second, a component contributing to the increase in D value is the enhanced water movement inside the vesicle, secondary to a gating of a K channel in response to Gi activation, generating an inward osmotic gradient causing rapid water entry into the vesicles mainly through AQP2. In line with these considerations, we found that vesicle pre-treatment with HgCl
2 reduced the increase in D by about half, that is, about 3%. The obtained data provide a novel, non-invasive and complementary way to measure water exchange in equilibrium exchange conditions. A very recent work highlighted the utility of the relaxometry (T1 and T2) and diffusometry (PFG) NMR spectroscopy to investigate the transport properties and the diffusional exchange across cell membrane in yeast cells with and without aquaporins [
56].
It is known that water can move across biological membranes through diffusion, a relatively slow temperature-sensitive process and through aquaporins, allowing a more rapid, osmotically driven passage of water. The AQP-mediated water transport is sensitive to mercuric chloride which binds to sulfhydryl groups (cysteine residues) on water channels and inhibits their function. Based on AFM vesicle imaging, mercurial chloride (HgCl2) prevented vesicle swelling causing instead a vesicle volume decrease. This may be explained with a possible reduction in the intravesicular osmolyte concentration associated with HgCl2 effects on other transporters sensitive to HgCl2.
While isolated AQP2 vesicles used in this study were found to express negligible contamination of AQP1, AQP3 and AQP4, we have no direct prove of AQP2-mediated water entry since HgCl
2 does not represent a specific AQP inhibitor. In principle, the presence of an AQP mediating water influx into the vesicle is expected to speed the vesicle swelling, which might be fundamental in regulated exocytosis requiring a very rapid response to the hormonal stimulus (vasopressin). In line with this hypothesis, all the known examples of secretory vesicle swelling in response to a given stimulus, have been suggested to involve an aquaporin like AQP1 [
4], AQP5 [
22]; and AQP6 (synaptic vesicles [
23]). Nevertheless, as a general mechanism, AQPs may not be essential for vesicle fusion to the plasma membrane since the lipid membrane is permeable to water. Indeed, in general, AQPs knockout mice do not display impaired synaptic or endocrine functions [
57]. Due to the wide variety of effects of HgCl
2 on other membrane transporters, future experiments using AQP2 vesicles isolated from AQP2 KO mice will provide a definitive answer for the requirement of AQP2 mediated water entry for vesicle fusion to the plasma membrane.
Water flow is driven by a concentration gradient to equilibrate the osmotic concentration on both sides of the biological membranes. In this regard, we report here that vesicle swelling in response to activation of a Gαi associated to the membrane, is likely mediated by gating of K
+ channel co-expressed with Gαi in vesicles and tentatively identified as TASK-2. TASK-2 is a pH sensitive K
+ channel cloned from human kidney and expressed in cortical distal tubule and collecting duct [
44]. TASK-2 is modulated by heterotrimeric G protein and have been proposed to be involved in regulatory volume decrease (RVD), a process in which cells swollen in response to hypotonicity recover their volume by activation of K
+ and Cl
− channels followed by KCl efflux and osmotically obliged water [
58].
By mass spectrometry, TASK-2, which is G protein regulated channel [
46], has been predicted to be expressed in immunoisolated vesicles [
43]. TASK-2 currents are blocked by quinidine (but not by the other classical K
+ channel blockers) [
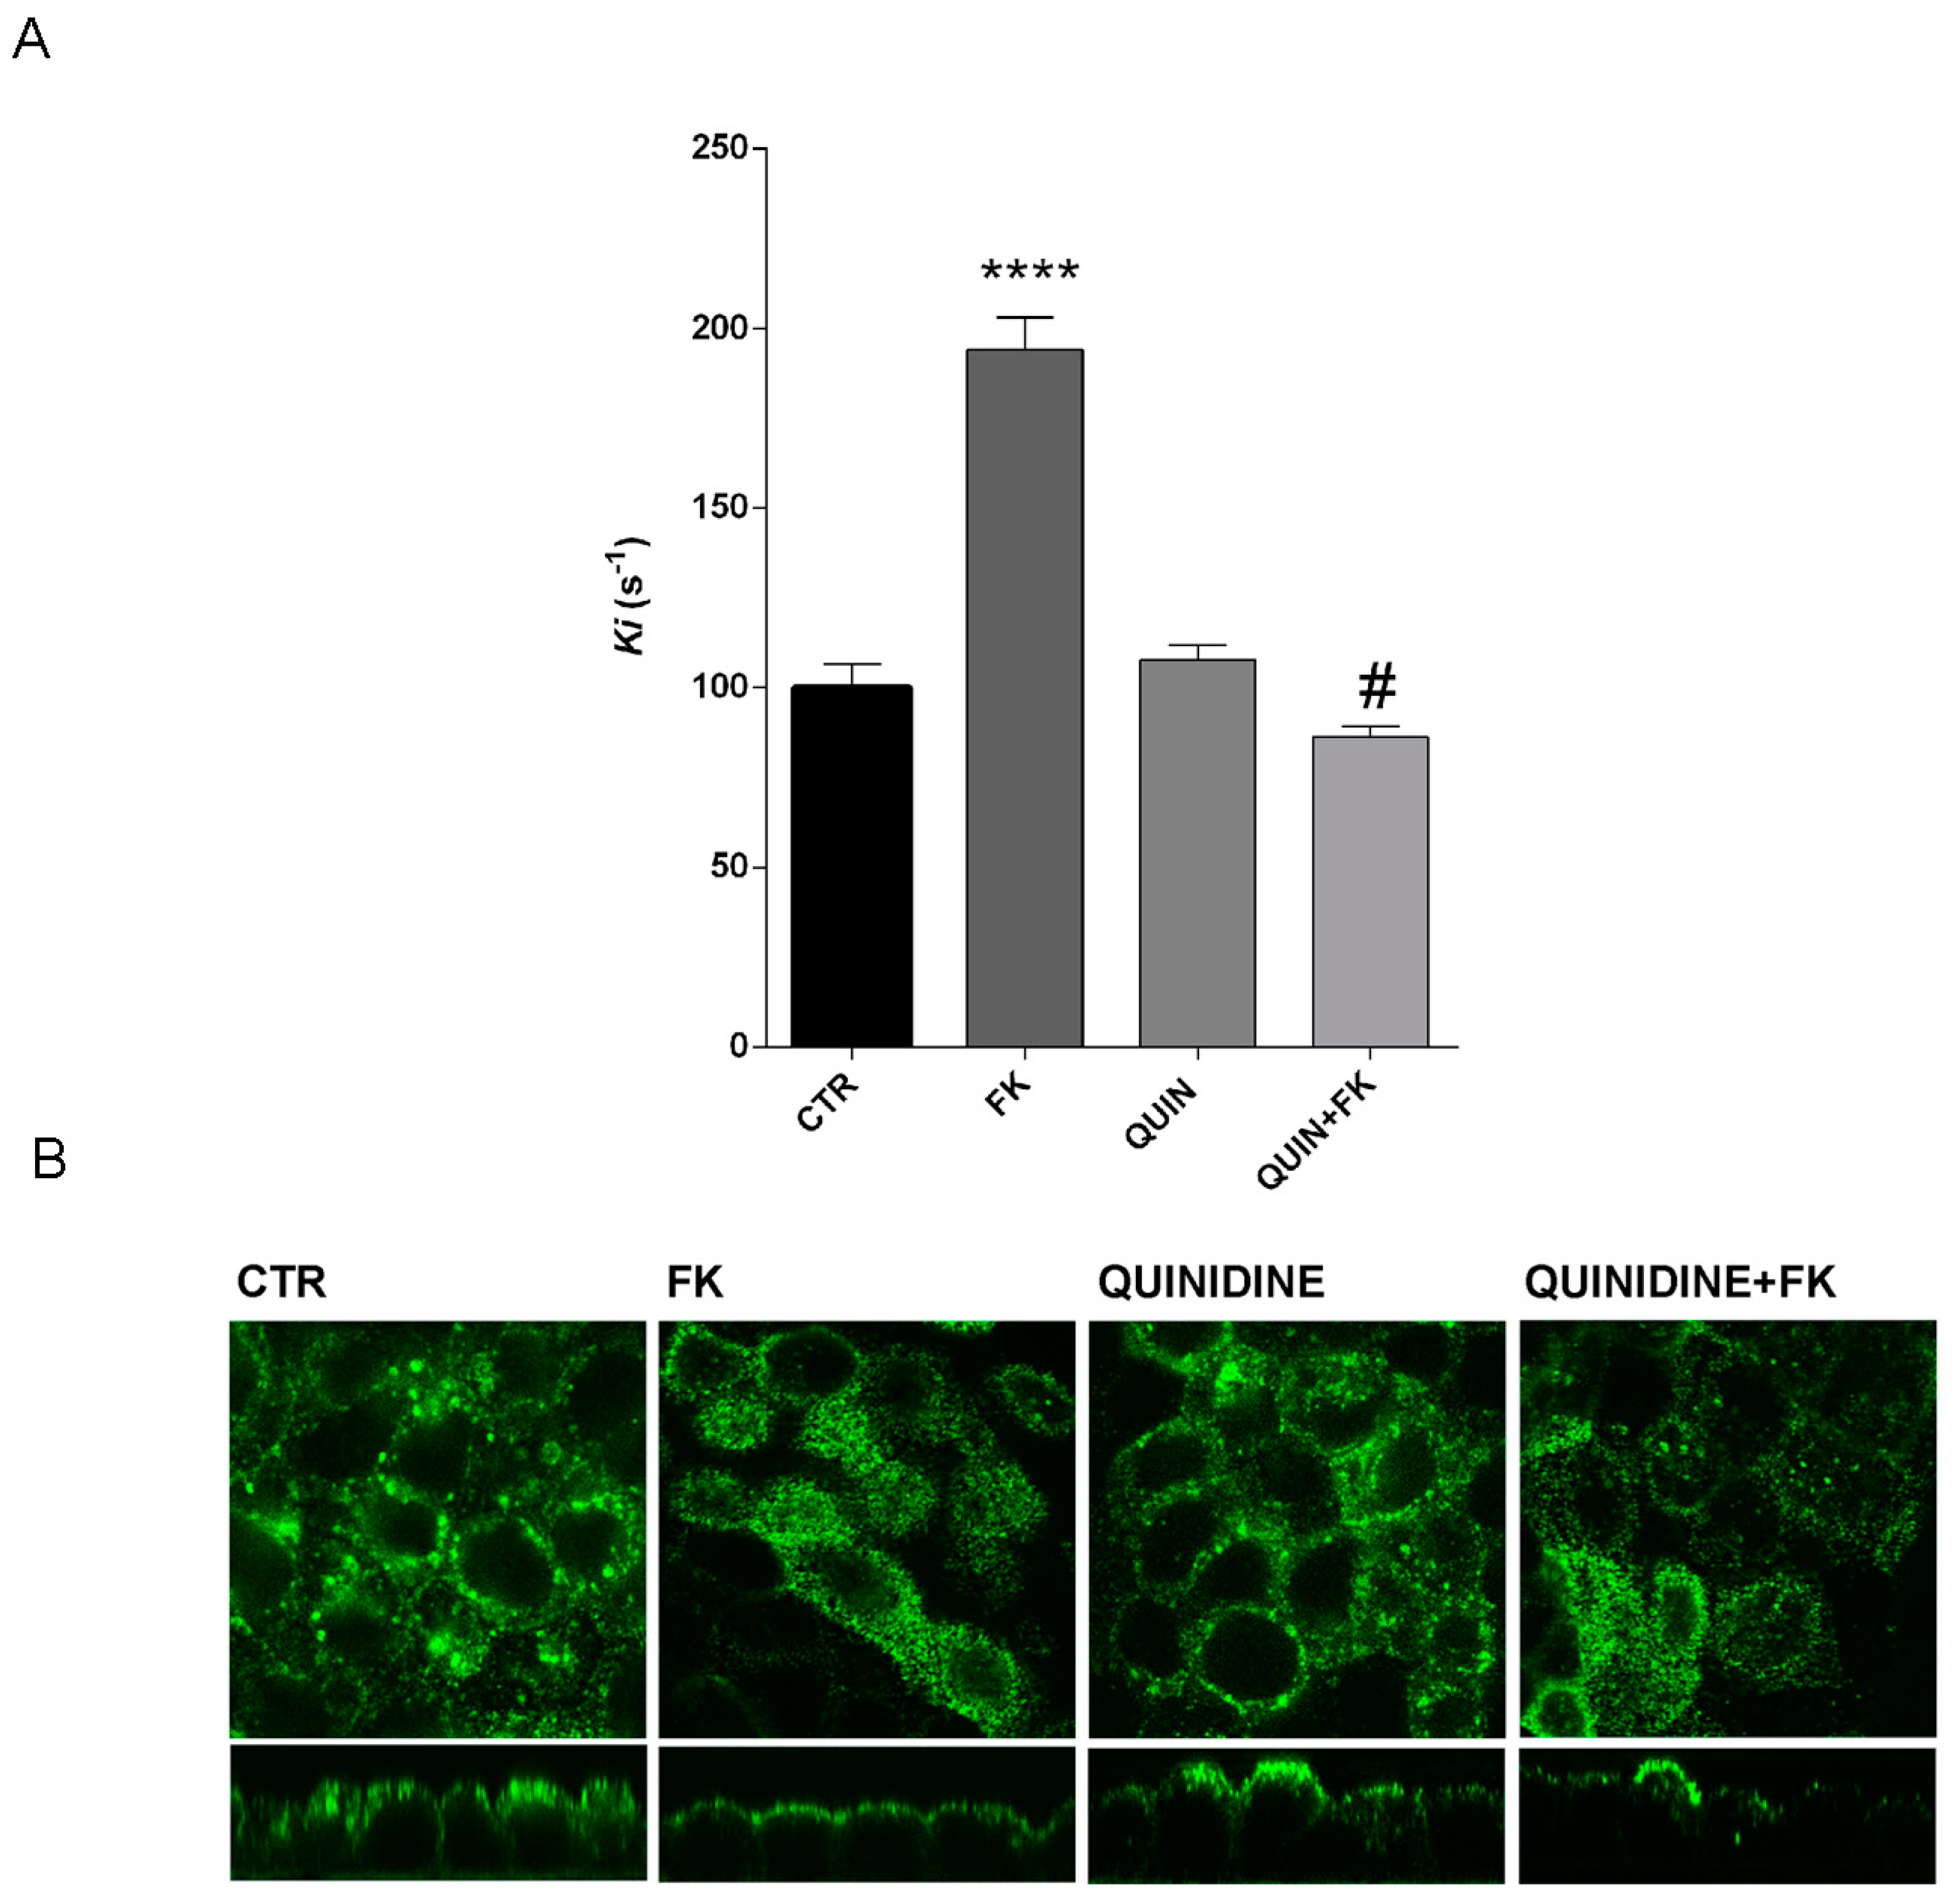
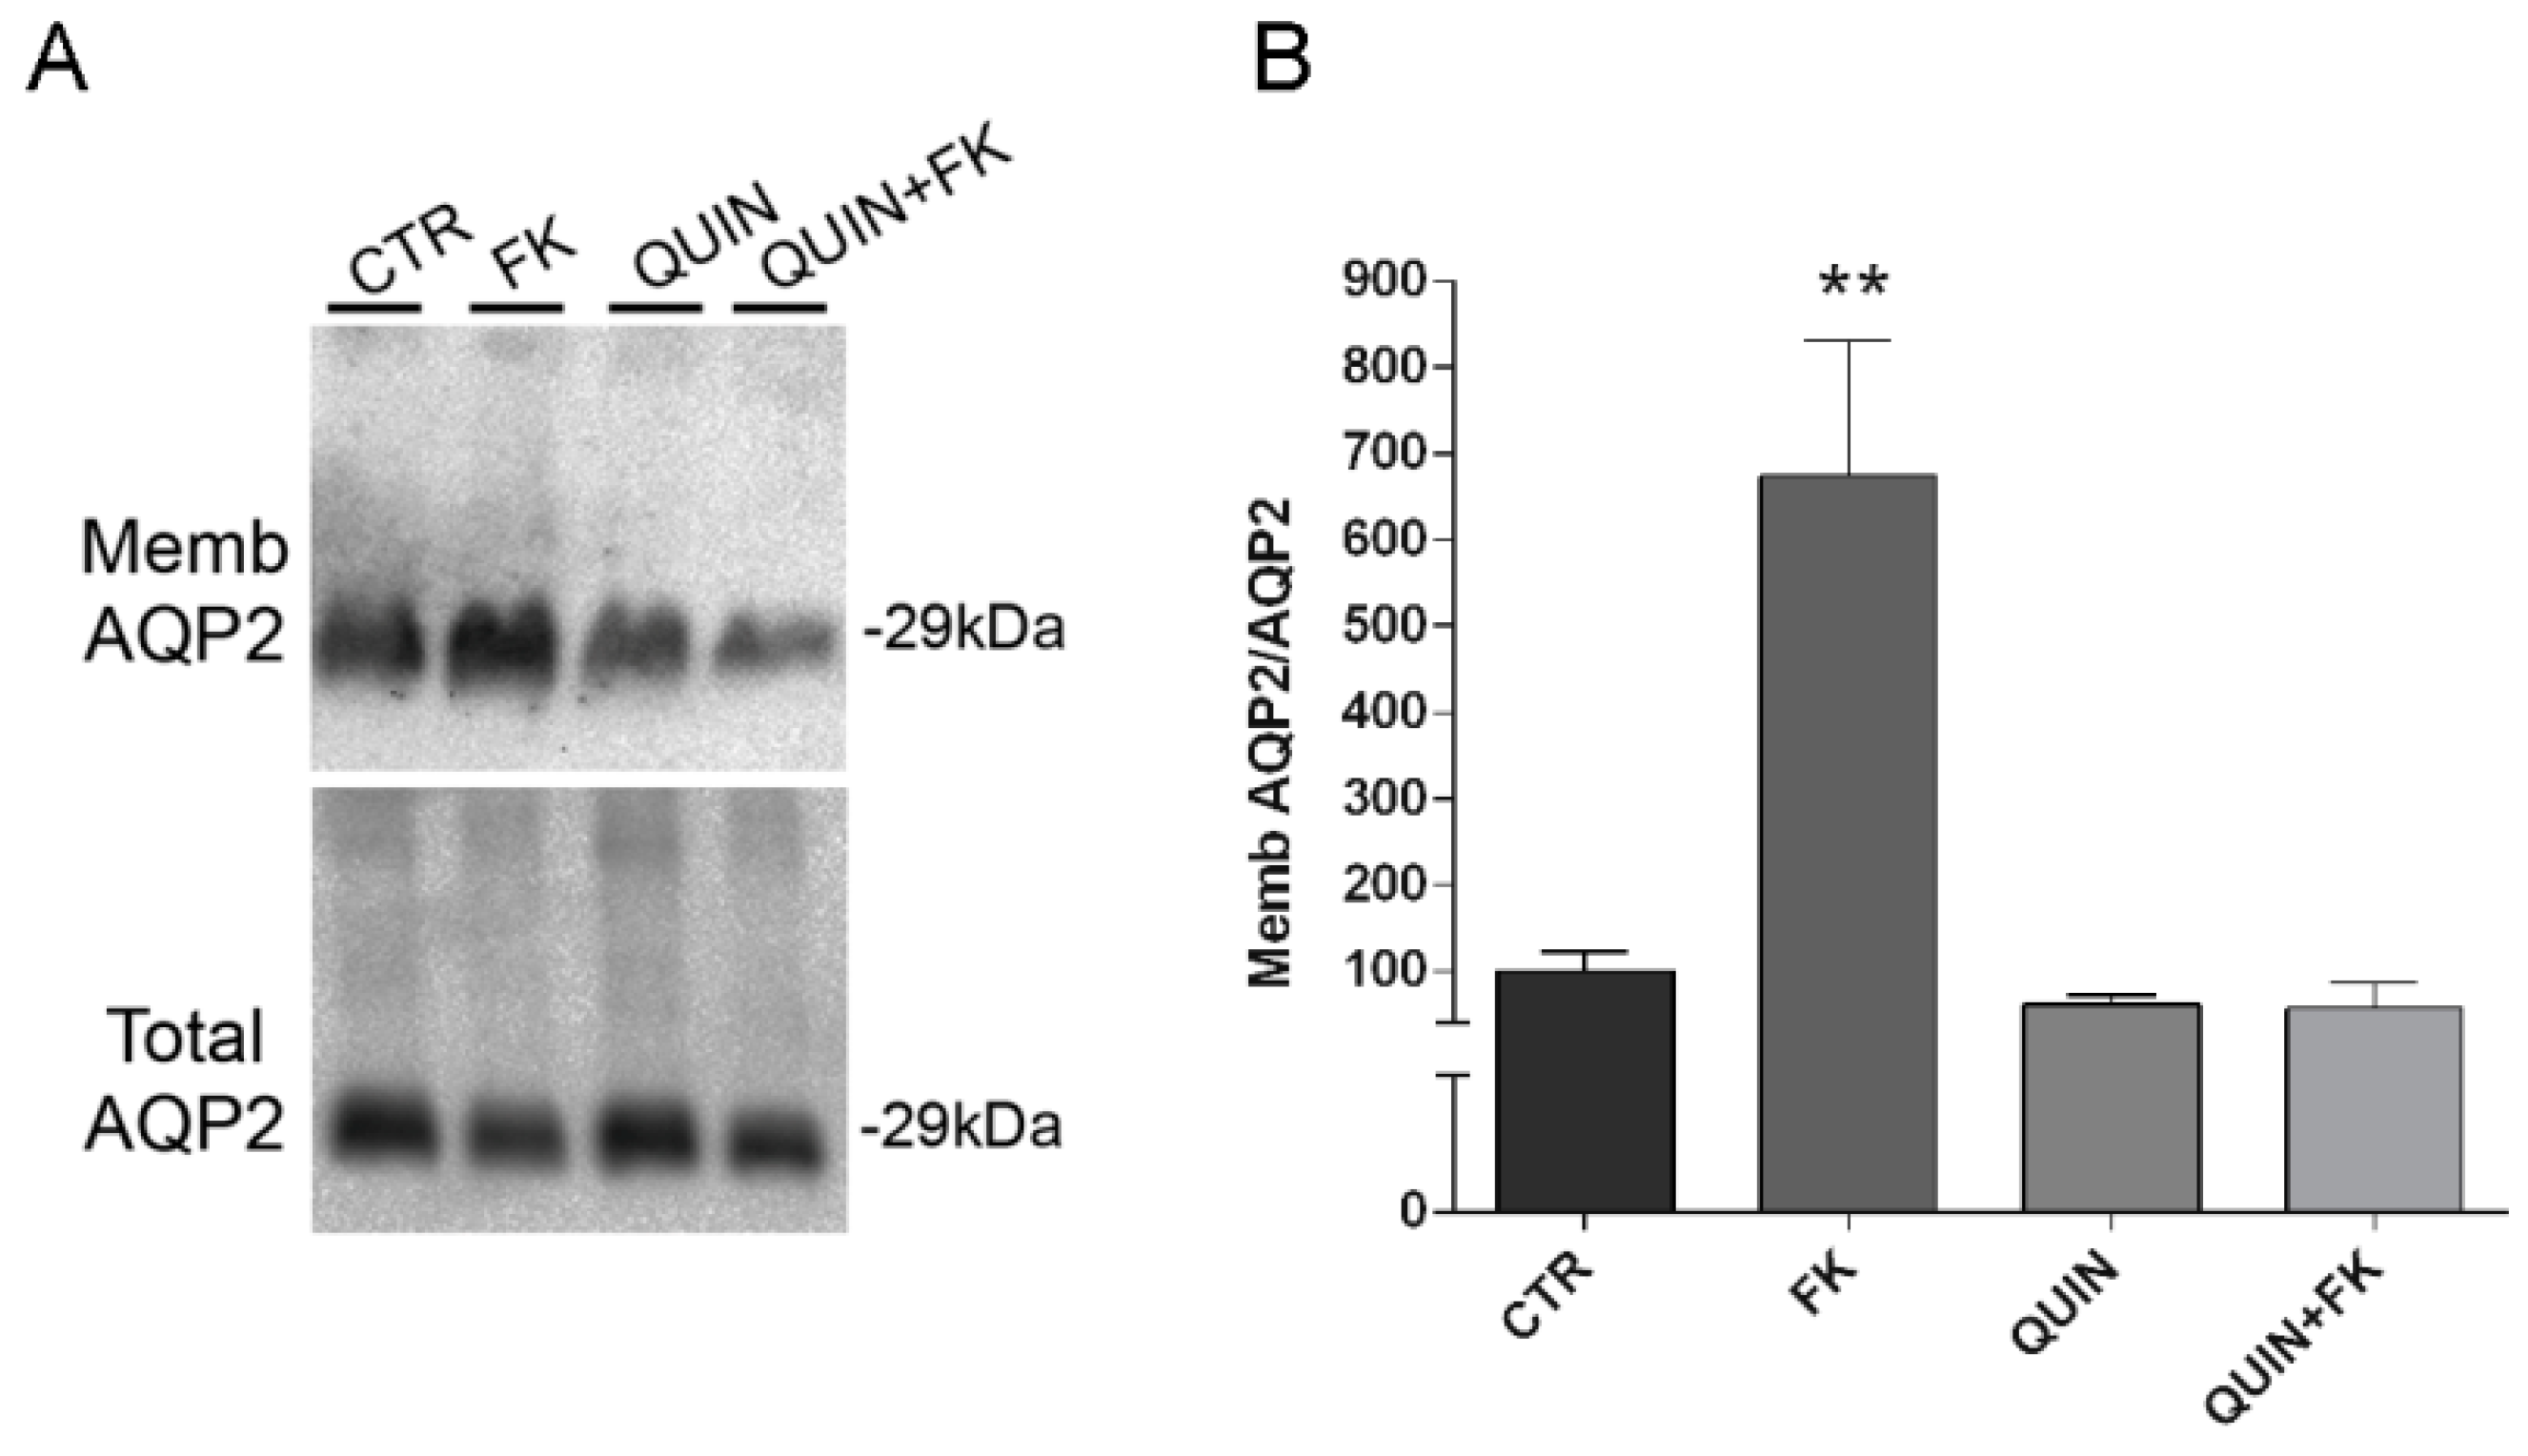
59]. Notably, we found that inhibition of this channel with quinidine prevented the effect of Gαi on vesicle swelling, AQP2 translocation and the increase in osmotic water permeability in intact renal MCD4 cells (
Figure 6A,B) pointing to a crucial role of this K
+ channel in generating an inward osmotic gradient secondary to K
+ entry into the vesicle (see model
Figure 9).
Interestingly, TASK-2 is very sensitive to pH and 90% of its current is recorded at pH 7.7 whereas only 10% at pH 6.7 [
59]. Of note, vasopressin binding to its V2 receptor induces intracellular alkalinisation via NHE1 activation [
60] and this effect might have physiological relevance in triggering TASK-2 activation to promote AQP2 bearing vesicle swelling and fusion into the apical membrane. In line with these data, a recent study showing that dDAVP-induced phosphorylation and apical targeting of AQP2 are attenuated in IMCD cells under acidic extracellular pH [
61].
In mammalian cells, the cytosolic K+ concentration is elevated (around 140 mM) and is likely that, upon TASK-2 gating by Gi activation, K+ entry driven by its chemical gradient, generates an osmotic gradient causing water entry into the vesicle resulting in vesicle swelling. Indeed, for the first time we have been able to measure the intravesicular K+ concentration in AQP2 vesicles and found to be around 5mM providing a strong rationale that vesicle swelling may occur even in living cells triggered by TASK-2 gating in response to vasopressin stimulation.
This study does not address the issue of what is the ion that balance the entry of a positive charge. A possible candidate is Cl−, however while the Cl channel ClC-K was found to be expressed in AQP2 vesicles, blocking the Cl− channel with the generic inhibitor DIDS, had no apparent effect on Gi-activated vesicle swelling.
There are several questions that arise in this context: a. in response to an external stimulus in live cells, when does vesicle swelling occur? b. why this process would facilitate the insertion of the AQP2 water channel in the plasma membrane? c. what is the upstream signal linked to vasopressin stimulation causing Gi3-regulated K+ channel gating?
The present contribution gives some input to these issues. By employing a fusion assay, we demonstrated that, in a cell free system, the fusion between isolated vesicles and plasma membrane was significantly inhibited by substitution of K+ in the medium with TMA, supporting the concept that activation of K+ channels facilitate the fusion to the plasma membrane and this process requires a K+ inwardly chemical gradient.
Concerning the second point it can be speculated that upon swelling vesicle membrane bilayer gets thinner and the negative area density of the lipid head declines facilitating the interaction with the plasma membrane. Early data using small unilamellar vesicles would support this view demonstrating that vesicle fusion process is greatly facilitated by the increment of tension owing to the substantial reduction in the time periods for adhesion and hemifusion processes [
62]. Third, the upstream signal(s) linked to vasopressin stimulation causing Gi3-regulated K
+ channel gating have to be defined. Besides vasopressin induced cytosol alkalinisation which may facilitate vesicle K
+ channel opening, the possibility that a vesicle resident GPCR can activate the heterotrimeric Gi is intriguing and deserves future investigations. In this view, the presence of functional beta adrenergic receptors at the synaptic vesicle membrane regulating vesicle swelling has been demonstrated [
54].
In summary, we show here that Gi modulation of potassium channel TASK-2 mediates vesicle osmotic swelling required for AQP2 vesicle fusion to the plasma membrane in response to cAMP-elevating agents. While our data represent the first example that vesicle swelling is required for fusion of a non-secretory vesicle committed to insert a channel into the plasma membrane, the generalization to other non-secretory vesicles needs further investigation.


 ,
, 


