Divergent Effects of G2019S and R1441C LRRK2 Mutations on LRRK2 and Rab10 Phosphorylations in Mouse Tissues


 , and
, and 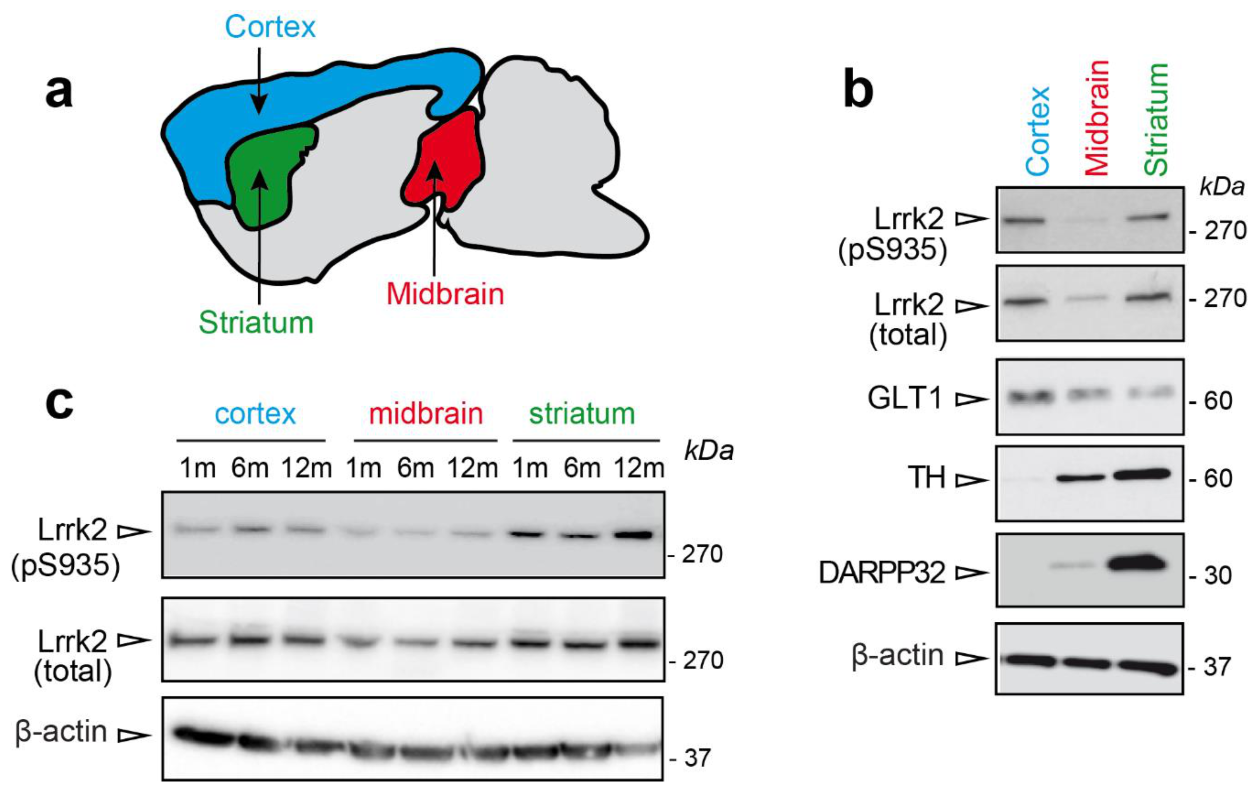
Abstract
1. Introduction
2. Materials and Methods
2.1. Animals
2.2. Antibodies
2.3. Brain Lysis and Western Blotting
2.4. Immunofluorescence
2.5. Statistical Analysis
3. Results
3.1. LRRK2 Expression in Midbrain, Striatum, and Cortex
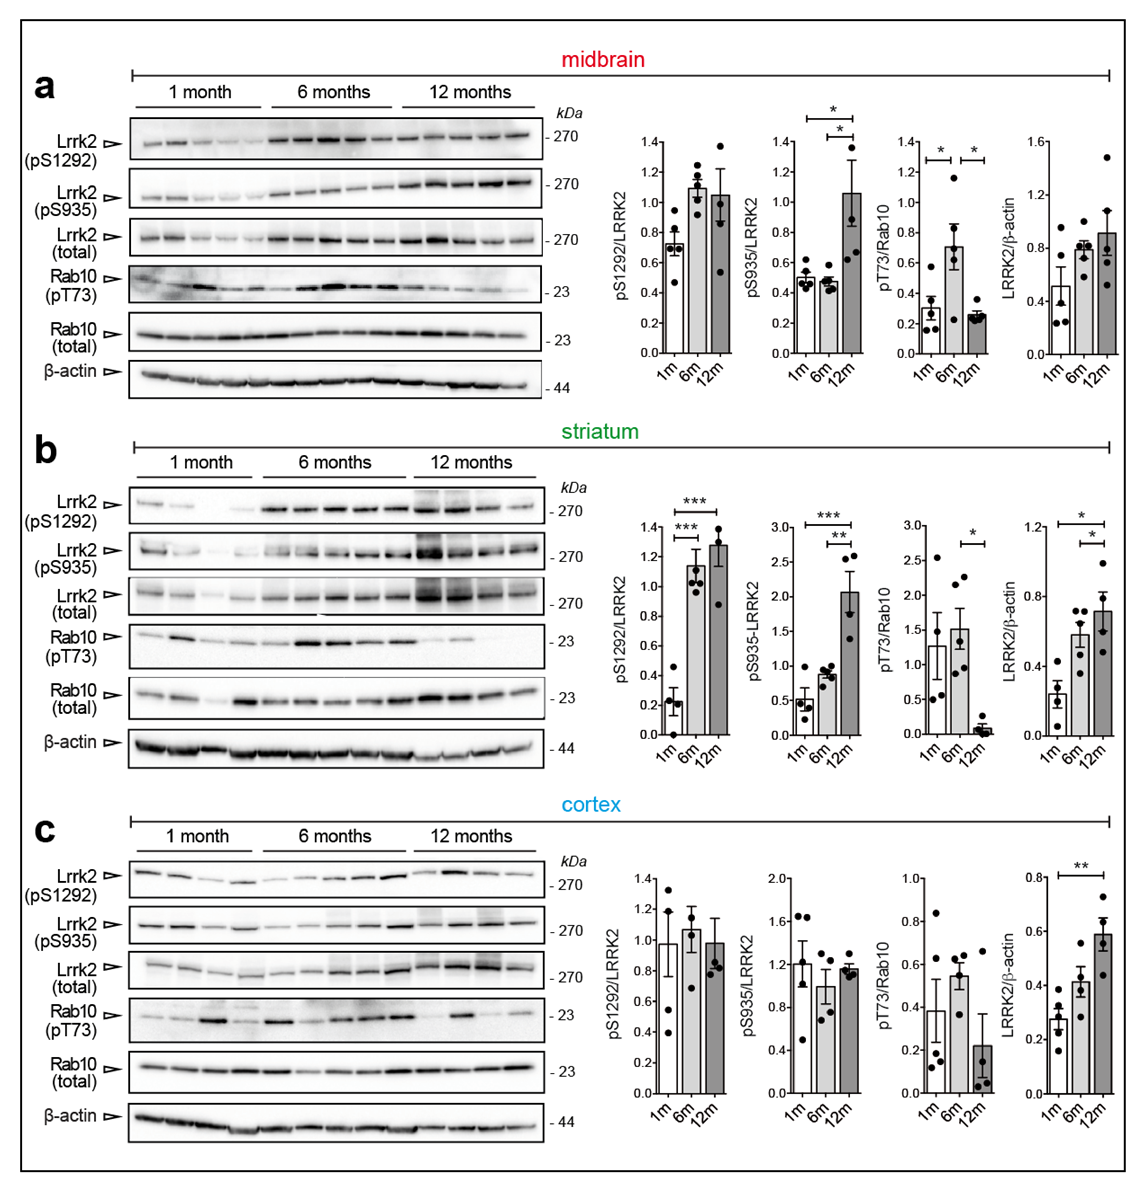
3.2. Changes in Ser935 and Ser1292 Phosphorylation in G2019S and R1441C Knockin Brains at Different Ages
3.3. Changes in Ser935-Lrrk2, Ser1292-Lrrk2, and Thr73-Rab10 Phosphorylation in G2019S and R1441C Knockin Lungs and Kidneys
3.4. Age-Dependent Increase of Lrrk2 Phosphorylation and Steady State Levels in BAC-Lrrk2 G2019S Brains
4. Discussion
Supplementary Materials
Author Contributions
Funding
Conflicts of Interest
References
- Kluss, J.H.; Mamais, A.; Cookson, M.R. LRRK2 links genetic and sporadic Parkinson’s disease. Biochem. Soc. Trans. 2019, 47, 651–661. [Google Scholar] [CrossRef]
- Cookson, M.R. LRRK2 Pathways Leading to Neurodegeneration. Curr. Neurol. Neurosci. Rep. 2015, 15, 42. [Google Scholar] [CrossRef] [PubMed]
- Steger, M.; Tonelli, F.; Ito, G.; Davies, P.; Trost, M.; Vetter, M.; Wachter, S.; Lorentzen, E.; Duddy, G.; Wilson, S.; et al. Phosphoproteomics reveals that Parkinson’s disease kinase LRRK2 regulates a subset of Rab GTPases. Elife 2016, 5, e12813. [Google Scholar] [CrossRef]
- Marchand, A.; Drouyer, M.; Sarchione, A.; Chartier-Harlin, M.-C.; Taymans, J.-M. LRRK2 Phosphorylation, More Than an Epiphenomenon. Front. Neurosci. 2020, 14, 527. [Google Scholar] [CrossRef] [PubMed]
- Nichols, R.J.; Dzamko, N.; Morrice, N.A.; Campbell, D.G.; Deak, M.; Ordureau, A.; Macartney, T.; Tong, Y.; Shen, J.; Prescott, A.R.; et al. 14-3-3 Binding to LRRK2 is disrupted by multiple Parkinson’s disease-associated mutations and regulates cytoplasmic localization. Biochem. J. 2010, 430, 393–404. [Google Scholar] [CrossRef] [PubMed]
- Dzamko, N.; Deak, M.; Hentati, F.; Reith, A.D.; Prescott, A.R.; Alessi, D.R.; Nichols, R.J. Inhibition of LRRK2 kinase activity leads to dephosphorylation of Ser910/Ser935, disruption of 14-3-3 binding and altered cytoplasmic localization. Biochem. J. 2010, 430, 405–413. [Google Scholar] [CrossRef]
- Sheng, Z.; Zhang, S.; Bustos, D.; Kleinheinz, T.; Le Pichon, C.E.; Dominguez, S.L.; Solanoy, H.O.; Drummond, J.; Zhang, X.; Ding, X.; et al. Ser1292 autophosphorylation is an indicator of LRRK2 kinase activity and contributes to the cellular effects of PD mutations. Sci. Transl. Med. 2012, 4, 164ra161. [Google Scholar] [CrossRef] [PubMed]
- Karayel, O.; Tonelli, F.; Virreira Winter, S.; Geyer, P.E.; Fan, Y.; Sammler, E.M.; Alessi, D.; Steger, M.; Mann, M. Accurate MS-based Rab10 phosphorylation stoichiometry determination as readout for LRRK2 activity in Parkinson’s disease. Mol. Cell. Proteom. 2020, 19, 1546–1560. [Google Scholar] [CrossRef]
- Fan, Y.; Howden, A.J.M.; Sarhan, A.R.; Lis, P.; Ito, G.; Martinez, T.N.; Brockmann, K.; Gasser, T.; Alessi, D.R.; Sammler, E.M. Interrogating Parkinson’s disease LRRK2 kinase pathway activity by assessing Rab10 phosphorylation in human neutrophils. Biochem. J. 2018, 475, 23–44. [Google Scholar] [CrossRef]
- Di Maio, R.; Hoffman, E.K.; Rocha, E.M.; Keeney, M.T.; Sanders, L.H.; De Miranda, B.R.; Zharikov, A.; Van Laar, A.; Stepan, A.F.; Lanz, T.A.; et al. LRRK2 activation in idiopathic Parkinson’s disease. Sci. Transl. Med. 2018, 10, eaar5429. [Google Scholar] [CrossRef]
- Berndsen, K.; Lis, P.; Yeshaw, W.M.; Wawro, P.S.; Nirujogi, R.S.; Wightman, M.; Macartney, T.; Dorward, M.; Knebel, A.; Tonelli, F.; et al. PPM1H phosphatase counteracts LRRK2 signaling by selectively dephosphorylating rab proteins. Elife 2019, 8, e50416. [Google Scholar] [CrossRef] [PubMed]
- Russo, I.; Di Benedetto, G.; Kaganovich, A.; Ding, J.; Mercatelli, D.; Morari, M.; Cookson, M.R.; Bubacco, L.; Greggio, E. Leucine-rich repeat kinase 2 controls protein kinase A activation state through phosphodiesterase 4. J. Neuroinflammation 2018, 15, 297. [Google Scholar] [CrossRef] [PubMed]
- Pellegrini, L.; Hauser, D.N.; Li, Y.; Mamais, A.; Beilina, A.; Kumaran, R.; Wetzel, A.; Nixon-Abell, J.; Heaton, G.; Rudenko, I.; et al. Proteomic analysis reveals co-ordinated alterations in protein synthesis and degradation pathways in LRRK2 knockout mice. Hum. Mol. Genet. 2018, 27, 3257–3271. [Google Scholar] [CrossRef] [PubMed]
- McGregor, M.M.; Nelson, A.B. Circuit Mechanisms of Parkinson’s Disease. Neuron 2019, 101, 1042–1056. [Google Scholar] [CrossRef]
- Mandemakers, W.; Snellinx, A.; Snellinx, A.; O’Neill, M.J.; de Strooper, B. LRRK2 expression is enriched in the striosomal compartment of mouse striatum. Neurobiol. Dis. 2012, 48, 582–593. [Google Scholar] [CrossRef]
- West, A.B.; Cowell, R.M.; Daher, J.P.L.; Moehle, M.S.; Hinkle, K.M.; Melrose, H.L.; Standaert, D.G.; Volpicelli-Daley, L.A. Differential LRRK2 expression in the cortex, striatum, and substantia nigra in transgenic and nontransgenic rodents. J. Comp. Neurol. 2014, 522, 2465–2480. [Google Scholar] [CrossRef]
- Hatcher, J.M.; Zhang, J.; Choi, H.G.; Ito, G.; Alessi, D.R.; Gray, N.S. Discovery of a pyrrolopyrimidine (JH-II-127), a highly potent, selective, and brain penetrant LRRK2 inhibitor. ACS Med. Chem. Lett. 2015, 6, 584–589. [Google Scholar] [CrossRef]
- Zhao, Y.; Keshiya, S.; Atashrazm, F.; Gao, J.; Ittner, L.M.; Alessi, D.R.; Halliday, G.M.; Fu, Y.; Dzamko, N. Nigrostriatal pathology with reduced astrocytes in LRRK2 S910/S935 phosphorylation deficient knockin mice. Neurobiol. Dis. 2018, 120, 76–87. [Google Scholar] [CrossRef]
- Biskup, S.; Moore, D.J.; Rea, A.; Lorenz-Deperieux, B.; Coombes, C.E.; Dawson, V.L.; Dawson, T.M.; West, A.B. Dynamic and redundant regulation of LRRK2 and LRRK1 expression. BMC Neurosci. 2007, 8, 102. [Google Scholar] [CrossRef]
- Maekawa, T.; Kubo, M.; Yokoyama, I.; Ohta, E.; Obata, F. Age-dependent and cell-population-restricted LRRK2 expression in normal mouse spleen. Biochem. Biophys. Res. Commun. 2010, 392, 431–435. [Google Scholar] [CrossRef]
- Biskup, S.; Moore, D.J.; Celsi, F.; Higashi, S.; West, A.B.; Andrabi, S.A.; Kurkinen, K.; Yu, S.W.; Savitt, J.M.; Waldvogel, H.J.; et al. Localization of LRRK2 to membranous and vesicular structures in mammalian brain. Ann. Neurol. 2006, 60, 557–569. [Google Scholar] [CrossRef] [PubMed]
- Fell, M.J.; Mirescu, C.; Basu, K.; Cheewatrakoolpong, B.; DeMong, D.E.; Ellis, J.M.; Hyde, L.A.; Lin, Y.; Markgraf, C.G.; Mei, H.; et al. MLi-2, a potent, selective, and centrally active compound for exploring the therapeutic potential and safety of LRRK2 kinase inhibition. J. Pharmacol. Exp. Ther. 2015, 355, 397–409. [Google Scholar] [CrossRef] [PubMed]
- Thirstrup, K.; Dächsel, J.C.; Oppermann, F.S.; Williamson, D.S.; Smith, G.P.; Fog, K.; Christensen, K.V. Selective LRRK2 kinase inhibition reduces phosphorylation of endogenous Rab10 and Rab12 in human peripheral mononuclear blood cells. Sci. Rep. 2017, 7, 1–18. [Google Scholar] [CrossRef] [PubMed]
- Ito, G.; Katsemonova, K.; Tonelli, F.; Lis, P.; Baptista, M.A.S.; Shpiro, N.; Duddy, G.; Wilson, S.; Ho, P.W.L.; Ho, S.L.; et al. Phos-Tag analysis of Rab10 phosphorylation by LRRK2: A powerful assay for assessing kinase function and inhibitors. Biochem. J. 2016, 473, 2671–2685. [Google Scholar] [CrossRef] [PubMed]
- Li, X.; Patel, J.C.; Wang, J.; Avshalumov, M.V.; Nicholson, C.; Buxbaum, J.D.; Elder, G.A.; Rice, M.E.; Yue, Z. Enhanced striatal dopamine transmission and motor performance with LRRK2 overexpression in mice is eliminated by familial Parkinson’s disease mutation G2019S. J. Neurosci. 2010, 30, 1788–1797. [Google Scholar] [CrossRef]
- Chen, Z.C.; Zhang, W.; Chua, L.L.; Chai, C.; Li, R.; Lin, L.; Cao, Z.; Angeles, D.C.; Stanton, L.W.; Peng, J.H.; et al. Phosphorylation of amyloid precursor protein by mutant LRRK2 promotes AICD activity and neurotoxicity in Parkinson’s disease. Sci. Signal. 2017, 10, eaam6790. [Google Scholar] [CrossRef]
- Zimprich, A.; Biskup, S.; Leitner, P.; Lichtner, P.; Farrer, M.; Lincoln, S.; Kachergus, J.; Hulihan, M.; Uitti, R.J.; Calne, D.B.; et al. Mutations in LRRK2 cause autosomal-dominant parkinsonism with pleomorphic pathology. Neuron 2004, 44, 601–607. [Google Scholar] [CrossRef]
- Pekny, M.; Pekna, M. Astrocyte reactivity and reactive astrogliosis: Costs and benefits. Physiol. Rev. 2014, 94, 1077–1098. [Google Scholar] [CrossRef]
- Parisiadou, L.; Yu, J.; Sgobio, C.; Xie, C.; Liu, G.; Sun, L.; Gu, X.L.; Lin, X.; Crowley, N.A.; Lovinger, D.M.; et al. LRRK2 regulates synaptogenesis and dopamine receptor activation through modulation of PKA activity. Nat. Neurosci. 2014, 17, 367–376. [Google Scholar] [CrossRef]
- Matikainen-Ankney, B.A.; Kezunovic, N.; Mesias, R.E.; Tian, Y.; Williams, F.M.; Huntley, G.W.; Benson, D.L. Altered development of synapse structure and function in striatum caused by Parkinson’s disease-linked LRRK2-G2019S mutation. J. Neurosci. 2016, 36, 7128–7141. [Google Scholar] [CrossRef]
- Zhang, Y.; Sloan, S.A.; Clarke, L.E.; Caneda, C.; Plaza, C.A.; Blumenthal, P.D.; Vogel, H.; Steinberg, G.K.; Edwards, M.S.B.; Li, G.; et al. Purification and Characterization of Progenitor and Mature Human Astrocytes Reveals Transcriptional and Functional Differences with Mouse. Neuron 2016, 89, 37–53. [Google Scholar] [CrossRef]
- Zhang, Y.; Chen, K.; Sloan, S.A.; Bennett, M.L.; Scholze, A.R.; O’Keeffe, S.; Phatnani, H.P.; Guarnieri, P.; Caneda, C.; Ruderisch, N.; et al. An RNA-sequencing transcriptome and splicing database of glia, neurons, and vascular cells of the cerebral cortex. J. Neurosci. 2014, 34, 11929–11947. [Google Scholar] [CrossRef]
- Lewis, P.A.; Greggio, E.; Beilina, A.; Jain, S.; Baker, A.; Cookson, M.R. The R1441C mutation of LRRK2 disrupts GTP hydrolysis. Biochem. Biophys. Res. Commun. 2007, 357, 668–671. [Google Scholar] [CrossRef] [PubMed]
- Wu, C.X.; Liao, J.; Park, Y.; Reed, X.; Engel, V.A.; Hoang, N.C.; Takagi, Y.; Johnson, S.M.; Wang, M.; Federici, M.; et al. Parkinson’s disease-associated mutations in the GTPase domain of LRRK2 impair its nucleotide-dependent conformational dynamics. J. Biol. Chem. 2019, 294, 5907–5913. [Google Scholar] [CrossRef] [PubMed]
- Deyaert, E.; Wauters, L.; Guaitoli, G.; Konijnenberg, A.; Leemans, M.; Terheyden, S.; Petrovic, A.; Gallardo, R.; Nederveen-Schippers, L.M.; Athanasopoulos, P.S.; et al. A homologue of the Parkinson’s disease-associated protein LRRK2 undergoes a monomer-dimer transition during GTP turnover. Nat. Commun. 2017, 8, 1–12. [Google Scholar] [CrossRef]
- Lobbestael, E.; Zhao, J.; Rudenko, I.N.; Beylina, A.; Gao, F.; Wetter, J.; Beullens, M.; Bollen, M.; Cookson, M.R.; Baekelandt, V.; et al. Identification of protein phosphatase 1 as a regulator of the LRRK2 phosphorylation cycle. Biochem. J. 2013, 456, 119–128. [Google Scholar] [CrossRef]
- Civiero, L.; Cogo, S.; Kiekens, A.; Morganti, C.; Tessari, I.; Lobbestael, E.; Baekelandt, V.; Taymans, J.M.; Chartier-Harlin, M.C.; Franchin, C.; et al. PAK6 phosphorylates 14-3-3γ to regulate steady state phosphorylation of LRRK2. Front. Mol. Neurosci. 2017, 10, 417. [Google Scholar] [CrossRef]
- Ramírez, M.B.; Ordóñez, A.J.L.; Fdez, E.; Madero-Pérez, J.; Gonnelli, A.; Drouyer, M.; Chartier-Harlin, M.C.; Taymans, J.M.; Bubacco, L.; Greggio, E.; et al. GTP binding regulates cellular localization of Parkinson’s disease-associated LRRK2. Hum. Mol. Genet. 2017, 26, 2747–2767. [Google Scholar]
- Purlyte, E.; Dhekne, H.S.; Sarhan, A.R.; Gomez, R.; Lis, P.; Wightman, M.; Martinez, T.N.; Tonelli, F.; Pfeffer, S.R.; Alessi, D.R. Rab29 activation of the Parkinson’s disease-associated LRRK2 kinase. EMBO J. 2018, 37, e97479. [Google Scholar] [CrossRef]
- Liu, Z.; Bryant, N.; Kumaran, R.; Beilina, A.; Abeliovich, A.; Cookson, M.R.; West, A.B. LRRK2 phosphorylates membrane-bound Rabs and is activated by GTP-bound Rab7L1 to promote recruitment to the trans-Golgi network. Hum. Mol. Genet. 2018, 27, 385–395. [Google Scholar] [CrossRef]
- Eguchi, T.; Kuwahara, T.; Sakurai, M.; Komori, T.; Fujimoto, T.; Ito, G.; Yoshimura, S.I.; Harada, A.; Fukuda, M.; Koike, M.; et al. LRRK2 and its substrate Rab GTPases are sequentially targeted onto stressed lysosomes and maintain their homeostasis. Proc. Natl. Acad. Sci. USA 2018, 115, E9115–E9124. [Google Scholar] [CrossRef] [PubMed]
- Kalogeropulou, A.F.; Lis, P.; Polinski, N.K.; Alessi, D.R. Rab29 knock-out or transgenic overexpression does not impact basal LRRK2 activity in wildtype and pathogenic mouse and cell line models. bioRxiv 2020. [Google Scholar] [CrossRef]
- Dhekne, H.S.; Yanatori, I.; Gomez, R.C.; Tonelli, F.; Diez, F.; Schüle, B.; Steger, M.; Alessi, D.R.; Pfeffer, S.R. A pathway for parkinson’s disease LRRK2 kinase to block primary cilia and sonic hedgehog signaling in the brain. Elife 2018, 7, e40202. [Google Scholar] [CrossRef] [PubMed]
- Lara Ordónez, A.J.; Fernández, B.; Fdez, E.; Romo-Lozano, M.; Madero-Pérez, J.; Lobbestael, E.; Baekelandt, V.; Aiastui, A.; López De Munaín, A.; Melrose, H.L.; et al. RAB8, RAB10 and RILPL1 contribute to both LRRK2 kinase-mediated centrosomal cohesion and ciliogenesis deficits. Hum. Mol. Genet. 2019, 28, 3552–3568. [Google Scholar] [CrossRef] [PubMed]
- Bonet-Ponce, L.; Beilina, A.; Williamson, C.D.; Lindberg, E.; Kluss, J.H.; Saez-Atienzar, S.; Landeck, N.; Kumaran, R.; Mamais, A.; Bleck, C.K.E.; et al. LRRK2 mediates tubulation and vesicle sorting from membrane damaged lysosomes. bioRxiv 2020. [Google Scholar] [CrossRef]
- Covy, J.P.; Giasson, B.I. The G2019S pathogenic mutation disrupts sensitivity of leucine-rich repeat kinase 2 to manganese kinase inhibition. J. Neurochem. 2010, 115, 36–46. [Google Scholar] [CrossRef]
- Greggio, E.; Jain, S.; Kingsbury, A.; Bandopadhyay, R.; Lewis, P.; Kaganovich, A.; van der Brug, M.P.; Beilina, A.; Blackinton, J.; Thomas, K.J.; et al. Kinase activity is required for the toxic effects of mutant LRRK2/dardarin. Neurobiol. Dis. 2006, 23, 329–341. [Google Scholar] [CrossRef]
- Padmanabhan, S.; Lanz, T.A.; Gorman, D.; Wolfe, M.; Joyce, A.; Cabrera, C.; Lawrence-Henderson, R.; Levers, N.; Joshi, N.; Ma, T.C.; et al. An Assessment of LRRK2 Serine 935 Phosphorylation in Human Peripheral Blood Mononuclear Cells in Idiopathic Parkinson’s Disease and G2019S LRRK2 Cohorts. J. Parkinsons. Dis. 2020, 10, 623–629. [Google Scholar] [CrossRef]
- Melachroinou, K.; Kang, M.S.; Liong, C.; Narayan, S.; Levers, N.; Joshi, N.; Kopil, K.; Hutten, S.J.; Baptista, M.A.S.; Padmanabhan, S.; et al. Elevated In Vitro Kinase Activity in Peripheral Blood Mononuclear Cells of Leucine-Rich Repeat Kinase 2 G2019S Carriers: A Novel Enzyme-Linked Immunosorbent Assay–Based Method. Mov. Disord. 2020. [Google Scholar] [CrossRef]
- Mercatelli, D.; Bolognesi, P.; Frassineti, M.; Pisanò, C.A.; Longo, F.; Shimshek, D.R.; Morari, M. Leucine-rich repeat kinase 2 (LRRK2) inhibitors differentially modulate glutamate release and Serine935 LRRK2 phosphorylation in striatal and cerebrocortical synaptosomes. Pharmacol. Res. Perspect. 2019, 7. [Google Scholar] [CrossRef]
- Ghodke-Puranik, Y.; Imgruet, M.; Dorschner, J.M.; Shrestha, P.; McCoy, K.; Kelly, J.A.; Marion, M.; Guthridge, J.M.; Langefeld, C.D.; Harley, J.B.; et al. Novel genetic associations with interferon in systemic lupus erythematosus identified by replication and fine-mapping of trait-stratified genome-wide screen. Cytokine 2020, 132, 154631. [Google Scholar] [CrossRef] [PubMed]
- Zhang, Y.M.; Zhou, X.J.; Cheng, F.J.; Qi, Y.Y.; Hou, P.; Zhao, M.H.; Zhang, H. Autophagy-related gene LRRK2 is likely a susceptibility gene for systemic lupus erythematosus in northern Han Chinese. Oncotarget 2017, 8, 13754–13761. [Google Scholar] [CrossRef] [PubMed]
- Zhang, M.; Yao, C.; Cai, J.; Liu, S.; Liu, X.N.; Chen, Y.; Wang, S.; Ji, P.; Pan, M.; Kang, Z.; et al. LRRK2 is involved in the pathogenesis of system lupus erythematosus through promoting pathogenic antibody production. J. Transl. Med. 2019, 17, 1–13. [Google Scholar] [CrossRef] [PubMed]
- Denali|Pipeline. Available online: https://denalitherapeutics.com/pipeline (accessed on 27 July 2020).


Publisher’s Note: MDPI stays neutral with regard to jurisdictional claims in published maps and institutional affiliations. |
© 2020 by the authors. Licensee MDPI, Basel, Switzerland. This article is an open access article distributed under the terms and conditions of the Creative Commons Attribution (CC BY) license (http://creativecommons.org/licenses/by/4.0/).
Share and Cite
Iannotta, L.; Biosa, A.; Kluss, J.H.; Tombesi, G.; Kaganovich, A.; Cogo, S.; Plotegher, N.; Civiero, L.; Lobbestael, E.; Baekelandt, V.; et al. Divergent Effects of G2019S and R1441C LRRK2 Mutations on LRRK2 and Rab10 Phosphorylations in Mouse Tissues. Cells 2020, 9, 2344. https://doi.org/10.3390/cells9112344
Iannotta L, Biosa A, Kluss JH, Tombesi G, Kaganovich A, Cogo S, Plotegher N, Civiero L, Lobbestael E, Baekelandt V, et al. Divergent Effects of G2019S and R1441C LRRK2 Mutations on LRRK2 and Rab10 Phosphorylations in Mouse Tissues. Cells. 2020; 9(11):2344. https://doi.org/10.3390/cells9112344
Chicago/Turabian StyleIannotta, Lucia, Alice Biosa, Jillian H. Kluss, Giulia Tombesi, Alice Kaganovich, Susanna Cogo, Nicoletta Plotegher, Laura Civiero, Evy Lobbestael, Veerle Baekelandt, and et al. 2020. "Divergent Effects of G2019S and R1441C LRRK2 Mutations on LRRK2 and Rab10 Phosphorylations in Mouse Tissues" Cells 9, no. 11: 2344. https://doi.org/10.3390/cells9112344
APA StyleIannotta, L., Biosa, A., Kluss, J. H., Tombesi, G., Kaganovich, A., Cogo, S., Plotegher, N., Civiero, L., Lobbestael, E., Baekelandt, V., Cookson, M. R., & Greggio, E. (2020). Divergent Effects of G2019S and R1441C LRRK2 Mutations on LRRK2 and Rab10 Phosphorylations in Mouse Tissues. Cells, 9(11), 2344. https://doi.org/10.3390/cells9112344