Article

High SGO2 Expression Predicts Poor Overall Survival: A Potential Therapeutic Target for Hepatocellular Carcinoma

1
Department of Hepatobiliary Oncology, Sun Yat-sen University Cancer Center, Guangzhou 510060, China
2
State Key Laboratory of Oncology in South China, Guangzhou 510060, China
3
Collaborative Innovation Center for Cancer Medicine, Guangzhou 510060, China
*
Author to whom correspondence should be addressed.
These authors have contributed equally to this work.
Genes 2021, 12(6), 876; https://doi.org/10.3390/genes12060876
Submission received: 11 April 2021 / Revised: 29 May 2021 / Accepted: 3 June 2021 / Published: 7 June 2021
(This article belongs to the Special Issue Genetics and Genomics of Liver Disease)

Abstract

:
Shugoshin2 (SGO2) may participate in the occurrence and development of tumors by regulating abnormal cell cycle division, but its prognostic value in hepatocellular carcinoma (HCC) remains unclear. In this study, we accessed The Cancer Genome Atlas (TCGA) database to get the clinical data and gene expression profile of HCC. The expression of SGO2 in HCC tissues and nontumor tissues and the relationship between SGO2 expression, survival, and clinicopathological parameters were analyzed. The SGO2 expression level was significantly higher in HCC tissues than in nontumor tissues (p < 0.001). An analysis from the Oncomine and Gene Expression Profiling Interactive Analysis 2 (GEPIA2) databases also demonstrated that SGO2 was upregulated in HCC (all p < 0.001). A logistic regression analysis revealed that the high expression of SGO2 was significantly correlated with gender, tumor grade, pathological stage, T classification, and Eastern Cancer Oncology Group (ECOG) score (all p < 0.05). The overall survival (OS) of HCC patients with higher SGO2 expression was significantly poor (p < 0.001). A multivariate analysis showed that age and high expression of SGO2 were independent predictors of poor overall survival (all p < 0.05). Twelve signaling pathways were significantly enriched in samples with the high-SGO2 expression phenotype. Ten proteins and 34 genes were significantly correlated with SGO2. In conclusion, the expression of SGO2 is closely related to the survival of HCC. It may be used as a potential therapeutic target and prognostic marker of HCC.

1. Introduction

Hepatocellular carcinoma (HCC) is the sixth-most common malignancy and the fourth leading cancer-related death worldwide [1,2]. HCC patients, accounting for more than 50%, have lost the opportunity to receive potentially curative treatments at an initial diagnosis [3,4,5]. In addition, patients who have undergone surgical resection have a high recurrence and metastasis rate, so their prognosis is still low [6,7]. At present, the existing targeting therapy, including tyrosine kinase inhibitors (TKI) and immunotherapy, has an unsatisfactory efficacy because of different clinical and biological behaviors caused by multiple factors and the development of drug resistance to HCC [8,9,10,11]. Furthermore, identifying specific tumor stage markers is a critical gap in the understanding and treatment of HCC [12]. Thus, it is urgently required to identify reliable prognostic biomarkers for the precise estimation of the prognosis and reveal a potential target for HCC therapy, which plays a key role in treatment decisions in HCC patients.
Shugoshin 2 (SGO2; otherwise called Shugoshin-Like 2, SGOL2, and Tripin) is a protein-coding gene associated with Perrault Syndrome and Premature Ovarian Failure 1 [13]. Shugoshin 1 (SGO1, otherwise called Shugoshin-Like 1; SGOL1), a member of the shugoshin (SGO) family of proteins, has been proven to play an important role in maintaining a proper mitotic progression in hepatoma cells. The chromosomal instability induced by mitotic errors caused by SGO1 strongly promotes the development of HCC in the presence of an initiator carcinogen. In addition, SGO1 is closely related to the upregulation of ATPase family AAA domain-containing protein 2 (ATAD2). ATAD2 may interact with the TTK protein kinase (TTK) to accelerate HCC carcinogenesis. Furthermore, the loss of SGO1 is associated with sorafenib resistance. A study revealed that the loss of SGO1 from HCC cells reduces the cytotoxicity of sorafenib in vivo. Therefore, SGO1 can be considered as a therapeutic target and prognostic indicator for HCC treated with sorafenib [14,15,16,17,18]. Obviously, shugoshin family genes are vital for mitotic progression and chromosome segregation. When SGO is abnormal, carcinogenesis may occur [19,20,21]. Long-term studies have demonstrated that SGO2 cooperates with phosphatase 2A to protect centromeric cohesin from separase-mediated cleavage in oocytes, specifically during meiosis I. It is essential for accurate gametogenesis [20,22,23]. Recent studies have revealed that SGO2, an essential protector of meiotic cohesion, may contribute to tumor development by regulating abnormal cell division in the cell cycle [24,25]. It is often overexpressed in different tumor tissues, such as gastric cancer [24]. Moreover, some researchers have discovered that SGO2 may be combined with other genes to participate in partial tumor occurrences and developments in recent years [26,27]. However, the biological function of SGO2 in HCC remains unclear.
This study analyzed the SGO2 expression level and prognostics in HCC patients in The Cancer Genome Atlas (TCGA) and other public databases. This research also investigated the relationship between the expression level of SGO2 and the clinicopathological features of HCC patients. SGO2 can be regarded as a potential therapeutic target for HCC patients.

2. Materials and Methods

2.1. Data Resource and Description

The original data, mRNA information, and clinical data for 374 samples of HCC tissues and 50 samples of nontumor tissues were obtained from The Cancer Genome Atlas (TCGA) official website (https://cancergenome.nih.gov/, 23 October 2020) before 23 October 2020. Parameters included patients’ age, gender, tumor grade, tumor stage, T classification, N classification, M classification, vascular invasion, Eastern Cancer Oncology Group (ECOG) score, and survival status. There were 377 eligible HCC patients included in this study. The details of the patients are summarized in Table 1.

2.2. SGO2 Expression and Clinicopathological and Survival Analyses

The expression data downloaded from the TCGA database were sorted and merged by Perl programming language. R software’s limma package was used to extract and visualize the expression data of SGO2 from the dataset. The complete survival data were extracted by Perl software. Finally, 377 eligible patients were included in this research. We divided HCC patients into a high SGO2 expression group and low SGO2 expression group based on the median expression level of SGO2 and analyzed the correlation between SGO2 expression, survival rate, and clinicopathological features. The Kaplan–Meier survival curve was obtained by visualization with the survival package of R software. For validation, the research compared the expression levels of SGO2 in HCC tumor and nontumor tissues with a threshold of p-Value ≤ 0.01 and fold change ≥ 2 in the Gene Expression Profiling Interactive Analysis 2 (GEPIA2) database (http://gepia2.cancer-pku.cn/#index, accessed on 1 November 2020) and Oncomine database https://www.oncomine.org/, accessed on 1 November 2020).

2.3. Univariate and Multivariate Cox Regression Analysis

Univariate and multivariate analyses were achieved by the Cox proportional hazard regression model. The hazard ratio, 95% confidence interval, the independent prediction values of the clinicopathological parameters, and expression level of SGO2 on survival were evaluated. Firstly, the original clinical data were sorted and merged by Perl language, and the missing clinical information was deleted and matched with the SGO2 expression data. As a result, the univariate and multivariate Cox regression analyses were performed in 177 sorted patients. According to the median expression of SGO2, HCC patients were grouped into a high expression group and a low expression group. Packages of R, including survival, survminer, command of coxph, and ggforest, were performed to analyze and visualize the data.

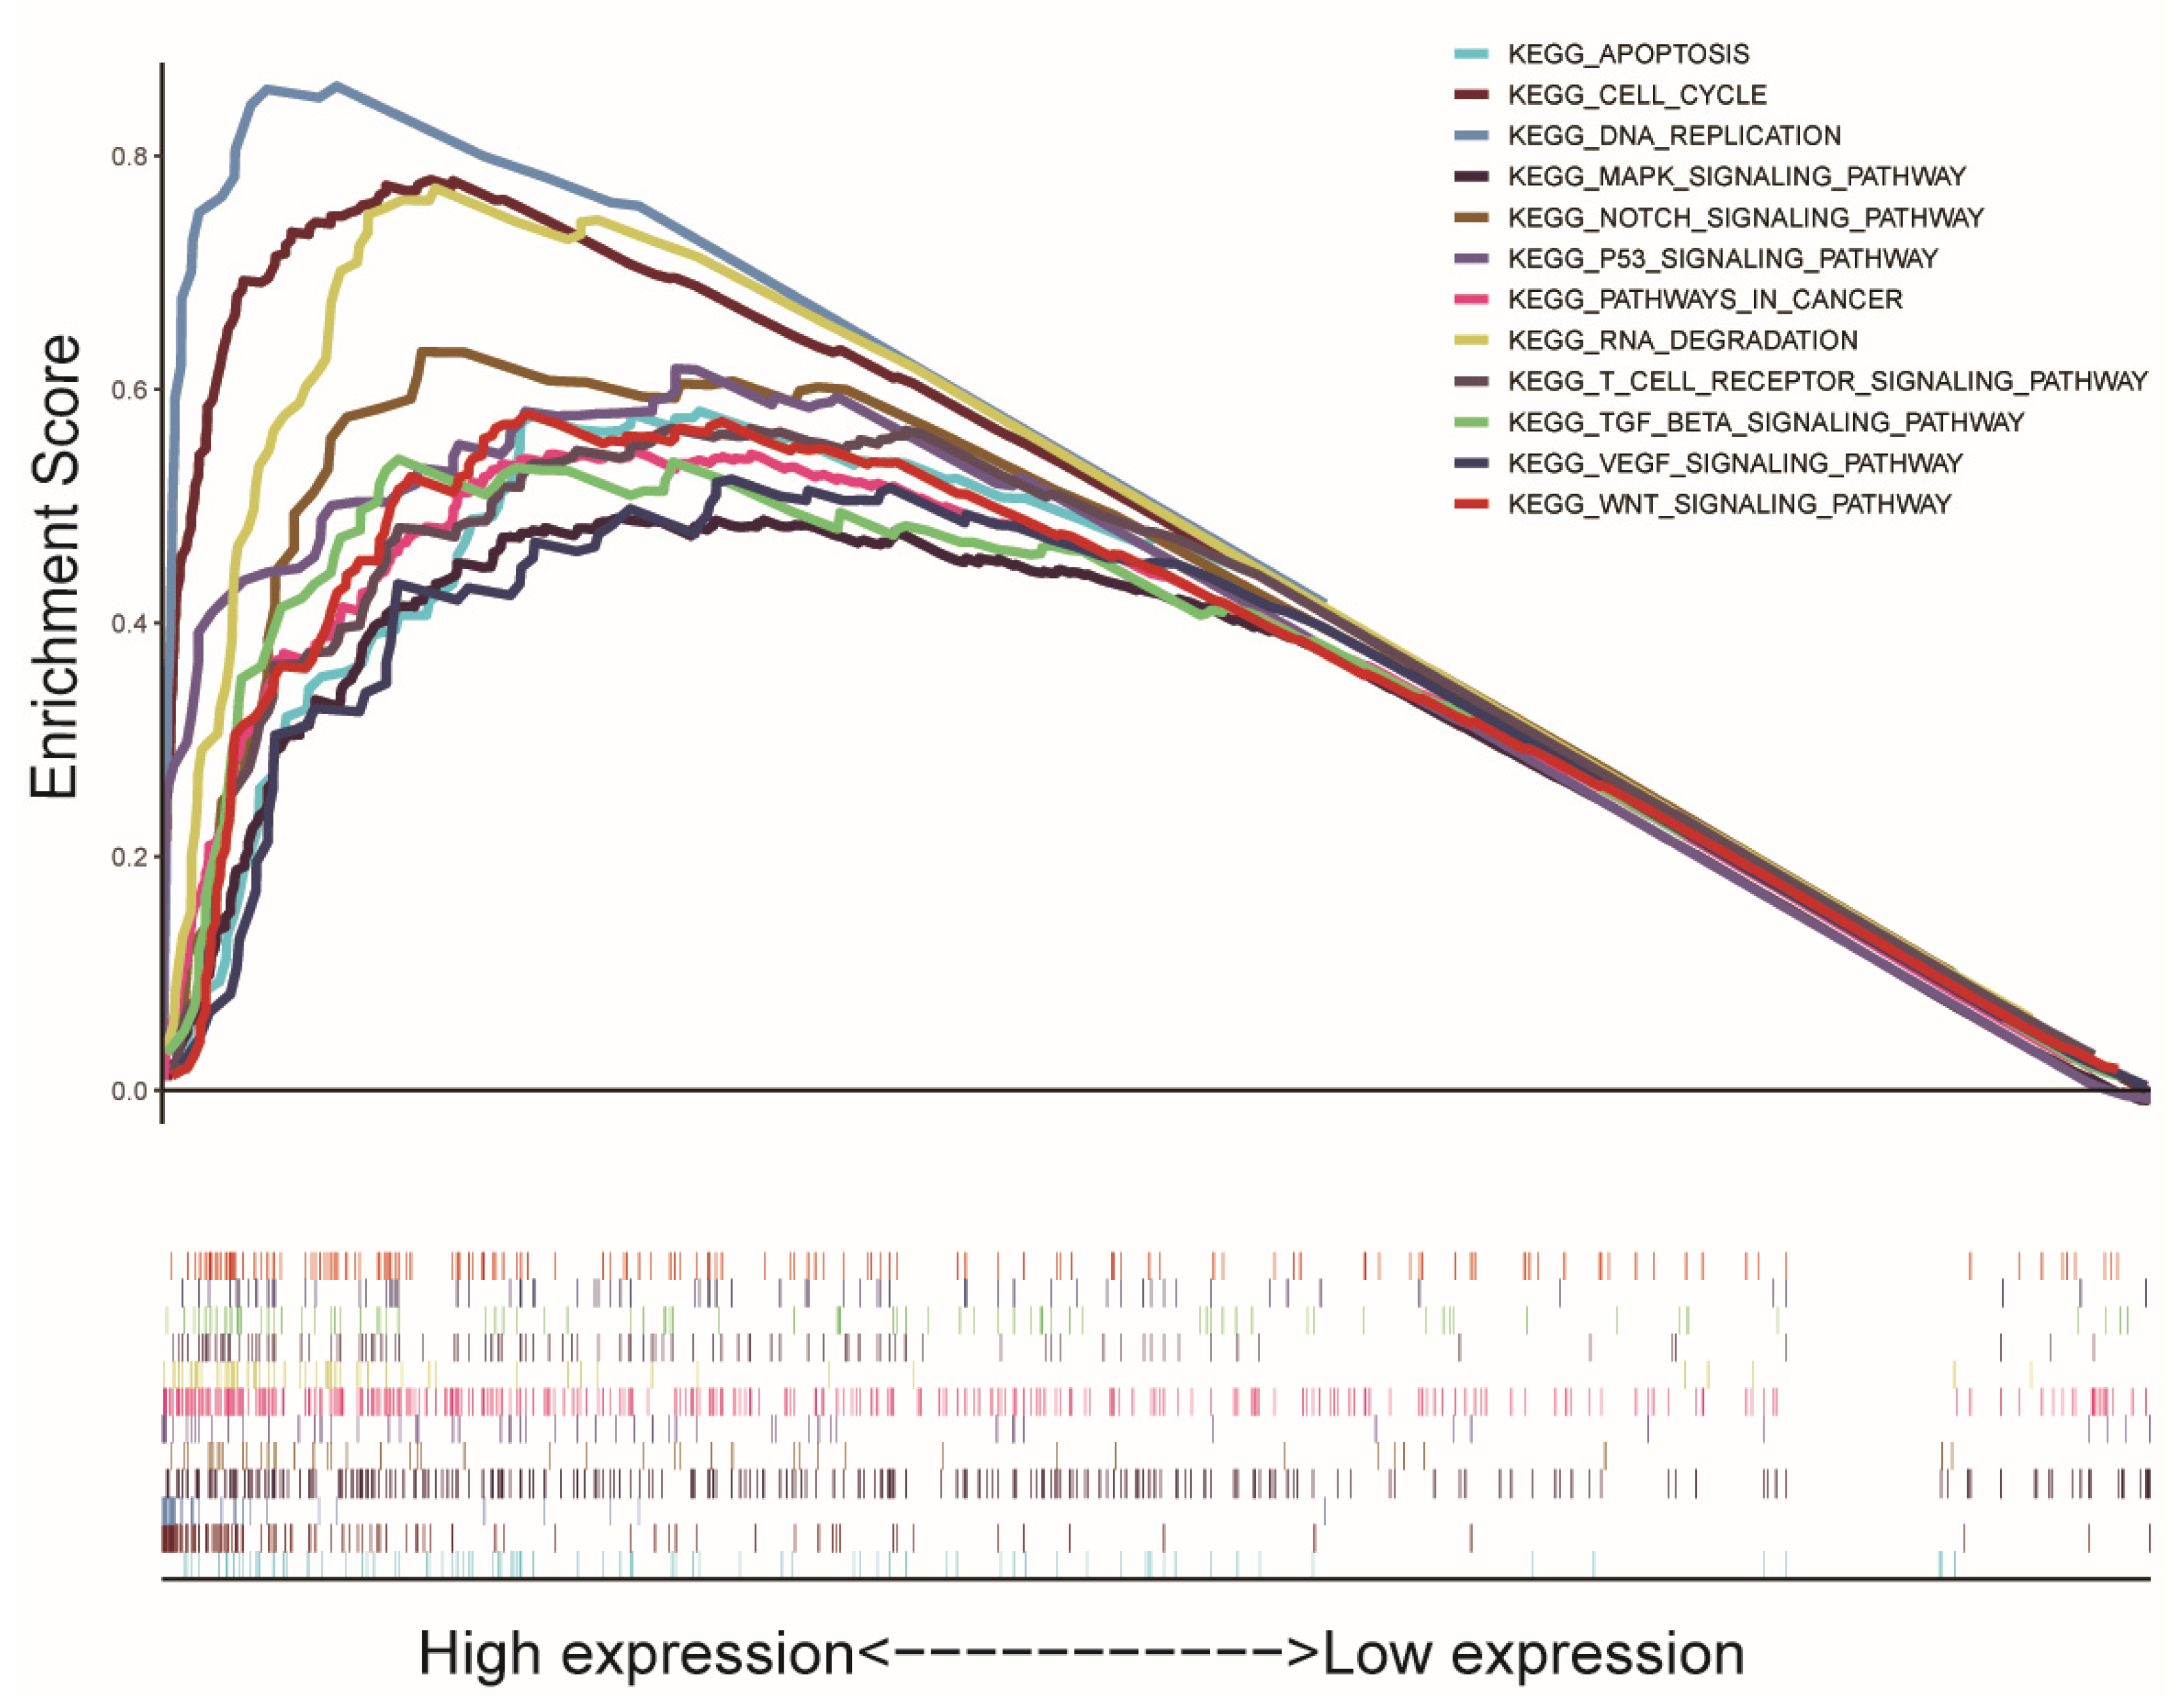
2.4. Gene Set Enrichment Analysis (GSEA)

To explore the related signaling pathways of SGO2 in HCC, GSEA (version 3.0) was used as a signal pathway analysis tool. The datasets with high or low expressions of SGO2 were analyzed for gene expression enrichment. The annotated gene set was chosen (c2.cp.kegg.v7.2.symbols.gmt) as the reference gene set. A total of 1000 gene sets were arranged for each analysis to identify significantly different pathways. The significance of the association between gene sets and signaling pathways was evaluated by the normalized enrichment score (NES), nominal p-value, and false discovery rate (FDR) q-value.

2.5. Protein–Protein Interaction (PPI) Network and Gene Co-Expression Network Analysis

STRING (http://string-db.org, 3 November 2020) (version 11.0) is an online biological database that aims to integrate all known and predicted associations between proteins, including physical interactions and functional associations [28,29]. In order to analyze the interaction between these proteins, the SGO2-related genes were input into the STRING database. Medium confidence (0.400) was regarded as the minimum interaction score to remove protein nodes that did not interact with other proteins.
The Coexpedia database (http://www.coexpedia.org/, accessed on 3 November 2020) was used to analyze the co-expression of SGO2 and other related genes in the HCC samples.

2.6. Statistical Analysis

The difference of SGO2 expression between HCC tissues and nontumor tissues was analyzed by the Mann–Whitney U test. The correlation between SGO2 expression and clinicopathological parameters was evaluated by the chi-square test. A Kaplan–Meier analysis and log-rank test were performed to compare survival rates between groups with different SGO2 expression levels. Univariate and multivariate survival analyses were evaluated by the Cox proportional hazard regression model. All statistical analyses were performed with R software (version 3.5.3) and IBM SPSS (version 24.0, IBM Corporation, Armonk, NY, USA). Two-tailed p < 0.05 was considered significant in all trials.

3. Results

3.1. SGO2 Expression Comparison

The data analyzed in this study originated from the TCGA database of 374 HCC samples and 50 nontumor samples, a total of 424 tissues of SGO2 mRNA expression information. The mRNA expression profiles of SGO2 in the HCC tissues and nontumor tissues are shown by scatter plot. The expression level of SGO2 in nontumor tissues was significantly lower than tumor tissues (p < 0.001; Figure 1A). For validation, we analyzed the expression of SGO2 in HCC tissues in the GEPIA2 and Oncomine databases. The threshold value was set as p ≤ 0.001 and fold change ≥ 2. SGO2 was significantly upregulated in the HCC tissues (all p < 0.001; Figure 1B,C). In addition, to assess the relationship between the clinicopathological features and expression level of SGO2, high and low expressions of SGO2 were grouped according to tumor grade, tumor stage and T stage, vascular invasion, and ECOG score (all p < 0.05; Figure 1D–H).

3.2. Associations between SGO2 and Survival in HCC Patients

Our Kaplan–Meier risk assessment of the HCC patients in the TCGA database showed that a high SGO2 expression was more significantly associated with a poor OS than a low SGO2 expression (p < 0.001; Figure 2A). High and low expressions were grouped based on the median expression value of SGO2. The median OS of the SGO2 high expression group and low expression group were 38.3 months and 71.0 months, respectively. The 5-year survival rate of the SGO2 high expression group (44.1%) was lower than that of the SGO2 low expression group (54.1%). Validation was performed in the Kapan–Meier Plotter online service in the GEPIA2 database. The analysis also revealed that the SGO2 high expression was more significantly associated with a low OS rate (p < 0.001; Figure 2B). The median OS of the SGO2 high expression group and low expression group were 38.2 months and 70.6 months, respectively. The 5-year survival of the SGO2 high expression group (43.7%) was also poorer than that of the SGO2 low expression group (55.8%).

3.3. Association between SGO2 Expression and Clinicopathological Features in HCC

The clinicopathological data of 235 HCC patients were obtained from the TCGA database to explore the relationship between the SGO2 expression and clinicopathological parameters. High and low expressions were grouped based on the median expression value of SGO2. The high expression level of SGO2 was significantly correlated with gender (p = 0.034), tumor grade (p < 0.001), and ECOG score (p = 0.004). The results are summarized in Table 2. The logistic regression analysis showed that the upregulated expression of SGO2 in HCC tissues was significantly correlated with gender (OR = 2.278, p = 0.014), tumor grade (OR = 2.622, p < 0.001), tumor stage (OR = 2.317 for stage II vs. stage I, p = 0.002; OR = 2.170 for stages III and IV vs. stage I, p = 0.003), T classification (OR = 1.523 for T3 and T4 vs. T1 and T2, p < 0.001), and ECOG score (OR = 3.263 for 0 to 1 vs. 2–4, p = 0.002). Results were shown in Table 3.

3.4. Univariate and Multivariate Analysis

A total of 317 HCC patients were evaluated by univariate and multivariate analyses based on the Cox proportional hazard regression model to analyze the effect of the SGO2 expression level and other clinicopathological features on survival. The univariate analysis showed that the pathological stage (HR, 1.586; 95% CI, 1.160–2.169; p = 0.004), T stage (HR, 1.506; 95% CI, 1.105–2.052; p = 0.01), M stage (HR, 5.570; 95% CI, 1.707–18.179; p = 0.004), vascular invasion (HR, 1.571; 95% CI, 1.01–2.443; p = 0.045), and SGO2 expression (HR, 1.412; 95% CI, 1.123–1.776; p = 0.003) were important predictors of survival (Table 4). The multivariate analysis showed that age (HR, 1.035; 95% CI, 1.005–1.063; p = 0.022) and a high expression of SGO2 (HR, 1.401; 95% CI, 1.066–1.841; p = 0.016) were important independent predictors of a poor overall survival (Table 4 and Figure 3).

3.5. GSEA Biological Process Enrichment

We analyzed the data from the TCGA database to explore the SGO2 function and its related signal transduction pathways through GSEA. The most significantly enriched signaling pathways were selected according to the NES, FDR q-value, and nominal p-value. In this study, 12 signaling pathways involved in apoptosis, cell cycle, DNA replication, the MAPK signaling pathway, NOTCH signaling pathway, P53 signaling pathway, pathways in cancer, RNA degradation, T-cell receptor signaling pathway, TGF-β signaling pathway, VEGF signaling pathway, and Wnt signaling pathway were the most enriched in the highly expressed phenotypes of SGO2 (Table 5 and Figure 4).

3.6. Protein–Protein Interaction (PPI) Network Construction and Gene Co-Expression Network Analysis

The STRING database was used to analyze the PPI. The data revealed that 10 genes, including CCNB1, PBK, AURKB, BUB1B, BUB1, KIF11, PPP2R4, PLK1, CDCA8, and XP_007183046.1, interacted with SGO2 (Figure 5A).
The identification of the SGO2 co-expressed genes was performed by a Coexpedia database online analysis (https://www.coexpedia.org, accessed on 3 November 2020). Co-expressed genes with SGOL2 were ranked by a summation of the neighbor’s locally linear selection (LLS) scores and enriched terms by a p-value < 0.05. As a result, 34 genes were shown to have significant correlations with SGO2 (Figure 5B).

4. Discussion

In our study, we downloaded the mRNA levels of SGO2 in nontumor and tumor samples through the public database TCGA and analyzed the relationships between the expression level of SGO2 and the OS and clinicopathology of HCC patients. We used the Oncomine and GEPIA2 databases to verify the SGO2 expression level and OS in HCC. Prospectively, the results also showed that the expression level of SGO2 in HCC tissues and nontumor tissues were significantly different, and the SGO2 expressed in tumor samples was considerably higher. Moreover, the prognosis of patients with an increased expression of SGO2 was worse than that of patients with a low expression of SGO2. Similar results were validated in the Oncomine and GEPIA2 databases. Moreover, the expression level of SGO2 displayed a gradually increasing trend with the severity of the tumor grade, pathology stage, vascular invasion, and ECOG score.
HCC has a low survival rate due to a late initial diagnosis, high recurrence and metastasis rate, biological behaviors of tumors, etc. [6,30,31]. More than 50% of HCC patients lost the opportunity to receive a potentially curative treatment when they were first diagnosed [5,32,33]. The current drug treatments, including targeted therapy and immunotherapy, have not achieved satisfactory results in most patients with advanced HCC, which may be related to the multitarget gene mutation and drug resistance of the tumor [8,10,11,34,35]. Research on most HCC patients who have not received a curative treatment will bring substantial potential benefits to these patients.
Human SGO2, an essential protector of meiotic cohesion, has been proven to associate with abnormal cell division in the cell cycle [13,20]. SGO2 functions as an essential protector for centromeric cohesion and is required for accurate chromosome segregation during mitosis and meiosis. For instance, SGO2 could cooperate with PPP2CA to protect centromeric cohesin from separase-mediated cleavage in oocytes, specifically during meiosis I, and protect REC8 at centromeres from cleavage by separase. Therefore, SGO2 is essential for accurate gametogenesis. In addition, SGO2 may act by targeting PPP2CA to centromeres, leading to cohesin dephosphorylation [20,22,23]. In recent years, some researchers have discovered that SGO2 may be combined with other genes to participate in partial tumor occurrence and development [24,25]. The current studies have confirmed that SGO2 can inhibit the stemness properties, which could be regarded as a potential treatment target for gastric cancer, and could predict these patient outcomes. In addition, one study revealed that SGO2 might be related to the expression of meiosis-specific cancer testis antigens. Moreover, SGO2 was confirmed to associate with endogenous cancer by a weighted gene co-expression network analysis [24,27,36]. Cell Division Cycle Associated (CDCA) family genes were proven to be associated with survival in HCC patients with the hepatitis virus or alcohol consumption. One of the most relevant neighboring genes to CDCAs in HCC was SGO2 [26]. At present, the therapeutic efficacy of targeted treatment and immunotherapy is still unsatisfactory [37,38]. Therefore, the treatment of multitargets needs to be further explored. From previous research, SGO2 may be regarded as a new potential target. However, the study of the expression, prognosis, and clinicopathological characteristics of SGO2 in HCC is still poorly understood.
To explore the related genes and proteins of SGO2, the PPI and gene co-expression analysis in this research established that SGO2 had a significant correlation with cancer-related genes. Chen et al. found that CCNB1 promotes proliferation and metastasis in gastric cancer [39]. PBK, AURKB, KIF11, and PLK1 confirmed that they are closely related to the occurrence and progression of gastrointestinal tumors, including HCC [40,41,42,43,44]. Other interacting genes, such as BUB1B, BUB1, PPP2R4, and CDCA8 also demonstrated in studies that they participated in various malignancy signal pathways [45,46,47,48,49]. Therefore, we can speculate that SGO2, a coding gene that interacts with other genes and closely contributed to the growth and development of tumors, has a vital role in promoting cancer development.
The GSEA enrichment analysis in our research found that SGO2 is involved in many critical signal transduction pathways. The expression level and signal pathway of TGF-β are closely related to cell growth, differentiation, immune regulation, epithelial–mesenchymal transition, and the biological behavior of tumors [50,51]. The Notch signaling pathway is involved in many normal cell morphogenesis processes, including cell proliferation, differentiation, apoptosis, etc. [52,53]. DNA damage, oxidative stress, and oncogene activation can contribute to the activation of P53. The p53 protein has a role in cell cycle arrest, cellular senescence, or apoptosis [54,55]. The T-cell receptor signaling pathway is closely connected with T-cell proliferation, cytokine production, and immune cell differentiation into effector cells [56,57]. The VEGF signaling pathway plays a crucial role in both physiologic and pathologic angiogenesis [58,59]. The other signaling pathways in this GSEA analysis, such as pathways in cancer, the MAPK signaling pathway, cell cycle, RNA degradation, DNA replication, and the Wnt signaling pathway, are closely related to cancer and will not be discussed here [60,61,62,63]. To sum up, SGO2 promotes the development of HCC by regulating various vital cancer-related signaling pathways.
We acknowledge that this research has certain limitations. Firstly, some clinical data are missing, and other important data are not provided, such as tumor size, tumor number, disease-free survival, liver etiology, hepatitis infection status, Child–Pugh classification, Barcelona Clinic Liver Cancer (BCLC) stage, etc. Thus, it is difficult to analyze the relationship between SGO2 and the significant indicators of HCC. Secondly, this study mainly focused on a bioinformatics analysis without experimental and clinical cohort validation. Thirdly, the deletion of cases due to incomplete clinicopathologic information resulted in partial data that failed to achieve satisfactory results. For example, the number of T4 stage cases was too small, resulting in the findings not being like the T1, T2, and T3 stages; that is, the expression level of SGO2 upregulated with the increase of the T stage. In addition, there is insufficient research on the relationship between SGO2 and HCC or other cancers. The conclusions of this study are difficult to compare with the findings of other investigations. The role of SGO2 in cancer still needs further exploration. Finally, the protein expression of SGO2 in HCC tissues cannot be obtained from the TCGA and other databases.

5. Conclusions

Through the TCGA, Oncomine, and GEPIA2 database analyses, this study found that the expression of SGO2 in HCC tissues was higher than that in nontumor tissues. The poor OS of HCC patients and some advanced stage clinicopathological features were closely relevant to the upregulation of SGO2. Moreover, the univariate and multivariate survival analyses revealed that the high SGO2 expression in HCC was an independent risk factor for poor OS. Therefore, the expression level of SGO2 may be a potential marker for the diagnosis and prognosis of HCC. We may try to target SGO2 to regulate the development of HCC, which would provide an essential theoretical basis for the development of targeted drug therapies for HCC. In addition to the corresponding basic research, future studies also need clinical trials to verify the diagnostic and therapeutic values of SGO2 in HCC.

Author Contributions

Conceptualization, project administration, formal analysis, software, and writing—review and editing, M.D.; data analysis, software, figures preparation, writing—review and editing, S.L.; data curation and analysis, figure and table preparations, J.M. and W.L.; data collection and analysis, J.Z.; conceived and designed this study, W.W.; and conceptualization, supervision, writing—review and editing, R.G. All authors have read and agreed to the published version of the manuscript.

Funding

This research received no external funding.

Institutional Review Board Statement

Not applicable.

Informed Consent Statement

Not applicable.

Data Availability Statement

Publicly available datasets were analyzed in this study, and these can be found in The Cancer Genome Atlas (https://portal.gdc.cancer.gov/, accessed on 23 October 2020), The Oncomine database (https://www.oncomine.org/, accessed on 1 November 2020); and The GEPIA2 database (http://gepia2.cancer-pku.cn/#index, accessed on 1 November 2020).

Acknowledgments

We acknowledge the TCGA database for providing its platform and contributors for uploading their meaningful datasets.

Conflicts of Interest

The authors declare no conflict of interest.

Abbreviations

HCC, hepatocellular carcinoma; ECOG, Eastern Cancer Oncology Group; SGO1, shugoshin 1; SGO2, shugoshin 2; TKI, tyrosine kinase inhibitors; ATAD2, ATPase family AAA domain-containing protein 2; TTK, TTK protein kinase; HR, hazard ratio; CI, confidence interval; NES, normalized enrichment score; NOM, nominal; FDR, false discovery rate; TCGA, The Cancer Genome Atlas; GEPIA2, Gene Expression Profiling Interactive Analysis 2; GSEA, Gene Set Enrichment Analysis; OS, overall survival; PPI, protein–protein interaction; CDCA, Cell Division Cycle Associated; BCLC, Barcelona Clinic Liver Cancer.

References

  1. Villanueva, A. Hepatocellular Carcinoma. N. Engl. J. Med. 2019, 380, 1450–1462. [Google Scholar] [CrossRef] [PubMed] [Green Version]
  2. Forner, A.; Reig, M.; Bruix, J. Hepatocellular carcinoma. Lancet 2018, 391, 1301–1314. [Google Scholar] [CrossRef]
  3. Llovet, J.M.; Zucman-Rossi, J.; Pikarsky, E.; Sangro, B.; Schwartz, M.; Sherman, M.; Gores, G. Hepatocellular carcinoma. Nat. Rev. Dis. Primers 2016, 2, 16018. [Google Scholar] [CrossRef] [PubMed]
  4. European Association for the Study of the Liver. EASL Clinical Practice Guidelines: Management of hepatocellular carcinoma. J. Hepatol. 2018, 69, 182–236. [Google Scholar] [CrossRef] [PubMed] [Green Version]
  5. Marrero, J.A.; Kulik, L.M.; Sirlin, C.B.; Zhu, A.X.; Finn, R.S.; Abecassis, M.M.; Roberts, L.R.; Heimbach, J.K. Diagnosis, Staging, and Management of Hepatocellular Carcinoma: 2018 Practice Guidance by the American Association for the Study of Liver Diseases. Hepatology 2018, 68, 723–750. [Google Scholar] [CrossRef] [PubMed] [Green Version]
  6. Bruix, J.; Gores, G.J.; Mazzaferro, V. Hepatocellular carcinoma: Clinical frontiers and perspectives. Gut 2014, 63, 844–855. [Google Scholar] [CrossRef]
  7. Orcutt, S.T.; Anaya, D.A. Liver Resection and Surgical Strategies for Management of Primary Liver Cancer. Cancer Control 2018, 25, 1073274817744621. [Google Scholar] [CrossRef]
  8. Lohitesh, K.; Chowdhury, R.; Mukherjee, S. Resistance a major hindrance to chemotherapy in hepatocellular carcinoma: An insight. Cancer Cell Int. 2018, 18, 44. [Google Scholar] [CrossRef]
  9. Jindal, A.; Thadi, A.; Shailubhai, K. Hepatocellular Carcinoma: Etiology and Current and Future Drugs. J. Clin. Exp. Hepatol. 2019, 9, 221–232. [Google Scholar] [CrossRef]
  10. Roderburg, C.; Özdirik, B.; Wree, A.; Demir, M.; Tacke, F. Systemic treatment of hepatocellular carcinoma: From sorafenib to combination therapies. Hepat. Oncol. 2020, 7, HEP20. [Google Scholar] [CrossRef]
  11. Zongyi, Y.; Xiaowu, L. Immunotherapy for hepatocellular carcinoma. Cancer Lett. 2020, 470, 8–17. [Google Scholar] [CrossRef]
  12. Shen, Y.; Bu, L.; Li, R.; Chen, Z.; Tian, F.; Lu, N.; Ge, Q.; Bai, Y.; Lu, Z. Screening effective differential expression genes for hepatic carcinoma with metastasis in the peripheral blood mononuclear cells by RNA-seq. Oncotarget 2017, 8, 27976–27989. [Google Scholar] [CrossRef] [Green Version]
  13. Faridi, R.; Rehman, A.U.; Morell, R.J.; Friedman, P.L.; Demain, L.; Zahra, S.; Khan, A.A.; Tohlob, D.; Assir, M.Z.; Beaman, G.; et al. Mutations of SGO2 and CLDN14 collectively cause coincidental Perrault syndrome. Clin. Genet. 2017, 91, 328–332. [Google Scholar] [CrossRef] [Green Version]
  14. Qi, J.; Zhou, J.; Tang, X.Q.; Wang, Y. Gene Biomarkers Derived from Clinical Data of Hepatocellular Carcinoma. Interdiscip Sci. 2020, 12, 226–236. [Google Scholar] [CrossRef]
  15. Wang, L.H.; Yen, C.J.; Li, T.N.; Elowe, S.; Wang, W.C.; Wang, L.H. Sgo1 is a potential therapeutic target for hepatocellular carcinoma. Oncotarget 2015, 6, 2023–2033. [Google Scholar] [CrossRef]
  16. Yamada, H.Y.; Zhang, Y.; Reddy, A.; Mohammed, A.; Lightfoot, S.; Dai, W.; Rao, C.V. Tumor-promoting/progressing role of additional chromosome instability in hepatic carcinogenesis in Sgo1 (Shugoshin 1) haploinsufficient mice. Carcinogenesis 2015, 36, 429–440. [Google Scholar] [CrossRef] [PubMed]
  17. Meng, X.; Wang, L.; Zhu, B.; Zhang, J.; Guo, S.; Li, Q.; Zhang, T.; Zheng, Z.; Wu, G.; Zhao, Y. Integrated Bioinformatics Analysis of the Clinical Value and Biological Function of ATAD2 in Hepatocellular Carcinoma. BioMed Res. Int. 2020, 2020, 8657468. [Google Scholar] [CrossRef] [PubMed]
  18. Sun, W.; He, B.; Yang, B.; Hu, W.; Cheng, S.; Xiao, H.; Yang, Z.; Wen, X.; Zhou, L.; Xie, H.; et al. Genome-wide CRISPR screen reveals SGOL1 as a druggable target of sorafenib-treated hepatocellular carcinoma. Lab. Investig. 2018, 98, 734–744. [Google Scholar] [CrossRef] [PubMed] [Green Version]
  19. Hellmuth, S.; Gómez-H, L.; Pendás, A.M.; Stemmann, O. Securin-independent regulation of separase by checkpoint-induced shugoshin-MAD2. Nature 2020, 580, 536–541. [Google Scholar] [CrossRef]
  20. Kitajima, T.S.; Sakuno, T.; Ishiguro, K.; Iemura, S.; Natsume, T.; Kawashima, S.A.; Watanabe, Y. Shugoshin collaborates with protein phosphatase 2A to protect cohesin. Nature 2006, 441, 46–52. [Google Scholar] [CrossRef]
  21. Salic, A.; Waters, J.C.; Mitchison, T.J. Vertebrate shugoshin links sister centromere cohesion and kinetochore microtubule stability in mitosis. Cell 2004, 118, 567–578. [Google Scholar] [CrossRef] [Green Version]
  22. Huang, H.; Feng, J.; Famulski, J.; Rattner, J.B.; Liu, S.T.; Kao, G.D.; Muschel, R.; Chan, G.K.; Yen, T.J. Tripin/hSgo2 recruits MCAK to the inner centromere to correct defective kinetochore attachments. J. Cell Biol. 2007, 177, 413–424. [Google Scholar] [CrossRef]
  23. Tsukahara, T.; Tanno, Y.; Watanabe, Y. Phosphorylation of the CPC by Cdk1 promotes chromosome bi-orientation. Nature 2010, 467, 719–723. [Google Scholar] [CrossRef]
  24. Chen, X.; Zhang, D.; Jiang, F.; Shen, Y.; Li, X.; Hu, X.; Wei, P.; Shen, X. Prognostic Prediction Using a Stemness Index-Related Signature in a Cohort of Gastric Cancer. Front. Mol. Biosci. 2020, 7, 570702. [Google Scholar] [CrossRef]
  25. Li, L.; Huang, K.; Zhao, H.; Chen, B.; Ye, Q.; Yue, J. CDK1-PLK1/SGOL2/ANLN pathway mediating abnormal cell division in cell cycle may be a critical process in hepatocellular carcinoma. Cell Cycle 2020, 19, 1236–1252. [Google Scholar] [CrossRef]
  26. Jiang, S.S.; Ke, S.J.; Ke, Z.L.; Li, J.; Li, X.; Xie, X.W. Cell Division Cycle Associated Genes as Diagnostic and Prognostic Biomarkers in Hepatocellular Carcinoma. Front. Mol. Biosci. 2021, 8, 657161. [Google Scholar] [CrossRef]
  27. Liu, Y.; Chen, P.; Li, M.; Fei, H.; Huang, J.; Zhao, T.; Li, T. Comprehensive Analysis of the Control of Cancer Stem Cell Characteristics in Endometrial Cancer by Network Analysis. Comput. Math. Methods Med. 2021, 2021, 6653295. [Google Scholar] [CrossRef] [PubMed]
  28. Szklarczyk, D.; Jensen, L.J. Protein-protein interaction databases. Methods Mol. Biol. 2015, 1278, 39–56. [Google Scholar] [PubMed]
  29. Szklarczyk, D.; Gable, A.L.; Lyon, D.; Junge, A.; Wyder, S.; Huerta-Cepas, J.; Simonovic, M.; Doncheva, N.T.; Morris, J.H.; Bork, P.; et al. STRING v11: Protein-protein association networks with increased coverage, supporting functional discovery in genome-wide experimental datasets. Nucleic Acids Res. 2019, 47, D607. [Google Scholar] [CrossRef] [PubMed] [Green Version]
  30. Cucchetti, A.; Zhong, J.; Berhane, S.; Toyoda, H.; Shi, K.; Tada, T.; Chong, C.; Xiang, B.D.; Li, L.Q.; Lai, P.; et al. The chances of hepatic resection curing hepatocellular carcinoma. J. Hepatol. 2020, 72, 711–717. [Google Scholar] [CrossRef]
  31. Wang, M.D.; Li, C.; Liang, L.; Xing, H.; Sun, L.Y.; Quan, B.; Wu, H.; Xu, X.F.; Wu, M.C.; Pawlik, T.M.; et al. Early and Late Recurrence of Hepatitis B Virus-Associated Hepatocellular Carcinoma. Oncologist 2020, 25, e1541–e1551. [Google Scholar] [CrossRef] [PubMed]
  32. Meyers, B.M.; Knox, J.; Cosby, R.; Beecroft, J.R.; Chan, K.; Coburn, N.; Feld, J.; Jonker, D.; Mahmud, A.; Ringash, J.; et al. Nonsurgical management of advanced hepatocellular carcinoma: A clinical practice guideline. Curr. Oncol. 2020, 27, e106–e114. [Google Scholar] [PubMed]
  33. Chen, Z.; Xie, H.; Hu, M.; Huang, T.; Hu, Y.; Sang, N.; Zhao, Y. Recent progress in treatment of hepatocellular carcinoma. Am. J. Cancer Res. 2020, 10, 2993–3036. [Google Scholar]
  34. Anwanwan, D.; Singh, S.K.; Singh, S.; Saikam, V.; Singh, R. Challenges in liver cancer and possible treatment approaches. Biochim. Biophys. Acta Rev. Cancer 2020, 1873, 188314. [Google Scholar] [CrossRef]
  35. Huang, A.; Yang, X.R.; Chung, W.Y.; Dennison, A.R.; Zhou, J. Targeted therapy for hepatocellular carcinoma. Signal Transduct. Target. Ther. 2020, 5, 146. [Google Scholar] [CrossRef]
  36. Gantchev, J.; Martínez Villarreal, A.; Xie, P.; Lefrançois, P.; Gunn, S.; Netchiporouk, E.; Sasseville, D.; Litvinov, I.V. The Ectopic Expression of Meiosis Regulatory Genes in Cutaneous T-Cell Lymphomas (CTCL). Front. Oncol. 2019, 9, 429. [Google Scholar] [CrossRef]
  37. Chen, S.; Cao, Q.; Wen, W.; Wang, H. Targeted therapy for hepatocellular carcinoma: Challenges and opportunities. Cancer Lett. 2019, 460, 1–9. [Google Scholar] [CrossRef]
  38. Liu, X.; Qin, S. Immune Checkpoint Inhibitors in Hepatocellular Carcinoma: Opportunities and Challenges. Oncologist 2019, 24, S3–S10. [Google Scholar] [CrossRef] [PubMed] [Green Version]
  39. Chen, E.B.; Qin, X.; Peng, K.; Li, Q.; Tang, C.; Wei, Y.C.; Yu, S.; Gan, L.; Liu, T.S. HnRNPR-CCNB1/CENPF axis contributes to gastric cancer proliferation and metastasis. Aging 2019, 11, 7473–7491. [Google Scholar] [CrossRef]
  40. Han, X.; Zhang, J.J.; Han, Z.Q.; Zhang, H.B.; Wang, Z.A. Let-7b attenuates cisplatin resistance and tumor growth in gastric cancer by targeting AURKB. Cancer Gene Ther. 2018, 25, 300–308. [Google Scholar] [CrossRef] [PubMed]
  41. Pellegrino, R.; Calvisi, D.F.; Ladu, S.; Ehemann, V.; Staniscia, T.; Evert, M.; Dombrowski, F.; Schirmacher, P.; Longerich, T. Oncogenic and tumor suppressive roles of polo-like kinases in human hepatocellular carcinoma. Hepatology 2010, 51, 857–868. [Google Scholar] [CrossRef] [PubMed]
  42. Kwon, C.H.; Park, H.J.; Choi, Y.R.; Kim, A.; Kim, H.W.; Choi, J.H.; Hwang, C.S.; Lee, S.J.; Choi, C.I.; Jeon, T.Y.; et al. PSMB8 and PBK as potential gastric cancer subtype-specific biomarkers associated with prognosis. Oncotarget 2016, 7, 21454–21468. [Google Scholar] [CrossRef] [Green Version]
  43. Su, T.C.; Chen, C.Y.; Tsai, W.C.; Hsu, H.T.; Yen, H.H.; Sung, W.W.; Chen, C.J. Cytoplasmic, nuclear, and total PBK/TOPK expression is associated with prognosis in colorectal cancer patients: A retrospective analysis based on immunohistochemistry stain of tissue microarrays. PLoS ONE 2018, 13, e0204866. [Google Scholar] [CrossRef] [PubMed] [Green Version]
  44. Chen, J.; Rajasekaran, M.; Xia, H.; Zhang, X.; Kong, S.N.; Sekar, K.; Seshachalam, V.P.; Deivasigamani, A.; Goh, B.K.; Ooi, L.L.; et al. The microtubule-associated protein PRC1 promotes early recurrence of hepatocellular carcinoma in association with the Wnt/β-catenin signalling pathway. Gut 2016, 65, 1522–1534. [Google Scholar] [CrossRef]
  45. Zhang, L.; Makamure, J.; Zhao, D.; Liu, Y.; Guo, X.; Zheng, C.; Liang, B. Bioinformatics analysis reveals meaningful markers and outcome predictors in HBV-associated hepatocellular carcinoma. Exp. Ther. Med. 2020, 20, 427–435. [Google Scholar] [CrossRef] [PubMed]
  46. Sents, W.; Meeusen, B.; Kalev, P.; Radaelli, E.; Sagaert, X.; Miermans, E.; Haesen, D.; Lambrecht, C.; Dewerchin, M.; Carmeliet, P.; et al. PP2A Inactivation Mediated by PPP2R4 Haploinsufficiency Promotes Cancer Development. Cancer Res. 2017, 77, 6825–6837. [Google Scholar] [CrossRef] [Green Version]
  47. Lee, E.; Pain, M.; Wang, H.; Herman, J.A.; Toledo, C.M.; DeLuca, J.G.; Yong, R.L.; Paddison, P.; Zhu, J. Sensitivity to BUB1B Inhibition Defines an Alternative Classification of Glioblastoma. Cancer Res. 2017, 77, 5518–5529. [Google Scholar] [CrossRef] [Green Version]
  48. Ci, C.; Tang, B.; Lyu, D.; Liu, W.; Qiang, D.; Ji, X.; Qiu, X.; Chen, L.; Ding, W. Overexpression of CDCA8 promotes the malignant progression of cutaneous melanoma and leads to poor prognosis. Int. J. Mol. Med. 2019, 43, 404–412. [Google Scholar] [CrossRef] [Green Version]
  49. Ma, Q.; Liu, Y.; Shang, L.; Yu, J.; Qu, Q. The FOXM1/BUB1B signaling pathway is essential for the tumorigenicity and radioresistance of glioblastoma. Oncol. Rep. 2017, 38, 3367–3375. [Google Scholar] [CrossRef] [Green Version]
  50. Katz, L.H.; Likhter, M.; Jogunoori, W.; Belkin, M.; Ohshiro, K.; Mishra, L. TGF-β signaling in liver and gastrointestinal cancers. Cancer Lett. 2016, 379, 166–172. [Google Scholar] [CrossRef] [Green Version]
  51. Ishimoto, T.; Miyake, K.; Nandi, T.; Yashiro, M.; Onishi, N.; Huang, K.K.; Lin, S.J.; Kalpana, R.; Tay, S.T.; Suzuki, Y.; et al. Activation of Transforming Growth Factor Beta 1 Signaling in Gastric Cancer-associated Fibroblasts Increases Their Motility, via Expression of Rhomboid 5 Homolog 2, and Ability to Induce Invasiveness of Gastric Cancer Cells. Gastroenterology 2017, 153, 191–204.e16. [Google Scholar] [CrossRef] [PubMed]
  52. Bray, S.J. Notch signalling: A simple pathway becomes complex. Nat. Rev. Mol. Cell Biol. 2006, 7, 678–689. [Google Scholar] [CrossRef]
  53. Schweisguth, F. Regulation of notch signaling activity. Curr. Biol. 2004, 14, R129–R138. [Google Scholar] [CrossRef] [PubMed]
  54. Bode, A.M.; Dong, Z. Post-translational modification of p53 in tumorigenesis. Nat. Rev. Cancer 2004, 4, 793–805. [Google Scholar] [CrossRef] [PubMed]
  55. Horn, H.F.; Vousden, K.H. Coping with stress: Multiple ways to activate p53. Oncogene 2007, 26, 1306–1316. [Google Scholar] [CrossRef] [Green Version]
  56. Qian, Z.; Zhang, Z.; Wang, Y. T cell receptor signaling pathway and cytokine-cytokine receptor interaction affect the rehabilitation process after respiratory syncytial virus infection. PeerJ 2019, 7, e7089. [Google Scholar] [CrossRef] [Green Version]
  57. Courtney, A.H.; Lo, W.L.; Weiss, A. TCR Signaling: Mechanisms of Initiation and Propagation. Trends Biochem. Sci. 2018, 43, 108–123. [Google Scholar] [CrossRef]
  58. Matsumoto, T.; Claesson-Welsh, L. VEGF receptor signal transduction. Sci. STKE 2001, 2001, re21. [Google Scholar] [CrossRef] [PubMed]
  59. Mueller, M.D.; Vigne, J.L.; Minchenko, A.; Lebovic, D.I.; Leitman, D.C.; Taylor, R.N. Regulation of vascular endothelial growth factor (VEGF) gene transcription by estrogen receptors alpha and beta. Proc. Natl. Acad. Sci. USA 2000, 97, 10972–10977. [Google Scholar] [CrossRef] [PubMed] [Green Version]
  60. Wittenberg, C.; Reed, S.I. Cell cycle-dependent transcription in yeast: Promoters, transcription factors, and transcriptomes. Oncogene 2005, 24, 2746–2755. [Google Scholar] [CrossRef] [Green Version]
  61. Kitao, H.; Iimori, M.; Kataoka, Y.; Wakasa, T.; Tokunaga, E.; Saeki, H.; Oki, E.; Maehara, Y. DNA replication stress and cancer chemotherapy. Cancer Sci. 2018, 109, 264–271. [Google Scholar] [CrossRef] [PubMed] [Green Version]
  62. Houseley, J.; Tollervey, D. The many pathways of RNA degradation. Cell 2009, 136, 763–776. [Google Scholar] [CrossRef] [PubMed] [Green Version]
  63. Logan, C.Y.; Nusse, R. The Wnt signaling pathway in development and disease. Annu. Rev. Cell Dev. Biol. 2004, 20, 781–810. [Google Scholar] [CrossRef] [PubMed] [Green Version]
Figure 1. The expression of SGO2 and its association with the clinicopathological features based on the TCGA, Oncomine, and GEPIA2 data. (A) Comparison of the SGO2 expression between nontumor samples and HCC samples in the TCGA database. Validation of the SGO2 expression level by the GEPIA2 (B) and Oncomine (C) databases. The expression of SGO2 in the clinicopathological parameters, including tumor grade (D), pathological stage (E), T stage (F), vascular invasion (G), and ECOG score (H). SGO2, shugoshin 2; TCGA, The Cancer Genome Atlas; GEPIA2, Gene Expression Profiling Interactive Analysis 2; HCC, hepatocellular carcinoma; ECOG, Eastern Cancer Oncology Group.
Genes 12 00876 g001
Figure 2. Overall survival of HCC patients grouped by the SGO2 median cutoff in the TCGA (A) and GEPIA2 databases (B). SGO2, shugoshin 2; TCGA, The Cancer Genome Atlas; GEPIA2, Gene Expression Profiling Interactive Analysis 2; HCC, hepatocellular carcinoma.
Genes 12 00876 g002
Figure 3. Forest plot for the multivariate Cox proportional hazard regression model. Age (HR, 1.0; 95% CI, 1.0047–1.1; p = 0.022) and SGO2 were independent predictors of a low survival rate (HR, 1.4; 95% CI, 1.0663–1.8; p = 0.016). SGO2, shugoshin 2; ECOG, Eastern Cancer Oncology Group; HR, hazard ratio; CI, confidence interval. * p < 0.05.
Genes 12 00876 g003
Figure 4. A merged enrichment plot from the gene set enrichment analysis, including the enrichment score and gene sets. The significantly enriched signaling pathways were apoptosis, cell cycle, DNA replication, the MAPK signaling pathway, NOTCH signaling pathway, P53 signaling pathway, pathways in cancer, RNA degradation, T-cell receptor signaling pathway, TGF-β signaling pathway, VEGF signaling pathway, and Wnt signaling pathway.
Genes 12 00876 g004
Figure 5. Hub genes of the PPI network (A). Construction of the gene co-expression networks (B). PPI, protein–protein interactions; SGOL2, shugoshin-like 2 (otherwise called shugoshin 2; SGO2).
Genes 12 00876 g005
Table 1. Characteristics of the HCC patients.
CharacteristicsVariablePatients (377)Percentages (%)
Age<50 years7219.10
≥50 years30480.63
Unknown10.27
GenderMale25567.64
Female12232.36
Tumor gradeG15514.59
G218047.74
G312432.89
G4133.45
Unknow51.33
Pathological stageI17546.42
II8723.08
III8622.81
IV51.33
Unknown246.36
TT118549.07
T29525.20
T38121.49
T4133.45
TX30.79
NN025768.17
N141.06
NX11630.77
M M027272.15
M141.06
MX10126.79
Vascular invasionNone21055.70
Micro9424.93
Macro174.51
Unknow5614.86
ECOG score016644.03
18622.81
2266.90
3123.18
430.80
Unknow8422.28
Vital statusAlive24966.05
Death12833.95
HCC, hepatocellular carcinoma; ECOG, Eastern Cancer Oncology Group. Data are presented as numbers (%).
Table 2. Relationships between the SGO2 expression and clinicopathological parameters in HCC.
Clinicopathological ParametersSGO2 ExpressionTotalp-Value
High (n = 212)Low (n = 212)
Age
<50 years45 (64.3)25 (35.7)700.184
≥50 years164 (54.7)136 (45.3)300
Gender
Male55 (45.1)67 (54.9)1220.034
Female35 (63.6)20 (36.4)55
Tumor grade
G1 and G2112 (48.3)120 (51.7)232<0.001
G3 and G495 (70.9)39 (29.1)134
Pathological stage
I and II136 (52.9)121 (47.1)2570.050
III and IV59 (65.7)31 (34.3)90
T classification
T1 and T2148 (53.8)127 (46.2)2750.063
T3 and T461 (65.6)32 (34.4)93
Vascular invasion
None103 (50)103 (50)2060.095
positive66 (60.6)43 (39.4)109
ECOG score
0 to 1123 (50)123 (50)2460.004
2–431 (75.6)10 (24.4)41
Bold values indicate p < 0.05. SGO2, shugoshin 2; HCC, hepatocellular carcinoma; ECOG, Eastern Cancer Oncology Group.
Table 3. SGO2 expression correlated with the clinicopathological parameters.
Clinicopathological ParametersTotal (N)Odds Ratio in SGO2 Expressionp-Value
Age
<50 vs. ≥503700.868 (0.514–1.462)0.596
Gender
Male vs. Female1782.278 (1.192–4.446)0.014
Tumor grade
G1 and G2 vs. G3 and G43662.622 (1.695–4.096)<0.001
Pathological stage
Stage II vs. Stage I2572.317 (1.370–3.960)0.002
Stage III and IV vs. Stage I2612.170 (1.295–3.669)0.003
T classification
T3 and T4 vs. T1 and T23681.523 (1.206–1.936)<0.001
Vascular invasion
positive vs. negative3151.572 (0.986–2.517)0.058
ECOG score
0 to 1 vs. 2–42873.263 (1.607–7.081)0.002
Bold values indicate p < 0.05; SGO2, shugoshin 2; ECOG, Eastern Cancer Oncology Group.
Table 4. Univariate analysis and multivariate analysis of the correlation of the SGO2 expressions among HCC patients.
ParameterUnivariate AnalysisMultivariate Analysis
HR95% CIpHR95% CIp
Age1.0210.996–1.0470.0981.033 1.005–1.0630.022
Gender1.6270.893–2.9620.1121.029 0.526–2.0150.933
Grade1.4690.966–2.2360.0721.490 0.887–2.5020.132
Pathological stage1.5861.160–2.1690.0042.115 0.385–11.6150.389
T1.5061.105–2.0520.0100.600 0.115–3.1430.546
N1.4000.192–10.2150.7400.1950.007–5.7770.345
M5.5701.707–18.1790.0044.324 0.866–21.5870.074
Vascular invasion1.5711.010–2.4430.0451.506 0.944–2.4050.086
ECOG score1.5310.982–2.3880.0601.429 0.869–2.3500.160
SGO21.4121.123–1.7760.0031.401 1.066–1.8410.016
Bold values indicate p < 0.05. HR, hazard ratio; CI, confidence interval; SGO2, shugoshin 2; HCC, hepatocellular carcinoma.
Table 5. Gene sets enriched in the high SGO2 expression phenotypes.
Gene Set NameNESNOM p-ValueFDR q-Value
KEGG_CELL_CYCLE2.230 0.000 0.000
KEGG_RNA_DEGRADATION2.097 0.0000.003
KEGG_DNA_REPLICATION2.001 0.000 0.005
KEGG_P53_SIGNALING_PATHWAY1.952 0.000 0.007
KEGG_WNT_SIGNALING_PATHWAY1.920 0.002 0.008
KEGG_PATHWAYS_IN_CANCER1.878 0.000 0.010
KEGG_NOTCH_SIGNALING_PATHWAY1.811 0.000 0.015
KEGG_APOPTOSIS1.751 0.004 0.022
KEGG_VEGF_SIGNALING_PATHWAY1.704 0.004 0.031
KEGG_MAPK_SIGNALING_PATHWAY1.696 0.002 0.032
KEGG_TGF_β_SIGNALING_PATHWAY1.689 0.014 0.033
KEGG_T_CELL_RECEPTOR_SIGNALING_PATHWAY1.658 0.016 0.040
SGO2, shugoshin 2; NES, normalized enrichment score; NOM, nominal; FDR, false discovery rate.
Publisher’s Note: MDPI stays neutral with regard to jurisdictional claims in published maps and institutional affiliations.

