Abstract
Pedigree information is necessary for the maintenance of diversity for wild and captive populations. Accurate pedigree is determined by molecular marker-based parentage analysis, which may be influenced by the polymorphism and number of markers, integrity of samples, relatedness of parents, or different analysis programs. Here, we described the first development of 208 single nucleotide polymorphisms (SNPs) and 11 microsatellites for giant grouper (Epinephelus lanceolatus) taking advantage of Genotyping-by-sequencing (GBS), and compared the power of SNPs and microsatellites for parentage and relatedness analysis, based on a mixed family composed of 4 candidate females, 4 candidate males and 289 offspring. CERVUS, PAPA and COLONY were used for mutually verification. We found that SNPs had a better potential for relatedness estimation, exclusion of non-parentage and individual identification than microsatellites, and > 98% accuracy of parentage assignment could be achieved by 100 polymorphic SNPs (MAF cut-off < 0.4) or 10 polymorphic microsatellites (mean Ho = 0.821, mean PIC = 0.651). This study provides a reference for the development of molecular markers for parentage analysis taking advantage of next-generation sequencing, and contributes to the molecular breeding, fishery management and population conservation.
1. Introduction
The development of molecular markers and sequencing technologies over the past decades has brought great innovations for aquaculture. Since mixed breeding system is often adopted in aquaculture breeding programs, accurate pedigree information is the basis of sustainable genetic selection and hatchery management [1]. Although tagging of individuals with physical tags is difficult in most fish species due to their mass spawning and tiny larvae [2,3], the introduce of molecular tools makes it feasible for fish pedigree traceability. Microsatellites, i.e., simple sequence repeats, have been classic molecular tools in parentage analysis and pedigree reconstruction in a considerably range of aquaculture fish species since its discovery in 1990s [4,5,6,7], due to their relatively small locus size, inheritance in a Mendelian fashion, codominance and high polymorphism based on the variable size of repeat units by alleles [6]. However, parentage analysis using microsatellites has suffered from genotyping errors that may cause multiple peaks, allelic dropout, null alleles or other issues, which is due in large part to the manual operation and subjective scoring process [8,9,10], and could lead to the mistakenly assignment of candidate parents. In addition, microsatellites are limited in the application in terms of genome wide trait associations or breeding value estimation, due to their relatively low density over the genome [3]. Furthermore, although Next-generation sequencing (NGS) has facilitated the mining process of molecular markers [11], genotyping of microsatellite loci can be still costly, laborious and time-consuming [12], especially when handling with a large number of individuals derived from mass spawning fish. Therefore, there is a growing tendency to seek more time- and effort-saving molecular tools among parentage related research for the few past years.
A recent rising molecular tool for parentage analysis is single nucleotide polymorphisms (SNPs), since the availability of genomic resources and multiplexed detecting methods have been greatly enhanced by NGS and bioinformatic techniques [13]. Over the last decade, SNPs have been used in parentage assignment [14], relatedness analysis [15], sibship assessment [3], population structure [16] or mating system research [17] in about 20 fish species [13]. Compared to microsatellites, SNPs are superior in their abundance over genomes [12], lower mutation rates [18], higher automation and easier standardization across laboratories [19], which effectively reduce the cost of time and genotyping errors caused by human factors. Nevertheless, the majority of SNPs are biallelic contrast to multi-allelic microsatellites, which undermines the potential of per SNP locus applying to parentage analysis because of relatively lower polymorphism and heterozygosity [20]. This problem usually can be alleviated by increasing the number of SNPs involved in analysis, and also, selecting the loci with higher minimum allele frequency (MAF) can enhance the power of markers for parentage exclusion [21]. However, the increase of loci also results in the increase of investment of time and money. Therefore, considering the trade-offs of cost and benefits when choosing the molecular tools, it is necessary to figure out the most efficient number of loci (i.e., the lowest loci number with the highest polymorphism) for conducting parentage assignment. In addition, another ongoing question is: how many SNPs are needed to match the power of one microsatellite [22]. Fernández et al. [23] suggested that 2–3 SNPs are needed to obtain an equivalent exclusion power to one microsatellite, yet Gill et al. [24] estimated that 4–5 SNPs with allele frequencies range from 0.2 to 0.8 give the same power of exclusion as for one microsatellite. Albeit the continuous attention to this issue, most of the research focused on SNP-PCR, SNP-chip or other approaches which conduct sequencing by NGS and genotyping SNPs via highly multiplexed laboratory assays [22,25,26,27,28,29], while few related reports have genotyped and filtered SNPs directly via bioinformatic pipeline based on NGS approaches such as genotyping-by-sequencing.
Genotyping-by-sequencing (GBS) is a low-coverage genotyping technique, which involves restriction enzymes to fragment genomic DNA followed by high-throughput sequencing, in order to generate high-quality polymorphism data at a relatively low per sample cost [30,31]. GBS was similar to restriction site-associated DNA sequencing (RAD-seq) but more cost-effective and less complicated [30], so that it is tailored for large-scale genotyping applications such as marker-assisted selection (MAS) and QTL mapping, if available reference genome information was provided [11]. Indeed, low-coverage GBS has been successfully used for genetic parameter estimation [32], genomic selection [33], QTL mapping [34] and genome-wide association studies (GWAS) [35] in aquaculture. It has been proposed that GBS data is one of the best options for cost-effective SNP discovery and parentage analysis [36]. Even so, the application of GBS for parentage analysis is still insufficient: only several related researches have been made for shellfish (blue mussel Mytilus galloprovincialis) [37], fish (Florida bass Micropterus floridanus [14], Australasian snapper Chrysophrys auratus [38], arctic charr Salvelinus alpinus [39]) and plant (Scots pine Pinus sylvestris [40], radiata pine Pinus radiata [41]). Despite the increase in reports of parentage analysis using GBS recently, it should still be improved for related studies to take more advantage of GBS-based techniques and bioinformatic pipelines.
Giant grouper (Epinephelus lanceolatus Bloch, 1790) is the largest bony fish living in coral reefs, with the largest individual recorded reaching up to 2.7 m in length and 455 kg in weight [42]. It is mainly found in tropical and subtropical waters from the Indo-Western Pacific Ocean, and because of its potential value for commerce and excellent characteristics for aquaculture, giant grouper has been a popular economic fish in the Asia Pacific region [43,44]. However, its natural populations have long been threatened by overharvest and habitat destruction, leading to a ‘vulnerable’ classification on the International Union for Conservation of Nature and Natural Resources (IUCN) Red List categories since the mid-1990s (https://www.iucnredlist.org/, accessed on 1 June 2021). Whether in conservation or aquaculture programs of this species, the application of appropriate molecular tools to trace pedigree information will help to monitor the genetic diversity of wild or cultured population and thus inform researchers of adjusting management plans. However, although 72 microsatellite markers have been developed for giant grouper so far [43,45,46,47], only a few of them have been applied in parentage related analysis [48,49]. For groupers, moreover, the development of SNP markers has only been reported for identification of growth traits in potato grouper (E. tukula) [50] and orange-spotted grouper (E. coioides) [51], while the application of SNPs for parentage analysis in groupers has not yet been reported.
In this study, we described the first GBS-based bioinformatic pipeline for discovery and screening of microsatellite and SNP loci applied to a mixed cultured family of giant grouper, in order to compare and evaluate the power of two molecular markers for testing questions about parentage and relatedness. The results testified the power of application of SNPs and microsatellites for parentage analysis in a mixed family with a certain degree of inbreeding in giant grouper. Our study contributes to providing a valuable reference for grouper conservation, fishery management and molecular breeding process.
2. Materials and Methods
2.1. Sample Preparation, GBS Library Construction and Sequencing
The giant grouper samples in this study were described in our previous work [35]. Briefly, the broodstock were derived from the South China Sea area adjacent to Hainan province, and were then transferred to the Oceans Farms Hatchery of Fisheries Research Institute of Fujian in 2014. Later in July 2017, 8 sexually mature individuals (4 females and 4 males) were collected to proceed spawning, i.e., producing F1. The newly born fish fry were cultured in 14 × 14 × 2 m3 (length × width × depth) concrete-walled ponds. After about 10 months of hatching, 289 individuals of F1 offspring were randomly sampled. Thumbnail-sized fin clips of both parents and offspring were collected and stored in 95% alcohol until they were placed at −80 °C, prior to DNA extraction. Genomic DNA was extracted from fin samples using TIANamp Marine Animals DNA Kit (Tiangen Biotech, Beijing, China) following the manufacturer’s protocol. The DNA extraction was qualified by 1% agarose gel electrophoresis and quantified by the NanoDrop 2000 spectrophotometers (Thermo Scientific, Waltham, MA, USA), so as to ensure the DNA concentration met the requirement of library construction (≥20 ng/μL).
The library construction and sequencing followed the original description of the authors [30,31]. In brief, 100 ng of each genome DNA extraction from all samplings (289 offspring, 8 parents) was digested with EcolI and HaeIII in 96-well plates. Barcode adaptors corresponding to each individual were designed and ligated onto the sticky ends. The DNA fragments with unique barcode adapter were pooled into libraries of 24 individuals each, purified with a PCR purification kit (NEB, Ipswich, MA, USA), and then amplified for 12 × cycles using Phusion DNA polymerase (NEB, Ipswich, MA, USA) to produce sequencing libraries. The PCR products were purified as above and quantified on a Bioanalyzer 2100 (Agilent, Santa Clara, CA, USA). The final pooled libraries were adjusted to 10 nmol, and paired-end sequencing was performed on a lane the Illumina HiSeq 2000 platform (Illumina, San Diego, CA, USA) with 150-bp reads.
2.2. Microsatellite Development and Genotyping
Raw sequencing data were filtered and low-quality reads were removed according to the following stringent criteria: i. reads with barcode adapter contamination; ii. reads containing ≥ 10% unidentified nucleotides (N); iii. reads with > 50% of bases with a Q value ≤ 10. After filtering, the clean data of one paternal fish was chosen for microsatellite loci identifying using MIcroSAtellite identification tool (MISA) [52], with misa.ini file configured as: definition (unit_size,min_repeats): 1–10 2–6 3–5 4–5 5–5 6–5; interruptions (max_difference_for_2_SSRs): 100. Modified Primer3 scripts (p3_in.pl and p3_out.pl) were applied to design batch primers, which were subsequently screened by laboratory procedures which referred to our previously published work [53] with minor modifications. In brief, 10μL volume of polymerase chain reactions (PCRs) with subject primers were carried out, and afterwards inspected by agarose gel electrophoresis and polyacrylamide gel electrophoresis (PAGE). After two rounds of screening, the selected 8 polymorphic loci alongside with 3 other loci reported in Yang’s work [46] were employed to genotyping, which was carried out in 20 μL volumes of PCR reactions (including 10 μL 2 × Taq PCR StarMix with loading dye (GeneStar, Beijing, China), 0.2 μM fluorescent-modified forward primer (FAM, HEX or ROX, synthesized by Tsingke, Guangzhou, China), 0.2 μM reverse primer, about 20 ng genome DNA and 4 μL deionized water). Thermal cycling was 94 °C for 2 min, 30 cycles of 94 °C for 30 s, 62 °C for 30 s and 72 °C for 60 s and a final extension at 72 °C for 5 min. The PCR products were analyzed on ABI3730XL genotyper with GeneScan LIZ 500 as size standard and alleles were detected by GeneMapper v3.2 software (Applied Biosystems, Thermo Scientific). All of the candidate parents and about half of the offspring were rerun to ensure the accuracy of scoring. CERVUS 3.0 [10] was used to estimate observed heterozygosity (Ho), expected heterozygosity (He), non-exclusion probability (NEP) for parentage as well as for identity across loci, and polymorphic information content (PIC). The Pearson’s correlation between locus polymorphism and non-exclusion probability has also been calculated.
2.3. SNP Calling and Genotyping
The filtered clean reads of each sample, as mentioned above, were aligned to our unpublished reference genome of orange-spotted grouper (E. coioides) using BOWTIE2 [54]. The output .sam files were transformed to binary .bam files using SAMtools [55] with view command, and then sorted with sort command. To call SNP, we indexed the reference sequences by SAMtools faidx command, used mileup and call command of bcftools [56] for SNP calling with consensus-caller algorithm (-c) and outputting the variants sites only (-v), and preliminarily filtered the sites with a QUAL < 20 of the raw .vcf file. We then used vcftools [57] to further filter SNPs with genotyped offspring following these stringent criteria partially referred to Zhao [14]: i. kept SNPs with coverage depth greater than 5 (—minDP 5); ii. eliminated insertion/deletion variants (—remove-indels); iii. only kept biallelic SNPs (—max-alleles 2); iv. eliminated SNPs with < 90% call rate of the population (—max-missing 0.9); v. eliminated SNPs with quality score < 98 (—minGQ 98).
Since the polymorphism of SNP loci, reflected by minimum allele frequency (MAF), can directly influence the efficiency of parentage assignment, we set a series of MAF cut-off values (0.1, 0.2, 0.3, 0.4, 0.425, 0.45 and 0.475) to figure out the lowest number with the highest polymorphism of loci for parentage assignment. SNPs deviated from Hardy-Weinberg equilibrium (HWE) with p-value < 0.05 (—hwe 0.05) were removed by Plink 1.9 [58]. Further, Linkage disequilibrium (LD) decay analysis using PopLDdecay [59] indicated that squared allele count correlation (r2) decreased sharply until around 10 kb, so for each SNP panel with differed MAF cut-off, we pruned one locus from each pair of loci within a 50 kb sliding window with r2 > 0.2, shifting windows by 1 bp steps, conducted by Plink 1.9. After that, we visualized the LD blocks of each locus set using Haploview 4.2 [60], which indicated that SNPs aligned to scaffolds instead of assembled chromosomes and were relatively highly linked, so we eliminated these loci in later analysis. The final obtained vcf files were converted to GENEPOP format using PGD SPIDER version 2.0.5.0 [61]. Likewise, observed heterozygosity (Ho), expected heterozygosity (He), combined non-exclusion probability across loci, and polymorphic information content (PIC) were estimated by CERVUS 3.0, and Pearson’s correlation was calculated.
2.4. Parentage Analysis
We conducted parentage assignment with microsatellite and SNP panels in CERVUS 3.0 and COLONY 2.0 [62]. Parentage analysis was also conducted by PAPA 2.0 [63], and since PAPA was unable to deal with the large number of SNPs, we only applied it for microsatellites. CERVUS is a classic parentage allocation analysis program based on pair-wise likelihood method, which considers the log-likelihood score of candidate parent (presented as LOD score) for specific offspring and assigns parent pair with the highest LOD score to offspring. COLONY, on the other hand, uses full-pedigree likelihood method which divides individuals into three subsamples including candidate males, candidate females and offspring, and assigns sibship and parentage simultaneously. PAPA is a parental pair allocation program based on breeding likelihood. Unlike CERVUS, it defines the likelihood of a parental pair of genotypes as the probability of it breeding the given offspring genotype among all of its possible descents, which may outperform CERVUS using data with sex-known potential parental pairs.
For microsatellites, in order to compare with SNPs and estimate optimal number alongside with polymorphism of loci, we ranked 11 microsatellite loci by PIC value, and conducted parentage assignment stepwise adding locus from the top (the most polymorphic) one to the bottom one accumulatively, which means 11 times of assignment in CERVUS. We simulated 10,000 offspring produced by 4 candidate fathers and 4 candidate mothers, with 100% parents sampled, 98% proportion of loci genotyped, 1% genotyping error rate and confidence levels assessed by LOD distribution (relaxed > 80%, strict > 95%). The minimum typed loci were set to ≥ 45% of the whole number of loci. Based on the simulation, the empirical data was tested. In PAPA, we ran loci cumulative sequence parentage allocation with a ±1 offset model (error distribution: 0.000 0.010 0.980 0.010 0.000), and correctness was assessed in simulator producing 10,000 offspring with 100 iterations. We also used COLONY to conduct parentage assignment for each microsatellite panel, assuming polygamy for both parents, using full-likelihood method with no sibship prior, updating allele frequency. The genotyping error rate and allele dropout rate was set to 0.01. Only the inferred parent pair with > 95% probability were accepted.
For SNPs, we imported each SNP panel filtered by different MAF cut-off values, as mentioned above, into CERVUS to conduct simulation and parentage assignment, with the same parameter as microsatellites except proportion of loci genotyped, which was set to the corresponding value to the specific panel. We also used COLONY to conduct parentage assignment for each SNP panel, with the same parameter described above as microsatellites.
Since true pedigree information was unknown prior to analysis, we defined the ‘standard pedigree’ as the exactly consistent pedigree assigned by 208 SNPs (derived from 0.1 MAF cut-off value) and 11 microsatellites in CERVUS (confidence > 95%) and COLONY. Individuals obtained different parentage assignment using the two types of molecular markers were excluded for the downstream analysis, because we could not ensure their true parents. We then compared each allocation result obtained from different marker panels with ‘standard pedigree’ to assess the accuracy of parentage assignment, so as to determine the most efficient loci number of SNP and microsatellite panel.
2.5. Relatedness Analysis
In order to compare the performance of the two types of molecular markers in distinguishing different relatedness (unrelated, half-sibling, full-sibling and parent–offspring), we also estimated pairwise relatedness between each pair of individuals using RELATED [64]. RELATED is an R package that can simulate and calculate relatedness based on seven estimators (including four non-likelihood-based and three likelihood-based ones). The expected relatedness values (r) are 0.5 between full-sib pairs or parent–offspring pairs, 0.25 between half-sib pairs and 0 between unrelated individuals [65]. We firstly used compareestimators function in this program to generate 100 pairs of individuals for estimating different relatedness, and determined that the wang [66] estimator was optimal for microsatellites and SNPs taken together. RELATED is able to generate simulated genotypes based on given population allele frequency, so for each set of SNPs and microsatellites, we generated 100 pairs of individuals for each level of relatedness using familysim function, and then estimated their pairwise relatedness values using coancestry function with the wang estimator. According to the result, we drew density plots of relatedness values for simulated pairs, so as to assess the overlap in relatedness values of individuals of different relatedness, which reflects the power of marker panels in distinguishing different pairwise relatedness. We also calculated the relatedness values between the 8 candidate parents to test their kinship.
3. Results
3.1. SNP Marker Development
After GBS sequencing, we obtained a total of approximately 13.5 million reads for 297 samples, generating about 64.4 GB of clean data. The overall alignment rate to the reference genome was 96.6%. After preliminary filtering and SNP calling with vcftools, 6,508,412 variants were kept for downstream analysis. Subsequently, we filtered SNPs following the stringent criteria described above, acquiring seven low-density SNP panels (ranged from 1013 to 5047 loci) with different MAF cut-off values. After removing the loci deviated from HWE (p < 0.05) and the loci in LD (r2 > 0.2), we finally retained 208, 137, 123, 100, 91, 78 and 44 loci for SNP panels with MAF cut-off values 0.1, 0.2, 0.3, 0.4, 0.425, 0.45 and 0.475, separately (Table 1).

Table 1.
Genetic characterization and combined non-exclusion probability for parent of microsatellites and SNPs.
3.2. Genetic Characterization and Identification Power of Microsatellite and SNP
For 289 offspring, a total of 72 alleles were detected across 11 microsatellites, with an average of 6.545 alleles per locus, ranged from 5 to 10. For SNP panels, mean Ho (ranged from 0.401 to 0.501) as well as mean He (ranged from 0.395 to 0.501) was lower than that of microsatellites (Ho ranged from 0.794 to 0.914 and He ranged from 0.672 to 0.807, separately) (Table 1). Meanwhile, mean PIC value (ranged from 0.309 to 0.375) across SNPs was also lower than microsatellites (ranged from 0.623 to 0.778) (Table 1).
Identification power of both two types of molecular markers were estimated by calculating the combined non-exclusion probability for parent and individual identification, respectively. Combined non-exclusion probability for parent refers to the average probability that the given set of loci fail to exclude one or a pair of unrelated candidate parents from parentage of an arbitrary offspring. Here, the combined non-exclusion probability for one candidate parent when both parents were unknown (NE-1P) of SNPs (ranged from 2.83 × 10⁻³ to 6.53 × 10⁻⁹) was much lower than that of microsatellites (ranged from 0.0289 to 0.559) (Table 1). Combined non-exclusion probability for individual identification refers to the average probability that the given set of loci fail to differentiate between two randomly selected unrelated individuals or full-siblings. Likewise, the combined non-exclusion probability for individual identification of SNPs show much better identification power than microsatellites, even 44 SNPs (MAF > 0.475) can achieve several orders of magnitude higher power for individual identification (1.85 × 10⁻¹⁹ and 1.11 × 10⁻¹⁰, for unrelated and full-sibling pairs respectively) than the best value of microsatellite panels (11 loci; 8.03 × 10⁻¹⁰ and 1.57 × 10⁻⁴, for unrelated and full-sibling pairs, respectively) (Figure 1).
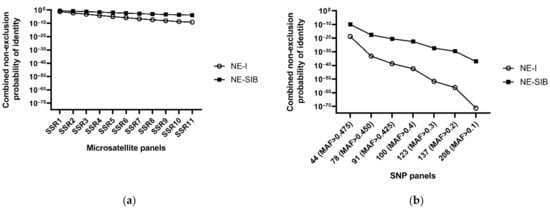
Figure 1.
Combined non-exclusion probability for identity based on microsatellites (a) or SNPs (b). NE-I refers to the combined non-exclusion probability for identity of unrelated individual pairs, NE-SIB refers to the combined non-exclusion probability for identity of full-sibling pairs.
Significant negative correlation between non-exclusion probability and locus polymorphism was testified in both microsatellite and SNP markers, especially in SNPs (p < 0.01) (Supplementary Table S1). The polymorphic information content (PIC) and expected heterozygosity (He) of loci was significantly negatively correlated with non-exclusion probability for parentage as well as for identity in both microsatellites and SNPs (p < 0.01), while the observed heterozygosity (Ho) was only significantly negatively correlated with non-exclusion probability in SNPs (p < 0.01) (Supplementary Table S1).
3.3. Parentage Analysis
Due to the inconsistency or low confidence of parentage allocation of SNPs and microsatellites as well as low genotyping rate (<50%), a total of 11 individuals were eliminated (3.81%), and the remaining 278 offspring which were assigned to the same parent pairs using both 208 SNPs and 11 microsatellites (confidence > 95%), were thus retained for the downstream analysis (Supplementary Table S2). According to our result, a severe skew contribution of spawners was found, and the 278 offspring were assigned to one female half-sib family, including 173 individuals produced by dam GF01 and sire GM01, and 105 individuals produced by dam GF01 and sire GM04 respectively (Supplementary Table S2).
Overall, the accuracy of parentage assignment using both microsatellites and SNPs increases as the number of loci used increases, and ultimately reaches saturation at a certain point. For microsatellites, we analyzed differently sized panels using CERVUS, COLONY and PAPA. The accuracy of parentage assignment obtained from CERVUS was slightly better that from PAPA at the same number of loci, and both of the accuracy curves went similarly, which increases rapidly to 85.25% (83.81% in PAPA) when the second polymorphic locus gets involved, grows to 94.96% (93.17% in PAPA) at five loci, and then reaches 98.20% (96.04% in PAPA) at 10 loci (Figure 2). On the other hand, the accuracy of parentage assignment obtained from COLONY keeps lower than that from CERVUS and PAPA obviously until the eighth microsatellite loci is added in, after which it reaches a maximum of 100% (Figure 2). For SNPs, we analyzed differently sized panels using CERVUS and COLONY. The accuracy of parentage assignment obtained from CERVUS increases from 86.33% to 98.56% when MAF cut-off value was set to 0.450 (78 SNPs), while in COLONY the critical point shows at 0.4 MAF cut-off value (100 SNPs), where the accuracy increased rapidly from 62.23% to 100% (Figure 2). In general, CERVUS and PAPA performs better than COLONY when using a small number of loci, while COLONY can achieve higher accuracy when the number of loci reaches a certain amount. Further, according to our result, the accuracy of parentage assignment using around 100 polymorphic SNPs is equivalent to that of using around 10 polymorphic microsatellites.
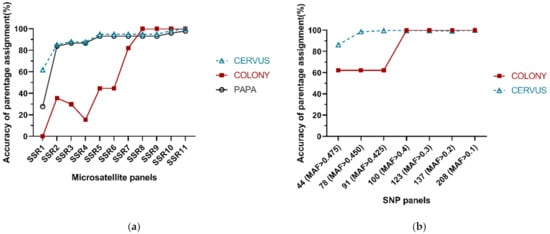
Figure 2.
Accuracy of parentage assignment using differently sized microsatellite (a) and SNP (b) panels in different analysis programs. The accuracy was defined as the consistency derived from different marker panels compared with ‘standard pedigree’.
3.4. Relatedness Analysis
The simulated estimation of relatedness value was closer to expected value when using SNP panels than that of microsatellites (Figure 3). Density plots representing histograms of the relatedness values provide informative reference for the reliability and accuracy of estimated relatedness values using specific marker panels. The overlap shows the intersection between estimated relatedness value for pairs of individuals of different relationships. Based on simulation and estimates of relatedness value, our results show that the power of differentiating relative relationships of SNP marker panels was better than that of microsatellite marker panels, even between the least number of SNPs (44) and the greatest number of microsatellites (11) (Figure 3). Regardless of the type of molecular markers, using a greater number of markers results in a less overlap between different estimated relatedness value of different relationships (Figure 3, Supplementary Figures S1 and S2).
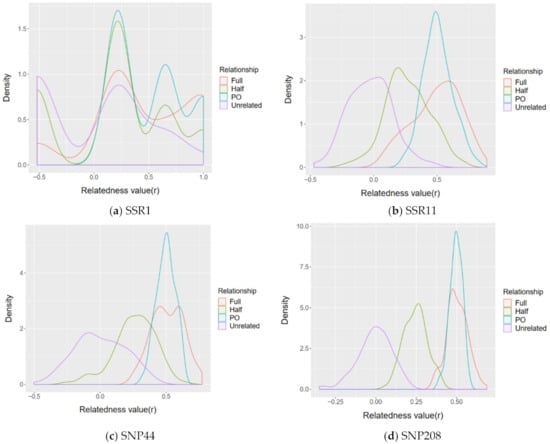
Figure 3.
Density plots of relatedness values for simulated pairs of known relatedness (unrelated, half-sibling, full-sibling and parent–offspring) based on given population allele frequency of different marker panels: (a) the microsatellite panel SSR1 composed of 1 microsatellite locus; (b) the microsatellite panel SSR11 composed of 11 microsatellite loci; (c) the SNP panel SNP44 composed of 44 SNP loci (MAF cut-off > 0.475); (d) the SNP panel SNP208 composed of 208 SNP loci (MAF cut-off > 0.1).
The relatedness values of the eight candidate parents were calculated using 11 microsatellites and 208 SNPs by wang estimator. Although most of the candidate parents seem to be unrelated (92.86% for microsatellites and 82.14% for SNPs, respectively), a certain proportion of potential kinship was found (7.14% for microsatellites and 17.86% for SNPs, respectively) (Figure 4).
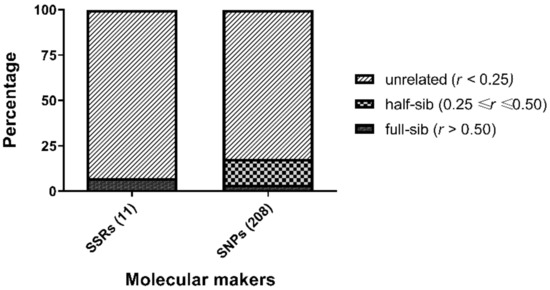
Figure 4.
The distribution of relatedness value (r) of candidate parents calculated by wang estimator based on 208 SNPs or 11 microsatellites.
4. Discussion
Until recent years, obtaining genetic markers was costly and laborious, and as a result, large numbers of markers were unavailable except for a few well-studied species [67]. With the rapid development of next-generation sequencing, it is easier for researchers to access to abundant genetic markers in a more cost-effective way. In terms of the advantage of GBS, Sequencing and genotyping for SNPs simultaneously offers an optional solution for relatively traditional SNP genotyping methods, which often require a mass of preparatory work at the discovery stage before genotyping of large numbers of individuals [68]. Furthermore, the relatively low coverage of GBS data enables a less computational resource-demanding pipeline for alignment with BOWTIE 2 and filtering with SAMtools and vcftools [40], and the computational time could be further reduced when conducting parentage assignment with low-density SNP panels. Although there has been a concern of the next-generation SNP genotyping methods such as missing genotype data, genotyping error and allelic dropout, several coping strategies of stringent filtering of SNPs were proposed, and a relatively stable performance of SNP panels on conducting parentage analysis were testified [12,13,14,40]. Although Andrews et al. [12] suggested that GBS was not suitable for long contig-assembly approach for designing SNP assays, Zhao et al. has illustrated an operation pipeline for low-density SNP assays designment from de novo assembly to genotyping assays utilizing Agena MassARRAY technology [14]. The bioinformatic approach we described here has testified that GBS sequencing is a cost-effective alternative for the development of microsatellites and SNPs for parentage analysis, with a low sequencing cost of lower than $40 per individual.
We assessed the polymorphism of loci to compare the potential for parentage analysis between microsatellites and SNPs. The 11 microsatellites used here represented a relatively high polymorphism and low non-exclusion probability (0.623 for mean PIC and 0.0289 for NE-1P), consistent with that of the 15 microsatellites developed by Kim et al. for giant grouper (0.511 for mean PIC and 0.02464 for NE-1P) [47]. In this study, SNPs showed a lower polymorphism yet much higher exclusion ability for both non-parentage and individual identity, suggesting a better resolution for parentage analysis compared with microsatellites. This is understandable, since SNPs are biallelic and thus lead to a lower polymorphism per locus than multi-allelic microsatellites, while the much larger number of available loci helps to accumulate their discerning ability for individuals. The significant negative correlation between non-exclusion probability and locus polymorphism in both molecular markers proved again that higher polymorphism of loci could enhance the power of markers for parentage analysis. Nevertheless, the number of loci may have a more significant effect on the power of parentage analysis than expected. Premachandra et al. [3], similarly, found the number of SNPs had a clear and major impact on the accuracy of sibship assignment, as the increase of number of SNPs led to a bigger raise in accuracy measures than that of the average MAF values. Baruch and Weller [69] conducted a series of simulations and found that non-exclusion probability decreased with increasing number of SNPs at the same level of MAF cut-off. Therefore, the advantages of SNPs in the number of available loci may have a considerable impact on their better performance of parentage analysis than microsatellites.
For captive breeding programs, it is important to maintain the genetic diversity of broodstock, and reliable relatedness parameter is needed to prevent an overrepresentation of inbreeding [15]. Moreover, appropriate demographic data for conducting classic parentage analysis is not always available for some studies, especially wild populations [68]. Thus, besides parentage analysis, the kinship of population could be illustrated by pairwise relatedness estimation. We estimated the relatedness values based on the population allele frequencies simulated from each set of SNPs and microsatellites, and found an obvious clearer resolution of distributions for individuals with different known relatedness was obtained when using SNPs or increasing the number of loci. This suggests that SNPs have the better distinguishing power of relatedness estimating than microsatellites as well. Furthermore, the assessment of genetic diversity and kinship for candidate breeders is also an important support for pre-breeding programs [70]. We also tested the relatedness values among eight candidate parent fish using 11 microsatellites and 208 SNPs, and found a certain degree of potential relatedness in at least 7.14% of parents. This result implied a potential risk of inbreeding and loss of diversity of broodstock, and also, the number of loci required for distinguishing two closer relatives would have been potentially increased [71].
To maximize the efficiency of parentage analysis, it is necessary to consider the trade-offs between number of putative primers, cost of development and panel efficacy [72]. Generally, researchers tend to resolve parentage issues by a smaller number of loci yet with higher polymorphism. We found here, for microsatellites, that a 10-loci panel (mean Ho = 0.821) could offer an accuracy of about 98% for parentage analysis, and meanwhile for SNPs, a panel of 100 loci (mean Ho = 0.500, MAF cut-off value of 0.40) was able to offer about an accuracy of 99%. This result is similar to previous reports: Kaiser et al. [36] found that 97 SNPs (mean Ho = 0.19) was as powerful as six multiallelic microsatellites (mean Ho = 0.86) for paternity assignment in black-throated blue warbler; Steele et al. [73] empirically confirmed that a panel of 95 SNPs (mean MAF = 0.34) was comparable in accuracy to a panel of 17 microsatellites (mean Ho = 0.74); Glaubitz et al. [20] suggested that a panel of 100 moderately polymorphic SNPs (each with a MAF of 0.20) would provide equivalent power to 16–20 independent microsatellites (each with an He of 0.75) for relationship discrimination or parentage analysis. It has also been concluded that a relatively small number of SNPs (60 to 200) can have an equivalent or better performance in parentage analysis than available microsatellites [13]. Indeed, low-density SNP panels with relatively high polymorphism are testified to be able to conduct accurate parentage analysis. Dussault and Boulding explored how different values of MAF influence the number of SNPs required for accurate parentage assignment, demonstrating that larger panels with low average MAF are needed to achieve the same accuracy as smaller panels with high average MAF [21].
According to the result of pedigree reconstruction, interestingly, we found a severe skew contribution of spawners. Among the eight communally rearing candidate parents, it seems that only two males and one female engaged in breeding, producing a large family consisting of 173 half-siblings and 105 full-siblings, respectively. The higher producing male GM01 contributed to 62.23% of the offspring, and female GF01 contributed to all of the offspring. We also found the similar skew phenomenon in previous parentage research on orange-spotted grouper (E. coioides) [53]. This result is unexpected, since Bright et al. [49] have described that, although a skew parental contribution exists in communally spawning giant grouper, all males and females successfully participated in production over the spawning period. The most possible explanation is that our sampling frequency of offspring was incomplete relative to the whole spawning periods, which could lead to a loss of genetic diversity and low parental contribution [49]. Moreover, since our samples come from grown-up fish instead of eggs or larvae directly, the different survival rates of progeny—which are influenced by the management practices, cannibalism and family genotype—could also result in a bias parental contribution [38,74]. More complete sampling and longer-term tracking is needed to clarify this issue.
A total of 11 individuals, which accounted for 3.81% of the total sampled offspring, were eliminated from the parentage analysis because of the inconsistency or low confidence of parentage allocation using SNPs and microsatellites. Among them, two individuals were not tested because of a low genotyping rate of 208 SNPs (< 50%), and two individuals were eliminated due to a low confidence albeit the consistent allocation between microsatellites and SNP panels. The remaining seven individuals were eliminated for inconsistence between the assignment of two molecular marker panels, while five of them showed fairly different genotype from all of the candidate parents in most loci. Besides this, we also compared the results of parentage analysis with our previous GWAS research using the same family [35]—which conducted family clustering based on identical by descent (IBD) using Plink—so as to further confirm the accuracy of parentage allocation, and found it completely consistent except for the five individuals described above. One likely explanation was that there might be individuals accidently introduced from other families during the fish culturing period. In order to figure out what happened during this process, a detailed hatchery record of spawners would be informative to provide a reference [73]. For the remaining two individuals with inconsistent allocation in two molecular marker panels, we found a divergent allocation between female GF01 and GF02 for one individual, as well as male GM03 and GM04 for another one; although considering all of the assignments including IBD clustering, the most consistent result tended to assign these two individuals to GF01 and GM04, respectively. This might be explained by the potential relatedness which were detected among candidate parents, who would share more similar genotypes and were more difficult to be distinguished, thus reducing the confidence of parentage allocation [75].
In this study, we found that the accuracy of parentage assignment using CERVUS was similar to that of PAPA, while differs from that of COLONY. Generally, CERVUS and PAPA performed better with a relatively small marker set, while COLONY offered a higher accuracy when the number of loci went to a certain amount. This result was surprising, since COLONY usually has a better performance than CERVUS in previous reports, despite a longer running time [76,77]. COLONY incorporates the sibship among putative offspring besides parent–offspring relatedness, and the likelihood of the inferred pedigree is derived from the cluster likelihoods instead of the pedigree likelihoods used in CERVUS, so that it makes more use of the pedigree information and is thus expected to perform better [78,79]. The partially decreased accuracy of parentage assignment in COLONY here might be associated with the skew group size of the largest sampled siblings, which consisted almost exclusively of two large full-sib families. As Almudevar and LaCombe deduced in their simulations, if the largest sibling group size was extremely big or the number of loci used was fairly small, the likelihood criterion might split large true clusters into smaller ones, so the clustering structure of the likelihood used in COLONY could not entirely solve the scaling problem [79]. The similar condition was described in Premachandra et al. [3], where they found the SNP pedigrees tended to split part of the full-sib families determined by microsatellites into smaller groups or produced single individuals unrelated to any other members. Moreover, the default low genotyping error rate of 0.01% to 1% seemed too low even for a relatively low-density SNP panel [80], allowing only for ≤ 2 genotyping errors for a whole panel of 208 SNPs, which might cause interference to a certain extent and lead to the erroneous assignment of parents. Hall et al. [40] detected a genotyping error rate of 5% in GBS data, which suggested a finer selection of SNP loci would be needed to alleviate the consequence brought by such kind of error.
Another possible factor that might reduce the genotyping rates could come from the bioinformatic pipeline, although we have filtered SNPs following a stringent criterion including eliminating loci deviated from Hardy–Weinberg equilibrium or with high linkage (r2 > 0.2) [14]. Since the reference genome we used for alignment was from orange-spotted grouper (E. coioides), and considering the DNA sequence divergence between orange-spotted grouper and giant grouper, it might be more ideal to refer to a genome of giant grouper for this study.
5. Conclusions
Here, we described a GBS-based bioinformatic pipeline for the development of microsatellite as well as low-density SNP marker panels for giant grouper for the first time, and testified their performance on parentage and relatedness analysis. The power of SNPs for exclusion and relatedness estimation was better than that of microsatellites, and > 98% accuracy of parentage assignment could be achieved by around 100 polymorphic SNPs or 10 polymorphic microsatellites. Taking advantage of the next-generation sequencing like GBS, pedigree reconstruction could be conducted with a considerably low cost of money and time.
Supplementary Materials
The following are available online at https://www.mdpi.com/article/10.3390/genes12071042/s1, Figure S1: Density plots of relatedness values for simulated pairs of known relatedness based on microsatellite panels (from SSR2 to SSR10), Figure S2: Density plots of relatedness values for simulated pairs of known relatedness based on SNP panels (from SNP78 to SNP137), Table S1: The Pearson’s correlation between non-exclusion probability and polymorphism of microsatellite and SNP marker, Table S2: The results of parentage assignment based on 11 microsatellites and 208 SNPs in CERVUS and COLONY.
Author Contributions
Conceptualization, Z.M.; methodology, Z.M., X.W. and Z.W.; software, Y.Y., Z.W. and X.W.; formal analysis, X.W., L.W., Z.W. and S.H.; investigation, L.W., Z.W., H.Z. and X.W.; data curation, L.W., Z.W. and Y.Y.; writing—original draft preparation, Z.W.; writing—review and editing, Z.W. and Z.M.; visualization, Z.W.; supervision, Z.M.; project administration, Z.M.; funding acquisition, Z.M. All authors have read and agreed to the published version of the manuscript.
Funding
This research was funded by the National Natural Science Foundation of China (31872572), China Agriculture Research System of MOF and MARA (CARS-47), Huizhou Swan Project (20170214023102296) and the Special Fund for Agro-scientific Research in the Public Interest (201403008).
Institutional Review Board Statement
This study was approved by Laboratory Animal Management Committee in School of Life Sciences, Sun Yat-Sen University (project identification code 31872572, date of approval: 11 June 2021).
Informed Consent Statement
Not applicable.
Data Availability Statement
The data presented in this study are openly available in the DDBJ sequence read archive (DRA), DRA Accession no. DRA012199.
Conflicts of Interest
The authors declare no conflict of interest.
References
- Gjedrem, T.; Baranski, M. Selective Breeding in Aquaculture: An Introduction, 1st ed.; Springer: Dordrecht, The Netherlands, 2009; pp. 3, 105. [Google Scholar]
- Yue, G.H.; Xia, J.H. Practical considerations of molecular parentage analysis in fish. J. World Aquac. Soc. 2014, 45, 89–103. [Google Scholar] [CrossRef]
- Premachandra, H.K.A.; Nguyen, N.H.; Knibb, W. Effectiveness of SNPs for parentage and sibship assessment in polygamous yellowtail kingfish Seriola lalandi. Aquaculture 2019, 499, 24–31. [Google Scholar] [CrossRef]
- Tautz, D. Hypervariability of simple sequences as a general source for polymorphic DNA markers. Nucleic Acids Res. 1989, 17, 6463–6471. [Google Scholar] [CrossRef] [PubMed]
- Estoup, A.; Gharbi, K.; SanCristobal, M.; Chevalet, C.; Haffray, P.; Guyomard, R. Parentage assignment using microsatellites in turbot (Scophthalmus maximus) and rainbow trout (Oncorhynchus mykiss) hatchery populations. Can. J. Fish. Aquat. Sci. 1998, 55, 715–723. [Google Scholar] [CrossRef]
- Liu, Z.J.; Cordes, J.F. DNA marker technologies and their applications in aquaculture genetics. Aquaculture 2004, 238, 1–37. [Google Scholar] [CrossRef]
- Jones, A.G.; Small, C.M.; Paczolt, K.A.; Ratterman, N.L. A practical guide to methods of parentage analysis. Mol. Ecol. Resour. 2010, 10, 6–30. [Google Scholar] [CrossRef] [PubMed]
- Bonin, A.; Bellemain, E.; Bronken Eidesen, P.; Pompanon, F.; Brochmann, C.; Taberlet, P. How to track and assess genotyping errors in population genetics studies. Mol. Ecol. 2004, 13, 3261–3273. [Google Scholar] [CrossRef]
- Hoffman, J.I.; Amos, W. Microsatellite genotyping errors: Detection approaches, common sources and consequences for paternal exclusion. Mol. Ecol. 2005, 14, 599–612. [Google Scholar] [CrossRef]
- Kalinowski, S.T.; Taper, M.L.; Marshall, T.C. Revising how the computer program CERVUS accommodates genotyping error increases success in paternity assignment. Mol. Ecol. 2007, 16, 1099–1106. [Google Scholar] [CrossRef]
- Davey, J.W.; Hohenlohe, P.A.; Etter, P.D.; Boone, J.Q.; Catchen, J.M.; Blaxter, M.L. Genome-wide genetic marker discovery and genotyping using next-generation sequencing. Nat. Rev. Genet. 2011, 12, 499–510. [Google Scholar] [CrossRef]
- Andrews, K.R.; Adams, J.R.; Cassirer, E.F.; Plowright, R.K.; Gardner, C.; Dwire, M.; Hohenlohe, P.A.; Waits, L.P. A bioinformatic pipeline for identifying informative SNP panels for parentage assignment from RADseq data. Mol. Ecol. Resour. 2018, 18, 1263–1281. [Google Scholar] [CrossRef] [PubMed]
- Flanagan, S.P.; Jones, A.G. The future of parentage analysis: From microsatellites to SNPs and beyond. Mol. Ecol. 2019, 28, 544–567. [Google Scholar] [CrossRef] [PubMed]
- Zhao, H.; Li, C.; Hargrove, J.S.; Bowen, B.R.; Thongda, W.; Zhang, D.; Mohammed, H.; Beck, B.H.; Austin, J.D.; Peatman, E. SNP marker panels for parentage assignment and traceability in the Florida bass (Micropterus floridanus). Aquaculture 2018, 485, 30–38. [Google Scholar] [CrossRef]
- Roques, S.; Chancerel, E.; Boury, C.; Pierre, M.; Acolas, M.L. From microsatellites to single nucleotide polymorphisms for the genetic monitoring of a critically endangered sturgeon. Ecol. Evol. 2019, 9, 7017–7029. [Google Scholar] [CrossRef]
- Hamilton, M.G.; Mekkawy, W.; Kilian, A.; Benzie, J.A.H. Single nucleotide polymorphisms (SNPs) reveal sibship among founders of a Bangladeshi rohu (Labeo rohita) breeding population. Front. Genet. 2019, 10, 597. [Google Scholar] [CrossRef]
- Marie, A.D.; Herbinger, C.; Fullsack, P.; Rico, C. First reconstruction of kinship in a scalloped hammerhead shark aggregation reveals the mating patterns and breeding sex ratio. Front. Mar. Sci. 2019, 6. [Google Scholar] [CrossRef]
- Brumfield, R.T.; Beerli, P.; Nickerson, D.A.; Edwards, S.V. The utility of single nucleotide polymorphisms in inferences of population history. Trends Ecol. Evol. 2003, 18, 249–256. [Google Scholar] [CrossRef]
- Anderson, E.C.; Garza, J.C. The power of single-nucleotide polymorphisms for large-scale parentage inference. Genetics 2006, 172, 2567–2582. [Google Scholar] [CrossRef] [PubMed]
- Glaubitz, J.C.; Rhodes, O.E.; Dewoody, J.A. Prospects for inferring pairwise relationships with single nucleotide polymorphisms. Mol. Ecol. 2003, 12, 1039–1047. [Google Scholar] [CrossRef]
- Dussault, F.M.; Boulding, E.G. Effect of minor allele frequency on the number of single nucleotide polymorphisms needed for accurate parentage assignment: A methodology illustrated using Atlantic salmon. Aquac. Res. 2018, 49, 1368–1372. [Google Scholar] [CrossRef]
- García-Fernández, C.; Sánchez, J.A.; Blanco, G. SNP-haplotypes: An accurate approach for parentage and relatedness inference in gilthead sea bream (Sparus aurata). Aquaculture 2018, 495, 582–591. [Google Scholar] [CrossRef]
- Fernandez, M.E.; Goszczynski, D.E.; Liron, J.P.; Villegas-Castagnasso, E.E.; Carino, M.H.; Ripoli, M.V.; Rogberg-Munoz, A.; Posik, D.M.; Peral-Garcia, P.; Giovambattista, G. Comparison of the effectiveness of microsatellites and SNP panels for genetic identification, traceability and assessment of parentage in an inbred Angus herd. Genet. Mol. Biol. 2013, 36, 185–191. [Google Scholar] [CrossRef]
- Gill, P. An assessment of the utility of single nucleotide polymorphisms (SNPs) for forensic purposes. Int. J. Leg. Med. 2001, 114, 204–210. [Google Scholar] [CrossRef] [PubMed]
- Cramer, E.R.A.; Hall, M.L.; de Kort, S.R.; Lovette, I.J.; Vehrencamp, S.L. Infrequent extra-pair paternity in the banded wren, a synchronously breeding tropical passerine. Condor 2011, 113, 637–645. [Google Scholar] [CrossRef]
- Clarke, S.M.; Henry, H.M.; Dodds, K.G.; Jowett, T.W.; Manley, T.R.; Anderson, R.M.; McEwan, J.C. A high throughput single nucleotide polymorphism multiplex assay for parentage assignment in New Zealand sheep. PLoS ONE 2014, 9, e93392. [Google Scholar] [CrossRef]
- Gudex, B.; Walker, M.; Fisher, P.; Spelman, R. Validation of a single-nucleotide polymorphism panel for parentage testing of farmed red deer. Anim. Genet. 2014, 45, 142–143. [Google Scholar] [CrossRef]
- Yu, G.C.; Tang, Q.Z.; Long, K.R.; Che, T.D.; Li, M.Z.; Shuai, S.R. Effectiveness of microsatellite and single nucleotide polymorphism markers for parentage analysis in European domestic pigs. Genet. Mol. Res. 2015, 14, 1362–1370. [Google Scholar] [CrossRef] [PubMed]
- Buchanan, J.W.; Woronuk, G.N.; Marquess, F.L.; Lang, K.; James, S.T.; Deobald, H.; Welly, B.T.; Van Eenennaam, A.L.; Plaizier, J. Analysis of validated and population-specific single nucleotide polymorphism parentage panels in pedigreed and commercial beef cattle populations. Can. J. Anim. Sci. 2016, 231–240. [Google Scholar] [CrossRef]
- Elshire, R.J.; Glaubitz, J.C.; Sun, Q.; Poland, J.A.; Kawamoto, K.; Buckler, E.S.; Mitchell, S.E. A robust, simple genotyping-by-sequencing (GBS) approach for high diversity species. PLoS ONE 2011, 6, e19379. [Google Scholar] [CrossRef]
- Poland, J.A.; Brown, P.J.; Sorrells, M.E.; Jannink, J.L. Development of high-density genetic maps for barley and wheat using a novel two-enzyme genotyping-by-sequencing approach. PLoS ONE 2012, 7, e32253. [Google Scholar] [CrossRef]
- Qiu, C.; Dong, L.; Xiao, S.; Xu, S.; Fang, M.; Wang, Z. Genetic parameter estimation of nine quantitative traits by a marker-based method in Large Yellow Croaker, Larimichthys crocea (Richardson). Aquac. Res. 2017, 48, 5892–5900. [Google Scholar] [CrossRef]
- Faville, M.J.; Ganesh, S.; Cao, M.; Jahufer, M.Z.Z.; Bilton, T.P.; Easton, H.S.; Ryan, D.L.; Trethewey, J.A.K.; Rolston, M.P.; Griffiths, A.G.; et al. Predictive ability of genomic selection models in a multi-population perennial ryegrass training set using genotyping-by-sequencing. Appl. Genet. 2018, 131, 703–720. [Google Scholar] [CrossRef]
- Everett, M.V.; Seeb, J.E. Detection and mapping of QTL for temperature tolerance and body size in Chinook salmon (Oncorhynchus tshawytscha) using genotyping by sequencing. Evol. Appl. 2014, 7, 480–492. [Google Scholar] [CrossRef]
- Wu, L.; Yang, Y.; Li, B.; Huang, W.; Wang, X.; Liu, X.; Meng, Z.; Xia, J. First genome-wide association analysis for growth traits in the largest coral reef-dwelling bony fishes, the Giant grouper (Epinephelus lanceolatus). Mar. Biotechnol. 2019, 21, 707–717. [Google Scholar] [CrossRef]
- Kaiser, S.A.; Taylor, S.A.; Chen, N.; Sillett, T.S.; Bondra, E.R.; Webster, M.S. A comparative assessment of SNP and microsatellite markers for assigning parentage in a socially monogamous bird. Mol. Ecol. Resour. 2017, 17, 183–193. [Google Scholar] [CrossRef] [PubMed]
- Nguyen, T.T.T.; Hayes, B.J.; Ingram, B.A. Genetic parameters and response to selection in blue mussel (Mytilus galloprovincialis) using a SNP-based pedigree. Aquaculture 2014, 420–421, 295–301. [Google Scholar] [CrossRef]
- Ashton, D.T.; Hilario, E.; Jaksons, P.; Ritchie, P.A.; Wellenreuther, M. Genetic diversity and heritability of economically important traits in captive Australasian snapper (Chrysophrys auratus). Aquaculture 2019, 505, 190–198. [Google Scholar] [CrossRef]
- Palaiokostas, C.; Clarke, S.M.; Jeuthe, H.; Brauning, R.; Bilton, T.P.; Dodds, K.G.; McEwan, J.C.; De Koning, D.J. Application of low coverage genotyping by sequencing in selectively bred Arctic charr (Salvelinus alpinus). G3 2020, 10, 2069–2078. [Google Scholar] [CrossRef] [PubMed]
- Hall, D.; Zhao, W.; Wennstrom, U.; Andersson Gull, B.; Wang, X.R. Parentage and relatedness reconstruction in Pinus sylvestris using genotyping-by-sequencing. Heredity 2020, 124, 633–646. [Google Scholar] [CrossRef]
- Li, Y.; Klapste, J.; Telfer, E.; Wilcox, P.; Graham, N.; Macdonald, L.; Dungey, H.S. Genomic selection for non-key traits in radiata pine when the documented pedigree is corrected using DNA marker information. BMC Genom. 2019, 20, 1026. [Google Scholar] [CrossRef] [PubMed]
- Lovatelli, A.; Holthus, P. Capture-based aquaculture. Global overview. In FAO Fisheries Technical Paper No. 508, Proceedings of the FAO International Workshop on Technical Guidelines for the Responsible Use of Wild Fish and Fishery Resources for Capture-Based Aquaculture Production, Hanoi, Vietnam, 8–12 October 2007; FAO: Rome, Italy, 2008. [Google Scholar]
- Zeng, H.S.; Ding, S.X.; Wang, J.; Su, Y.Q. Characterization of eight polymorphic microsatellite loci for the giant grouper (Epinephelus lanceolatus Bloch). Mol. Ecol. Resour. 2008, 8, 805–807. [Google Scholar] [CrossRef]
- Rimmer, M.A.; Glamuzina, B. A review of grouper (Family Serranidae: Subfamily Epinephelinae) aquaculture from a sustainability science perspective. Rev. Aquac. 2019, 11, 58–87. [Google Scholar] [CrossRef]
- Rodrigues, K.F.; Shigeharu, S.; Ch’ng, C.L. Microsatellite markers for the identification of commercially important groupers Epinephelus lanceolatus, Cromileptes altivelis and Epinephelus fuscoguttatus. Pertanika J. Trop. Agric. Sci. 2011, 34, 311–315. [Google Scholar]
- Yang, S.; Wang, L.; Zhang, Y.; Liu, X.C.; Lin, H.R.; Meng, Z.N. Development and characterization of 32 microsatellite loci in the giant grouper Epinephelus lanceolatus (Serranidae). Genet. Mol. Res. 2011, 10, 4006–4011. [Google Scholar] [CrossRef]
- Kim, K.S.; Noh, C.H.; Moon, S.J.; Han, S.H.; Bang, I.C. Development of novel tetra- and trinucleotide microsatellite markers for giant grouper Epinephelus lanceolatus using 454 pyrosequencing. Mol. Biol. Rep. 2016, 43, 541–548. [Google Scholar] [CrossRef]
- Kuo, H.C.; Hsu, H.H.; Chua, C.S.; Wang, T.Y.; Chen, Y.M.; Chen, T.Y. Development of pedigree classification using microsatellite and mitochondrial markers for Giant grouper broodstock (Epinephelus lanceolatus) management in Taiwan. Mar. Drugs 2014, 12, 2397–2407. [Google Scholar] [CrossRef]
- Bright, D.; Reynolds, A.; Nguyen, N.H.; Knuckey, R.; Knibb, W.; Elizur, A. A study into parental assignment of the communal spawning protogynous hermaphrodite, giant grouper (Epinephelus lanceolatus). Aquaculture 2016, 459, 19–25. [Google Scholar] [CrossRef]
- Hsu, T.H.; Chiu, Y.T.; Lee, H.T.; Gong, H.Y.; Huang, C.W. Development of EST-molecular markers from RNA sequencing for genetic management and identification of growth traits in potato grouper (Epinephelus tukula). Biology 2021, 10, 36. [Google Scholar] [CrossRef] [PubMed]
- Guo, L.; Xia, J.; Yang, S.; Li, M.; Chen, X.; Lin, H.; Meng, Z. Rapid detection of SNPs in candidate genes regulating the growth of orange-spotted grouper, Epinephelus coioides (Hamilton, 1822), using semiconductor sequencing. Aquac. Res. 2017, 48, 494–504. [Google Scholar] [CrossRef]
- Thiel, T.; Michalek, W.; Varshney, R.K.; Graner, A. Exploiting EST databases for the development and characterization of gene-derived SSR-markers in barley (Hordeum vulgare L.). Appl. Genet. 2003, 106, 411–422. [Google Scholar] [CrossRef] [PubMed]
- Wang, X.; Liu, S.; Yang, Y.; Wu, L.; Huang, W.; Wu, R.; Li, G.; Zhang, H.; Meng, Z. Genetic evidence for the mating system and reproductive success of black sea bream (Acanthopagrus schlegelii). Ecol. Evol. 2020, 10, 4483–4494. [Google Scholar] [CrossRef] [PubMed]
- Langmead, B.; Salzberg, S.L. Fast gapped-read alignment with Bowtie 2. Nat. Methods 2012, 9, 357–359. [Google Scholar] [CrossRef] [PubMed]
- Li, H.; Handsaker, B.; Wysoker, A.; Fennell, T.; Ruan, J.; Homer, N.; Marth, G.; Abecasis, G.; Durbin, R.; Genome Project Data Processing Subgroup. The Sequence Alignment/Map format and SAMtools. Bioinformatics 2009, 25, 2078–2079. [Google Scholar] [CrossRef] [PubMed]
- Li, H. A statistical framework for SNP calling, mutation discovery, association mapping and population genetical parameter estimation from sequencing data. Bioinformatics 2011, 27, 2987–2993. [Google Scholar] [CrossRef]
- Danecek, P.; Auton, A.; Abecasis, G.; Albers, C.A.; Banks, E.; DePristo, M.A.; Handsaker, R.E.; Lunter, G.; Marth, G.T.; Sherry, S.T.; et al. The variant call format and VCFtools. Bioinformatics 2011, 27, 2156–2158. [Google Scholar] [CrossRef]
- Purcell, S.; Neale, B.; Todd-Brown, K.; Thomas, L.; Ferreira, M.A.; Bender, D.; Maller, J.; Sklar, P.; de Bakker, P.I.; Daly, M.J.; et al. PLINK: A tool set for whole-genome association and population-based linkage analyses. Am. J. Hum. Genet. 2007, 81, 559–575. [Google Scholar] [CrossRef] [PubMed]
- Zhang, C.; Dong, S.S.; Xu, J.Y.; He, W.M.; Yang, T.L. PopLDdecay: A fast and effective tool for linkage disequilibrium decay analysis based on variant call format files. Bioinformatics 2019, 35, 1786–1788. [Google Scholar] [CrossRef]
- Barrett, J.C.; Fry, B.; Maller, J.; Daly, M.J. Haploview: Analysis and visualization of LD and haplotype maps. Bioinformatics 2005, 21, 263–265. [Google Scholar] [CrossRef]
- Lischer, H.E.; Excoffier, L. PGDSpider: An automated data conversion tool for connecting population genetics and genomics programs. Bioinformatics 2012, 28, 298–299. [Google Scholar] [CrossRef]
- Jones, O.R.; Wang, J. COLONY: A program for parentage and sibship inference from multilocus genotype data. Mol. Ecol. Resour. 2010, 10, 551–555. [Google Scholar] [CrossRef]
- Duchesne, P.; Godbout, M.-H.; Bernatchez, L. PAPA (package for the analysis of parental allocation): A computer program for simulated and real parental allocation. Mol. Ecol. Notes 2002, 2, 191–193. [Google Scholar] [CrossRef]
- Pew, J.; Muir, P.H.; Wang, J.; Frasier, T.R. related: An R package for analysing pairwise relatedness from codominant molecular markers. Mol. Ecol. Resour. 2015, 15, 557–561. [Google Scholar] [CrossRef]
- Gautschi, B.; Jacob, G.; Negro, J.J.; Godoy, J.A.; Müller, J.P.; Schmid, B. Analysis of relatedness and determination of the source of founders in the captive bearded vulture, Gypaetus barbatus, population. Conserv. Genet. 2003, 4, 479–490. [Google Scholar] [CrossRef]
- Wang, J. An estimator for pairwise relatedness using molecular markers. Genetics 2002, 160, 1203–1215. [Google Scholar] [CrossRef]
- Robledo, D.; Palaiokostas, C.; Bargelloni, L.; Martinez, P.; Houston, R. Applications of genotyping by sequencing in aquaculture breeding and genetics. Rev. Aquac. 2018, 10, 670–682. [Google Scholar] [CrossRef]
- Thrasher, D.J.; Butcher, B.G.; Campagna, L.; Webster, M.S.; Lovette, I.J. Double-digest RAD sequencing outperforms microsatellite loci at assigning paternity and estimating relatedness: A proof of concept in a highly promiscuous bird. Mol. Ecol. Resour. 2018. [Google Scholar] [CrossRef] [PubMed]
- Baruch, E.; Weller, J.I. Estimation of the number of SNP genetic markers required for parentage verification. Anim. Genet. 2008, 39, 474–479. [Google Scholar] [CrossRef]
- Mastrochirico-Filho, V.A.; Del Pazo, F.; Hata, M.E.; Villanova, G.V.; Foresti, F.; Vera, M.; Martinez, P.; Porto-Foresti, F.; Hashimoto, D.T. Assessing genetic diversity for a pre-breeding program in Piaractus mesopotamicus by SNPs and SSRs. Genes 2019, 10, 668. [Google Scholar] [CrossRef]
- Wang, J. Informativeness of genetic markers for pairwise relationship and relatedness inference. Popul. Biol. 2006, 70, 300–321. [Google Scholar] [CrossRef]
- May, S.A.; McKinney, G.J.; Hilborn, R.; Hauser, L.; Naish, K.A. Power of a dual-use SNP panel for pedigree reconstruction and population assignment. Ecol. Evol. 2020, 10, 9522–9531. [Google Scholar] [CrossRef]
- Steele, C.A.; Anderson, E.C.; Ackerman, M.W.; Hess, M.A.; Campbell, N.R.; Narum, S.R.; Campbell, M.R.; Grant, J. A validation of parentage-based tagging using hatchery steelhead in the Snake River basin. Can. J. Fish. Aquat. Sci. 2013, 70, 1046–1054. [Google Scholar] [CrossRef]
- Frost, L.A.; Evans, B.S.; Jerry, D.R. Loss of genetic diversity due to hatchery culture practices in barramundi (Lates calcarifer). Aquaculture 2006, 261, 1056–1064. [Google Scholar] [CrossRef]
- Jones, A.G.; Ardren, W.R. Methods of parentage analysis in natural populations. Mol. Ecol. 2003, 12, 2511–2523. [Google Scholar] [CrossRef]
- Hauser, L.; Baird, M.; Hilborn, R.; Seeb, L.W.; Seeb, J.E. An empirical comparison of SNPs and microsatellites for parentage and kinship assignment in a wild sockeye salmon (Oncorhynchus nerka) population. Mol. Ecol. Resour. 2011, 11, 150–161. [Google Scholar] [CrossRef] [PubMed]
- Karaket, T.; Poompuang, S. CERVUS vs. COLONY for successful parentage and sibship determinations in freshwater prawn Macrobrachium rosenbergii de Man. Aquaculture 2012, 324, 307–311. [Google Scholar] [CrossRef]
- Wang, J. Parentage and sibship exclusions: Higher statistical power with more family members. Heredity 2007, 99, 205–217. [Google Scholar] [CrossRef] [PubMed]
- Almudevar, A.; LaCombe, J. On the choice of prior density for the Bayesian analysis of pedigree structure. Popul. Biol. 2012, 81, 131–143. [Google Scholar] [CrossRef][Green Version]
- Foote, A.; Simma, D.; Khatkar, M.; Raadsma, H.; Guppy, J.; Coman, G.; Giardina, E.; Jerry, D.; Zenger, K.; Wade, N. Considerations for maintaining family diversity in commercially mass-spawned penaeid shrimp: A case study on Penaeus monodon. Front. Genet. 2019, 10, 1127. [Google Scholar] [CrossRef] [PubMed]


Publisher’s Note: MDPI stays neutral with regard to jurisdictional claims in published maps and institutional affiliations. |
© 2021 by the authors. Licensee MDPI, Basel, Switzerland. This article is an open access article distributed under the terms and conditions of the Creative Commons Attribution (CC BY) license (https://creativecommons.org/licenses/by/4.0/).