Article

Dorsal Striatum Transcriptome Profile Profound Shift in Repeated Aggression Mouse Model Converged to Networks of 12 Transcription Factors after Fighting Deprivation

1
FRC Institute of Cytology and Genetics, Siberian Branch of Russian Academy of Sciences, 630090 Novosibirsk, Russia
2
Pavlov Institute of Physiology, Russian Academy of Sciences, 199034 Saint Petersburg, Russia
*
Author to whom correspondence should be addressed.
Genes 2022, 13(1), 21; https://doi.org/10.3390/genes13010021
Submission received: 18 November 2021 / Revised: 11 December 2021 / Accepted: 18 December 2021 / Published: 22 December 2021
(This article belongs to the Special Issue Advances of Brain Transcriptomics)

Abstract

:
Both aggressive and aggression-deprived (AD) species represent pathologic cases intensely addressed in psychiatry and substance abuse disciplines. Previously, we reported that AD mice displayed a higher aggressive behavior score than the aggressive group, implying the manifestation of a withdrawal effect. We employed an animal model of chronic social conflicts, curated in our lab for more than 30 years. In the study, we pursued the task of evaluating key events in the dorsal striatum transcriptome of aggression experienced mice and AD species compared to controls using RNA-Seq profiling. Aggressive species were subjected to repeated social conflict encounters (fights) with regular positive (winners) experience in the course of 20 consecutive days (A20 group). This led to a profoundly shifted transcriptome expression profile relative to the control group, outlined by more than 1000 differentially expressed genes (DEGs). RNA-Seq cluster analysis revealed that elevated cyclic AMP (cAMP) signaling cascade and associated genes comprising 170 differentially expressed genes (DEGs) in aggressive (A20) species were accompanied by a downturn in the majority of other metabolic/signaling gene networks (839 DEGs) via the activation of transcriptional repressor DEGs. Fourteen days of a consecutive fighting deprivation period (AD group) featured the basic restoration of the normal (control) transcriptome expression profile yielding only 62 DEGs against the control. Notably, we observed a network of 12 coordinated DEG Transcription Factor (TF) activators from 62 DEGs in total that were distinctly altered in AD compared to control group, underlining the distinct transcription programs featuring AD group, partly retained from the aggressive encounters and not restored to normal in 14 days. We found circadian clock TFs among them, reported previously as a withdrawal effect factor. We conclude that the aggressive phenotype selection with positive reward effect (winning) manifests an addiction model featuring a distinct opioid-related withdrawal effect in AD group. Along with reporting profound transcriptome alteration in A20 group and gaining some insight on its specifics, we outline specific TF activator gene networks associated with transcriptional repression in affected species compared to controls, outlining Nr1d1 as a primary candidate, thus offering putative therapeutic targets in opioid-induced withdrawal treatment.

1. Introduction

An aggression-tackling program manifests one of the key issues in health services due to the prevalence of aggression in societies across the world [1]. Consequently, studies on the neurologic mechanisms of aggression attract major psychiatric attention, along with depression stated. Notably, chronic aggression may manifest as an addiction-like state [2,3,4].
Currently, it is established that the dorsal striatum (DS) and nucleus accumbens (NAcc) in the ventral part of the striatum manifest the coordinated regulation of motor activity and stereotypical behaviors [5]. They are reported to be involved in a variety of cognitive, reward and social hierarchy maintenance and learning processes [6]. In particular, the dorsal striatum has been proven to supervise the consolidation of the new response upon the learning process [6]. Hence, these brain regions are inherently involved in addictive, depressive and aggressive behavior [7,8,9] when regularly exposed to a stressful environment or substance abuse, thus leading to behavior pattern fixation.
The major neuron body of both brain regions (DS, NAcc) comprises GABAergic medium spiny neurons (MSN), acting quite synchronously upon the response to phasic dopamine firing [10]. In particular, using RNA-Seq transcriptome data sampled from the DS of mice in a chronic social conflict experiment, we previously reported distinct coordinately expressed gene cluster profiles corresponding to D1- and D2- MSNs in certain phases [11]. The major mechanism of MSN intracellular signal processing upon dopamine/glutamate monoamine uptake is cAMP-mediated (de)phosphorylation signaling cascades, with multiple phosphoproteins involved [7,8,12].
Notably, it is reported that dopamine metabolism correlates with endogenous opioid synthesis in the striatum [13,14], implying the opioid-mediated alteration of synaptic plasticity in affected MSNs. Multiple reports on opioid-mediated changes report particular alterations in the structural and functional plasticity of dendritic spines on MSNs [15,16]. The morphological dendritic changes invoked by opioids are exemplified by the actin cytoskeleton’s remodeling [17]. The actin cytoskeleton gene expression alteration is subject to membrane dynamics such as cell motility and morphogenesis. In particular, dendritic spine dynamics (formation and elimination) are supervised by the actin cytoskeleton.
Genes encoding for cytoskeleton regulatory proteins are affected by opioids. The GTPases family, involved in regulating the actin cytoskeleton, is attenuated by opioid administration [18]. Transcription factors such as AP-1/Fos account for the regulation of approximately a quarter of the structural and synaptic genes, such as activity-regulated cytoskeletal proteins and others [19]. Besides neurons themselves, astrocytes also take part specifically in pruning synapses [20]. Thus, a great deal of changes upon opioid administration take place specifically at the synaptic structural level in MSNs [21].
In each experiment, we tracked the behavior of all males, recording videos of their behavior during agonistic interactions, which allowed us to identify the most aggressive mice demonstrating the greatest daily number and duration of attacks, hyperactivity, the number of behavioral stereotypes, etc. Those with the most eminent aggressive phenotypes (long-lasting, pronounced aggression toward any losers each day) were selected for transcriptome analysis. Winners demonstrated an increased aggression score after a 14-day period of deprivation (AD group) in comparison with the aggression level before deprivation [2,3].
Notably, chronic aggression accompanied by a positive reward (win) inherently manifests an addiction state upon positive fighting experience rounds in mice [2,3,4]. Namely, signs of addiction behavior, similar to drug users, according to Robinson and Berridge, 2003 [22], were observed in mice with repeated experience of aggression supported by wins in daily agonistic interactions [4,23]. In particular, we observed activation of the brain’s dopaminergic and opioidergic systems and the development of tolerance or sensitization to dopaminergic and opiodergic receptor antagonists or agonists after chronic aggression experience [4]. Similar to the withdrawal effect among substance abusers, the experienced winners demonstrated increased aggression after a period of fighting deprivation [3].
Using a chronic social conflict model of aggressive and aggression-deprived nurtured mice, this study pursues the aim of elucidating the basic differentially expressed gene network dynamics characterizing both affected groups.

2. Materials and Methods

2.1. Animals

Adult male C57BL/6 mice were obtained from the Animal Breeding Facility of the FRC Institute of Cytology and Genetics SB RAS (Novosibirsk, Russia). Animals were housed under standard conditions (12:12 hr light/dark regime starting at 8:00 am, with food in pellets and water available ad libitum). Mice were weaned at three weeks of age and housed in groups of 8–10 in standard plastic cages (36 × 23 × 12 cm). Experiments were performed with 10–12-week-old animals. All procedures were in compliance with the European Communities Council Directive 210/63/EU on 22 September 2010. The study was approved by Scientific Council N 9 of the Institute of Cytology and Genetics SB RAS of 24 March 2010, N 613 (Novosibirsk).

2.2. Experimental Procedures

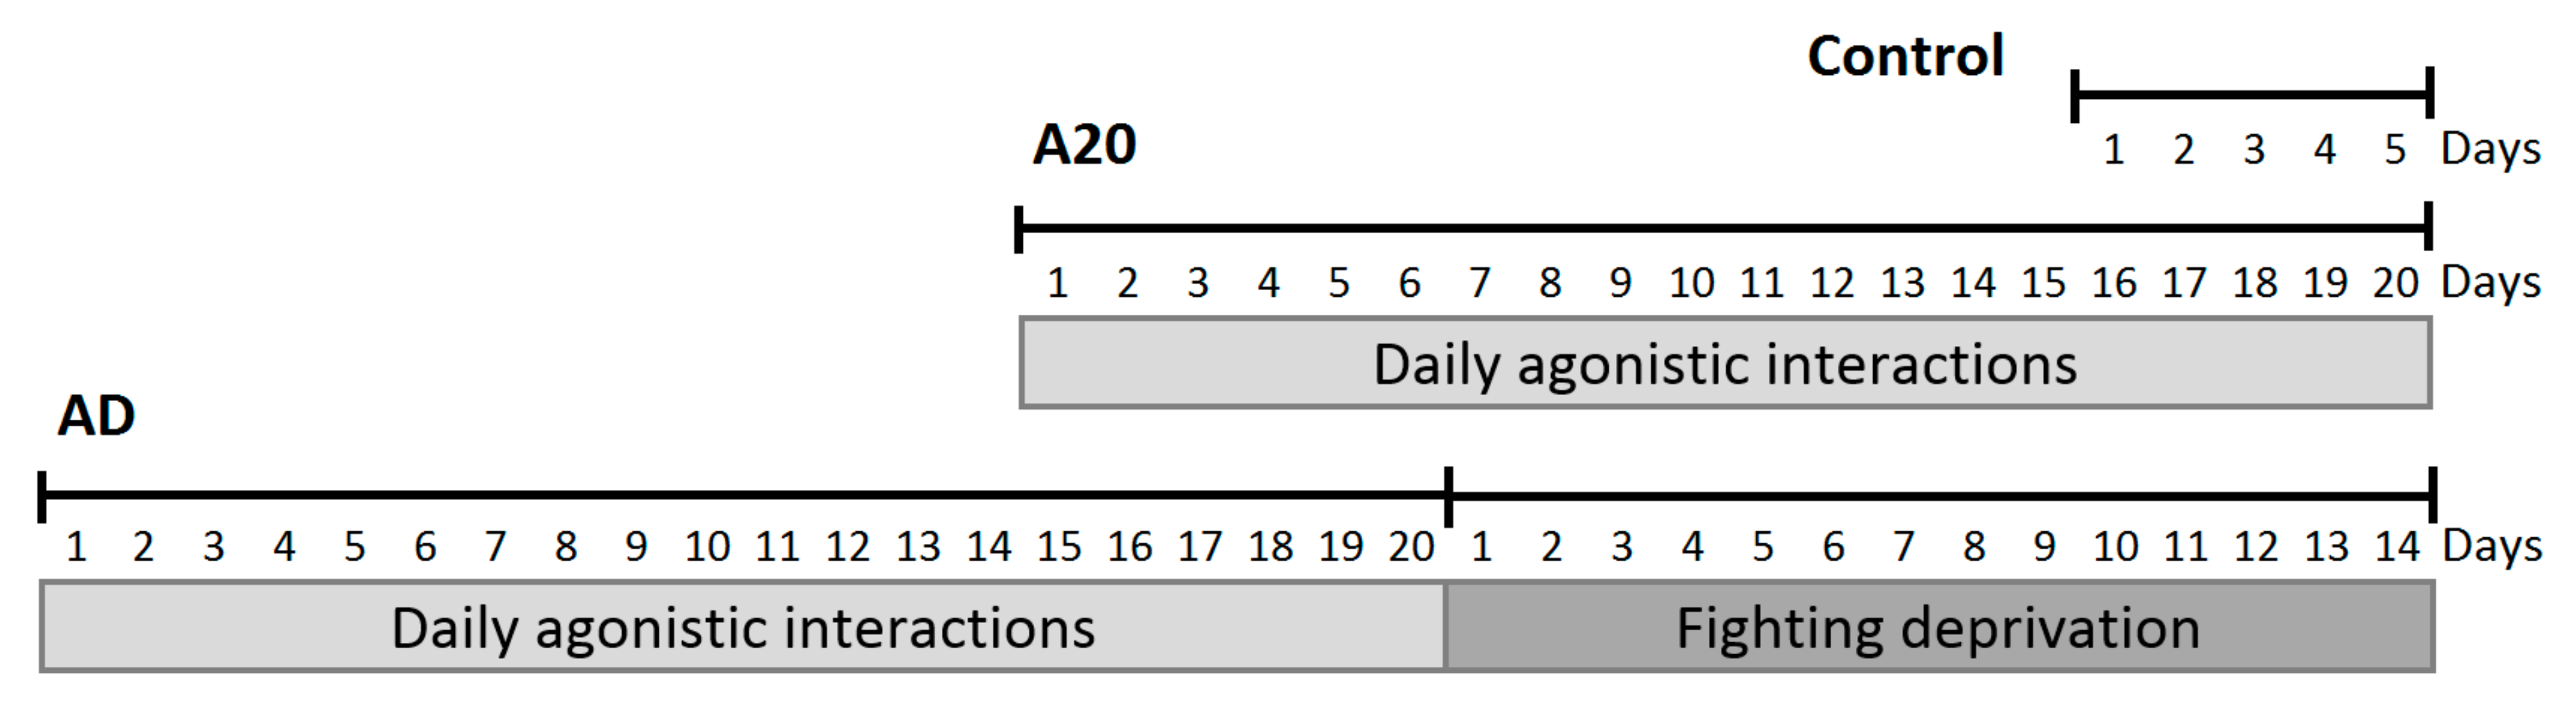
Modeling Repeated Aggression in Male Mice

Repeated negative and positive social experiences in male mice were induced by daily agonistic interactions with the use of a sensory contact model, which later was renamed the “model of chronic social conflicts” [23,24]. Pairs of male mice were each placed in a cage (28 × 14 × 10 cm) bisected by a perforated transparent partition allowing the animals to hear, see and smell each other, but preventing physical contact. The animals were left undisturbed for two days to adapt to the new housing conditions and for sensory acquaintance before they were exposed to agonistic interactions. Every afternoon (2:00–5:00 p.m. local time), the cage cover was replaced with a transparent one, and 5 min later (the time it took for mice to start reacting to a partner in a neighboring compartment), the partition was removed for 10 min to encourage agonistic interactions. The superiority of one of the mice was firmly established within two or three confrontations with the same opponent. The superior mouse (winner) would be attacking, chasing and biting another, who would be displaying only defensive behavior (withdrawal, sideways postures, upright postures, freezing or lying on the back). As a rule, aggressive interactions between males were discontinued by lowering the partition if the strong attacks lasted for 3 min (in some cases less) to prevent injury to the defeated mice. Each defeated mouse (loser) was exposed to the same winner for three days, while, afterwards, each loser was placed, once a day after the agonistic interactions, in an unfamiliar cage with a previously unencountered winner behind the partition. Each winning mouse (aggressive mouse, winner) remained in its original cage. This procedure was performed for 20 days (once a day) and yielded an equal number of losers and winners.
Three groups of animals (n = 6) were collected in this experiment: (1) controls—mice without experience of agonistic interactions; (2) winners—groups of mice that were repeatedly aggressive for 20 days (A20); (3) aggression-deprived mice (AD) that were converted from winners after a period of fighting deprivation for 14 days in secluded cages (Figure 1). The winners 24 h after the last agonistic interaction, the control animals and AD were decapitated simultaneously. The dorsal striatum regions were dissected by the same experimenter according to the map in the Allen Mouse Brain Atlas [25]. All samples were deposited in RNAlater solution (Life Technologies, Carlsbad, CA, USA) and were stored at −70 °C prior to the sequencing routine.

2.3. RNA-Seq Data Collection and Processing

The collected brain samples were delivered to JSC Genoanalytica (www.genoanalytica.ru, accessed on 18 December 2021, Moscow, Russia) for RNA-Seq sequencing. mRNA was extracted using a Dynabeads mRNA Purification Kit (Ambion, Thermo Fisher Scientific, Waltham, MA, USA). cDNA libraries were created using the NEBNext mRNA Library PrepReagent Set for Illumina (New England Biolabs, Ipswich, MA USA) according to the manufacturer’s protocol. The Illumina HiSeq 2500 System was used for sequencing using single (non-paired end) reads of 50 bp length. The target coverage was set to 20 Mio. reads per sample.
The dorsal striatum regions were processed for each of 6 animals per group, separately, without technical replicates. Three groups of animals were employed in the study.
The raw reads from RNA-Seq experiments were trimmed for quality (phred ≥ 20) and length (bp ≥ 32) using Trimmomatic v. 3.2.2 [26]. Illumina adapters were trimmed. The reads were then aligned against the GRCm38.p3 reference genome using the STAR aligner [27]. The descriptive statistics of sample mapping are available in Table S1.
The Cuffnorm app of Cufflinks suite [28] was employed for expression rate assessment in FPKM units. The Cuffdiff app from the same suite was used for elucidating differentially expressed genes.

2.4. Statistical Analysis

Principal component analysis (PCA) was employed using the XLStat statistical package (www.xlstat.com; accessed on 18 December 2021). Pearson product moment correlation matrix for gene expression in samples was used as input data for PCA. An agglomerative hierarchical clustering (AHC) routine was performed using the Pearson correlation matrix with the same XLStat package.
For the analysis, we used DEGs given significant FDR < 0.05 with cuffdiff software. We then employed the strategy of DEG analysis and annotation with the string-db.org suite, selecting the following two key thresholds. (a) DEGs should be connected/associated based on evidence provided by string-db. This guarantees the avoidance of random spurious single DEG signals, since a coordinated functional shift is exponentially more statistically robust. (b) The auxiliary evidence of the connected gene neighborhood should be also supported by transcription co-variation in our data, corroborative to external evidence provided by (a). We thus confined our attention/conclusions based primarily on the connected gene neighborhood making most sense in the DEG functional elaboration assisted by Gene Ontology (GO) annotation. If there were unconnected but evidently important DEGs (such as the key transcription factor activators), we used the procedure of string-db-mediated expansion of the corresponding DEG gene neighborhood, with subsequent checking of consistent co-variation of the inferred network in our data.

3. Results

3.1. Detecting DEGs in Three Pairwise Comparisons

We performed three-way comparisons of control, A20 and AD expression data by means of CuffDiff software [28]. The results yielded approximately 1000 DEGs for control vs. A20 species, and only 62 for AD compared with controls (Table 1). This implies that the dorsal striatum state of AD species is quite close to the control, while, in aggressive A20 species, there are a great deal of alterations.

3.2. C_AD Comparison

We performed GO annotation of DEGs from C_AD comparison, which yielded a single highly significant GO term annotation (process) “DNA-binding transcription activator activity, RNA polymerase II-specific” (GO:0001228; 12 genes, FDR < 2.6 × 10⁻⁵).
To ascertain the 12 DEG set clustering mode outlined by GO annotation, we built a PCA biplot based on the 12 gene expression profiles (Figure 2). We found that 12 DEGs assigned as “transcription activators (Transcription Factors, TF)” underlined by the particular GO term were quite antagonistically distributed (Figure 2). Note 3 species clusters therein: control (green shaded), AD (Zic1, Zic2, Tcf7l2), and A20/AD (Zeb2, Foxi2, Pou2f2) clusters.
Consequent GO analysis underlined connected networks in two of three clusters, as depicted in Figure 3.
In total, 145 publications referencing this particular 12 fold TF activator set are available, according to the “reference publications” term in the string-db.org resource. Three GO categories are valid throughout the whole 12 fold set: (1) DNA-binding transcription activator activity, RNA polymerase II-specific (12 genes; FDR < 4 × 10⁻¹⁷); (2) sequence-specific DNA binding (12 genes; FDR < 4.4 × 10⁻¹³); (3) nucleoplasm (12 genes; FDR < 2.7 × 10⁻⁷).

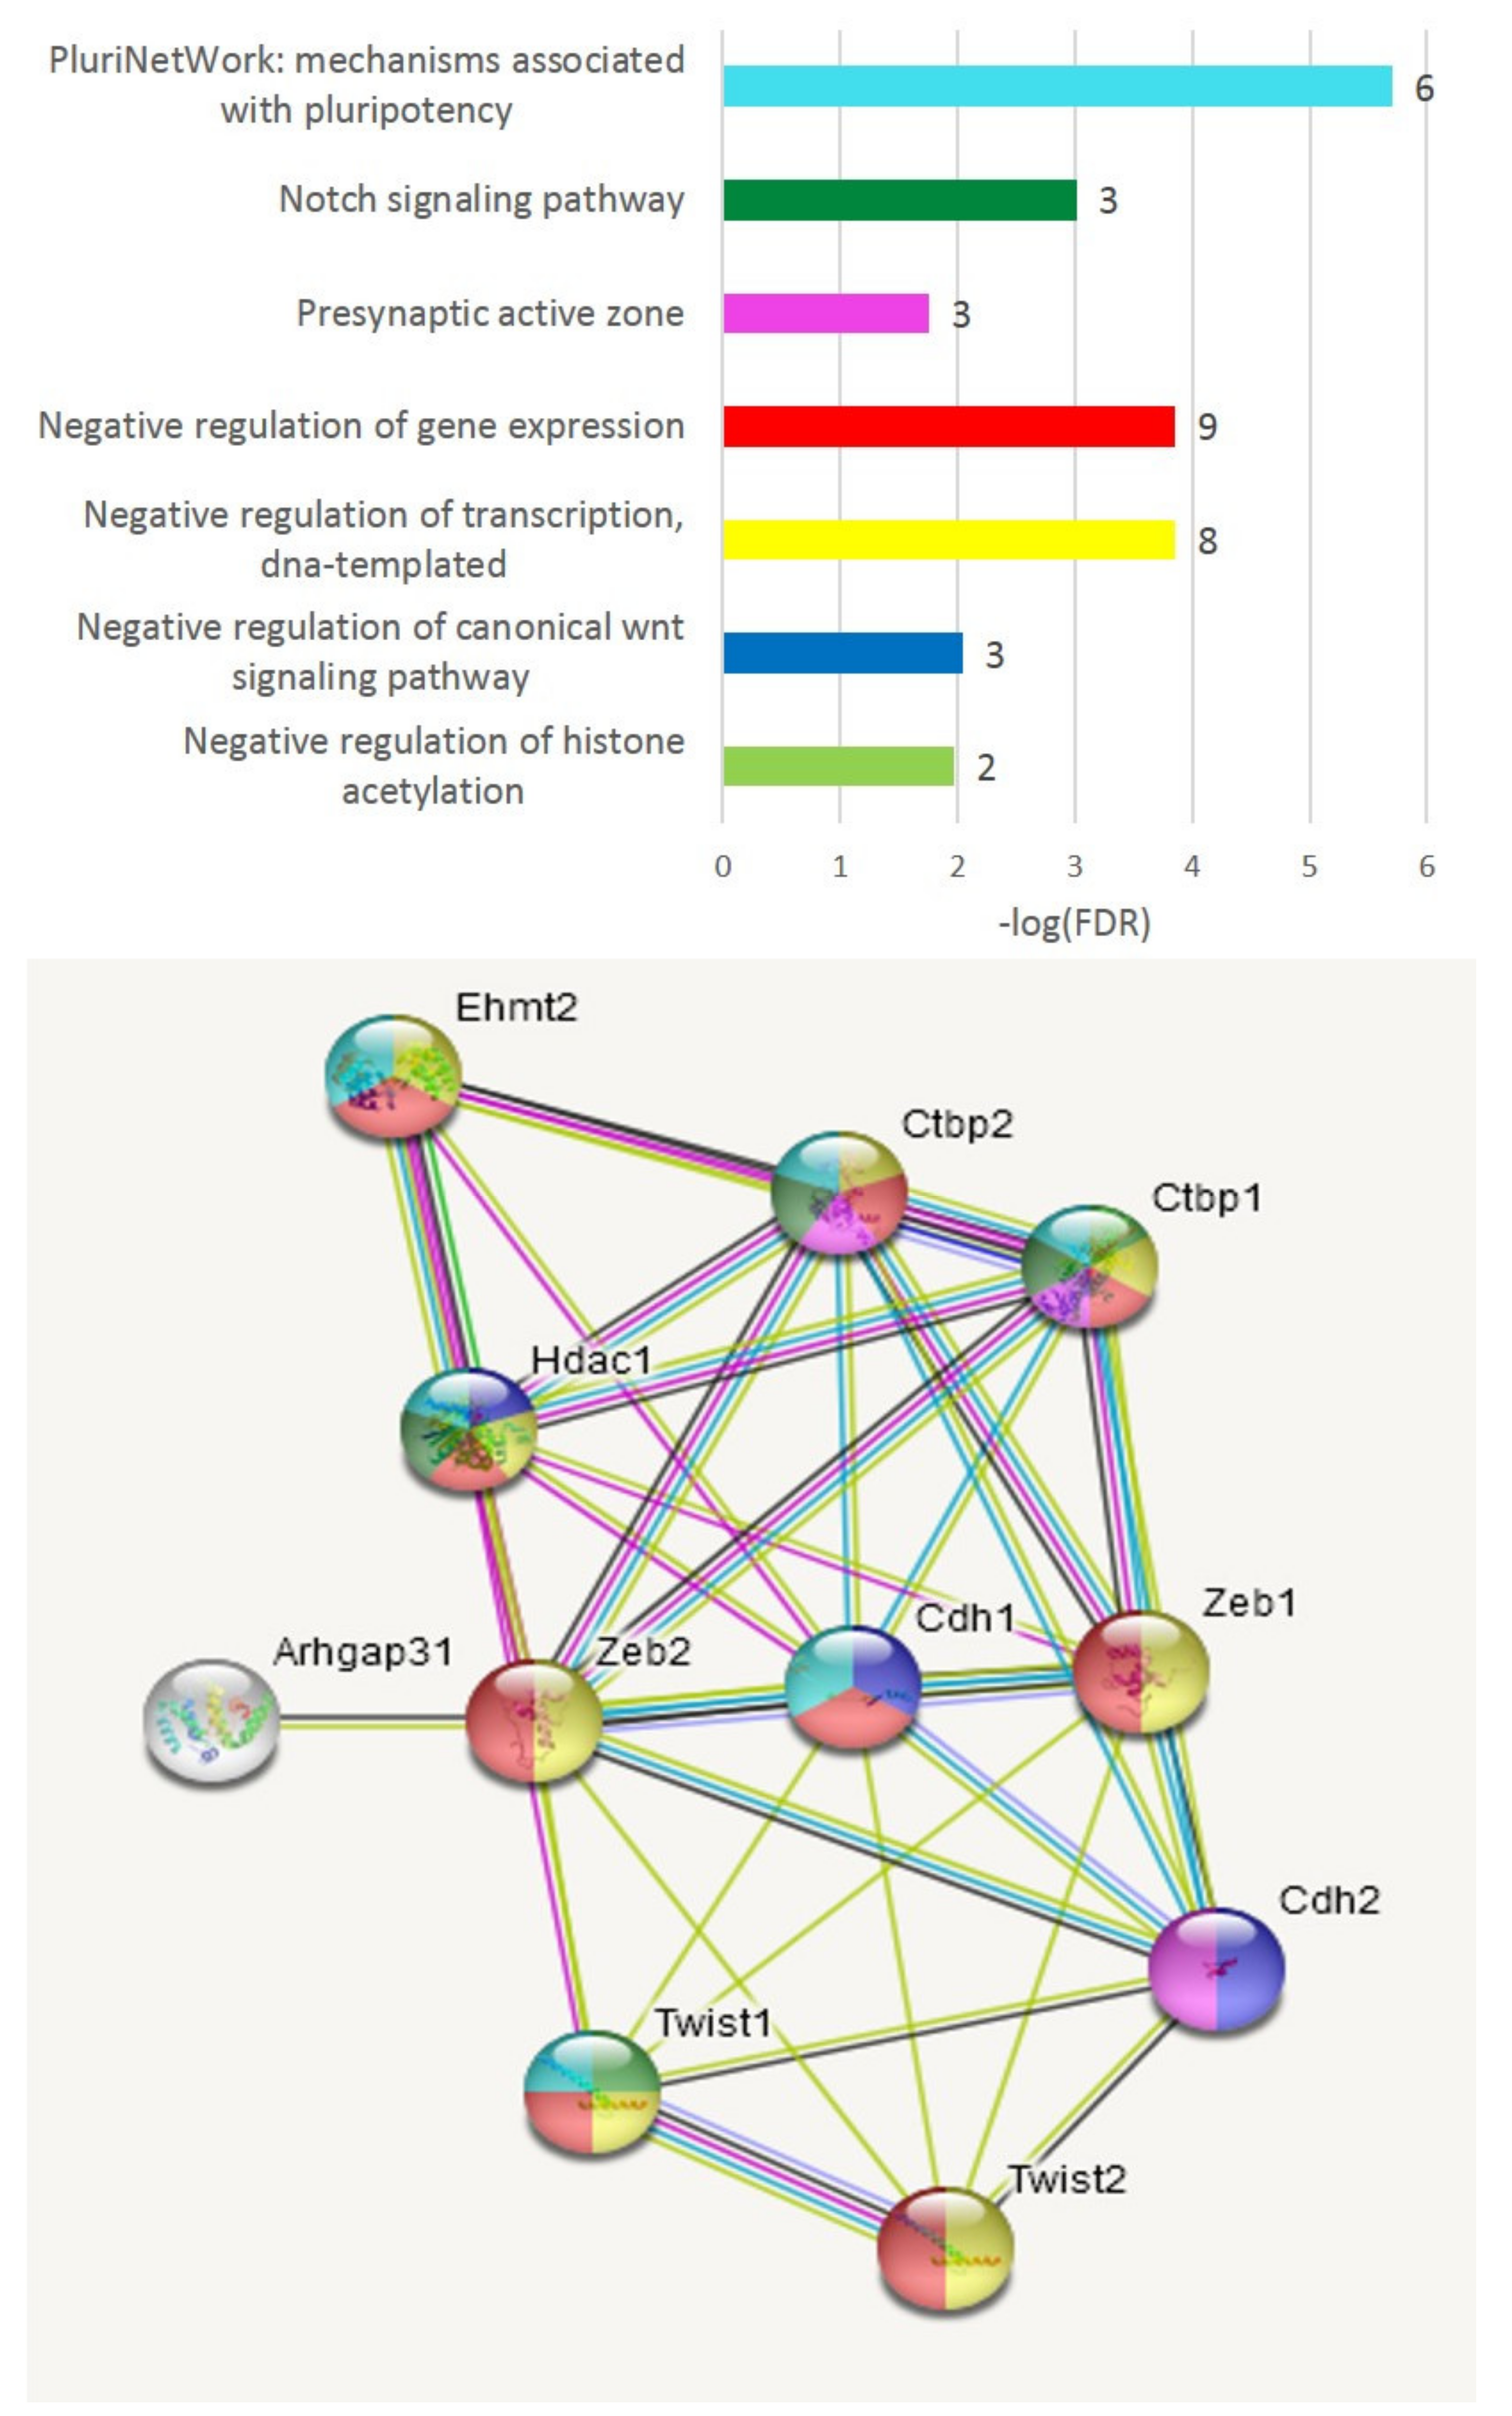
3.2.1. Expansion of TF Clusters by Co-Variation Analysis

To gain further insight into the 12 TF features, we employed expansion of the DEG networks presented in Figure 3 by co-variation analysis of all gene profiles across 18-fold samples, using as the seeds the genes from the target 12 TF list (Figure 3). Expression profiles were assessed pairwise with the Kendall rank correlation coefficient.
We applied the algorithm of min/max optimization, aimed at elucidating the minimal connected neighborhood with the maximum target genes. For this, we used the genes with the highest correlation values with queries from the target list of six, three and three TF clusters (Figure 3) with a threshold of Kendall correlation coefficient: r > 0.6 (p < 1 × 10⁻³).

3.2.2. Control Six-TF DEGs Assessment

As a result of the min/max algorithm, we efficiently expanded the “control” six-TF DEG cluster (Figure 3A) and generated a connected subset (11 genes) spanning five DEGs, as shown in Figure 4. We allowed the algorithm to include the genes from the same gene families even if this did not lead to the inclusion of the DEGs. In this way, we, as a rule, maintained a more robust gene network due to their regular relevance.
The majority were transcription factors related to the “regulation of neuronal synaptic plasticity” and “nervous system development” GO terms. Seven TFs were reported to affect behavior (Figure 4). All genes significantly correlated with the Fos TF, implying its priority in the set. The set comprising Fosl2, Egr1, Etv5, Nr4a1 and Nr4a2 was related to the cellular response to corticotropin-releasing hormone stimulus, cellular response to oxidative stress, locomotory behavior and response to hypoxia according to GO annotation (Figure 4).

3.2.3. Circadian Rhythm DEG Analysis

It appeared that the Arntl DEG (Figure 3A) was not related to other DEGs from the control group and was implicated in the circadian rhythm gene network (Figure 5).
We underlined three repressive DEGs (Per1, Per2, Nr1d1) besides Arntl inferred from C_AD, AD_A20, C_A20 comparisons when we built a PCA plot across all mice groups based on eight gene expression profiles (Figure 6). Aggression-related genes repressive to circadian rhythm genes Cry1, Cry2, Per1, Per2 were downturned in AD species, except for Nr1d1, but the key circadian genes (Arntl, Clock, Npas2) had not yet recovered their expression, implying an acute transition state in the AD group, featuring specifically high expression of the antagonistic Nr1d1 DEG in the AD group (Figure 6). Notably, certain circadian clock genes negatively regulate the glucocorticoid receptor pathway (GO plot, top, Figure 5); thus, hormonal misbalance may take place given the shifted state of the gene expression profile dynamics (Figure 6).
The disruption of the circadian clock apparently followed increased dopamine uptake in aggressive mice, as underlined in [29].

3.2.4. Cluster Two Expansion

We assessed the expanded three-DEG set (Figure 3B) featuring the wnt signaling and consequent attenuation of neural development (Figure 7). The Zic family of zinc finger C2H2 proteins is annotated as transcriptional repressors (Zic1-Zic5). Zic1 is reported to repress the Drd1 receptor, characteristic of AD species lacking dopamine. The Zic1, Zic2 genes are reported to be involved in behavioral abnormalities [30]. Overall, this cluster comprises several TFs (Smo, Ctnnb1, Nr2f2, Zic2, Med12, Zic3) involved in sustaining pluripotency (GO: WP1763; Figure 7), alongside transcription/development regulation, as well as overlapping with carcinogenic marker genes (Ctnnb1, Fzd8, Fzd9) in various tissues except for brain-related ones, as reported elsewhere. Figure 8 confirms these genes’ concordant expression in the AD mice subgroup. Notably, we recovered six more DEGs (Calb2, Zic4, Prkcd, Nrp2, Nr2f2, Whrn; Figure 8) present in the connected network (Figure 7), specifically in the A20_AD comparison, and the significance rate for all nine DEGs was the highest possible (Table S2). This gene cluster was downturned in A20 relative to the controls (see Whrn DEG twofold difference; Table S2). Overall, the C_AD comparison yielded four associated DEGs (Prkcd, Calb2, Zic1, Zic2) augmented specifically due to AD4 and AD6 species (Figure 2; Table S2). Based on this fact, we may state that the emergence of this particular cluster/network for AD4 and AD6 species (Figure 2) fundamentally antagonizes/contradicts A20’s gene expression pattern (as well as that of the control group; Figure 2 and Figure 8), and may be the basic cause of acute phenotype manifestation. Whrn DEG is associated with actin-based projection dynamics along with other genes (Figure 7), implying that membrane structure remodeling may be employed during the process.
The Wnt pathway essentially relates to the embryonic development program, implying high dynamics of transcription program evolvement in mature tissues as well [31]. It starts with Wnt* gene(s) transcription, which causes an accumulation of Catenin β (Armadilio) in the cytoplasm and its translocation to the nucleus, acting as a transcriptional coactivator of transcription factors. Thus, overexpression of Ctnnb1 points to the exemplification of the Wnt program in the cells.
Also, in regard to this path, we observed Wnt9a, Wint10a as DEGs elevated in AD mice, as featured in the AD_A20 comparisons with high confidence (FDR < 0.0014 for Wnt9a; Table S2). The C_A20 comparison manifests four Wnt DEGs (Table S2), including the abovementioned two in AD being highly depressed in A20, implying a transition activation mode of these genes in AD evolving from A20 to control group.
While Tcf7l2 (Figure 3B) is not physically associated with the AD-related DEG cluster depicted in Figure 7 and Figure 8, Tcf7l2 manifests the broadest significant co-variation gene volume among the 12 DEGs considered. Its primary known functional partner is wnt3. The pair feature a carcinogenic tandem, as reported in many studies. Mostly glial genes’ expression profiles co-vary with Tcf7l2. After thorough analysis, we may state that it represents gene clusters involved in the wnt signaling response related to gliogenesis and myelination [31].

3.2.5. Third Cluster Featuring Joint A20/AD Species

The three genes of A20-associated clusters are Zeb2, Pou2f2 and Foxj2. The latter two are homeobox TF genes, while Zeb2 is essentially a member of the effective transcriptional repression TF gene network related to sustaining a pluripotent state (Figure 9).
Thus, we may report that both affected species groups’ associated DEG TF clusters (Figure 3B,C) feature transcription repression gene networks accompanied by the consequent attenuation of positive development TFs featured in the control group (Figure 3A).

3.3. A20 vs. AD Comparison

We observed 62 DEGs in the C_AD comparison, while more than 1000 DEGs were featured in the A20 transcriptome against two others (Table 1; Table S2). Analysis of the C_AD DEGs comparison above implies that, except for 12 quite distinct and coordinated master TF gene alterations elucidated above, there are no other alterations between the C and AD groups subject to sensible results. Thus, we decided to limit our further analysis to the A20_AD comparison only, not considering the C_A20 one, since DEG overlap was quite dominant between C_A20 and AD_A20 (around 1000 DEGs). When appropriate, we used three-way comparisons in further PCA plots featuring the group specifics in each particular gene network.

3.3.1. Differentially Expressed Genes between Groups

We started with outlining that the A20 group attenuated its transcriptome in a major part against the AD one, featuring 839 DEGs that decreased their expression, against 170 with increased expression profiles (Figure 10).
An overall breakdown of the GO categories in A20_vs_AD is presented in Table S3 in the graphical plots therein. In particular, there are 67 relevant pathways from KEGG, including cAMP-mediated signaling, learning and glutamate receptor pathways (Table S3). A total of 239 genes were involved in the annotated KEGG pathways from the DEG gene list. The majority of the KEGG pathways (45 from 67) partially included the cAMP signaling network. Both cellular component and biological process GO categories were highly enriched (high FDR significance) with neuron-specific compartments/pathways (Table S3). At least half of the DEGs (536) were phosphoproteins, implying regulation complexity and the signal transduction type in medium spiny as well as other neurons. Tissue type GO annotation unambiguously assigned most of its categories to brain tissues, including relevant corpus striatum/neostriatum/striatal neuron types (Table S3). A total of 18 “negative regulation” GO terms were observed in the “Biological Process” GO category (Table S3).
The primary analysis performed by clustering DEG by gene family (Table 3) revealed a great deal of genes involved in synaptic plasticity, as previously reported. In particular, we observed 8 Rho GTPAses (Arh), 10 collagens, the Kif family (6DEGs), regulators of G protein signaling (5 DEGs), etc. (Table 3). From 192 DEGs in the families with DEGs > 4 in Table 3, only 24 DEGs increased their expression in the A20 group.

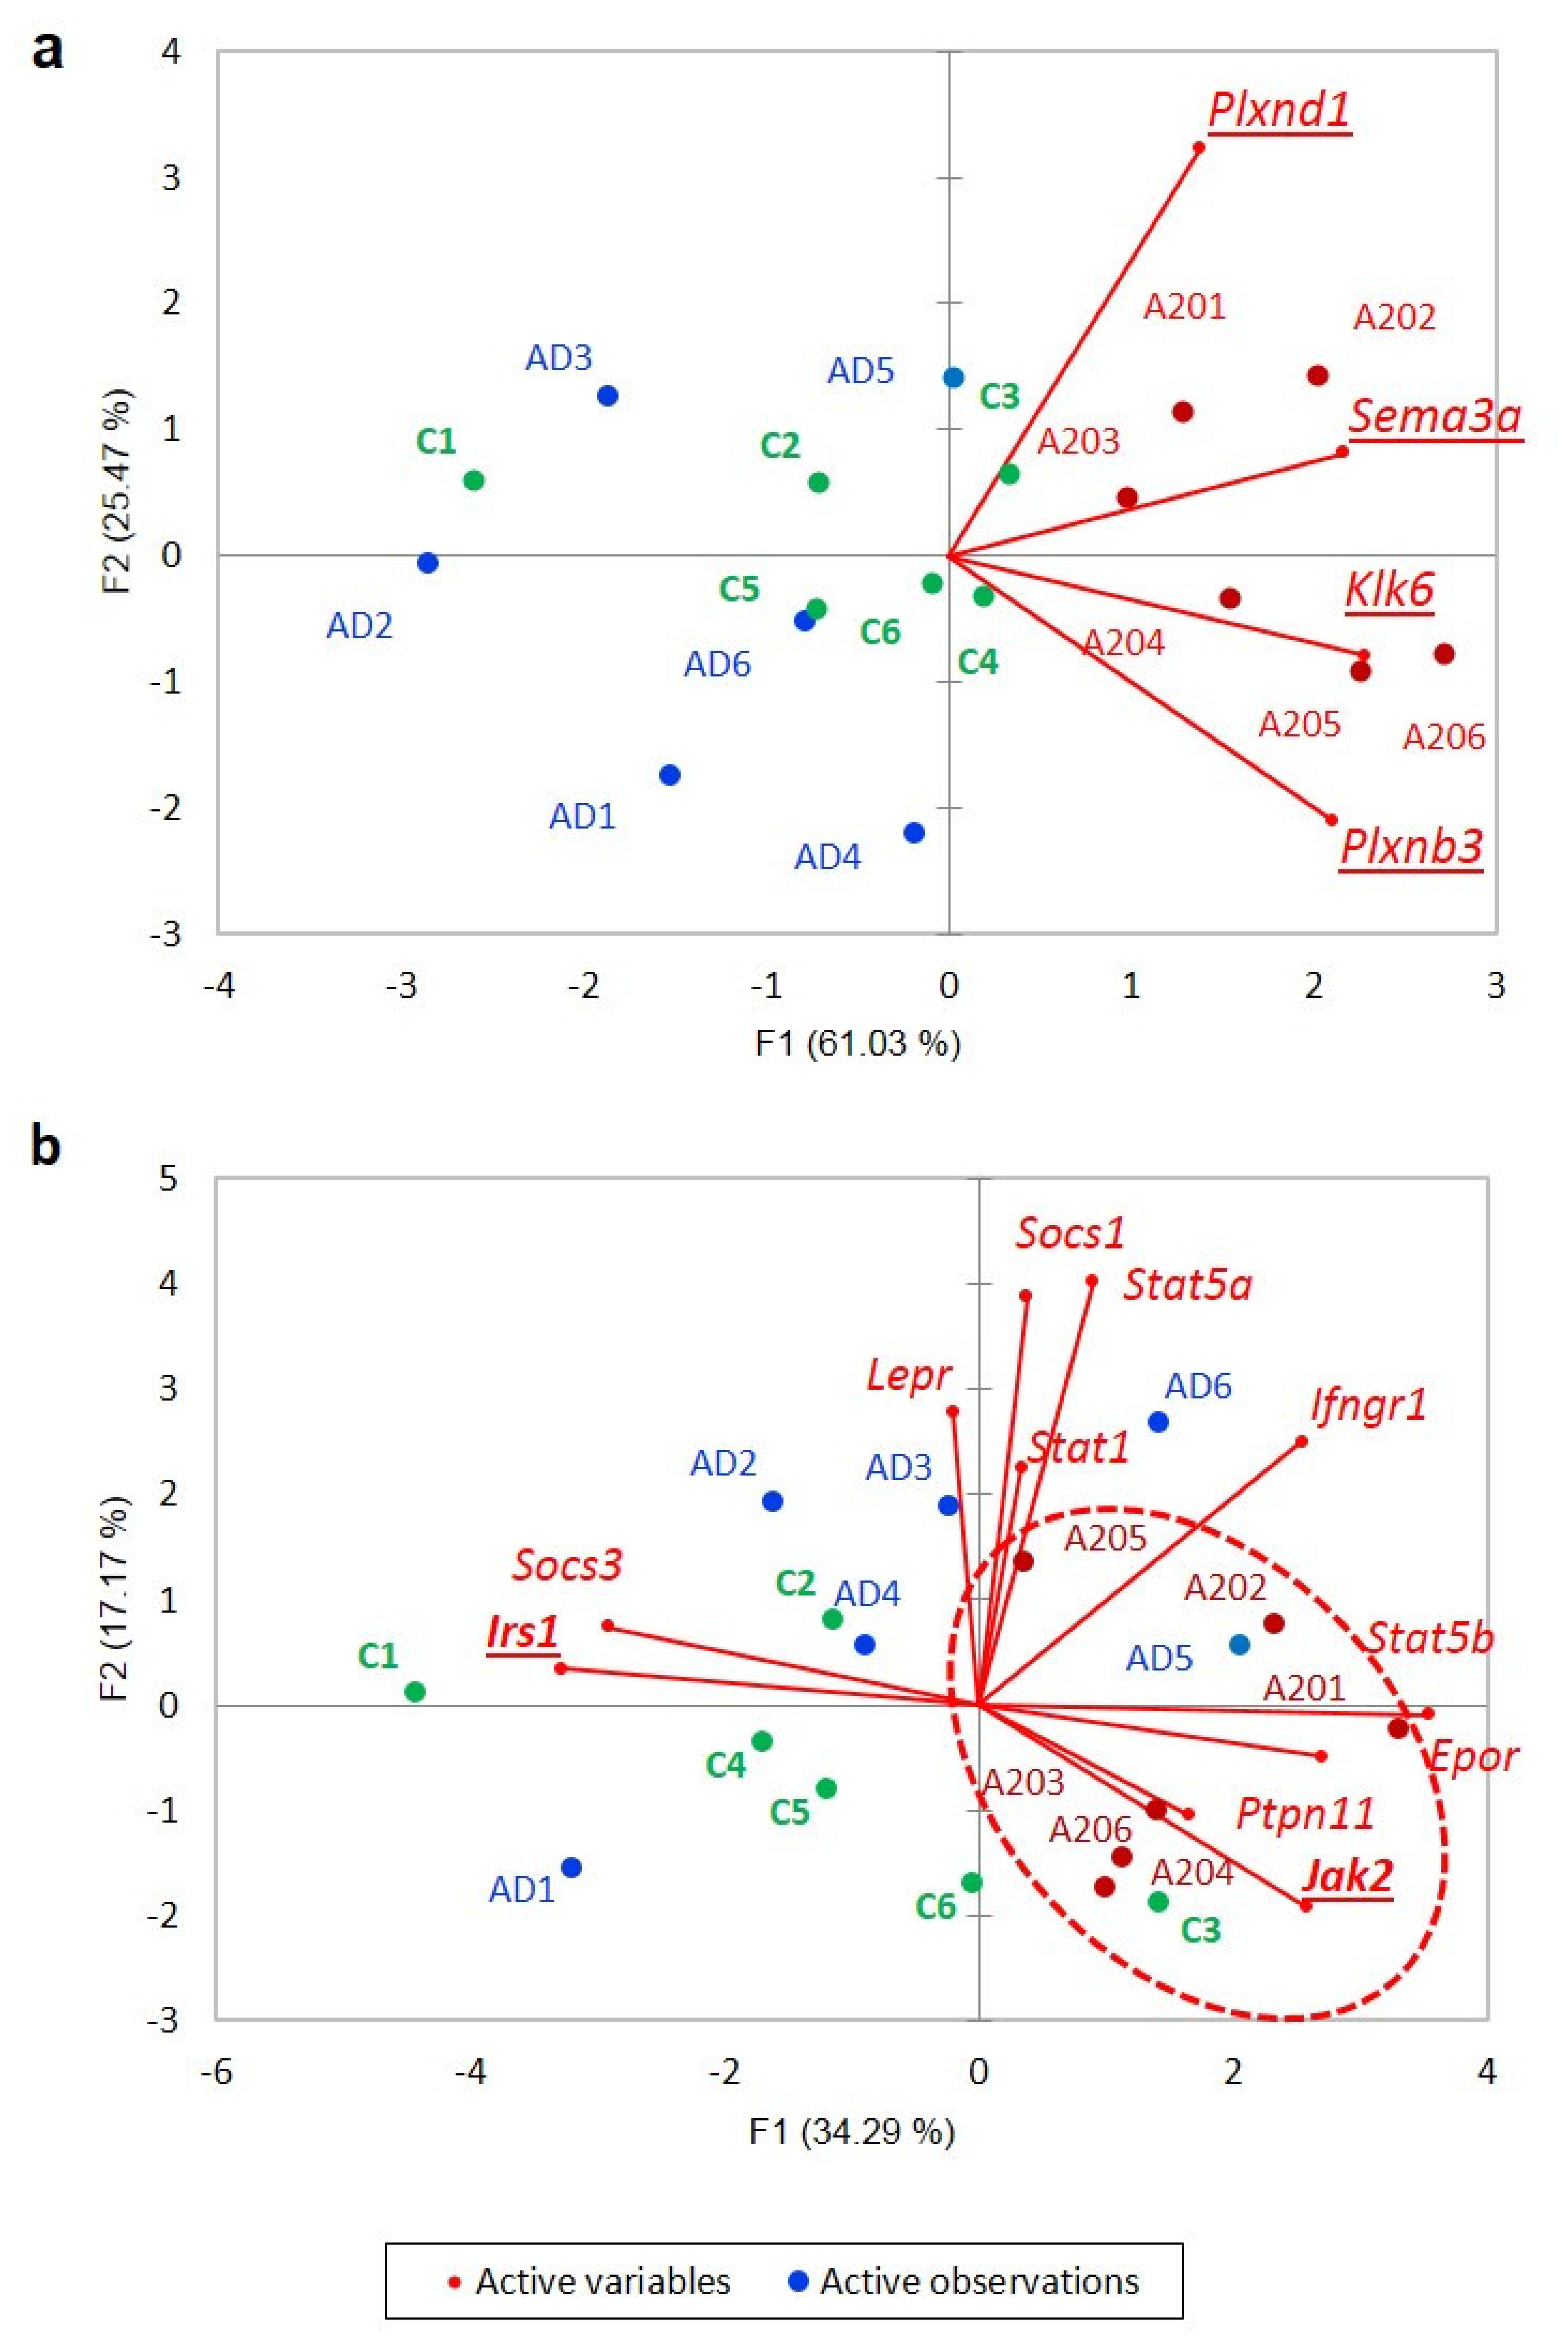
3.3.2. Elaborating on A20-Associated Positive DEG Cluster

We selected 170 DEGs elevated in the A20 group (Figure 10) to assess the functional specifics of the DEGs located within. Upon the clustering routine, we observed virtually a single cluster of 149 DEGs manifesting the cAMP-dependent signaling cascade and associated DEGs, while 21 other DEGs presented non-specific singletons/small clusters. According to GO annotation, we observed a large set of “negative regulation of cellular process” GO enrichment DEGs (58 genes; FDR = 2.3 × 10⁻⁴). The “semaphorin-plexin signaling pathway involved in axon guidance” repression pathway (Sema3a, Pxnd1, Klk6, Plxnb3 DEGs; FDR < 0.0146) was featured in the A20 group (Figure 11a). The dopamine-mediated JAK/STAT pathway gene network reported to be evoked in Parkinson disease [32] also proved to be elevated specifically in the A20 group (Jak22, Irs1 DEGs; Figure 11b). Explicit GO annotation of other GO-enriched categories of the positively regulated 149 DEG cluster in the A20 group is available in Table S5.
Notably, the cAMP cluster conveyed some facts that are worth noting. First, synaptic scaffold genes PSD95 (Dlg4) and Homer1 increased their expression in the DS of aggressive species due to the impact of the cAMP-mediated cascade (and, hence, opioid exposure), contrary to what was reported in [18] for the NAcc region. We should state that Dlg4 performs a specific role in glutamate/dopamine receptor switching in MSNs, as reported in [33,34,35]. Homer1 was reported to be increased in the amygdala of opioid users [36]. It should be stated, though, that the increase was not prominent (not significant in Dlg4 and minimally significant in Homer1 (FDR=0.041; see Table S3)). No significantly different expression of these genes in the C_A20 comparison was observed since the control group featured more active dopamine uptake in the DS (Table S3). Nonetheless, one should bear in mind that we dealt with a relatively mild endogenous opioid synthesis impact in the A20 group.
Circadian entrainment genes were among the non-randomly enriched DEGs in the A20_AD comparison associated with the cAMP cascade as well (mmu04713; Gucy1b3, Rps6ka5, Gucy1a3, Per2, Gnb5, Cacna1h; FDR < 0.024). The “negatively regulated circadian rhythm” GO enrichment contained DEGs (Cry1, Drd1, Per2, Drd2), implying a connection of circadian clock genes Cry1, Per2 with the cAMP-dependent cascade. Indeed, we observed the repression of positive circadian rhythm genes’ expression Npas2, Arntl by Cry1, Per2 in A20 and AD species (Figure 6).
Finally, we report a subcluster of highly correlated RNA-binding proteins (Cnot6, Ddx3y, Ireb2, Mbnl1, Mbnl2, Per2, Rbm15, Xpo1, Ythdf3), depicted in Figure 12. Three of them (Mbnl1, Mbnl2, Rbm15) represent splicing factors. Overall, the cluster manifests negative regulation of transcription. In particular, Rbm15 is reported to facilitate m6a posttranscriptional methylation of mRNA [37]. To the best of our knowledge, we are the first to report such DEGs in regard to DS cAMP signaling.

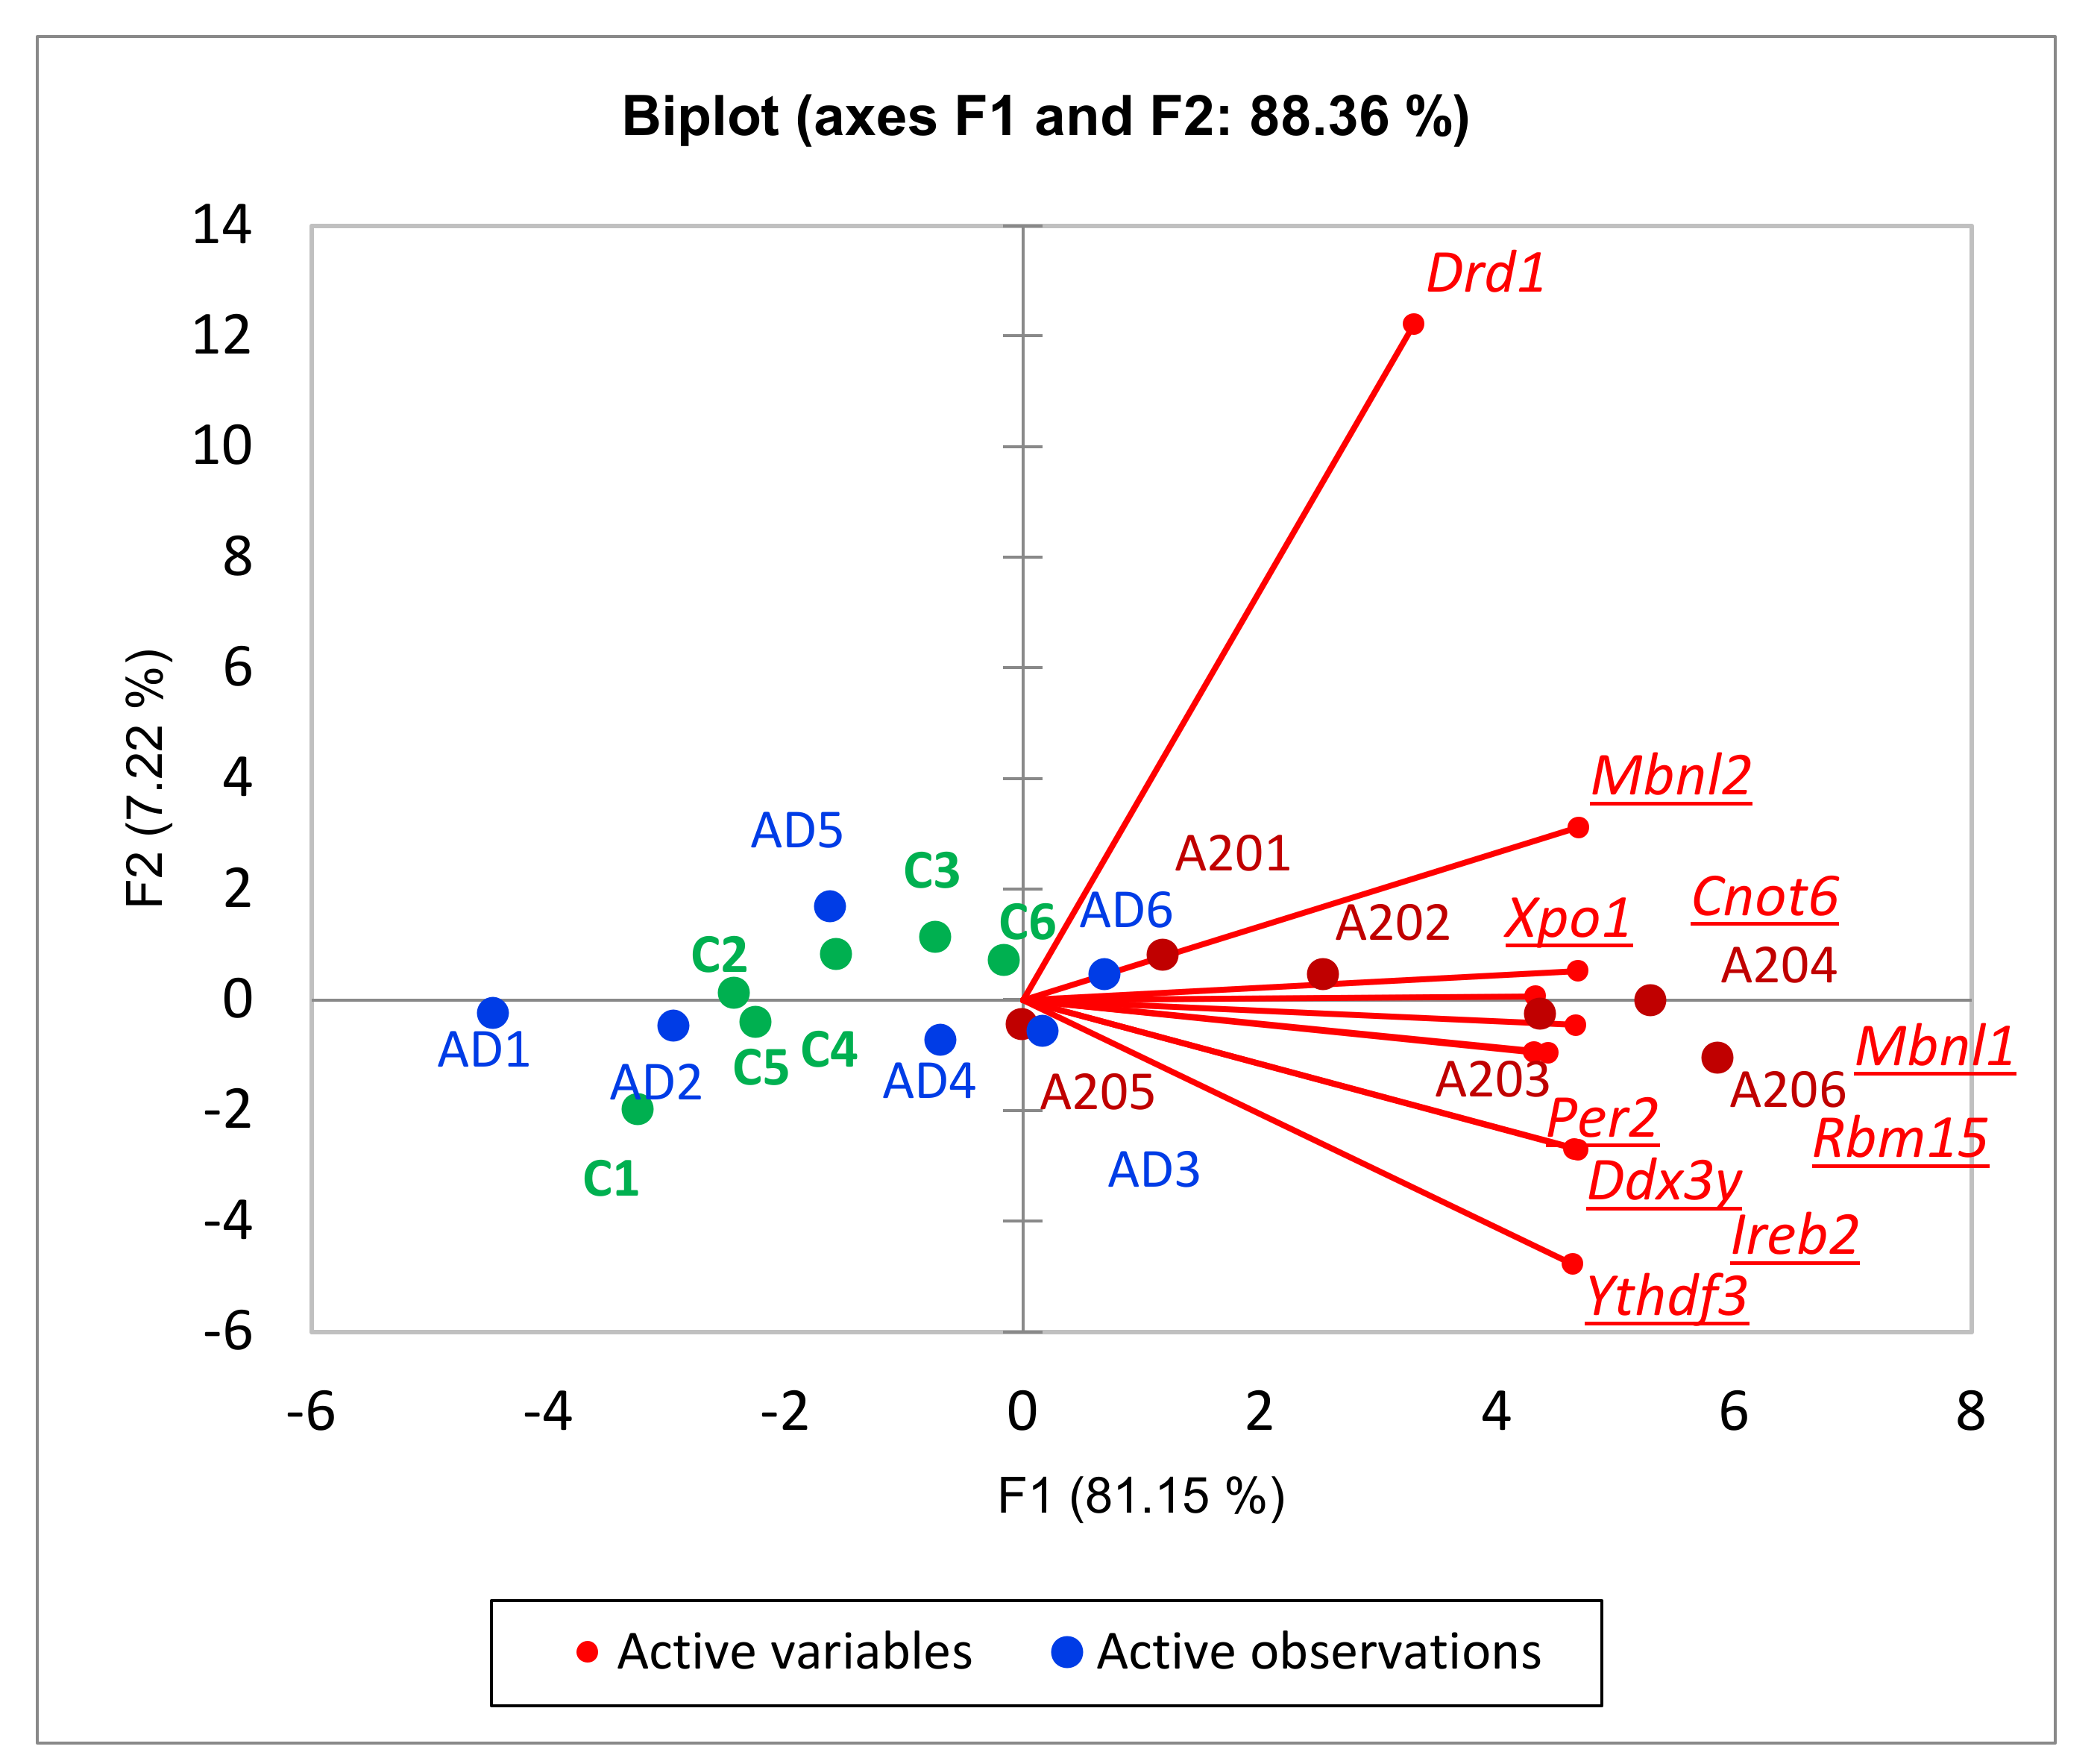
3.3.3. Dopamine-Mediated cAMP Signaling Cascade Balanced Gene Projection in A20 vs. AD Comparison

We underlined two basic interconnected gene groups relevant to the aggression manifestation we consider keystone according to previous publications on behavioral genetics [7], which are the cAMP-mediated gene network and associated endogenous opioid expression. We assessed samples based on the cAMP-mediated dopamine turnover balanced genes set comprising 33 genes introduced in our previous work [11]. The PCA plot underlines high MSN dopamine uptake accompanied by endogenous opioid synthesis in aggressive species (Figure 13). Oppositely, based on Drd1, Drd2 DEGs and Ppp1r1b (Darpp-32) location we infer profound dopamine uptake depression in AD species, along with the abrogation of opioid synthesis.

4. Discussion

We report that the majority of DEGs in the AD_A20 comparison are attributed to synaptic remodeling (GO terms: neuron development, etc.; Table S3) and the attenuation of major development/metabolic processes, leading to the overall downregulation of 839 DEGs from 1009 (Figure 10).
Analysis of DEGs cluster (170 entries) with increased expression in aggressive mice outlined the major role of the cAMP-mediated response in the dopamine uptake gene network and several associated ones, including multiple repressive TFs networks.
To gain further insight into the dopamine–opioid interactions, we inferred that the most expressed striatum neuron-specific genes observed in our samples were Darpp-32 (avg. exp. 1000 FPKM) and Penk (800 FPKM) reported elsewhere. We added dopamine-specific gene Drd1/2 and opioid-associated Penk and Pdyn genes for comparison, as presented in Figure 14. Both Darpp-32 (Ppp1r1b) and Penk are the highest expressed DS coding neuron specific genes attributed to MSN.
We utilized the balanced dopamine cAMP mediated signaling gene network depicted in Figure 13 elucidating an expression projection of this cascade implicitly reflecting the signaling intensity specifics. It is worth noting that incorporated Darpp-32, the ‘heart’ of dopamine mediated signaling cascade assures high confidence of elevated dopamine uptake by its expression shift (Figure 13) supported by coordinated Drd1, 2 DEGs expression. At the same time, it’s hard to ever expect it being DEG due to a high variation (Figure 14) and given enormous expression rate.
One of the basic observations supporting the validity of our analysis is the observed high co-variation of striatum-specific dopamine and opioid genes, outlined in Table 4 and based on data from Figure 14. We found the five genes considered co-vary non-randomly with p-value < 1 × 10⁻⁷. Pdyn is less coordinated (p < 1 × 10⁻⁵; Table 4), less expressed than others (30 FPKM avg.; Figure 14) and is not strictly striatum-specific (hypothalamus, some other regions). Nonetheless, due to its rather stable expression mode it is the most significant DEG among the cAMP set, along with Drd2 (DEG significance for both: FDR < 0.00135, the maximum possible; Table S2).
The reason for such a high correlation rate is that all genes considered are subject to cAMP-mediated activation, including Penk [38]. We thus reconfirm the inherent opioid synthesis upon dopamine uptake reported elsewhere [13,14], and, based on our analysis, we considered these coordinated networks to be the most causal ones.
After elucidation of the core DEG networks, we conclude that high dopamine uptake accompanied by endogenous opioid synthesis in A20 results in profound alteration of the dorsal striatum transcriptome, leading to more than 1000 DEGs in A20 compared to other groups, and more than 540 (though highly overlapping) GO processes’ enrichment (Table S3). These changes feature many gene circuits/processes outlined for AD_A20 GO annotation (Table S3). We specifically underline dopamine-mediated cAMP signaling featuring an increase in the opioidergic network (Figure 13; blue oval). From 63 KEGG networks’ enrichment, 45 overlap with the cAMP cascade (Table S3; KEGG spreadsheet).
Two weeks of aggressive species fight deprivation led to significant restoration of the normal transcriptome in AD (Table 1). A lack of opioid and dopamine uptake in the AD dorsal striatum followed profound GABA reuptake, indicated by a high Slc6a11 expression increase in AD vs. A20 (q < 0.00135; Table S3), implying that MSN GABAergic signaling stalls in AD species.
Previous studies underline the profound alteration of opioid-induced synaptic plasticity in MSNs, including structural, transcriptional and epigenetically invoked components [21]. We report distinct structural synaptic remodeling dynamics, observing “actin filament-based movement”, “actin-mediated cell contraction”, “actin filament-based process” (50 DEGs) and “regulation of actin filament-based process” (23 DEGs) GO enrichment significantly shifted in A20 from the AD/control. In particular, we report 41 DEGs of “actin cytoskeleton organization” enrichment (Table S3; “Process” sheet; s.669; FDR < 0.007; GO:0030036), corresponding with the earlier connection with the synaptic membrane [39]. Virtually all of the DEG networks mentioned in the GO enrichment (Table S3) were downregulated in the A20 group.
Regarding C_AD DEGs, we report three clusters of TF activators (Figure 3), two featuring repressors augmented in A20/AD species, with a corresponding attenuation of the control TF activators DEG cluster. It is worth noting that we elucidate circadian rhythm network disruption in all three transcriptome comparisons, which was significant in both the aggressive and aggression-deprived groups (Figure 6). Previous studies underlined the withdrawal effect of the Per2 gene [40], as well as its dopamine-associated expression pattern [41], featuring abrogation of the withdrawal effect while knocking Per2 out [42]. Notably, we observed a significant downturn in Per2 in AD mice (Figure 6), implying a transition to a normal state. We point out the Nr1d1 DEG as the most antagonistic one in the AD group relative to the control group within the circadian clock gene network (Figure 6). Overall, three repressive DEGs (Per1, Per2, Nr1d1) manifest the greatest discrepancy with control group circadian genes in affected species, as reported in [43]. The effects on circadian clock genes upon chronic opioid exposure were also reported in a series of recent publications [44,45,46].
We performed RNA-Seq analysis of aggressive (A20), aggression-deprived (AD) and control groups, evaluating their relationships. We present our major results in the relation diagram in Figure 15, elucidated by DEG analysis. Therein, the red arrow underlines a high expression discrepancy (more than 1000 DEGs; Table 1). The blue arrow indicates quite few DEGs (given C_AD comparison; Table 1), but they were quite empowered TF activators (Figure 3), producing a non-significant distribution but a considerable effect on the key neurogenetic networks related to withdrawal syndrome after opioid addiction. Notably, a downturn in opioid synthesis in aggressive mice was reported in [47], but the authors examined the whole brain tissue. The current study links dopamine-mediated increased opioid expression with the DS in aggressive mice (Figure 13 and Figure 14), as also confirmed in our previous studies [2,3,4].

5. Conclusions

We report high overall attenuation of the DS transcriptome expression rate (170 out of 1009 DEGs are upregulated in A20) upon aggression-related stress, featuring high dopamine uptake and endogenous opioid synthesis. Strikingly, we observed quite rapid (14-day period) recovery of the major body of transcriptome gene expression profiles upon fighting round abrogation, with the unique elevation of 12 TF activators’ expression profiles. Most of these DEG TFs refer to the repression of neuron development, which, in particular, implies synaptic scaffold rearrangement. We assume, given the contraction of the postsynaptic density architecture [18,19], along with the alteration of synaptic gene expression upon opioid exposure, that it takes considerable time to restore the intact synapse plasticity transcription program along with the circadian rhythm, in this way leading to the withdrawal symptoms.
Concerning the A20 group, we report that the cAMP-mediated gene cascade displays significant elevation following the disruption of the circadian clock, increased opioid synthesis, the evocation of Wnt signaling in the DS and a downturn in overall neurogenesis and glial development. We underline the similarity of the DS and NAcc brain regions based on neuron content (MSNs as majority; [10]), thus manifesting similar mechanisms within this core, including maintaining dopaminergic projections from VTA and employing cAMP-mediated intracellular signal cascades within them.
As group-wise specific features, we report neuroinflammation related Semaphorin-plexin and JAK/STAT signaling instantiations in A20 group (Figure 11), and wnt cascade being robustly manifested in part of AD group (Figure 8), possibly linked to synaptic plasticity restoration including dendritic spines and axon projections architecture lost upon endogenous opioid exposure [21].

Supplementary Materials

The following are available online at https://www.mdpi.com/article/10.3390/genes13010021/s1, Table S1. Stats on mapping routine.xlsx, Table S2. DEGs table.xlsx, Table S3. GO AD_A20 DEGs comparison.xlsx, Table S4. Enriched families in A20_AD DEGs.xlsx, Table S5. 149 Positively regulated genes GO annotation.

Author Contributions

Animal model curation, N.K.; Tissue sample collection, D.S., I.K. and A.G.; Computing, V.B. and R.B.; Formal analysis, V.B., O.R., D.S., I.K. and A.G.; Funding acquisition, N.K.; Investigation, V.B., R.B. and O.R.; Methodology, N.K.; Supervision, N.K.; Writing—original draft, V.B.; Writing—review and editing, V.B. and O.R. All authors have read and agreed to the published version of the manuscript.

Funding

The current study was supported by the Russian Science Foundation (grant no. 19-15-00026). The preparation and maintenance of the experimental animals were carried out in the Vivarium for Conventional Animals at the Institute of Cytology and Genetics SB RAS and were supported by publicly funded project no. 0259-2021-0016.

Institutional Review Board Statement

All procedures were conducted in compliance with European Communities Council Directive 210/63/EU of 22 September 2010. The study protocol was approved by Scientific Council No. 9 of the Institute of Cytology and Genetics SB RAS of 24 March 2010, No. 613 (Novosibirsk, Russia).

Informed Consent Statement

Informed consent was obtained from all subjects involved in the study.

Data Availability Statement

The RNA-Seq datasets are available in the European Nucleotide Archive (Accession No. PRJEB48789).

Acknowledgments

The authors are grateful to JSC Genoanalytica (Moscow, Russia) for conducting the technological part of the experiment and the primary statistical analysis.

Conflicts of Interest

The authors declare no conflict of interest.

Abbreviations

DEGsdifferentially expressed genes
FPKMfragments per kilobase of transcript per million mapped reads
GOGene Ontology
KEGGKyoto Encyclopedia of Genes and Genomes Pathway Database

References

  1. Seto, M.C.; Healey, L.V.; Ahmed, A.G. Legally Mandated, Formally Pressured, or Voluntary Anger Treatment: Associations with Treatment Recommendations, Refusal, and Completion. J. Interpers. Violence 2021. [Google Scholar] [CrossRef]
  2. Kudryavtseva, N.N. Straub tail, the deprivation effect and addiction to aggression. In Motivation of Health Behavior; O’Neal, P.W., Ed.; NOVA Science Publishers: New York, NY, USA, 2007; pp. 97–110. [Google Scholar]
  3. Kudryavtseva, N.N.; Smagin, D.A.; Bondar, N.P. Modeling fighting deprivation effect in mouse repeated aggression paradigm. Prog. Neuro-Psychopharmacol. Biol. Psychiatry 2011, 35, 1472–1478. [Google Scholar] [CrossRef] [PubMed]
  4. Kudryavtseva, N.N. Positive fighting experience, addiction-like state, and relapse: Retrospective analysis of experimental studies. Aggress. Violent Behav. 2020, 52, 101403. [Google Scholar] [CrossRef]
  5. Basile, G.A.; Bertino, S.; Bramanti, A.; Ciurleo, R.; Anastasi, G.P.; Milardi, D.; Cacciola, A. Striatal topographical organization: Bridging the gap between molecules, connectivity and behavior. Eur. J. Histochem. 2021, 65, 3284. [Google Scholar] [CrossRef] [PubMed]
  6. Smith, A.W.; Jonkman, S.; Difeliceantonio, A.G.; O’Connor, R.M.; Ghoshal, S.; Romano, M.F.; Everitt, B.J.; Kenny, P.J. Opposing roles for striatonigral and striatopallidal neurons in dorsolateral striatum in consolidating new instrumental actions. Nat. Commun. 2021, 12, 5121. [Google Scholar] [CrossRef]
  7. Plattner, F.; Hayashi, K.; Hernandez-Cortes, A.; Benavides, D.R.; Tassin, T.C.; Tan, C.; Day, J.P.; Fina, M.W.; Yuen, E.Y.; Yan, Z.; et al. The role of ventral striatal cAMP signaling in stress-induced behaviors. Nat. Neurosci. 2015, 18, 1094–1100. [Google Scholar] [CrossRef] [PubMed] [Green Version]
  8. Nishi, A.; Matamales, M.; Musante, V.; Valjent, E.; Kuroiwa, M.; Kitahara, Y.; Rebholz, H.; Greengard, P.; Girault, J.-A.; Nairn, A.C.; et al. Glutamate Counteracts Dopamine/PKA Signaling via Dephosphorylation of DARPP-32 Ser-97 and Alteration of Its Cytonuclear Distribution. J. Biol. Chem. 2017, 292, 1462–1476. [Google Scholar] [CrossRef] [Green Version]
  9. Takahashi, A.; Chung, J.-R.; Zhang, S.; Zhang, H.; Grossman, Y.; Aleyasin, H.; Flanigan, M.E.; Pfau, M.L.; Menard, C.; Dumitriu, D.; et al. Establishment of a repeated social defeat stress model in female mice. Sci. Rep. 2017, 7, 12838. [Google Scholar] [CrossRef] [Green Version]
  10. Yapo, C.; Nair, A.G.; Clement, L.; Castro, L.R.; Kotaleski, J.H.; Vincent, P. Detection of phasic dopamine by D1 and D2 striatal medium spiny neurons. J. Physiol. 2017, 595, 7451–7475. [Google Scholar] [CrossRef] [Green Version]
  11. Babenko, V.N.; Galyamina, A.G.; Rogozin, I.B.; Smagin, D.A.; Kudryavtseva, N.N. Dopamine response gene pathways in dorsal striatum MSNs from a gene expression viewpoint: cAMP-mediated gene networks. BMC Neurosci. 2020, 21, 12–14. [Google Scholar] [CrossRef] [Green Version]
  12. Hikida, T.; Morita, M.; Kuroiwa, M.; Macpherson, T.; Shuto, T.; Sotogaku, N.; Niwa, M.; Sawa, A.; Nishi, A. Adolescent psychosocial stress enhances sensitization to cocaine exposure in genetically vulnerable mice. Neurosci. Res. 2020, 151, 38–45. [Google Scholar] [CrossRef]
  13. Ophuis, R.J.A.O.; Boender, A.J.; Van Rozen, A.J.; Adan, R.A.H. Cannabinoid, melanocortin and opioid receptor expression on DRD1 and DRD2 subpopulations in rat striatum. Front. Neuroanat. 2014, 8, 14. [Google Scholar] [CrossRef] [Green Version]
  14. Bazov, I.; Sarkisyan, D.; Kononenko, O.; Watanabe, H.; Yakovleva, T.; Hansson, A.C.; Sommer, W.H.; Spanagel, R.; Bakalkin, G. Dynorphin and κ-Opioid Receptor Dysregulation in the Dopaminergic Reward System of Human Alcoholics. Mol. Neurobiol. 2018, 55, 7049–7061. [Google Scholar] [CrossRef] [Green Version]
  15. Gipson, C.D.; Kupchik, Y.M.; Kalivas, P.W. Rapid, transient synaptic plasticity in addiction. Neuropharmacology 2014, 76, 276–328. [Google Scholar] [CrossRef] [PubMed] [Green Version]
  16. Spiga, S.; Mulas, G.; Piras, F.; Diana, M. The “addicted” spine. Front. Neuroanat. 2014, 8, 110. [Google Scholar] [CrossRef] [PubMed] [Green Version]
  17. Hotulainen, P.; Hoogenraad, C.C. Actin in dendritic spines: Connecting dynamics to function. J. Cell Biol. 2010, 189, 619–629. [Google Scholar] [CrossRef] [PubMed] [Green Version]
  18. Spijker, S.; Houtzager, S.W.J.; de Gunst, M.C.M.; de Boer, W.P.H.; Schoffelmeer, A.N.M.; Smit, A.B. Morphine exposure and abstinence define specific stages of gene expression in the rat nucleus accumbens. FASEB J. 2004, 18, 848–850. [Google Scholar] [CrossRef]
  19. Russo, S.J.; Dietz, D.; Dumitriu, D.; Morrison, J.H.; Malenka, R.C.; Nestler, E.J. The addicted synapse: Mechanisms of synaptic and structural plasticity in nucleus accumbens. Trends Neurosci. 2010, 33, 267–276. [Google Scholar] [CrossRef] [Green Version]
  20. Chung, W.-S.; Clarke, L.E.; Wang, G.X.; Stafford, B.K.; Sher, A.; Chakraborty, C.; Joung, J.; Foo, L.C.; Thompson, A.; Chen, C.; et al. Astrocytes mediate synapse elimination through MEGF10 and MERTK pathways. Nature 2013, 504, 394–400. [Google Scholar] [CrossRef] [PubMed] [Green Version]
  21. Thompson, B.L.; Oscar-Berman, M.; Kaplan, G.B. Opioid-induced structural and functional plasticity of medium-spiny neurons in the nucleus accumbens. Neurosci. Biobehav. Rev. 2021, 120, 417–430. [Google Scholar] [CrossRef]
  22. Robinson, T.E.; Berridge, K.C. Addiction. Annu. Rev. Psychol. 2003, 54, 25–53. [Google Scholar] [CrossRef]
  23. Kudryavtseva, N.N.; Smagin, D.; Kovalenko, I.L.; Vishnivetskaya, G.B. Repeated positive fighting experience in male inbred mice. Nat. Protoc. 2014, 9, 2705–2717. [Google Scholar] [CrossRef]
  24. Kudryavtseva, N.N. The sensory contact model for the study of aggressive and submissive behaviors in male mice. Aggress. Behav. 1991, 17, 285–291. [Google Scholar] [CrossRef]
  25. The Allen Mouse Brain Atlas. Available online: http://mouse.brain-map.org/static/atlas (accessed on 24 April 2021).
  26. Bolger, A.M.; Lohse, M.; Usadel, B. Trimmomatic: A flexible trimmer for Illumina sequence data. Bioinformatics 2014, 30, 2114–2120. [Google Scholar] [CrossRef] [Green Version]
  27. Dobin, A.; Gingeras, T.R. Mapping RNA-seq Reads with STAR. Curr. Protoc. Bioinform. 2015, 51, 11.14.1–11.14.19. [Google Scholar] [CrossRef] [PubMed] [Green Version]
  28. Trapnell, C.; Williams, B.A.; Pertea, G.; Mortazavi, A.; Kwan, G.; Van Baren, M.J.; Salzberg, S.L.; Wold, B.J.; Pachter, L. Transcript assembly and quantification by RNA-Seq reveals unannotated transcripts and isoform switching during cell differentiation. Nat. Biotechnol. 2010, 28, 511–515. [Google Scholar] [CrossRef] [Green Version]
  29. Castañeda, T.R.; de Prado, B.M.; Prieto, D.; Mora, F. Circadian rhythms of dopamine, glutamate and GABA in the striatum and nucleus accumbens of the awake rat: Modulation by light. J. Pineal Res. 2004, 36, 177–185. [Google Scholar] [CrossRef] [Green Version]
  30. Ogura, H.; Aruga, J.; Mikoshiba, K. Behavioral Abnormalities of Zic1 and Zic2 Mutant Mice: Implications as Models for Human Neurological Disorders. Behav. Genet. 2001, 31, 317–324. [Google Scholar] [CrossRef] [PubMed]
  31. Maruotti, N.; Corrado, A.; Neve, A.; Cantatore, F.P. Systemic effects of Wnt signaling. J. Cell. Physiol. 2013, 228, 1428–1432. [Google Scholar] [CrossRef]
  32. Lashgari, N.-A.; Roudsari, N.M.; Momtaz, S.; Sathyapalan, T.; Abdolghaffari, A.H.; Sahebkar, A. The involvement of JAK/STAT signaling pathway in the treatment of Parkinson’s disease. J. Neuroimmunol. 2021, 361, 577758. [Google Scholar] [CrossRef] [PubMed]
  33. Yao, W.-D.; Gainetdinov, R.; Arbuckle, M.I.; Sotnikova, T.D.; Cyr, M.; Beaulieu, J.-M.; Torres, G.E.; Grant, S.; Caron, M.G. Identification of PSD-95 as a Regulator of Dopamine-Mediated Synaptic and Behavioral Plasticity. Neuron 2004, 41, 625–638. [Google Scholar] [CrossRef] [Green Version]
  34. Zhang, J.; Xu, T.-X.; Hallett, P.J.; Watanabe, M.; Grant, S.G.N.; Isacson, O.; Yao, W.-D. PSD-95 Uncouples Dopamine-Glutamate Interaction in the D1/PSD-95/NMDA Receptor Complex. J. Neurosci. 2009, 29, 2948–2960. [Google Scholar] [CrossRef]
  35. Zhang, J.; Saur, T.; Duke, A.N.; Grant, S.G.N.; Platt, N.M.; Rowlett, J.K.; Isacson, O.; Yao, W.-D. Motor impairments, striatal degeneration, and altered dopamine-glutamate interplay in mice lacking PSD-95. J. Neurogenet. 2014, 28, 98–111. [Google Scholar] [CrossRef] [PubMed] [Green Version]
  36. Ökvist, A.; Fagergren, P.; Whittard, J.; Garcia-Osta, A.; Drakenberg, K.; Horvath, M.C.; Schmidt, C.J.; Keller, E.; Bannon, M.J.; Hurd, Y.L. Dysregulated postsynaptic density and endocytic zone in the amygdala of human heroin and cocaine abusers. Biol. Psychiatry 2011, 69, 245–252. [Google Scholar] [CrossRef] [PubMed] [Green Version]
  37. Xu, F.; Guan, Y.; Ma, Y.; Xue, L.; Zhang, P.; Yang, X.; Chong, T. Bioinformatic analyses and experimental validation of the role of m6A RNA methylation regulators in progression and prognosis of adrenocortical carcinoma. Aging 2021, 13, 11919–11941. [Google Scholar] [CrossRef] [PubMed]
  38. Just, L.; Olenik, C.; Meyer, D.K. Glial Expression of the Proenkephalin Gene in Slice Cultures of the Subventricular Zone. J. Mol. Neurosci. 1998, 11, 57–66. [Google Scholar] [CrossRef]
  39. Cingolani, L.A.; Goda, Y. Actin in action: The interplay between the actin cytoskeleton and synaptic efficacy. Nat. Rev. Neurosci. 2008, 9, 344–356. [Google Scholar] [CrossRef]
  40. Roy, K.; Bhattacharyya, P.; Deb, I. Naloxone precipitated morphine withdrawal and clock genes expression in striatum: A comparative study in three different protocols for the development of morphine dependence. Neurosci. Lett. 2018, 685, 24–29. [Google Scholar] [CrossRef]
  41. Kim, M.; Custodio, R.J.; Botanas, C.J.; De La Peña, J.B.; Sayson, L.V.; Abiero, A.; Ryoo, Z.Y.; Cheong, J.H.; Kim, H.J. The circadian gene, Per2, influences methamphetamine sensitization and reward through the dopaminergic system in the striatum of mice. Addict. Biol. 2019, 24, 946–957. [Google Scholar] [CrossRef] [PubMed]
  42. Perreau-Lenz, S.; Sanchis-Segura, C.; Leonardi-Essmann, F.; Schneider, M.; Spanagel, R. Development of morphine-induced tolerance and withdrawal: Involvement of the clock gene mPer2. Eur. Neuropsychopharmacol. 2010, 20, 509–517. [Google Scholar] [CrossRef]
  43. Piechota, M.; Korostynski, M.; Sikora, M.; Golda, S.; Dzbek, J.; Przewlocki, R. Common transcriptional effects in the mouse striatum following chronic treatment with heroin and methamphetamine. Genes Brain Behav. 2012, 11, 404–414. [Google Scholar] [CrossRef] [PubMed]
  44. Roy, K.; Maji, D.; Deb, I. Increase of Cry 1 expression is a common phenomenon of the disturbed circadian clock in ischemic stroke and opioid addiction. Biochem. Biophys. Res. Commun. 2021, 558, 8–13. [Google Scholar] [CrossRef]
  45. Tamura, E.K.; Oliveira-Silva, K.S.; Ferreira-Moraes, F.A.; Marinho, E.A.; Guerrero-Vargas, N.N. Circadian rhythms and substance use disorders: A bidirectional relationship. Pharmacol. Biochem. Behav. 2021, 201, 173105. [Google Scholar] [CrossRef] [PubMed]
  46. Zhang, P.; Moye, L.S.; Southey, B.R.; Dripps, I.; Sweedler, J.V.; Pradhan, A.; Rodriguez-Zas, S.L. Opioid-Induced Hyperalgesia Is Associated with Dysregulation of Circadian Rhythm and Adaptive Immune Pathways in the Mouse Trigeminal Ganglia and Nucleus Accumbens. Mol. Neurobiol. 2019, 56, 7929–7949. [Google Scholar] [CrossRef] [PubMed]
  47. Tordjman, S.; Carlier, M.; Cohen, D.; Cesselin, F.; Bourgoin, S.; Colas-Linhart, N.; Petiet, A.; Perez-Diaz, F.; Hamon, M.; Roubertoux, P.L. Aggression and the three opioid families (endorphins, enkephalins, and dynorphins) in mice. Behav. Genet. 2003, 33, 529–536. [Google Scholar] [CrossRef]
Figure 1. Timescale of experiments. A20—mice with 20 days of consecutive wins in daily agonistic interactions; AD—A20 mice after subsequent 14 days of fight deprivation; Control—mice without agonistic interactions.
Genes 13 00021 g001
Figure 2. PCA biplot outlines distinct alteration of TF programs (3 DEG clusters) between AD (blue), A20 (red) and control (green) groups. Green shaded area is control group.
Genes 13 00021 g002
Figure 3. GO annotation of 12 TFs split into three corresponding clusters (AC) (Figure 2). Overall PPI enrichment p-value (7 edges vs. 1 exp): 5.23 × 10⁻⁶. Green shaded area (A) is a control-group-associated cluster (Figure 2). Color coding: yellow—KW-0010: activator, 7 genes; FDR < 2.4 × 10⁻⁶; red—central nervous system projection neuron axonogenesis; 2 genes; FDR < 0.03; pink—GO:0035257; nuclear hormone receptor binding; 3 genes; FDR < 0.015; blue—GO:0071376 cellular response to corticotropin-releasing hormone stimulus; 2 genes; FDR < 0.0024; green—behavioral abnormalities of Zic1 and Zic2 mutant mice; PMID: 11699604. The image was created with the string-db.org service.
Genes 13 00021 g003
Figure 4. Eleven connected co-varied genes spanning 5 DEGs (Egr1, Etv5, Fosl2, Nr4a1, Nr4a2) presented in Figure 3A. GO color coding corresponds to the plot above (gene numbers attached to bars). The DEGs in this set feature control group and are decreased in AD and A20 groups (Figure 2).
Genes 13 00021 g004
Figure 5. Eight circadian rhythm genes subset expanded from Arntl DEG and annotated by string-db suite (Figure 3A).
Genes 13 00021 g005
Figure 6. Circadian rhythm TF set (8 genes; Figure 5) PCA biplot featuring a control-group-associated Arntl DEG (Figure 3A) along with experimentally confirmed (string-db) connected genes Npas2, Clock (green shaded area) that are attenuated in affected species due to repressive action of cAMP-associated Per1 expression in aggressive mice. H0: random distribution of species across plot’s 2 halves: p < 0.0024; binomial test. Each gene statistically significantly correlates with at least 2 other genes (p < 0.05) except for Clock (Table 2). Curved arrow depicts group-related sequential gene expression dynamics cycle: C->A20->AD->C. Underlined gene names indicate DEGs in any of the 3-way comparisons. Enlarged underlined genes feature differential expression in 2 comparisons: Arntl (C_AD, C_A20); Per2 (AD_A20, C_A20).
Genes 13 00021 g006
Figure 7. Twenty-seven genes recovered by string-db.org as Zic1/2-associated TF network and associated with AD subgroup (Figure 2 and Figure 3B). Armadillo (Ctnnb1) gene (catenin β 1) is the most connected gene in the center. GO color coding is assigned as in histogram plot above (number of genes is attached as bar labels therein).
Genes 13 00021 g007
Figure 8. PCA plot of 27 genes from Figure 7 gene network of AD-specific Wnt-associated (Ctnnb1, Prkcd, Fzd8, Fzd9; [31]) TF program; see also Figure 2 and Figure 3. Bold underlined gene names indicate 9 DEGs within this network.
Genes 13 00021 g008
Figure 9. Neighborhood recovery of Zeb2 neighborhood inferred by string-db.org resource (11 genes) implies “repression of transcription” GO function of genes set. All but one (Arhgap) genes are transcriptional repressors; 8 genes belong to nucleus compartment (TFs); 4 genes (Cdh1, Cdh2, Ctbp1, Ctbp2) are associated with glutamatergic synapse.
Genes 13 00021 g009
Figure 10. Total of 1009 DEGs across AD and A20 groups. A20 group maintained around 170 increased DEGs, while 839 DEGs featured attenuated expression in the A20 DS.
Genes 13 00021 g010
Figure 11. (a) “Semaphorin-plexin signaling” GO DEG set (4 genes); H0: random distribution of samples across 2 plot halves, p-value < 0.00065 (binomial test); (b) JAK/STAT gene projection inferred from string-db.org seeded by Jak2, Irs1 DEGs; H0: random distribution of samples across 2 plot halves, p-value < 0.0045 (binomial test). Underlined gene names signify DEGs. Encircled is A20 group.
Genes 13 00021 g011
Figure 12. RNA-binding DEG subcluster within 149 cAMP-mediated positive A20 DEG cluster (Figure 10). Drd1 included, underlining significant correlation with these DEGs. Per2, Rbm15 are known transcriptional repressors (see the text). H0: random distribution of samples across 2 plot halves, p-value < 0.0045 (binomial test). Underlined gene names signify DEGs.
Genes 13 00021 g012
Figure 13. PCA plot based on 33 specific cAMP-mediated balanced gene subset compiled in (Babenko et al., 2020) featuring A20 and AD groups. Marker gene set is shown in bold. Blue-shaded arrow signifies dopamine vs. glutamate uptake gradient. Yellow-shaded arrow signifies D1 passive/active states phasing [11]. Blue-shaded oval underlines opioid synthesis (Penk, Pdyn). H0: random distribution of 5-fold AD sample with only 1 alien species in a plot; left half is p-value < 0.016 (binomial distribution). Blue dots are AD samples; dark blue dots are aggressive samples. Underlined gene names indicate DEGs.
Genes 13 00021 g013
Figure 14. FPKM values of 5 dopamine- and opioid-specific genes across 18 samples.
Genes 13 00021 g014
Figure 15. Flowchart of DEG inferred events from aggressive to control groups.
Genes 13 00021 g015
Table 1. Three-way comparisons outline based on CuffDiff [26] DEG detection.
Number of DEGs (FDR < 0.05)Number of Non-Zero Expressed Gene Pairs
Control vs. A20103024,321
Control vs. AD6223,924
A20 vs. AD100923,763
Table 2. Pearson pairwise correlation matrix; df = 17.
VariablesNr1d1Cry2Per1Npas2ArntlCry1ClockPer2
Nr1d110.6030.312−0.247−0.620−0.288−0.3050.025
Cry20.60310.656−0.087−0.3920.179−0.1380.447
Per10.3120.6561−0.226−0.4740.2970.1260.669
Npas2−0.247−0.087−0.22610.5520.5100.2230.065
Arntl−0.620−0.392−0.4740.55210.3250.369−0.067
Cry1−0.2880.1790.2970.5100.32510.3230.786
Clock−0.305−0.1380.1260.2230.3690.32310.274
Per20.0250.4470.6690.065–0.0670.7860.2741
Values in bold are different from 0 with a significance level α = 0.05.
Table 3. Abbreviated gene families and #DEGs per family. The majority represent synaptic-associated genes and ion transporters (Slc). (See Table S4 for expanded info.) q_value = 1.35 × 10⁻³ is the minimal value throughout the transcriptome of 23 thousand genes signifying the maximal accuracy threshold (virtually zero) defined by a multiple-comparisons correction value.
FamilyMin (q_Value)Max (q_Value)Stddev (q_Value)# DEGs per Family
Slc1.35 × 10−33.63 × 10−21.05 × 10−229
Kcn1.35 × 10−34.92 × 10−21.31 × 10−222
Tme1.35 × 10−34.88 × 10−21.50 × 10−217
Zfp1.35 × 10−34.97 × 10−21.38 × 10−215
Col1.35 × 10−34.39 × 10−21.28 × 10−210
Arh1.35 × 10−34.88 × 10−21.66 × 10−28
Ptp1.35 × 10−32.59 × 10−21.04 × 10−27
Map1.35 × 10−32.31 × 10−27.40 × 10−37
Gpr1.35 × 10−32.10 × 10−27.21 × 10−37
Kif1.35 × 10−32.24 × 10−27.86 × 10−36
Cac1.35 × 10−34.56 × 10−21.89 × 10−26
Tri1.35 × 10−33.10 × 10−21.30 × 10−26
Ank1.35 × 10−34.56 × 10−21.51 × 10−26
Fam1.35 × 10−31.37 × 10−24.58 × 10−36
Cdk1.35 × 10−34.45 × 10−21.72 × 10−25
Rgs1.35 × 10−34.67 × 10−21.57 × 10−25
Prr1.35 × 10−33.76 × 10−21.38 × 10−25
Aka1.35 × 10−32.51 × 10−29.33 × 10−35
Ple1.35 × 10−34.78 × 10−21.94 × 10−25
Cep1.35 × 10−34.63 × 10−31.28 × 10−35
Adc1.35 × 10−34.63 × 10−31.39 × 10−35
Doc1.35 × 10−39.39 × 10−33.13 × 10−35
Table 4. Pearson pairwise correlation coefficients of key DS-specific genes’ expression profiles across samples (df = 17).
VariablesDarpp-32PenkDrd2Drd1Pdyn
Darpp-3210.8580.9140.8630.723
Penk0.85810.9250.8380.867
Drd20.9140.92510.8860.777
Drd10.8630.8380.88610.717
Pdyn0.7230.8670.7770.7171
Values in bold are different from 0 with a significance level α = 1 × 10⁻⁷.
Publisher’s Note: MDPI stays neutral with regard to jurisdictional claims in published maps and institutional affiliations.

