Article

Molecular and Physiological Evaluation of Bread Wheat (Triticum aestivum L.) Genotypes for Stay Green under Drought Stress

1
College of Bioscience and Biotechnology, Yangzhou University, Yangzhou 225009, China
2
Department of Botany, Hazara University, Mansehra 21120, Pakistan
3
Center for Plant Sciences and Biodiversity, University of Swat, Charbagh 19120, Pakistan
4
Department of Chemistry, College of Science, Princess Nourah Bint Abdulrahman University, Riyadh 11671, Saudi Arabia
5
Biology Department, College of Science, Taibah University, Al-Madinah Al-Munawarah 42353, Saudi Arabia
6
Botany Department, Faculty of Science, Ain Shams University, Cairo 11566, Egypt
7
Department of Biotechnology and Genetic Engineering, Hazara University, Mansehra 21120, Pakistan
8
Land Resources Research Institute, National Agricultural Research Centre, Islamabad 45500, Pakistan
9
Department of Biochemistry, PMAS Arid Agriculture University, Rawalpindi 46000, Pakistan
10
Department of Biological Sciences, International Islamic University, Islamabad 44000, Pakistan
11
Department of Genetics and Development, Irving Medical Center, Columbia University, New York, NY 10032, USA
*
Authors to whom correspondence should be addressed.
Genes 2022, 13(12), 2261; https://doi.org/10.3390/genes13122261
Submission received: 6 November 2022 / Revised: 24 November 2022 / Accepted: 24 November 2022 / Published: 30 November 2022
(This article belongs to the Section Plant Genetics and Genomics)

Abstract

:
Water availability is considered as the main limiting factor of wheat growth illuminating the need of cultivars best adapted to drought situations for better wheat production and yield. Among these, the stay-green trait is thought to be related to the ability of wheat plants to maintain photosynthesis and CO2 assimilation, and a detailed molecular understanding of this trait may help in the selection of high-yielding, drought-tolerant wheats. The current study, therefore, evaluated the physiological responses of the selected wheat genotypes under pot-induced water stress conditions through different field capacities. The study also focused on exploring the molecular mechanisms involved in drought tolerance conferred due to the stay-green trait by studying the expression pattern of the selected PSI-associated light-harvesting complex I (LHC1) and PSII-associated LHCII gene families related to pigment-binding proteins. The results revealed that the studied traits, including relative water content, membrane stability index and chlorophyll, were variably and negatively affected, while the proline content was positively enhanced in the studied wheats under water stress treatments. Molecular diagnosis of the selected wheat genotypes using the expression profile of 06 genes, viz. TaLhca1, TaLhca2, TaLhca3, TaLhcb1, TaLhcb4 and TaLhcb6 that encodes for the LHCI and LHCII proteins, indicated variable responses to different levels of drought stress. The results obtained showed the relation between the genotypes and the severity of the drought stress condition. Among the studied genotypes, Chirya-1 and SD-28 performed well with a higher level of gene expression under drought stress conditions and may be used in genetic crosses to enrich the genetic background of common wheat against drought stress.

1. Introduction

Wheat (Triticum aestivum L.) is a major cereal crop and an integral part of daily diet in different geographic regions of the world [1]. In the past three decades, unpredictable climatic conditions have resulted in stagnated wheat production. Wheat yield and quality are highly impacted by multiple factors including cultivar types and abiotic stresses such as high temperature, drought stress etc., [2,3,4]. About 37% of the semiarid area belongs to developing countries, where available moisture is primarily used for wheat cultivation [5]. Drought or water stress can be defined as the shortage of adequate moisture needed for normal growth of a plant growth and complete life cycle [6]. It is a major environmental stress, which can affect growth of cereal crops and decrease the production and performance of the plant [7,8,9]. It is considered a big hazard for sustainable agriculture and is becoming a worldwide trouble [10,11,12,13]. A significant rise in drought stress conditions has enforced us to develop climate-resilient, high-yielding genotypes; hence, there is a need to acquire a better understanding of the responses to drought by exploiting the key physiological and molecular traits [14,15,16]. Further, it has been estimated that wheat yield can be increased by 25% through the development of abiotic and biotic stress-tolerant cultivars [17,18,19,20,21].
The term “stay green” is mostly used for mutants with decreased chlorophyll catabolism [22]. The capacity of certain genotypes in several annual crop species including wheat to maintain green leaves during the grain-filling period (the “stay-green” phenotype, SG) is an intriguing crop feature, especially under drought stress conditions. It is considered an important trait that allows plants to retain their leaves in active photosynthetic state when subjected to stress conditions [2,11,23,24]. Direct evidence for the contribution of this trait to high-yield potential is lacking. Therefore, a greater understanding of this trait is needed to explore possible selection of SG because it is expected to have a significant role in the productivity of wheat, particularly under harsh environments [25,26].
Two main types of chlorophyll are present in higher plants, Chlorophyll a and b, where the former is a part of all chlorophyll–protein complexes, whereas the later is confined only in PSI-associated light-harvesting complex I (LHCI) and PSII-associated LHCII. Light-harvesting complexes I and II are present in thylakoid membranes and their function is energy production and transfer. LHCII is mostly present in grana and, due to intermolecular forces, its main function is the formation and maintenance of grana stacks [27,28,29]. The Lhca and Lhcb gene families encoded the apoproteins of light-harvesting complex I and II, respectively. The Lhca1Lhca4 genes formed the protein of LHCI, which are associated with PSI. The Lhcb1, Lhcb2, and Lhcb3 genes code the polypeptides of trimeric LHCII. The Lhcb4, Lhcb5, and Lhcb6 proteins (also known as CP29, CP26, and CP24,) are proposed to be monomeric proteins, which are found one set per PSII unit [30]. The Lhca and Lhcb genes expression and LHCI and LHCII stability are very important to keep the photosynthetic process at high level [31,32,33]. The present study aimed to explore the interaction of drought stress with stay-green expression through the physiological responses in wheat genotypes. Molecular characterization through changes from transcription and translation of genes encoding major functional proteins to PSI and PSII under progressive water stress was also focused.

2. Methods and Materials

2.1. Greenhouse Experiment

The experimental plant materials comprised two conventional wheats, i.e., Opata and Chirya-1, and two synthetic derivatives i.e., SD-28 and SD-32 having Aegilops squarrosa in its pedigree (ESM 1). Opata is a relatively non-stay-green, drought-susceptible wheat variety; SD-28 and SD-32 are moderately stay-green drought-tolerant wheat genotypes, while Chirya-1 is a stay-green, drought-tolerant wheat cultivar. The selection was based on a 2-year, detailed characterization of a focus collection of 325 diverse bread wheats for water stress effects on stay green and chlorophyll fluorescence, with a focus on its yield characteristics for two years (data unpublished). A pot experiment was conducted under greenhouse conditions with temperatures from 10 °C to 15 °C and 13 to 14 h light duration, to assess the effect of progressive drought stress, including control (100%), moderate stress (80%) and severe stress (60% field capacity i.e., FC). Field soil, sand and peat compost were mixed in equal proportion and filled in 36 pots at the rate of 1835 g in each pot. Nine pots were used for each wheat genotype replicated three times with three different field capacities (i.e., three pots per treatment arranged in randomized complete block design). The pots were tapped on the floor enough to bring the soil mixture to a uniform height to achieve the soil bulk density (SBD) and the corresponding total soil porosity (TSP).
The height of the soil mixture in each pot required to achieve the desired SBD was calculated according to Jiang et al. [34] by following formula.
Height   ( cm ) = VSM   ( cm 3 ) π × Diameter   of   pot   ( cm ) 2 2
where VSM (volume of soil mixture) was calculated by the following formula:
VSM   ( cm 3 ) = Mass   of   soil   mixture   taken   in   each   pot   ( g ) Desired   SBD   ( g   cm 3 )
The pots were irrigated to saturate all the pore space of the soil mixture and kept aside for drying. The volume of water (VW) required for saturating the soil mixture in the pots was calculated by the formula
VM   ( cm 3 ) = TSP   ( cm 3   cm 3 )   ×   VSM   ( cm 3 )
where
TSP   ( cm 3   cm 3 ) = SBD   ( g   cm 3 ) SPD   ( g   cm 3 )
The volumetric soil water content (VSWC) was monitored daily from each pot with a Time Domain Reflectometer (TRIME –FM-IMKO Micromodultechnik GmbH, Ettlingen, Germany), and the seeds were sown in the pots when the VSWC was at FC (assuming FC as 50% of the saturation and taking saturation = TSP).
VSWC   at   100 %   FC   ( cm 3   cm 3 ) = TSP   ( cm 3   ncm 3 ×   50 ) 100
Similarly, the VSWC at other drought levels was calculated with their respective formulae according to Zhang et al. [35].
VSWC   at   80 %   FC   ( cm 3   cm 3 ) = TSP   ( cm 3   ncm 3 ×   40 ) 100
VSWC   at   60 %   FC   ( cm 3   cm 3 ) = TSP   ( cm 3   ncm 3 ×   30 ) 100
After germination, three seedlings were raised per pot, for which the VSWC was monitored and maintained daily at 100% FC for three weeks. The VW required for maintaining each pot at FC was calculated by the formula:
VW (cm3) = (VSWC at 100% FC (cm3 cm−3) − VSWC from TDR (cm3 cm−3)) × VSM (cm3)
When wheat seedlings were 21 d old, the irrigation supply was cut off from the pots to which the drought treatment was applied, and the VSWC was monitored daily until the respective drought level was achieved.
VW (cm3) = (VSWC at 80% FC (cm3 cm−3) − VSWC from TDR (cm3 cm−3)) × VSM (cm3)
VW (cm3) = (VSWC at 60% FC (cm3 cm−3) − VSWC from TDR (cm3 cm−3)) × VSM (cm3)
The drought stress was maintained for 30 d till visible wilting in plants grown at 60% FC, after which the uppermost, fully expanded three-leave sample per plant from all pots was collected for further physiological and molecular investigation.

2.2. Physiological Characterization

The studied physiological traits included the leaf relative water content [36], the leaf chlorophyll content [37], the leaf membrane stability index [38] and the proline content determination [39]. The stay-green trait was measured following the method of Xu et al. [40] and Silva et al. [41] by scoring on a 1–5 scale, based on the percentage area of the normal-sized leaves that had senesced and died early.

2.3. Molecular Characterization of Wheat Genotypes

The genes related to the pigment-binding proteins were selected to examine the different expressions in the four genotypes of wheat that were grown under progressive drought stress including control (100%), moderate stress (80%) and severe stress (60% field capacity. A total of six genes were studied and the specific primers for genes encoding LHCI and LHCII were designed based on the published expressed sequence tags. These included:
  • ACCGCCAGCTCTTCCACCCT (Tubulin-F); TCACTGGGGCATAGGAGGAA ((Tubulin-R);
  • TCAGCGACCTCACCGTCA (TaLhcb6-F); CCCCAAAGAAGTCACGGACA (TaLhcb6-R);
  • AAAGGCCGAGGAGGACAA (TaLhcb4-F); CCACCGACCACTTAAGAGG (TaLhcb4-R);
  • GGAGAACACACAATACACC (TaLhcb1-F); CCCATTATGTGTGCAGTTC (TaLhcb1-R);
  • CCTCACCAGCCTCAAGTTCC (TaLhca3-F); CGCACGCTCACGTTTCC (TaLhca3- R);
  • CCCCAACCGCAAGAACC (TaLhca2-F); CCGACGAAGGCGAGCAT (TaLhca2-R);
  • CAACCTGCCGACCATCCTG (TaLhca1-F) and CAGCCGCCCGTTCTTGAT (TaLhca1-R).

2.3.1. Total RNA Extraction and cDNA Synthesis

Leaf samples were collected from each replication and immediately transferred to liquid nitrogen. The total RNA of the four wheat varieties grown under progressive drought stress including control (100%), moderate stress (80%) and severe stress (60% field capacity) was extracted in duplicate (Gene JET Plant RNA Purification Mini kit, Thermo Fisher Scientific, Waltham, MA, USA). The cDNA was synthesized using oligo dT primers (Revertaid reverse transcription kit, Thermo Fisher Scientific, Waltham, MA, USA). Briefly, 11 uL template RNA was mixed with 1.0 µL of Oligo (dt) 18 primers (#S0132) and incubated for 5 min at 65 °C. Then, 4.0 µL of RT buffer, 1 µL Ribolock Rnase inhibitor and 1 µL of reverse transcriptase (Revert Aid) and 2 µL of dNTPs mix (#R0181) were added to the total volume of 20 µL. The mixture was centrifuged and incubated at 42 °C for 80 min. The reaction was terminated by heating at 70 °C for 5 min, and the synthesized cDNA was stored at −20–42 °C for RT–PCR analysis. The whole process of RNA extraction and cDNA synthesis was accomplished according to the extraction and cDNA synthesis discussed in Kianersi et al. [42].

2.3.2. Real-Time PCR and Data Analysis

The cDNA was amplified by real-time PCR using SYBR green dye (Thermo Fisher Scientific, Waltham, MA, USA). The specific primer sets for genes encoding LHCI (TaLhca1, TaLhca2, and TaLhca3) and LHCII (TaLhcb1, TaLhcb4, and TaLhcb6) pigment-binding proteins were designed based on the published expressed sequence tags. Amplification of the T. aestivum tubulin gene exhibiting constitutive expression was used as a reference/housekeeping gene control. Each target gene in both stressed and control plants was examined against the housekeeping gene. The amplification was carried out with a thermal profile: initial denaturation at 95 °C for 10 min followed by 35 cycles of denaturation at 95 °C for 20 s, annealing at 58 °C for 40 s and extension at 72 °C for 30 s. The data obtained from thermal cycler were analyzed by 2−∆∆Ct method [43,44]. The amplified products obtained from qRT–PCR were separated using a 1% agarose gel to confirm the size of the desired products.

2.4. Statistical Analysis

Using completely randomized design (CRD), data obtained were subjected to descriptive statistics, analysis of variance and correlation test. The analysis of treatments was performed by using STATISTIX 10 (Analytical Software, Tallahassee FL, USA) and means was compared by using Fisher’s least significant difference (p < 0.01 and 0.05).

3. Results and Discussion

3.1. Relative Water Content (RWC)

The RWC in all the studied wheats was highly different in both control and drought stress treatments. Under control conditions, the mean RWC was 94.6% while under drought stress conditions, the mean values of RWC were 73.6% and 81.9% in plants grown at 60% and 80% FC, respectively showing a relative decline of 22.1% and 13.4% in RWC as compared to control condition (Table 1). The ANOVA revealed high differences in RWC among treatments, while the studied wheats and its interaction with the treatment yielded no significant differences (Table 2). The LSD indicated differential and promising behavior among the studied wheats in response to imposed drought stress, particularly Chirya-1 exhibited the least decrease in relative water content (19.9%) at 80% FC (Table 3).

3.2. Membrane Stability Index (MSI)

The descriptive statistics of the studied attributed under water stress treatment is given in Table 1. Regarding the membrane stability index, an increasing trend was observed under moderate water stress (8.9%) which slightly decreased by 2.0% under 60% FC, in comparison to the control treatment. Further, the mean MSI in the control treatment was 55.2%, while it was 60.6 and 54.1% under the stress condition (80 and 60% FC, respectively). The results clearly indicated that the membrane stability was highly affected by drought stress. The analysis of variance also revealed a highly different MSI among the studied wheats and drought treatment (Table 2). Fischer’s LSD indicated no significant differences in the MSI under control treatment; however, under drought conditions of 80% and 60% FC, high MSI of 62.7% and 55.9% were recorded for SD-28 wheat genotype, respectively (Table 3).

3.3. Proline Contents

Descriptive statistics revealed that the mean proline content under 100% FC was 0.83 µmol/g, while it was 1.43 and 2.51% under the moderate and severe water stress treatment, respectively. Further, relatively increased PRCs of 41.9 and 66.9% were recorded under the moderate and severe stress treatment, respectively, when compared to plants grown in the control environment (Table 1). The ANOVA regarding proline content also yielded high differences among the studied wheats, water treatments and the interaction between them (Table 2). The LSD regarding the PRC also showed differential behavior in the studied wheats and water stress treatments. In comparison to the control, the relative increase in PRC of 61.6, 56.1, 72.3 and 73.35 in SD-28, SD-32, Opata and Chirya-1, respectively, was observed under the severe water stress treatment. Similarly, at 80% FC, the maximum PRC 1.67 µmol/g was recorded for stay-green Chirya-1 followed by SD-32 (Table 3). The results clearly demonstrated that water stress led to an enhanced, improved proline content and that the different wheats have different responses to various drought levels.

3.4. Chlorophyll Contents

Descriptive statistics also showed that chlorophyll content was affected by drought stress treatment. The observed mean chlorophyll a (Chla) was 1.19 mg/g under the control condition, whereas it was 1.04 and 0.54 mg/g under the moderate and severe stress treatments. Further, under moderate drought stress, the maximum Chla content of 1.09 mg/g was recorded for SD-32, while under severe drought stress (60% FC), it was 0.57 mg/g in SD 28 followed by the stay-green Chirya-1 wheat. Likewise, the mean chlorophyll b (Chlb) was 1.11 mg/g in plants grown under the control environment, while 0.56 and 0.93 mg/g were recorded under the progressive water stresses, respectively (Table 1). Under the control condition and moderate stress, the maximum Chlb (1.25 and 1.16 mg/g) was recorded for the stay-green Chirya-1 wheat, while under severe stress it was 0.58 mg/g in SD 28 followed by the stay-green Chirya-1 wheat cultivar. Similarly, mean total chlorophyll (TChl) under the control environment was recorded as 2.29 mg/g, while it was 1.97 and 1.10 mg/g under moderate and severe drought stress, respectively. The analysis of variance also yielded high differences among the studied wheats, water treatments and the interaction between them (Table 2). Fisher’s LSD depicted highly differential behaviors among the studied wheats in response to the different water treatments. In comparison to the control, the least relative decrease was observed in the SD-28 and stay-green Chirya-1 (11.6 and 12.2 %, respectively) in the moderate stress treatment. By contrast, under the severe drought stress treatment, the least relative decrease of 47.2 and 49.3% was observed in the SF-28 and SD-32 wheats, respectively. The results indicated that the stay-green Chirya-1, SD-28 and SD-32 wheats performed well under drought stress condition.

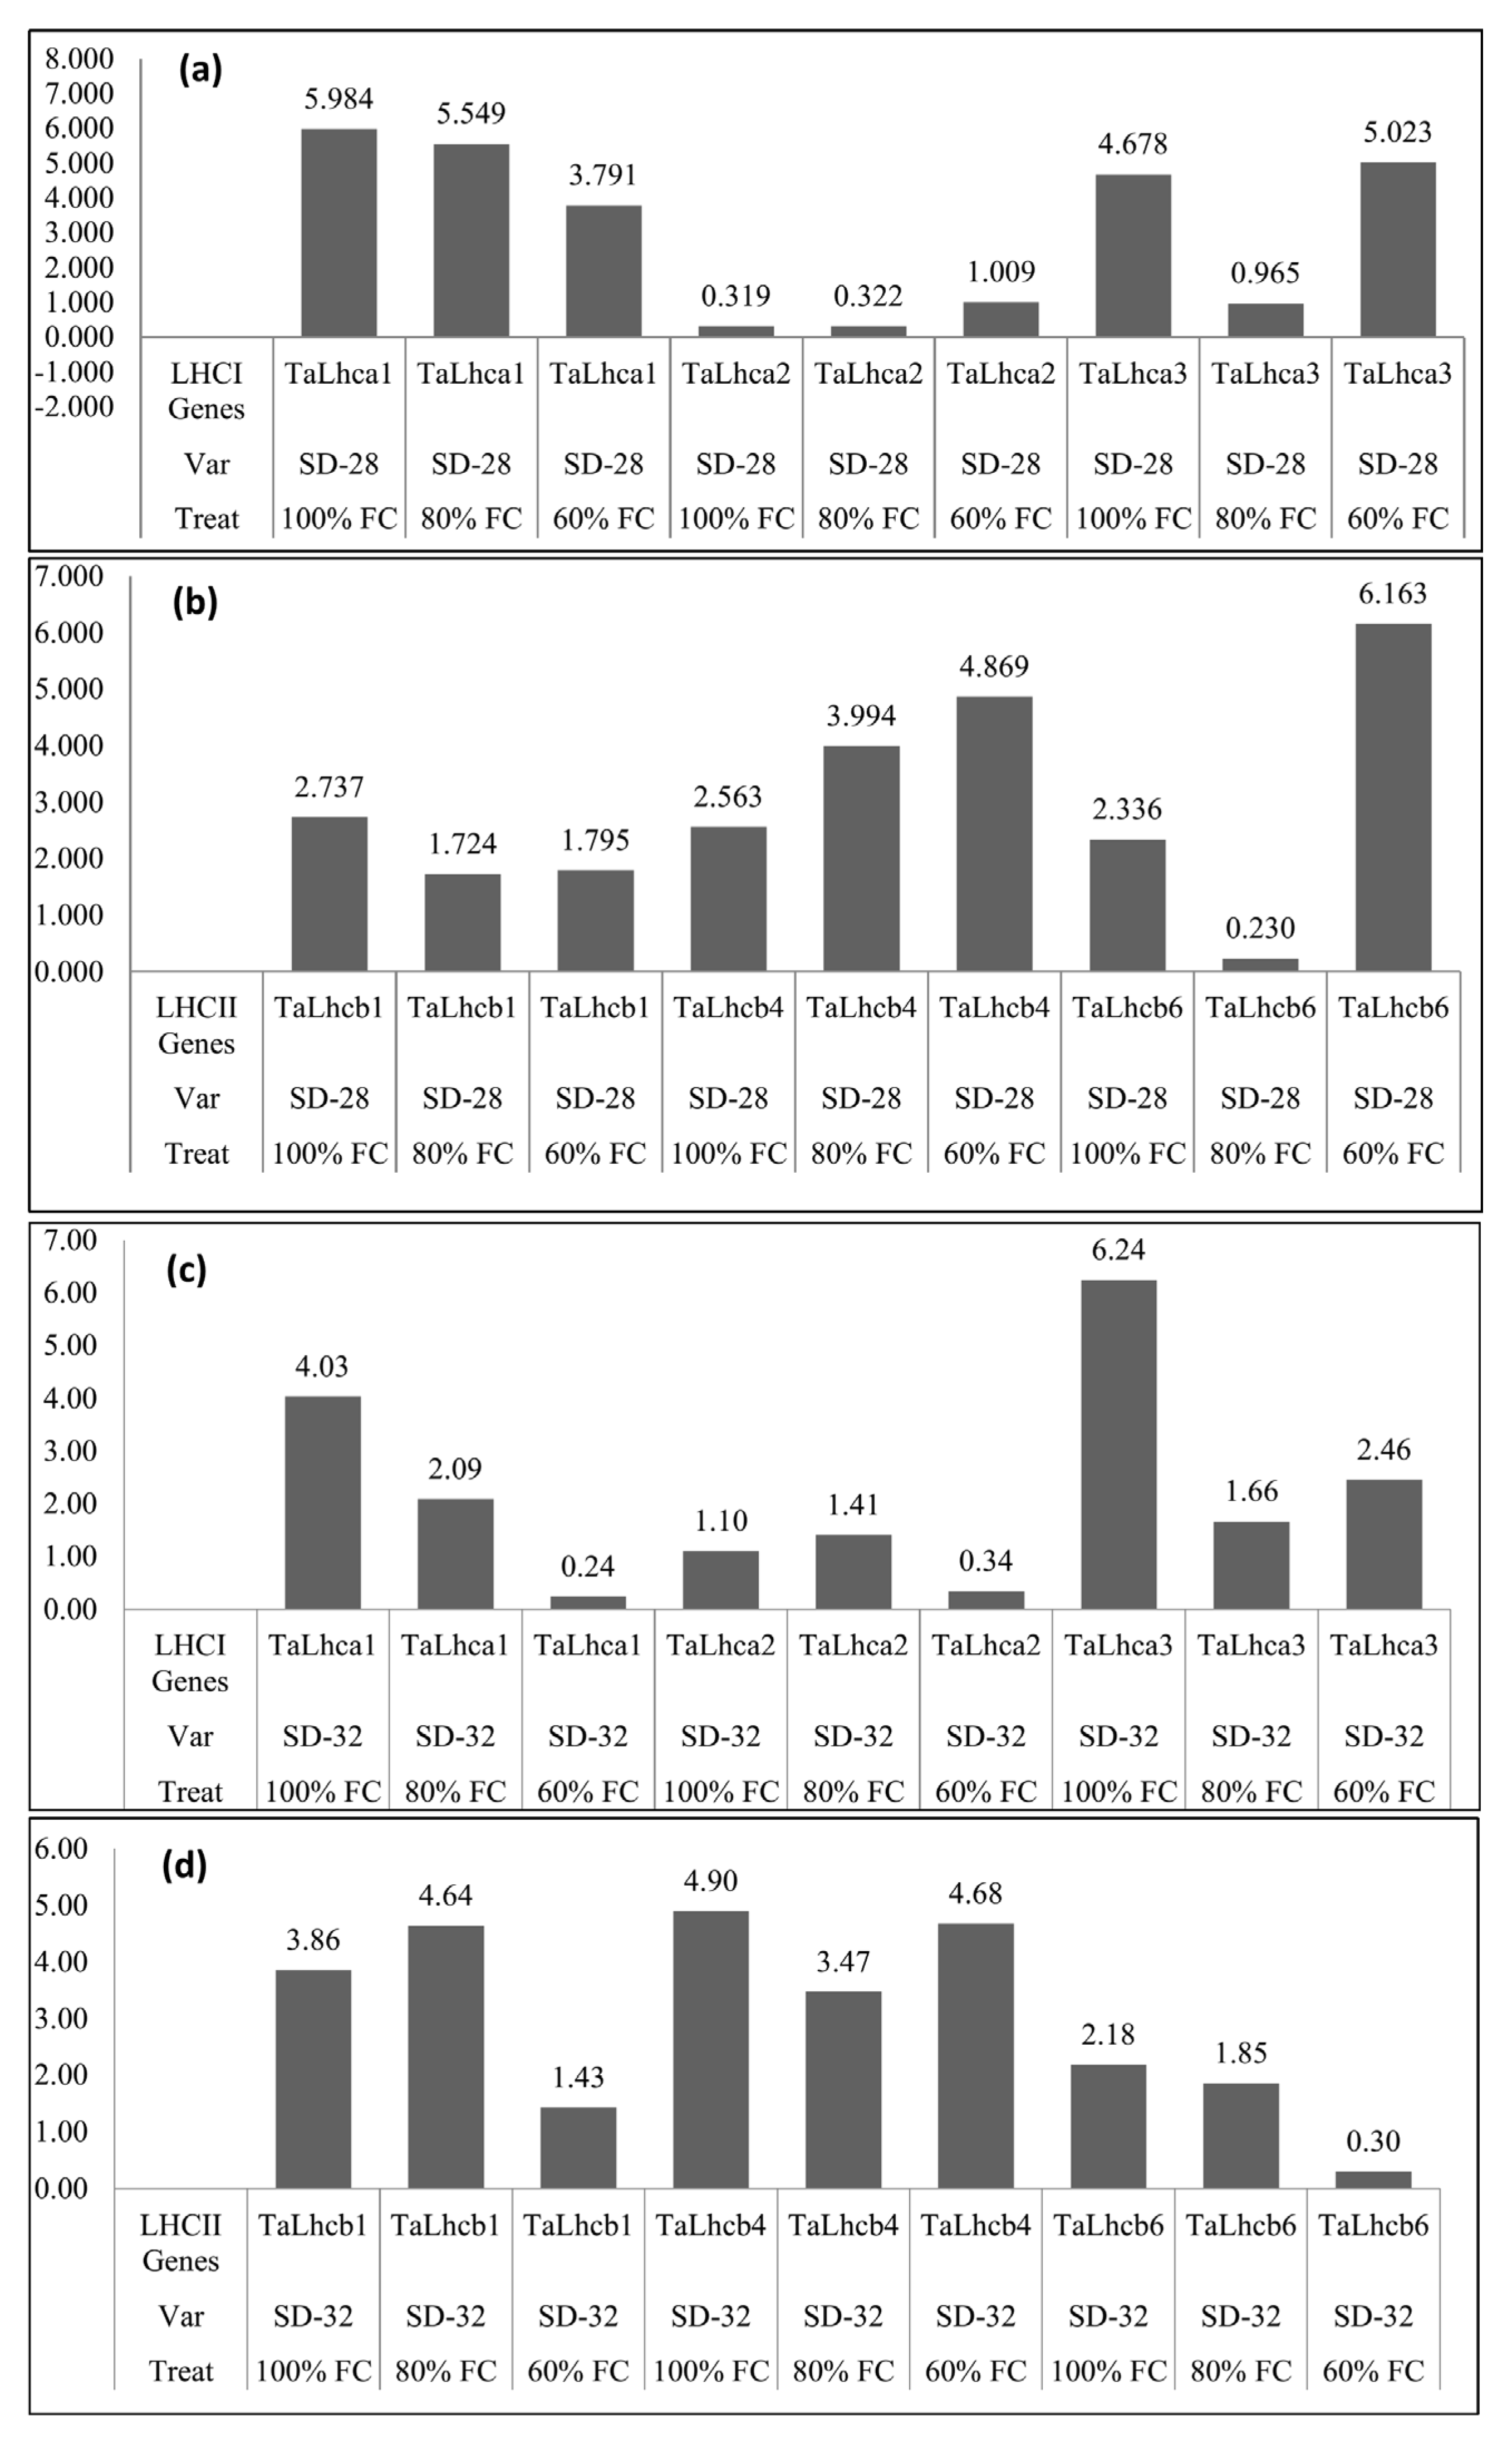
3.5. Expression Levels of Genes Involved in LHCI and LHCII in Response to Drought Stress

The six genes that are responsible for the coding pigment-binding proteins were studied to find the different transcriptional responses under the control conditions of 100% FC and the different level of drought stress condition i.e., 80% FC and 60% FC, respectively, in the two synthetic-derived wheat genotypes (SD-28 and SD-32) and the two check cultivars (Chirya-1 and Opata).
All genes showed a differential expression level in SD-28 genotype. The TaLhca1 gene showed downregulation in both 60% and 80% FC but highly suppressed in 60% FC condition, while the TaLhca2 gene showed upregulation in 60% FC but its expression in 80% FC and control plants was approximately same. TaLhca3 is downregulated in both stress conditions but exhibits a higher suppression level in 80% FC. The TaLhcb1 gene equally downregulated under both conditions. The TaLhcb4 showed upregulation in both 80% FC and 60% FC. The expression of TaLhcb6 was also upregulated under both stress conditions but the expression was higher in 60% FC. (Figure 1a,b).
In the SD-32 genotype genes, TaLhca1, TaLhca3 and TaLhcb4 showed downregulation in both 80% and 60% FC. The TaLhca2 gene was equally upregulated in both stress conditions. The gene TaLhcb1 was upregulated in 80% FC, but its downregulation was observed in 60% FC. Similarly, the gene TaLhcb6 exhibits upregulation in 80% FC but its downregulation was revealed in a variety at 60% FC (Figure 1c,d).
The expression level of genes that encode proteins for the pigment-binding molecule LHCI showed highly significant results in the SG Chirya-1 genotype. All the genes that involved in LHCI, namely TaLhca1, TaLhca2 and TaLhca3, show a higher level of expression and their expressions were not affected by drought stress condition. Similarly, the genes that involve in LHCII, namely TaLhcb1, TaLhcb4 and TaLhcb6, also show similar results such as those involved in LHCI. The expression levels of these genes were not significantly affected by drought stress conditions, which are evident from the result that the SG Chirya-1 genotype is drought resistant as compared to the Opata and synthetic-derived genotypes. The studied physiological traits also indicated that Chirya-1 performed well under drought stress condition. In the Opata, for both stress conditions only the TaLhca2 gene expression was enhanced, whereas the expression of all other genes was suppressed except for Talhcb4 in 80% FC, where its expression remains the same as in the control. In the Chirya-1 genotype, all the genes were upregulated in both stress conditions except for TaLhca1 and TaLhcb1 in 80% FC, where these genes showed downregulation (Figure 2a–d).

3.6. Discussion

The four selected wheats exhibited high differences for the studied traits under the different drought treatments. Leaf RWC indicates the ability of plants to keep their water status adequate to sustain water stress. In our results, the RWC declined during water stress in all the studied wheats under the different drought stress levels. Additionally, it has been shown that the RWC is negatively correlated with the membrane stability index, and the larger the water loss from leaves manifested by smaller the RWC, the greater will be the cell membrane damage [45,46]. Our results are consistent with the findings of Almeselmani et al. [47] and Kocheva et al. [48] that drought stress sufficiently decreases the water status, osmotic potential and nutrient uptake of plants, which finally results in a low leaf turgor pressure and reduced metabolic activities. Under a water-deficit environment, the membrane stability is known as an important factor to tolerate drought stress, and hence this factor is considered vital during selection of plants to cope with unfavorable conditions [49]. In our results, different drought levels highly affected the membrane stability, leading to water loss from plant tissues, which in turn seriously impaired both membrane structure and function. Our current results are supported by the previous observation of Narayanan [50] and Sayar et al. [51]. Khalvandi et al. [52] have also reported the correlation of electrolyte leakage with drought tolerance.
Increased accumulation of proline is indicative of plant adaptive responses to water stress environments and its increased accumulation is considered beneficial as an osmoticum and desiccation protectant [53,54,55,56]. We observed an increased proline content with an increase in the severity of drought stress. These results are in agreement with the previous studies by Parida et al. [57] and Kaur and Asthir [58].
Changes in photosynthetic pigments may led to an alteration in photosynthetic efficiency, including the capability to harvest light, hence to observe these pigments is essential to determine the plant photosynthetic effectiveness. In the current research, a differential decreasing trend was observed in the chlorophyll content; however, the decrease was mild, which may be due to the increased osmoprotectant and different tolerance levels of the studied wheats. Reports of such slightly altered or mild decreased chlorophyll contents have been reported by Wasaya et al. [59] and Khayatnezhad and Gholamin [60]. Several other researchers have also reported harm to the leaf chlorophyll content in response to drought stress [11,61,62,63,64].
In this study, the effect of drought stress on the expression of genes, which encode LHCI and LHCII related proteins, was observed in four varieties of wheat. The RT–PCR data suggested the differential expression of these genes, but the expression of each gene was affected by the drought stress. Tian et al. [30] observed no significant differences in the expression pattern of Talhca1, Talhca3 and Talhcb1 genes between the wild type and Tasg1a, however Talhcb4, Talhcb6 genes were upregulated and the Talhca2 gene was downregulated in the Tasg1 stay-green mutant. In our study, we found that all the studied genes showing significant differences between the wild type and stress-induced plants confirming that all these genes might be involved in drought stress-related functions. It can be conferred that the introgression of the favorable alleles for stress tolerance has taken place from the diploid wild species Aegilops taushcii, as previously reported [53,65,66].
The stay-green mutants are characterized by an increased stability of chloroplast membranes and chlorophyll–protein complexes [32,67]. Current research mainly focused on the effects of the stay-green trait regarding wheat responses under water stress. The SG trait was noted to have a direct effect on the proline content, membrane stability index, chlorophyll and relative water content, which exhibited high differences among the studied wheat genotypes for the SG ratings. In a previous work, it was observed that the expression level of the genes in the SG genotype was comparatively greater under drought condition [68]. The results are in agreement with the previous findings of Ullah et al. [1], Petrov et al. [55], Hussain et al. [64] and Brestic et al. [69,70]. The results also supported the findings of Zhao et al. [71] regarding gene expression levels under drought stress condition during photosynthesis. The retention of LHCII is thought to play an important role in the formation and maintenance of grana stacks [31]. In this study, the expression levels of the two genes encoding the LHCII proteins, TaLhcb4 and TaLhcb6, were found to be higher in tasg1 compared with the WT, especially at the 48 h time point under drought stress. The results obtained in previous experiments indicated the involvement of abiotic stress responses in connections with further levels of regulation at post-transcriptional and post-translational levels. The overall results regarding the level of genes expression are in general agreement with Oksman-Caldentey and Saito [72] and Reinders and Sickmann [73]. Previously, Tian et al. [68] reported comparatively enhanced chlorophyll b content (52.0 and 72.5%) in the SG genotype under well-watered and drought stress treatment, suggesting its probable contribution to the maintenance of grana stacks. Our findings suggested that further exploration of these genes could lead to the development of phenotypes that resist the drought stress up to significant levels.

4. Conclusions

It is concluded from current research that progressive drought stress had substantial effects on the physiological responses of the studied wheats. Photosynthetic pigments and relative water contents exhibited a declining trend with an increase in the severity of drought stress. It was observed that the overexpression of genes, viz. TaLhca1, TaLhca2, TaLhca3, TaLhcb1, TaLhcb4 and TaLhcb6 that encode for the LHCI and LHCII proteins, was directly proportional to the drought stress. Among the studied genotypes, the wheat SG Chirya-1 and synthetic-derived (SD-28) performed well with a better physiological performance accompanied with a higher level of gene expression under drought stress condition. Hence, these were considered drought-tolerant genotypes with the potential to enrich the genetic background of locally adapted wheat lines against drought stress.

Author Contributions

Z.U. and A.A. designed the research; A.Z. and Z.U. conducted the research; I.A., A.A., D.N.B., U.K.A.-H., A.H.S. and S.M.G. analyzed the data and wrote the manuscript; I.A., Z.A., I.H. and H.S. checked the final content of the manuscript. All authors have read and agreed to the published version of the manuscript.

Institutional Review Board Statement

Not applicable.

Informed Consent Statement

Not applicable.

Data Availability Statement

Not applicable.

Acknowledgments

We would like to acknowledge Princess Nourah bint Abdulrahman University researchers supporting project number (PNURSP2022R155) for their support. The authors highly acknowledge the financial support provided by the Higher Education Commission, Pakistan through the National Research Program for Universities, funded research project No. 20-4363/NRPU/R&D/HEC.

Conflicts of Interest

The authors declare no conflict of interest.

References

  1. Ullah, M.I.; Mahpara, S.; Bibi, R.; Shah, R.U.; Ullah, R.; Abbas, S.; Ullah, M.I.; Hassan, A.M.; El-Shehawi, A.M.; Brestic, M. Grain yield and correlated traits of bread wheat lines: Implications for yield improvement. Saudi J. Biol. Sci. 2021, 28, 5714–5719. [Google Scholar] [CrossRef] [PubMed]
  2. Chen, D.; Neumann, K.; Friedel, S.; Kilian, B.; Chen, M.; Altmann, T.; Klukas, C. Dissecting the phenotypic components of crop plant growth and drought responses based on high-throughput image analysis. Plant Cell 2014, 26, 4636–4655. [Google Scholar] [CrossRef] [PubMed] [Green Version]
  3. Khan, A.; Ali, A.; Ullah, Z.; Ali, I.; Kaushik, P.; Alyemeni, M.N.; Rasheed, A.; Sher, H. Exploiting the drought tolerance of wild Elymus species for bread wheat improvement. Front. Plant Sci. 2022, 13, 982844. [Google Scholar] [CrossRef] [PubMed]
  4. Salam, A.; Ali, A.; Afridi, M.S.; Ali, S.; Ullah, Z. Agrobiodiversity: Effect of drought stress on the eco-physiology and morphology of wheat. In Biodiversity, Conservation and Sustainability in Asia; Springer: Cham, Switzerland, 2022; pp. 597–618. [Google Scholar]
  5. Karatayev, M.; Clarke, M.; Salnikov, V.; Bekseitova, R.; Nizamova, M. Monitoring climate change, drought conditions and wheat production in Eurasia: The case study of Kazakhstan. Heliyon 2022, 8, e08660. [Google Scholar] [CrossRef] [PubMed]
  6. Farooqi, Z.U.R.; Ayub, M.A.; ur Rehman, M.Z.; Sohail, M.I.; Usman, M.; Khalid, H.; Naz, K. Regulation of drought stress in plants. In Plant Life under Changing Environment; Academic Press: Cambridge, MA, USA, 2020; pp. 77–104. [Google Scholar]
  7. Sadiq, M.; Asghar, R.; Qureshi, R.; Ali, A. Study of polypeptides induced by drought stress in some local varieties of barley from Pakistan. Pak. J. Bot. 2013, 45, 1251–1254. [Google Scholar]
  8. Ali, Z.; Ali, B.; Mohammad, A.; Ahmad, M.; Ahmad, I.; Napar, A.A.; Kazi, A.G.; Ali, A.; Shah, S.S.; Mujeeb-Kazi, A. Combating water scarcity for global food security. In Agricultural Systems in the 21st Century; Nova: New York, NY, USA, 2013; pp. 1–30. [Google Scholar]
  9. Ali, A.; Ali, Z.; Quraishi, U.M.; Kazi, A.G.; Malik, R.N.; Sher, H.; Mujeeb-Kazi, A. Integrating physiological and genetic 394 approaches for improving drought tolerance in crops. In Emerging Technologies and Management of Crop Stress Tolerance; Academic Press: Cambridge, MA, USA, 2014; pp. 315–345, 395. [Google Scholar]
  10. Ali, A.; Arshad, M.; Naqvi, S.M.S.; Rasheed, A.; Sher, H.; Kazi, A.G.; Mujeeb-Kazi, A. Comparative assessment of synthetic-derived and conventional bread wheat advanced lines under osmotic stress and implications for molecular analysis. Plant Mol. Biol. Rep. 2015, 33, 1907–1917. [Google Scholar] [CrossRef]
  11. Brestic, M.; Zivcak, M.; Hauptvogel, P.; Misheva, S.; Kocheva, K.; Yang, X.; Li, X.; Allakhverdiev, S.I. Wheat plant selection 422 for high yields entailed improvement of leaf anatomical and biochemical traits including tolerance to non-optimal temperature 423 conditions. Photosynth. Res. 2018, 136, 245–255. [Google Scholar] [CrossRef]
  12. Gaballah, M.M.; Metwally, A.M.; Skalicky, M.; Hassan, M.M.; Brestic, M.; El Sabagh, A.; Fayed, A.M. Genetic diversity 434 of selected rice genotypes under water stress conditions. Plants 2020, 10, 27. [Google Scholar] [CrossRef]
  13. Clarke, D.; Hess, T.M.; Haro-Monteagudo, D.; Semenov, M.A.; Knox, J.W. Assessing future drought risks and wheat yield losses in England. Agric. For. Meteorol. 2021, 297, 108248. [Google Scholar] [CrossRef]
  14. Halford, N.G.; Hey, S.J. Snf1-related protein kinases (SnRKs) act within an intricate network that links metabolic and stress signalling in plants. Biochem. J. 2009, 419, 247–259. [Google Scholar] [CrossRef] [Green Version]
  15. Ali, I.; Salah, K.B.H.; Sher, H.; Ali, H.; Ullah, Z.; Ali, A.; Alam, N.; Shah, S.A.; Iqbal, J.; Ilyas, M.; et al. Drought stress enhances the efficiency of floral dip method of Agrobacterium-mediated transformation in Arabidopsis thaliana. Braz. J. Biol. 2022, 84, 1–5. [Google Scholar] [CrossRef] [PubMed]
  16. Amir, R.; Minhas, N.M.; Farrakh, A.G.; Farrakh, S.; Ali, A.; Bux, H.; Kazi, M. Phenotypic and genotypic characterization of wheat landraces of Pakistan. Emir. J. Food Agric. 2014, 26, 157–163. [Google Scholar] [CrossRef] [Green Version]
  17. Ali, I.; Khan, A.; Ali, A.; Ullah, Z.; Dai, D.Q.; Khan, N.; Khan, A.; Al-Tawaha, A.R.; Sher, H. Iron and Zinc micronutrients and soil inoculation of Trichoderma harzianum enhance wheat grain quality and yield. Front. Plant Sci. 2022, 13, 960948. [Google Scholar] [CrossRef]
  18. Afzal, F.; Ali, A.; Ullah, Z.; Sher, H.; Gul, A.; Mujeeb-Kazi, A.; Arshad, M. Terminal drought stress adaptability in synthetic derived bread wheat is explained by alleles of major adaptability genes and superior phenology. Int. J. Agric. Biol. 2018, 20, 1623–1631. [Google Scholar]
  19. Afzal, F.; Li, H.; Gul, A.; Subhani, A.; Ali, A.; Mujeeb-Kazi, A.; Ogbonnaya, F.; Trethowan, R.; Xia, X.; He, Z.; et al. Genome-wide analyses reveal footprints of divergent selection and drought adaptive traits in synthetic-derived wheats. G3 Genes Genomes Genet. 2019, 9, 1957–1973. [Google Scholar] [CrossRef] [PubMed] [Green Version]
  20. Amanuel, M.; Gebre, D.; Debele, T. Performance of bread wheat genotypes under different environment in lowland irrigated areas of Afar Region, Ethiopia. Afr. J. Agric. Res. 2018, 13, 927–933. [Google Scholar]
  21. Nehe, A.; Akin, B.; Sanal, T.; Evlice, A.K.; Unsal, R.; Dinçer, N.; Demir, L.; Geren, H.; Sevim, I.; Orhan, Ş. Genotype x environment interaction and genetic gain for grain yield and grain quality traits in Turkish spring wheat released between 1964 and 2010. PLoS ONE 2019, 14, e0219432. [Google Scholar] [CrossRef] [Green Version]
  22. Spano, G.; Di Fonzo, N.; Perrotta, C.; Platani, C.; Ronga, G.; Lawlor, D.W.; Napier, J.A.; Shewry, P.R. Physiological characterization of ‘stay green’mutants in durum wheat. J. Exp. Bot. 2003, 54, 1415–1420. [Google Scholar] [CrossRef] [Green Version]
  23. Thomas, H.; Howarth, C.J. Five ways to stay green. J. Exp. Bot. 2000, 51, 329–337. [Google Scholar] [CrossRef] [Green Version]
  24. Foulkes, M.J.; Snape, J.W.; Shearman, V.J.; Reynolds, M.P.; Gaju, O.; Sylvester-Bradley, R. Genetic progress in yield potential in wheat: Recent advances and future prospects. J. Agric. Sci. 2007, 145, 17. [Google Scholar] [CrossRef]
  25. Billah, M.; Aktar, S.; Brestic, M.; Zivcak, M.; Khaldun, A.B.M.; Uddin, M.; Bagum, S.A.; Yang, X.; Skalicky, M.; Mehari, T.G.; et al. Progressive genomic approaches to explore drought-and salt-induced oxidative stress responses in plants under changing climate. Plants 2021, 10, 1910. [Google Scholar] [CrossRef] [PubMed]
  26. Kumar, R.; Harikrishna; Barman, D.; Ghimire, O.P.; Gurumurthy, S.; Chinnusamy, V.; Singh, P.K.; Padaria, J.C.; Arora, A. tay-green trait serves as yield stability attribute under combined heat and drought stress in wheat (Triticum aestivum L.). Plant Growth Regul. 2022, 96, 67–78. [Google Scholar] [CrossRef]
  27. Allen, J.F.; Forsberg, J. Molecular recognition in thylakoid structure and function. Trends Plant Sci. 2001, 6, 317–326. [Google Scholar] [CrossRef] [PubMed]
  28. Bagherikia, S.; Pahlevani, M.; Yamchi, A.; Zaynalinezhad, K.; Mostafaie, A. Transcript profiling of genes encoding fructan and sucrose metabolism in wheat under terminal drought tress. J. Plant Growth Regul. 2019, 38, 148–163. [Google Scholar] [CrossRef]
  29. Grieco, M.; Roustan, V.; Dermendjiev, G.; Rantala, S.; Jain, A.; Leonardelli, M.; Neumann, K.; Berger, V.; Engelmeier, D.; Bachmann, G.; et al. Adjustment of photosynthetic activity to drought and fluctuating light in wheat. Plant Cell Environ. 2020, 43, 1484–1500. [Google Scholar] [CrossRef] [Green Version]
  30. Tian, F.; Gong, J.; Zhang, J.; Zhang, M.; Wang, G.; Li, A.; Wang, W. Enhanced stability of thylakoid membrane proteins and antioxidant competence contribute to drought stress resistance in the tasg1 wheat stay-green mutant. J. Exp. Bot. 2013, 64, 1509–1520. [Google Scholar] [CrossRef] [Green Version]
  31. Standfuss, J.; Terwisscha van Scheltinga, A.C.; Lamborghini, M.; Kühlbrandt, W. Mechanisms of photoprotection and nonphotochemical quenching in pea light-harvesting complex at 2.5 Å resolution. EMBO J. 2005, 24, 919–928. [Google Scholar] [CrossRef] [Green Version]
  32. Sato, Y.; Morita, R.; Nishimura, M.; Yamaguchi, H.; Kusaba, M. Mendel’s green cotyledon gene encodes a positive regulator of the chlorophyll-degrading pathway. Proc. Natl. Acad. Sci. USA 2007, 104, 14169–14174. [Google Scholar] [CrossRef] [Green Version]
  33. Cackett, L.; Luginbuehl, L.H.; Schreier, T.B.; Lopez-Juez, E.; Hibberd, J.M. Chloroplast development in green plant tissues: The interplay between light, hormone, and transcriptional regulation. New Phytol. 2022, 233, 2000–2016. [Google Scholar] [CrossRef]
  34. Jiang, X.J.; Chen, C.; Zhu, X.; Zakari, S.; Singh, A.K.; Zhang, W.; Zeng, H.; Yuan, Z.Q.; He, C.; Yu, S.; et al. Use of dye infiltration experiments and HYDRUS-3D to interpret preferential flow in soil in a rubber-based agroforestry systems in Xishuangbanna, China. Catena 2019, 178, 120–131. [Google Scholar] [CrossRef]
  35. Zhang, Y.; Wang, L.; Jiang, J.; Zhang, J.; Zhang, Z.; Zhang, M. Application of soil quality index to determine the effects of different vegetation types on soil quality in the Yellow River Delta wetland. Ecol. Indic. 2022, 141, 109116. [Google Scholar] [CrossRef]
  36. Barrs, H.; Weatherley, P. A re-examination of the relative turgidity technique for estimating water deficits in leaves. Aust. J. Biol. Sci. 1962, 15, 413–428. [Google Scholar] [CrossRef] [Green Version]
  37. Arnon, D.I. Copper enzymes in isolated chloroplasts. Polyphenoloxidase in beta vulgaris. Plant Physiol. 1949, 24, 1–15. [Google Scholar] [CrossRef] [PubMed]
  38. Sairam, R. Effects of homobrassinolide application on plant metabolism and grain yield under irrigated and moisture-stress conditions of two wheat varieties. Plant Growth Regul. 1994, 14, 173–181. [Google Scholar] [CrossRef]
  39. Bates, L.S.; Waldren, R.P.; Teare, I. Rapid determination of free proline for water-stress studies. Plant Soil 1973, 39, 205–207. [Google Scholar] [CrossRef]
  40. Xu, W.; Rosenow. D.T.; Nguyen, H.T. Stay green trait in grain sorghum: Relationship between visual rating and leaf chlorophyll concentration. Plant Breed 2000, 119, 365–367. [Google Scholar] [CrossRef]
  41. Silva, S.A.; Carvallo, F.I.F.; Caetano, V.R.; Oliveira, A.C.; Coimbra, J.L.M.; Vasconcellos, N.J.S.; Lorencetti, C. Genetic basis of stay green trait. J. New Seeds 2000, 2, 55–68. [Google Scholar] [CrossRef]
  42. Kianersi, F.; Azarm, D.A.; Fatemi, F.; Pour-Aboughadareh, A.; Poczai, P. Methyl jasmonate induces genes involved in linalool accumulation and increases the content of phenolics in two Iranian coriander (Coriandrum sativum L.) Ecotypes. Genes 2022, 13, 1717. [Google Scholar] [CrossRef]
  43. Livak, K.J.; Schmittgen, T.D. Analysis of relative gene expression data using real-time quantitative PCR and the 2−ΔΔct method. Methods 2001, 25, 402–408. [Google Scholar] [CrossRef]
  44. Kianersi, F.; Abdollahi, M.R.; Mirzaie-asl, A.; Dastan, D.; Rasheed, F. Identification and tissue-specific expression of rutin biosynthetic pathway genes in Capparis spinosa elicited with salicylic acid and methyl jasmonate. Sci. Rep. 2020, 10, 8884. [Google Scholar] [CrossRef]
  45. Siddique, K.; Regan, K.; Tennant, D.; Thomson, B. Water use and water use efficiency of cool season grain legumes in low rainfall Mediterranean-type environments. Eur. J. Agron. 2001, 15, 267–280. [Google Scholar] [CrossRef]
  46. Heinen, R.B.; Ye, Q.; Chaumont, F. Role of aquaporins in leaf physiology. J. Exp. Bot. 2009, 60, 2971–2985. [Google Scholar] [CrossRef] [PubMed] [Green Version]
  47. Almeselmani, M.; Abdullah, F.; Hareri, F.; Naaesan, M.; Ammar, M.A.; ZuherKanbar, O. Effect of drought on different physiological characters and yield component in different varieties of Syrian durum wheat. J. Agric. Sci. 2011, 3, 127. [Google Scholar] [CrossRef] [Green Version]
  48. Kocheva, K.V.; Petrov, P.I.; Georgiev, G.I. Physiological and anatomical responses of wheat to induced dehydration and rehydration. Central Eur. J. Biol. 2013, 8, 499–503. [Google Scholar] [CrossRef] [Green Version]
  49. ElBasyoni, I.; Saadalla, M.; Baenziger, S.; Bockelman, H.; Morsy, S. Cell membrane stability and association mapping for drought and heat tolerance in a worldwide wheat collection. Sustainability 2017, 9, 1606. [Google Scholar] [CrossRef] [Green Version]
  50. Narayanan, S. Membrane fluidity and compositional changes in response to high temperature stress in wheat. In Physiological, Molecular, and Genetic Perspectives of Wheat Improvement; Springer: Berlin/Heidelberg, Germany, 2021; pp. 115–123. [Google Scholar]
  51. Sayar, R.; Khemira, H.; Kameli, A.; Mosbahi, M. Physiological tests as predictive appreciation for drought tolerance in durum wheat (Triticum durum Desf.). Agronomy Res. 2008, 6, 79–90. [Google Scholar]
  52. Khalvandi, M.; Siosemardeh, A.; Roohi, E.; Keramati, S. Salicylic acid alleviated the effect of drought stress on photosynthetic characteristics and leaf protein pattern in winter wheat. Heliyon 2021, 7, e05908. [Google Scholar] [CrossRef]
  53. Ali, A.; Arshad, M.; Naqvi, S.M.; Ahmad, M.; Sher, H.; Fatima, S.; Kazi, A.G.; Rasheed, A.; Mujeeb-Kazi, A. Exploitation of synthetic-derived wheats through osmotic stress responses for drought tolerance improvement. Acta Physiol. Plant. 2014, 36, 2453–2465. [Google Scholar] [CrossRef]
  54. Chun, S.C.; Paramasivan, M.; Chandrasekaran, M. Proline accumulation influenced by osmotic stress in arbuscular mycorrhizal symbiotic plants. Front. Microbiol. 2018, 9, 2525. [Google Scholar] [CrossRef] [Green Version]
  55. Petrov, P.; Petrova, A.; Dimitrov, I.; Tashev, T.; Olsovska, K.; Brestic, M.; Misheva, S. Relationships between leaf morpho-anatomy, water status and cell membrane stability in leaves of wheat seedlings subjected to severe soil drought. J. Agron. Crop Sci. 2018, 204, 219–227. [Google Scholar] [CrossRef]
  56. Haq, I.; Binjawhar, D.N.; Ullah, Z.; Ali, A.; Sher, H.; Ali, I. Wild vicia species possess a drought tolerance system for faba bean improvement. Genes 2022, 13, 1877. [Google Scholar] [CrossRef] [PubMed]
  57. Parida, A.K.; Dagaonkar, V.S.; Phalak, M.S.; Umalkar, G.; Aurangabadkar, L.P. Alterations in photosynthetic pigments, protein and osmotic components in cotton genotypes subjected to short-term drought stress followed by recovery. Plant Biotechnol. Rep. 2007, 1, 37–48. [Google Scholar] [CrossRef]
  58. Kaur, G.; Asthir, B. Impact of exogenously applied ABA on proline metabolism conferring drought and salinity stress tolerance in wheat genotypes. Cereal Res. Commun. 2020, 48, 309–315. [Google Scholar] [CrossRef]
  59. Wasaya, A.; Manzoor, S.; Yasir, T.A.; Sarwar, N.; Mubeen, K.; Ismail, I.A.; Raza, A.; Rehman, A.; Hossain, A.; EL Sabagh, A. Evaluation of fourteen bread wheat (Triticum aestivum L.) genotypes by observing gas exchange parameters, relative water and chlorophyll content, and yield attributes under drought stress. Sustainability 2021, 13, 4799. [Google Scholar] [CrossRef]
  60. Khayatnezhad, M.; Gholamin, R. The effect of drought stress on the superoxide dismutase and Chlorophyll content in durum wheat genotypes. Adv. Life Sci. 2021, 8, 119–123. [Google Scholar]
  61. Arjenaki, F.G.; Jabbari, R.; Morshedi, A. Evaluation of drought stress on relative water content, chlorophyll content and mineral elements of wheat (Triticum aestivum L.) varieties. Int. J. Agric. Crop Sci. 2012, 4, 726–729. [Google Scholar]
  62. Kumar, S.; Sairam, R.; Prabhu, K. Physiological traits for high temperature stress tolerance in Brassica juncea. Indian J. Plant Physiol. 2013, 18, 89–93. [Google Scholar] [CrossRef]
  63. Saeidi, M.; Ardalani, S.; Jalali-Honarmand, S.; Ghobadi, M.E.; Abdoli, M. Evaluation of drought stress at vegetative growth stage on the grain yield formation and some physiological traits as well as fluorescence parameters of different bread wheat cultivars. Acta Biol. Szeged. 2015, 59, 35–44. [Google Scholar]
  64. Hussain, S.; Ulhassan, Z.; Brestic, M.; Zivcak, M.; Zhou, W.; Allakhverdiev, S.I.; Yang, X.; Safdar, M.E.; Yang, W.; Liu, W. Photosynthesis research under climate change. Photosynth. Res. 2021, 150, 5–19. [Google Scholar] [CrossRef]
  65. Ali, I.; Sardar, Z.; Rasheed, A.; Mahmood, T. Molecular characterization of the puroindoline-a and b alleles in synthetic hexaploid wheats and in silico functional and structural insights into Pina-D1. J. Theor. Biol. 2015, 376, 1–7. [Google Scholar] [CrossRef]
  66. Gul, A.; Rasheed, A.; Afzal, F.; Napar, A.A.; Ali, A.; Jamil, M.; Khalid, M.; Bux, H.; Mujeeb-Kazi, A. Characterization of synthetic hexaploids derived from same Aegilops tauschii accessions and different durum cultivars. Cytologia 2015, 80, 427–440. [Google Scholar] [CrossRef] [Green Version]
  67. Kusaba, M.; Tanaka, A.; Tanaka, R. Stay-green plants: What do they tell us about the molecular mechanism of leaf senescence. Photosynth. Res. 2013, 117, 221–234. [Google Scholar] [CrossRef] [PubMed]
  68. Tian, F.; Gong, J.; Wang, G.; Wang, G.; Fan, Z.; Wang, W. Improved drought resistance in a wheat stay-green mutant tasg1 under field conditions. Biol. Plant. 2012, 56, 509–515. [Google Scholar] [CrossRef]
  69. Brestic, M.; Zivcak, M.; Kalaji, H.M.; Carpentier, R.; Allakhverdiev, S.I. Photosystem II thermostability in situ: Environmentally induced acclimation and genotype-specific reactions in Triticum aestivum L. Plant Physiol. Biochem. 2012, 57, 93–105. [Google Scholar] [CrossRef]
  70. Brestic, M.; Yang, X.; Li, X.; Allakhverdiev, S.I. Crop photosynthesis for the 21st century. Photosynth. Res. 2021, 150, 1–3. [Google Scholar] [CrossRef]
  71. Zhao, X.X.; Liang, C.; Fang, Y.; Wang, Y.Q.; Wang, W. Effect of glycinebetaine on function of thylakoid membranes in wheat flag leaves under drought stress. Biol. Plant. 2007, 51, 584–588. [Google Scholar] [CrossRef]
  72. Oksman-Caldentey, K.M.; Saito, K. Integrating genomics and metabolomics for engineering plant metabolic pathways. Curr. Opi. Biotechnol. 2005, 16, 174–179. [Google Scholar] [CrossRef]
  73. Reinders, J.; Sickmann, A. Modificomics: Posttranslational modifications beyond protein phosphorylation and glycosylation. Biomol. Eng. 2007, 24, 169–177. [Google Scholar] [CrossRef]
Figure 1. Expression of (a) LHCI genes under different drought levels in SD−28, (b) LHCII genes under different drought levels in SD−28, (c) LHCI genes under different drought levels in SD−32, (d) LHCII genes under different drought levels in SD−32.
Genes 13 02261 g001
Figure 2. Expression of (a) LHCI genes under different drought levels in Opata, (b) LHCII genes under different drought levels in Opata, (c) LHCI genes under different drought levels in Chirya−1, (d) LHCII genes under different drought levels in Chirya−1.
Genes 13 02261 g002
Table 1. Descriptive statistics of the studied physiological attributes under different field capacities.
VariablesMeanSDVarianceSE MeanC. V.MinimumMaximum
Membrane Stability Index (%)
100% FC55.233.5512.621.036.4349.3759.38
80% FC60.691.983.910.573.2657.2162.83
60% FC54.115.0125.121.459.2643.9462.26
Proline Content (µmol/g)
100% FC0.830.097.950.0310.770.640.93
80% FC1.430.240.060.0716.871.011.68
60% FC2.510.470.220.1418.811.713.19
Relative Water Content (%)
100% FC94.582.516.280.722.6591.2598.32
80% FC81.892.375.690.692.9177.6386.61
60% FC73.662.878.240.833.8870.3479.34
Chlorophyll a (mg/g)
100% FC1.190.041.520.013.281.121.26
80% FC1.040.041.910.014.190.991.14
60% FC0.540.041.380.016.850.470.59
Chlorophyll b (mg/g)
100% FC1.110.170.030.0515.720.851.34
80% FC0.930.160.020.0416.790.721.18
60% FC0.560.041.240.016.290.520.62
Total Chlorophyll (mg/g)
100% FC2.290.180.030.0527.842.042.57
80% FC1.970.140.020.0410.041.792.20
60% FC1.100.052.850.0154.850.991.20
Table 2. Analysis of variance (ANOVA) results for the studied physiological traits under control and water stress condition.
SOVDFMSIProlineRWCChla ChlbTotal Chl
Treatments2148.9 ***8.692 ***1333 ***1.371 ***0.938 ***4.563 ***
Wheats321.82 NS0.244 ***7.35 NS0.004 **0.120 ***0.106 ***
Treatments * Wheats620.07 NS0.323 ***7.38 NS0.004 ***0.033 ***0.031 ***
Error2211.9800.0227.3800.0010.0020.031
where, ** and *** depict statistical significance at 0.01 and 0.001 probability level, respectively; * is used for interaction; SOV, source of variation; NS, non-significant; MSI, membrane stability index; RWC, relative water content; Chla, chlorophyll a; Chlb, chlorophyll b; TChl, total chlorophyll.
Table 3. Least significant differences of the studied physiological traits under control and water stress condition. Different letters indicate significant statistical differences according to Fisher’s LSD test at 0.05 probability level.
TreatmentWheatMSIProlineRWCChlaChlbTChl
100% FCSD-2858.176 ab0.872 h93.701 a1.200 ab0.914 cd2.115 b
100% FCSD-3250.679 c0.864 h96.477 a1.168 bc0.985 c2.153 b
100% FCOpata 53.637 bc0.857 h93.010 a1.144 c1.285 a2.431 a
100% FCChirya-158.415 ab0.719 h95.131 a1.230 a1.247 a2.477 a
80% FCSD-2862.685 a1.148 g82.303 b1.017 e0.850 de1.869 c
80% FCSD-3262.047 a1.556 ef80.193 bc1.099 d0.777 e1.876 c
80% FCOpata 59.268 ab1.358 fg82.175 b1.034 e0.917 cd1.952 c
80% FCChirya-158.764 ab1.667 e82.876 b1.014 e1.159 b2.173 b
60% FCSD-2855.966 bc2.272 c73.396 de0.576 f0.562 f1.115 d
60% FCSD-3253.740 bc1.971 d71.46 e0.547 f0.542 f1.090 d
60% FCOpata 54.707 bc3.091 a73.659 de0.492 g0.562 f1.055 d
60% FCChirya-152.009 c2.698 b76.111 cd0.550 f0.592 f1.143 d
For trait code, see Table 2.
Publisher’s Note: MDPI stays neutral with regard to jurisdictional claims in published maps and institutional affiliations.

